
In today's data-driven business landscape, CEOs are constantly looking to keep control of their businesses, and one of the powerful tools in doing so is a CEO dashboard. A carefully crafted CEO dashboard allows top executives to gather and analyze key metrics that can drive their decision-making processes.
devtodev is a robust analytics platform that aids in this endeavor by providing a wide number of analytic tools crucial for monitoring the company's performance. It can be effectively and efficiently utilized by individuals in various roles within the company, including the CEO.
In this article, we are going to present to you several metrics that can make a very good CEO dashboard composed only of essential metrics available in devtodev.
Read more: Power App & Game Metrics for Captivating Potential Investors
Why Build a CEO Dashboard Anyway?
Building a CEO dashboard is essential for several reasons:
-
Accessibility of important data. Traditionally, data analysis was limited to a select few individuals within an organization, often requiring extensive manual effort to compile and analyze data sets. By utilizing a CEO dashboard, key metrics are easily accessible to all decision-makers including executives, department heads, and CEOs themselves.
-
Improved decision-making. By consolidating and visualizing relevant data points, CEOs gain a comprehensive understanding of the company's financial performance and user behavior. Armed with this information, CEOs can make data-driven decisions that are aligned with the organization's strategic goals.
-
Early issue detection. With a CEO dashboard, potential issues and challenges can be identified early on. By monitoring key metrics, CEOs can spot anomalies, deviations, or unfavorable trends promptly. This allows them to take proactive measures and make timely interventions to mitigate risks and address emerging problems before they escalate.
Read more: devtodev’s Map of Key Analytics Metrics in Games
Essential Metrics for Creating a Good Dashboard for a CEO
First and foremost, open devtodev’s Real-time dashboard (Smart view -> Real time) and see if this functionality is sufficient for you.
If not, build an effective custom CEO dashboard tailored to your needs. It is essential to include the right metrics that align with the organization's goals and business model. Here are some devtodev metrics that should be considered for a comprehensive CEO dashboard:
1. Revenue Growth and Profitability Metrics
At the core of any business is the drive to generate revenue and maintain profitability. In devtodev, CEOs can monitor metrics such as total revenue and gross profit margin. They can choose one or several of them and add it to their dashboard.
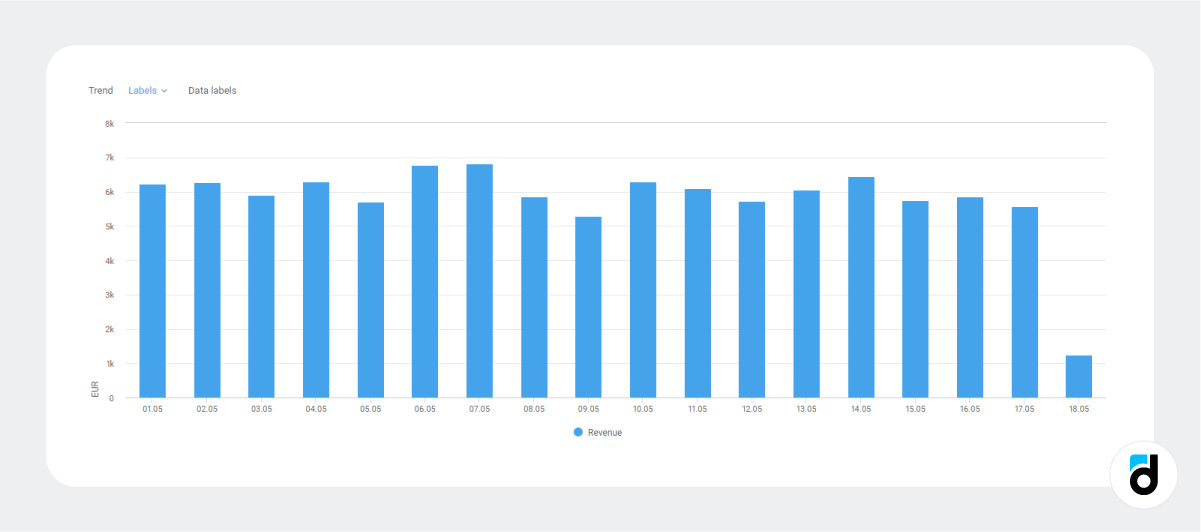
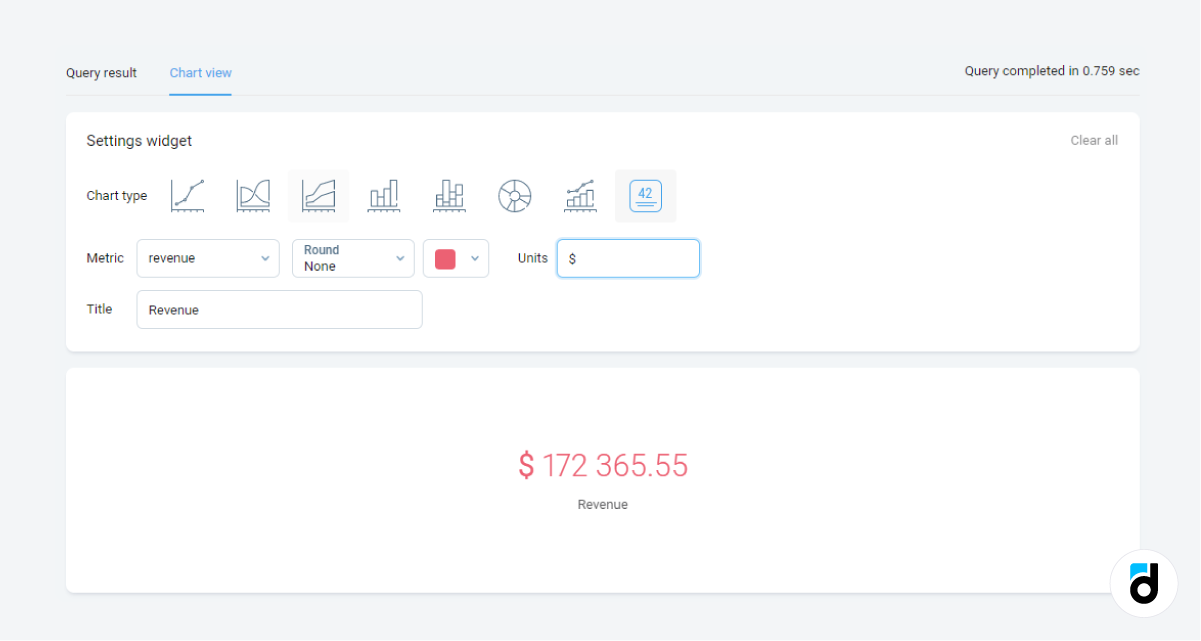
Revenue
Reports -> Basic metrics -> Add the Revenue metric
or
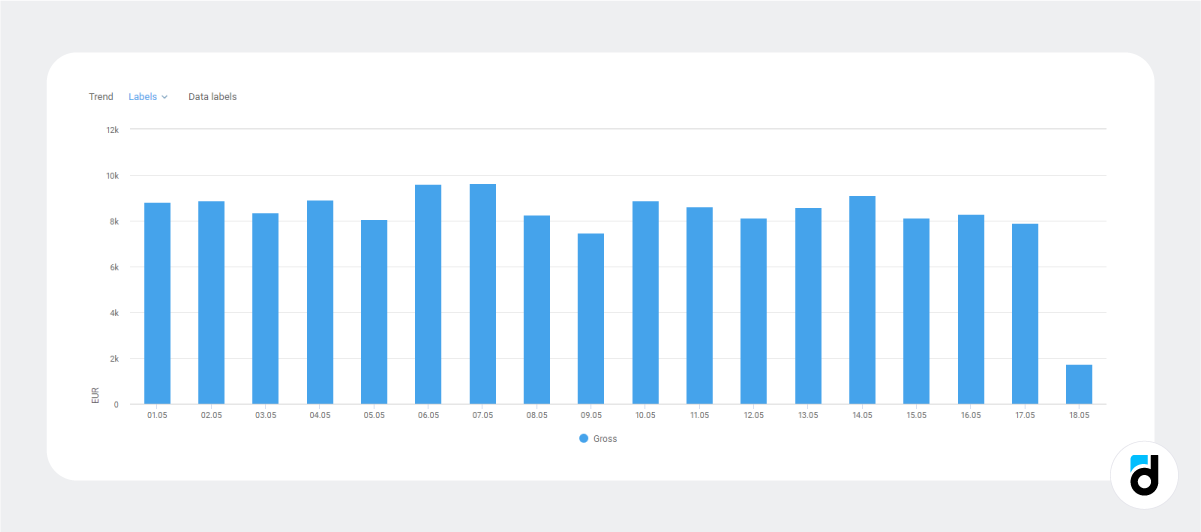
Gross profit
Reports -> Basic metrics -> Add the Gross metric
Read devtodev's free ebook on monetization metrics
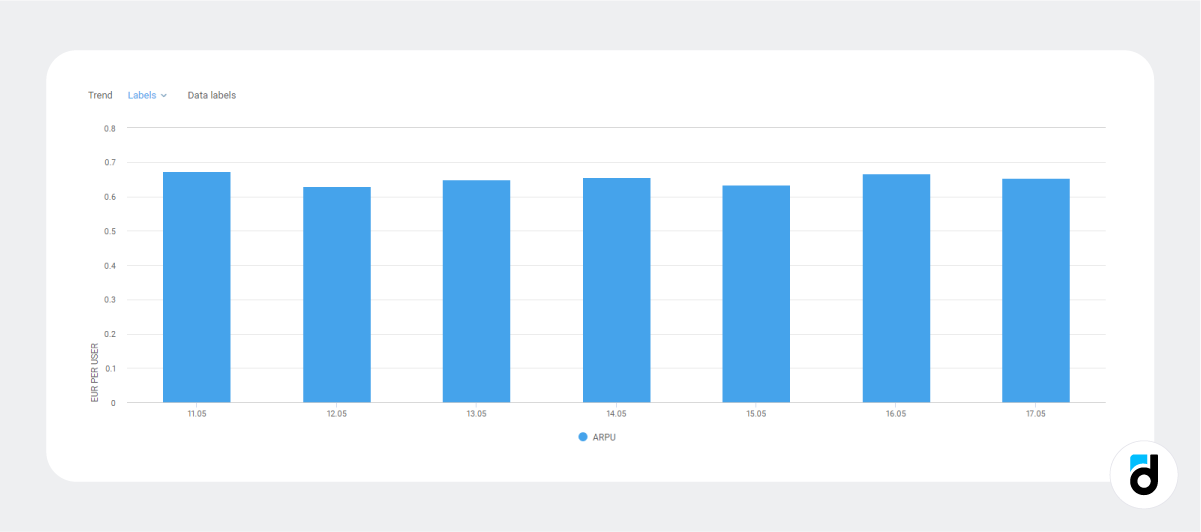
ARPU
Reports -> Basic metrics -> Add the ARPU metric
The ARPU metric is crucial as it provides valuable insights into the average revenue generated per user, helping businesses understand their customer value and profitability.
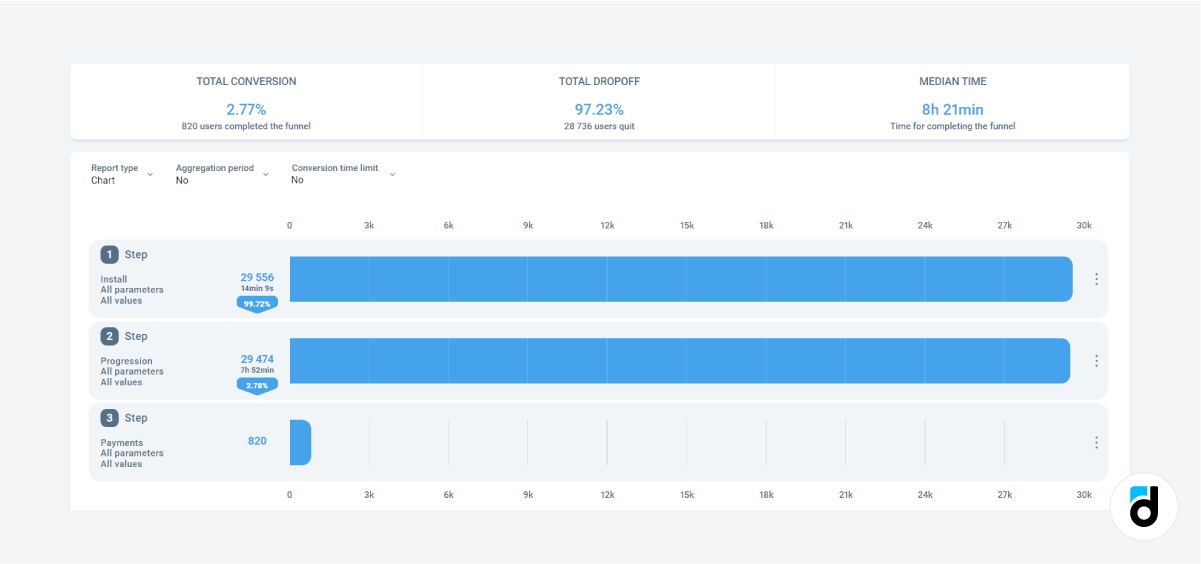
Conversion to Payment or In-app Purchase
Reports -> Conversion funnel
Conversion to payment and in-app purchases are vital metrics that measure the ability of a game or an app to successfully convert users into paying customers.
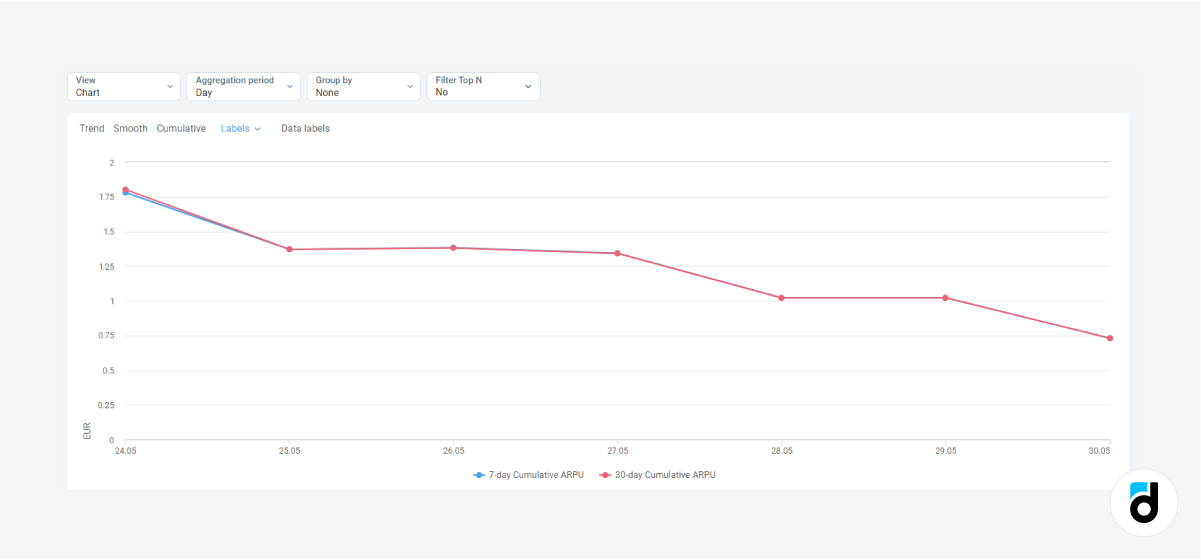
Cumulative ARPU
Reports -> Basic metrics -> Add the cumulative ARPU metric
The Cumulative ARPU metric gives valuable insights into the long-term value and profitability of a game’s or app’s customer base.
Top purchases and ROI
Top purchases highlight the most valuable purchases made by customers. Return on investment provides key information to optimize an investment (marketing) strategy.
Use SQL to add a renewable table with top purchases during a specific period that will keep you informed about the most sought-after items.
ROI values can also be displayed on your dashboard using SQL.
Proficient SQL users can display unique metrics such as the highest converting items, categorized by levels and installation dates.
2. Customer Acquisition and Retention Metrics
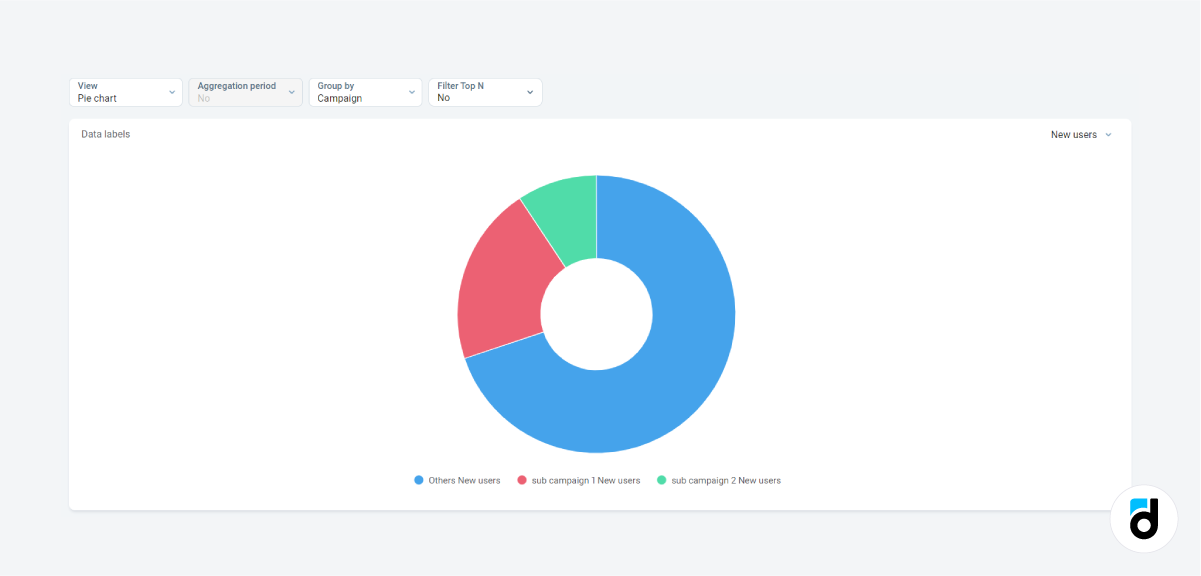
New users
Reports -> Basic metrics -> Add the New users metric
The New users metric tracks the number of people who have recently joined your product, providing insights into user acquisition and growth.
Or
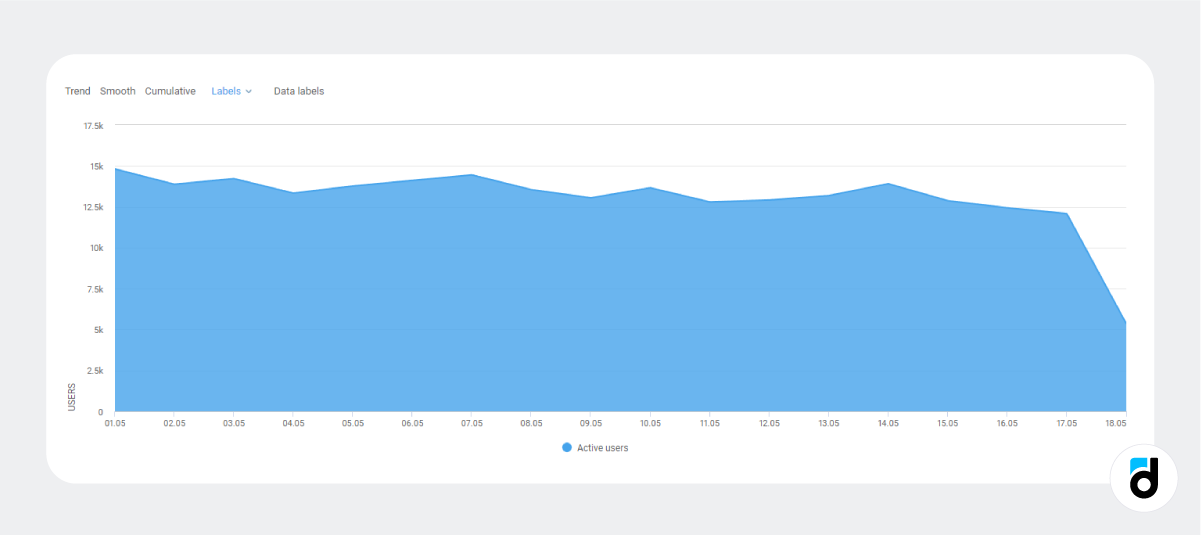
Active users
Reports -> Basic metrics -> Add the Active users metric
The Active users metric measures the number of users who engage with your app or game, indicating the level of ongoing user participation and usage.
Read devtodev's free ebook on acquisition metrics
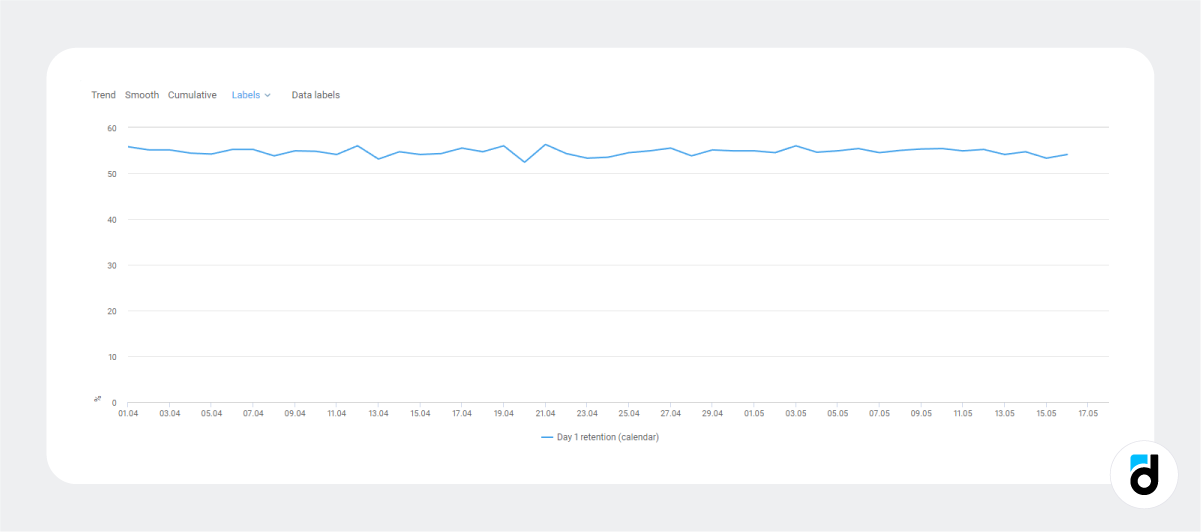
Retention day 1 over a period
Reports -> Basic metrics -> Add a retention metric of your choice (d1, d7, d28, calendar, hourly)
The Retention metric assesses the ability of a game or an app to retain users, offering insights into user loyalty and satisfaction.
Churned users
You can’t add these data to the dashboard using out-of-the-box reports. However, you can ask your analyst to create a report using SQL and then add it.
Other custom metrics
devtodev is a highly adaptive platform that enables you to analyze virtually any data even if the data can’t be retrieved through a standard report.
For example, if you have a game and you want to monitor the number of attempts users make before reaching a specific goal (e.g. pass a level), you can use SQL.
3. Metrics Replacement in the Subscription Monetization Model
If you use a subscription monetization model you will need to do some adjustments:
-
Replace Revenue with Subscription revenue
-
Replace Active users with the Number of subscriptions and add the Number of new subscribers.
-
Replace Churned users with Churned subscribers (you don’t need SQL for that).
Read more: How to Analyze App and Game Subscriptions
4. Metrics Replacement in the Ad Monetization Model
In case you use an ad monetization model:
-
Replace Revenue with Ad revenue
-
Add the percentage of users who saw an ad to evaluate the reach and engagement with advertisements.
-
Add ad eCPM to keep your ad spend in check.
Read more: Analyze 3 Revenue Sources - Ads, In-apps and Subscriptions
Most of the above mentioned metrics can be presented as a chart (area, pie, bar), or a table.
Also, you can add several 1x1 widgets that display them as a single number. To add the widget, you need to turn to SQL again.
CEO dashboard is a powerful tool for accessing important data, monitoring performance, and driving growth and profitability in games and apps. If you doubt about building it, devtodev’s customer success specialists are always ready to help.