
Enhance your analytics with the comprehensive 'Retention by Event' report, enabling you to determine the retention rate of users who have engaged in specific actions, such as opening your shop or watching an ad. This report empowers you to compare the retention rates of these users with those of the general user base or individuals who have performed different events.
Would you like to unravel the key actions that transform ordinary users into loyal advocates? Or perhaps you seek insights into the factors that cause users to disengage from your app or game? With devtodev, you can uncover both the strengths and weaknesses of your product.
Meet the ‘Retention by event’ report (‘Smart View -> ‘Engagement’) that presents the percentage of users who performed specific actions and returned to your app on a given day.
Read more: Retention rate
Some Real-Life Examples of Using the report
Typically, you would employ this report to determine the retention rate of users who have performed a particular event, such as 'shop_open' or 'ad_impression.' In these scenarios, you can assess how effectively you retain users who have opened your shop or viewed ads. Moreover, you can choose any event of your choice.
Read more: Retention is Dropping - What to Do?
Additionally, this report enables you to compare the retention rates of users who have performed two different events, such as:
- Participants in a live event versus the entire audience.
- Players who invited one friend versus those who invited two or more friends.
- Users who added an item to the cart versus those who added it to their favorites.
- Individuals who made an in-app purchase versus those who simply opened the shop:
How do you Use the Report to Get more Data on your Users?
The report has two tabs: Retention by day from install and Retention by date.
1. ‘Retention by day from install’ tab
If you want to see a median (or average) retention rate of users who installed your app or game during the ‘Install date’ period, set the groups as we described above, then select a time period and click ‘Refresh’.
If you need clarification on the data, refer to the table below and click the plus sign next to each group. This reveals the retention rates of daily cohorts over a 28-day period. You can apply conditional formatting to manage large tables (accessed through the menu in the top-right corner).
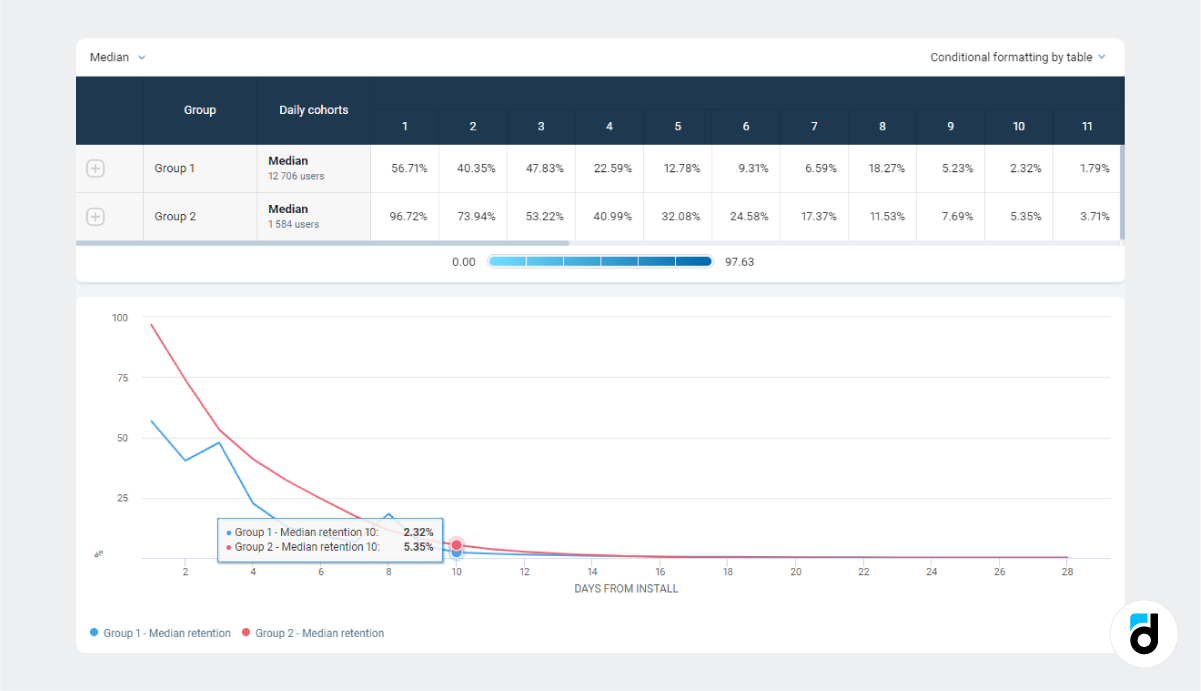
Make sure not to overlook the ‘Calculated by’ drop-down menu, which allows you to modify how the retention rate is calculated, either by calendar days or 24-hour intervals. Keep in mind that these options will yield slightly different results.
You can apply standard devtodev filters to the data in both tabs. Simply click on the funnel icon located at the top right corner of each section and choose specific channels, countries, devices, and more. Additionally, if you want to analyze a particular segment that you've already defined, you can find it there.
Read more: Rolling Retention - Why is it Important?
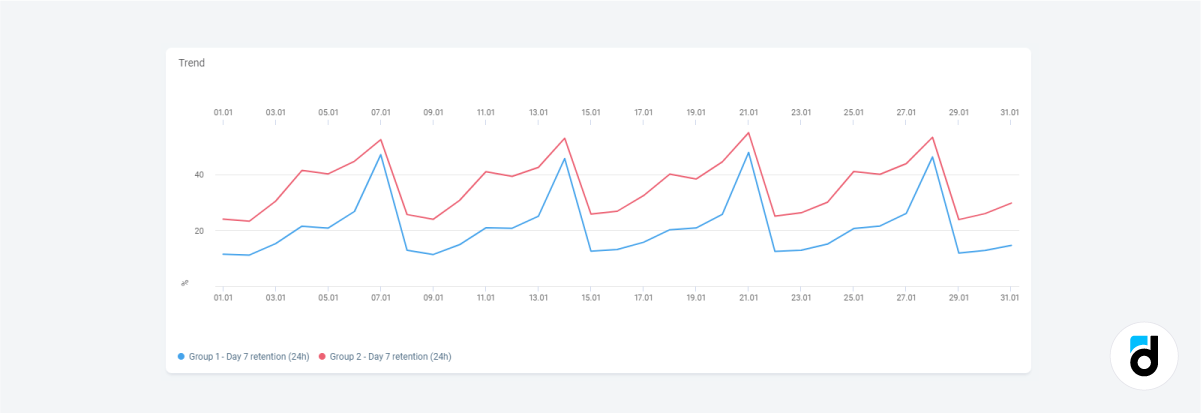
2. ‘Retention by date’ tab
Start by selecting a preset metric or use the ‘Edit’ menu at the top right cornerto customize the type of retention rate you desire, ranging from day 1 to day 180.
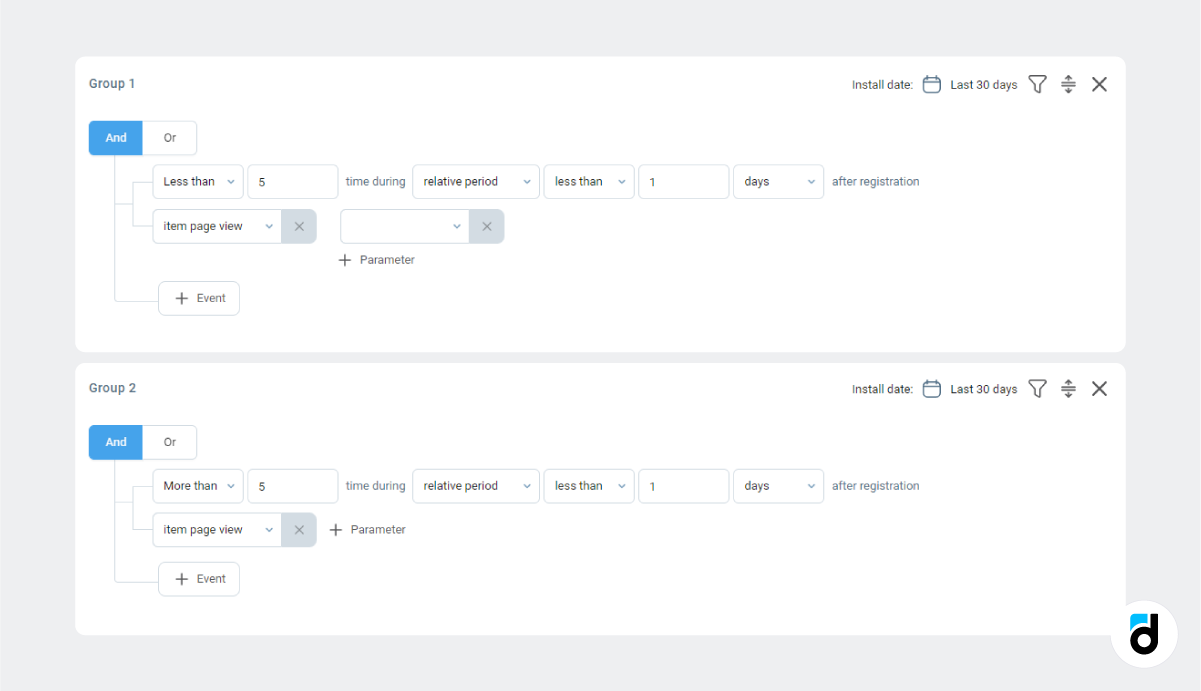
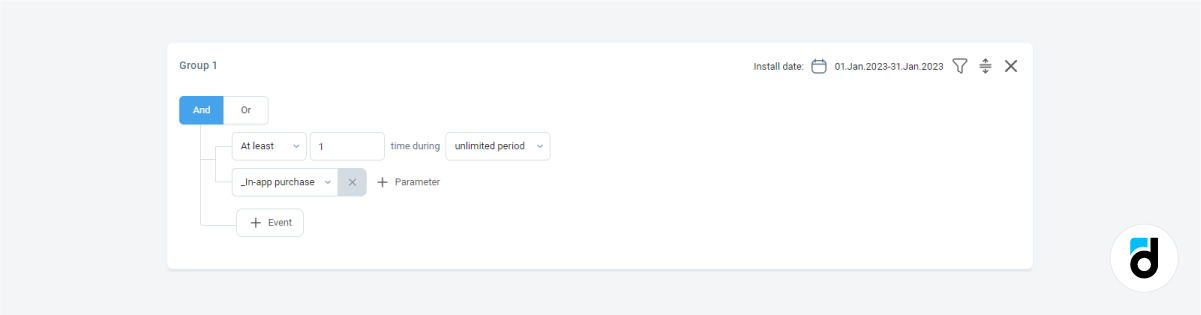
Specify the group you want to analyze. This step can be a bit challenging, as it requires a clear understanding of your objectives. First, select the event, and then indicate the number of times the user must perform that event.
The basic settings resemble the following:
However, if you need more specific data, you can narrow down the results. For example, you may want to view the D14 retention rate for users who performed the event after January 12 and paid less than $10:
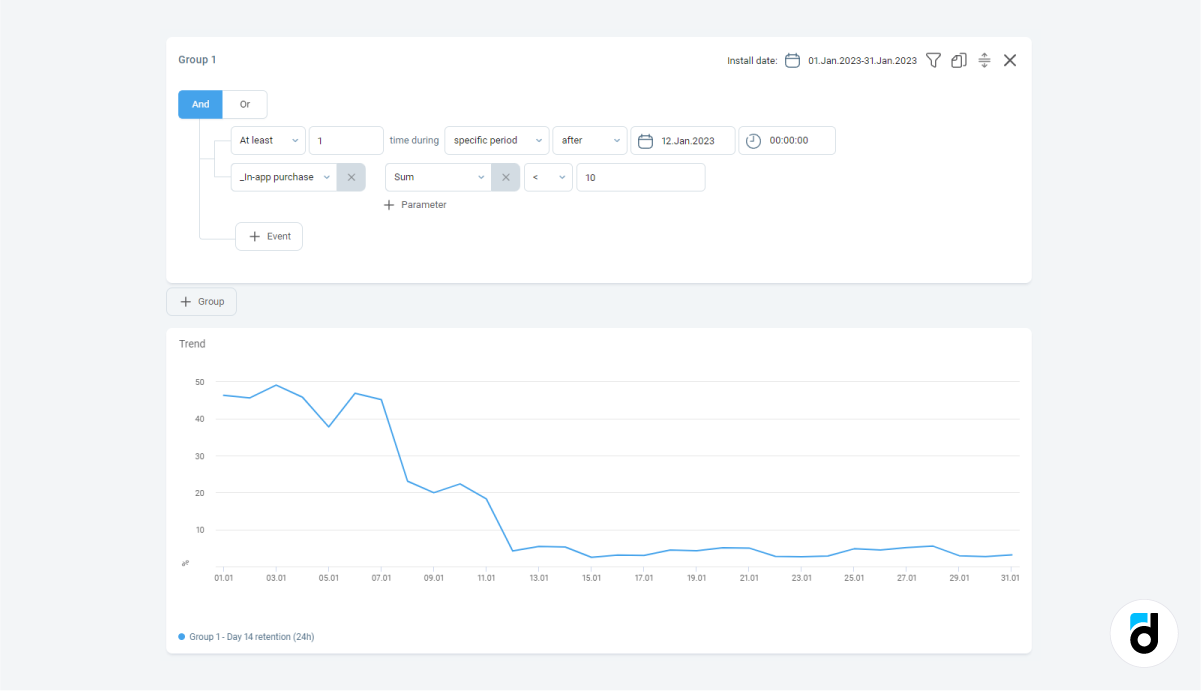
In general, each event offers a selection of properties to choose from.
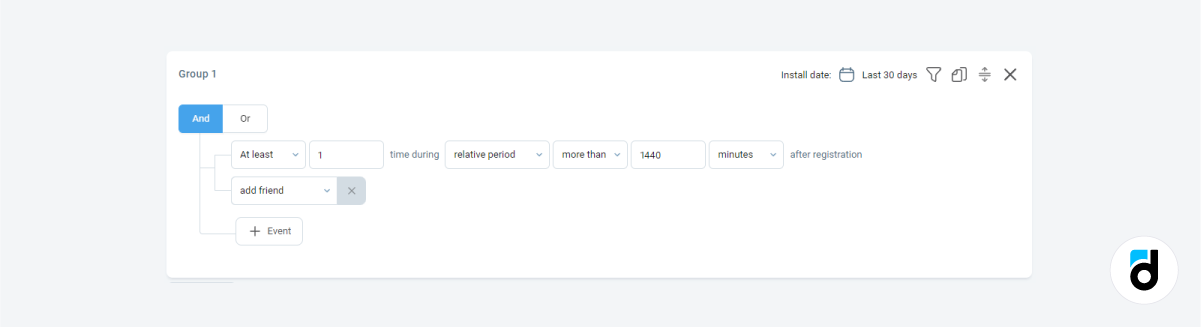
You also have flexibility in timing. You can set a specific period (before or after a particular date) or a relative period in minutes. For instance, you can find the D7 retention rate of users who added a friend within the first 24 hours after installation.
Start exploring with our demo project. If you are already a devtodev user, you can find further information on setting up events in the documentation.