
The way you implement and then develop an analytics platform in your new project depends on a number of factors: your experience, general level of analytics knowledge in the team, how data driven your managers are, etc. If you still doubt, read our description of a general way of implementing and developing an analytics system into an average project.
Early Releases
This is the stage where you don’t need to dig deep into the data yet and so, you can either use the store’s analytics or start implementing your own system. When you release the first several app versions, all you do is collecting feedback and fixing bugs. You need to simply analyze how viable your product is therefore you need to collect basic metrics like downloads, retention rate, etc. You don’t need to drill down and analyze, let’s say, behavior patterns of premium users.
Read more: How to integrate an analytics system into your game
Audience Growth
The main goal of this stage is user acquisition. This means that at this stage you need to have an analytics system integrated with your product and be ready to utilize it to analyze the traffic and find the most rewarding sources available. You need a platform that will collect data on all traffic sources and give you tools to assess metrics such as CPI, number of acquired users, retention rate, cost of acquisition, ROI, etc.
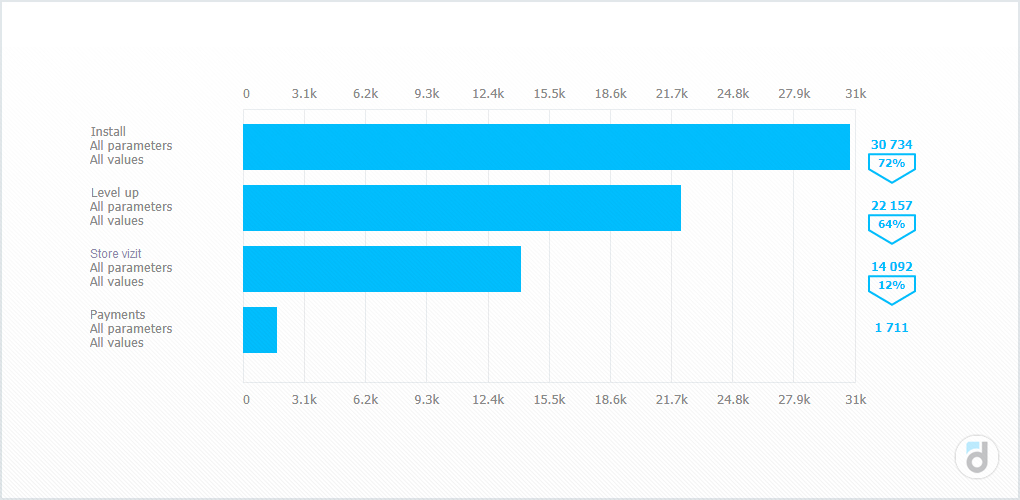
Also, you can take a look at how well and how fast the users entice into a desired action because you don’t want to spend money on acquiring traffic for the sake of traffic. So, choose some desired actions like tutorial or first level completion, character upgrade, etc. and analyze them.
Another task at this level is to identify the steps with the highest drop-off rate in your marketing funnel. At this stage of product development it’s quite easy to find problematic places and fix them. You simply need to build a funnel and analyze it in great detail.
Stable Audience Size
This is the stage where most bugs are fixed, processes are streamlined and it's high time for digging into data because you want to improve your understanding of the users to boost conversion and retention rate. Two things are must-haves at this phase: custom events and a comprehensive analytics system.
These two tools can be used to solve the main issue of this stage - steep decline or rise of metric rates. When you have a large audience, you metrics are supposed to be stable. If it changes, you need to know why — whether something happened (a new bug, etc.) or it was predictable (releases, new functionality, holidays. etc.)
Don’t let the problem slide. Remember that the better you understand your audience, the easier it will be to work with it. So, you need to perform a basic segmentation, use funnels (to see what happened before and after the event), user flow, study custom events and activity of every important user in great detail.
At this stage, your audience is large enough to run A/B testing and get statistically significant results instead of relying on your intuition.
Read more: Top 10 Youtube channels for data analysts
Team Growth
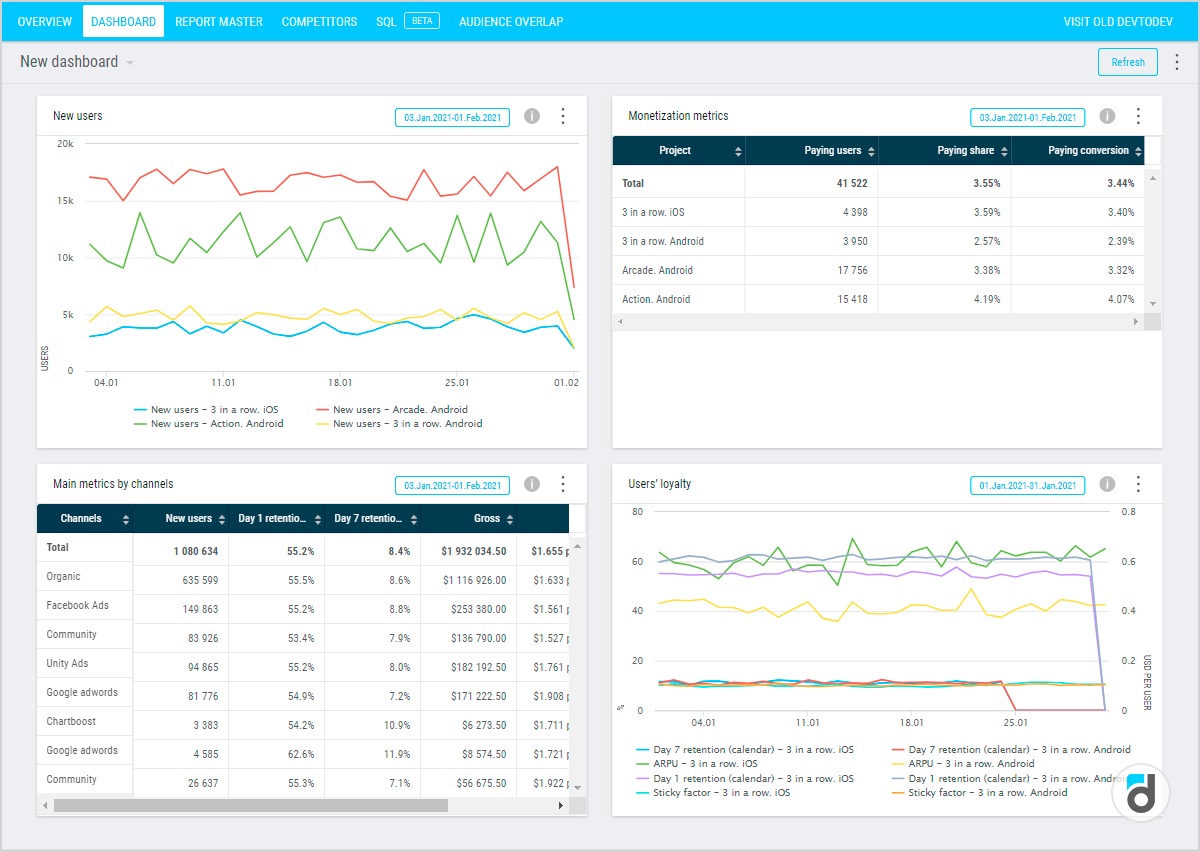
Your product grows, so does your team. You hire more people and their skill set improves. Your marketer is interested in traffic, your designer is looking for the best position to place a button, etc. The larger your team is the more questions they ask your analyst. The problem is that the time your analyst/group of analysts has is not unlimited. It means that you need to make access to the data more convenient. The best solution here is building dashboards that will contain all basic metrics, your north star, and the metrics that you try to improve
Here are some options:
-
KPIs
-
A release or promotion report
-
Statistics on functionality usage and product stability
-
Data on traffic sources
-
Real-time metrics
-
Financial metrics
Personalization
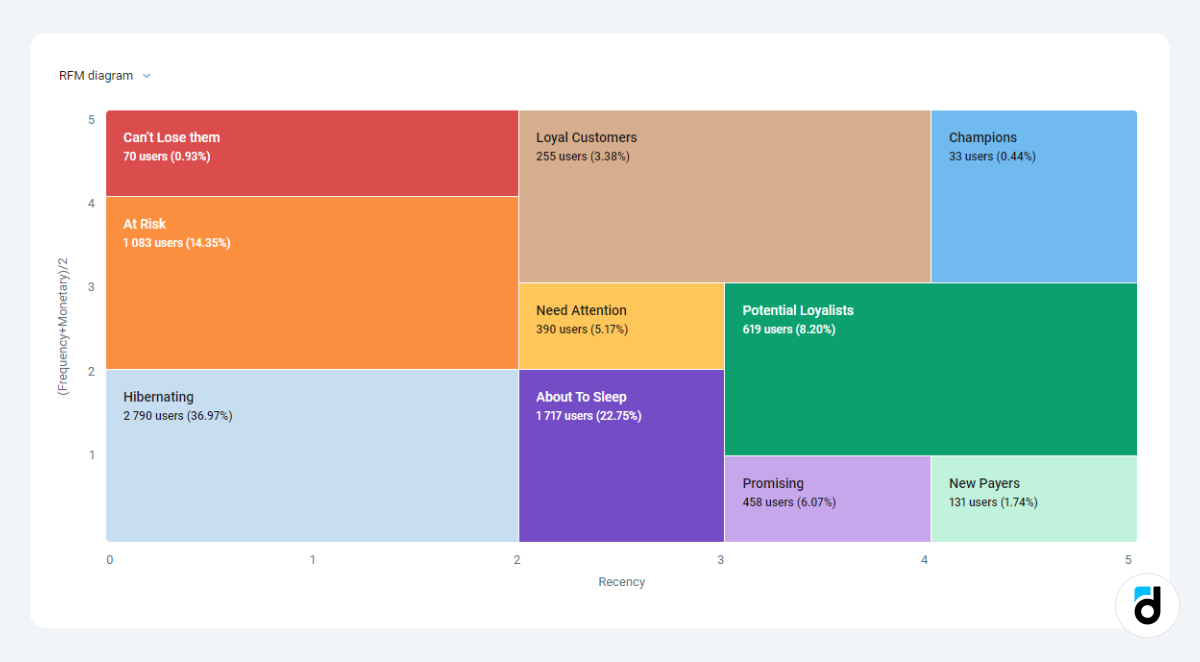
This stage is quite difficult because you will need to segment the audience and work with each of them individually.
What parameters you can use:
-
Basic information (OS, country, device, ...)
-
Total number of days spent playing (engagement time)
-
Visit frequency
-
Payments and their total amount
-
Level
-
Player ratings
-
Percentage of wins
-
Available features
-
Available currency and its amount
-
Days without making payments, etc.
You can use one of the parameters or a couple of them.
Also, the segmentation will give you a clear picture of what segments you have and the number of users they include. So, you can find extremely promising segments and send them a push notification with a great offer, and you find segments that look completely hopeless for your monetization strategy.
Read more: How to identify and re-engage churned users
Forecasting
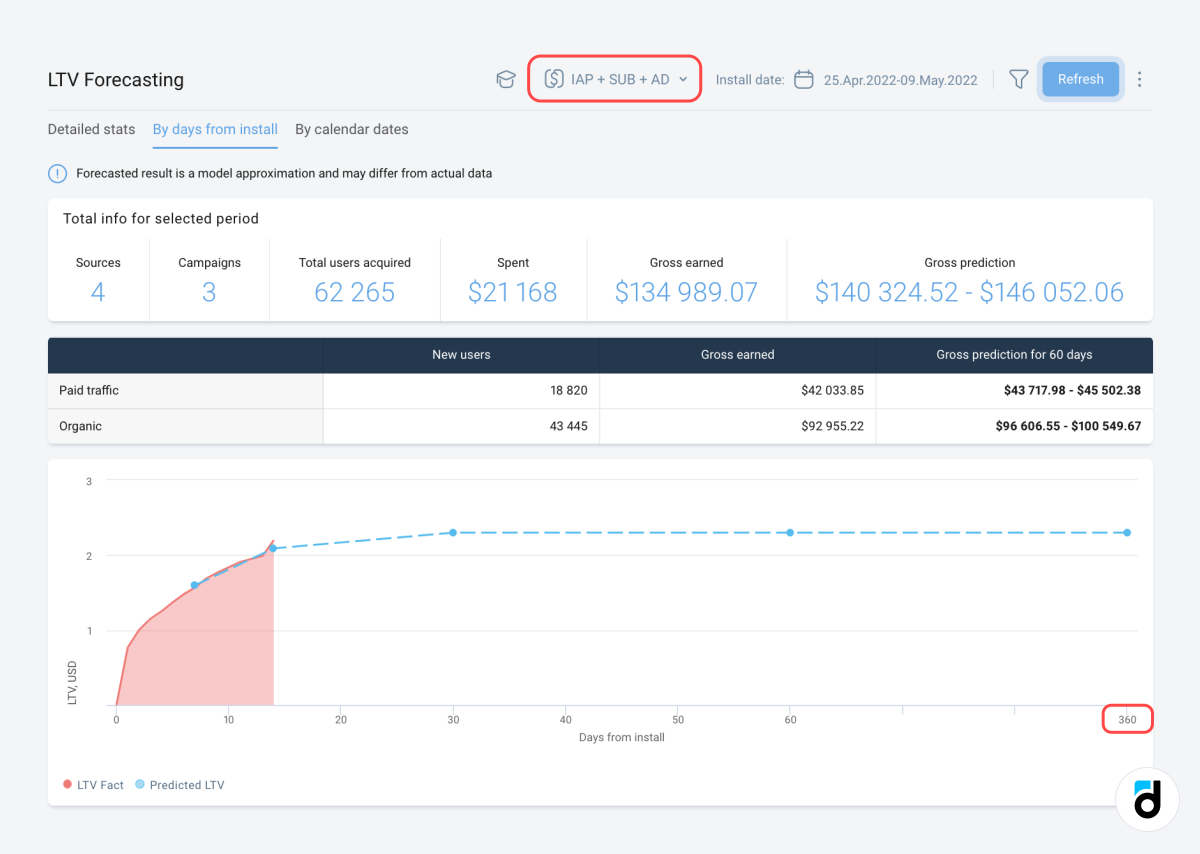
Forecasting is the last, most advanced stage of the process. You can predict churn rate, payment probability, target action completion, but the metric that is predicted most often is LTV.
There isn’t much sense in forecasting them at the earlier stages because this is a very resource-intensive task and your analysts and developers may not have enough time for it. However, you can use simple calculators found online and build basic models. This way you can, for example, assess your projected cumulative ARPU. The result will be quite inaccurate but it may still help you with something.
For more precise predictions, you can use machine learning. Its results are great but it has several restrictions - to build a model, you will need to have a year of data (current or historical) and a complete integration that includes custom events. If you have all of these, you can predict user behavior in just 3-7 days after the user installed your app.
The easiest way to get such precise predictions is to integrate your product with a comprehensive analytics system such as devtodev. It will predict your LTV and spending behavior of your users and you won’t even have to pay extra!
So, these are the stages that an average company needs to complete to get all the benefits of analytics. Don’t try to build ML models at the very beginning because you will have your hands full and you risk missing something important. Let the development process take its turn but prepare a plan of actions on how to implement and develop analytics in your product.