
In this article we are going to discuss LTV forecasts powered by machine learning. How precise is the prediction? What data can we use to train the algorithm?
LTV (lifetime value) is a metric that helps you estimate how much revenue you earn from a user before they stop using your app. There are many ways you can apply it to make your project more profitable. For example, you must know it when buying traffic i.e. when you need to understand whether the cost of acquisition is viable or not.
The issue with LTV is that you can’t calculate it in advance since you can’t know how a user or a cohort of users is going to behave in the future. Therefore, this metric can only be predicted. But at the same time, predicting with simple mathematical functions produces high error values. So the problem can be solved with applying machine learning (ML) to make LTV predictions more accurate.
Read more: How to Integrate an Analytics System into your Game
As an example, we are going to take a look at devtodev's tool because it gives you a fairly precise LTV forecast that is powered by machine learning and is able to give you a forecast for up to 360 days ahead. If you want to get familiar with the tool, please open your Space or devtodev free demo version and click Predictions -> LTV.
devtodev Algorithm
How does devtodev train its machine learning algorithms so that they give you the result with about 90% accuracy? As a matter of fact, devtodev uses payment events and other activities of users who use your app for at least three days. Later on, after it acquires more data about new cohorts, the model is recalculated and the forecast accuracy improves even more. Recalculation happens on the 7th and 10th days of the cohort’s ‘life’ in the app. devtodev calculates user LTV on the 7th, 14th, 30th, and 60th days since app install.
Read more: How to Launch a Promo Campaign and Increase Product Revenue
Predict LTV of your Product
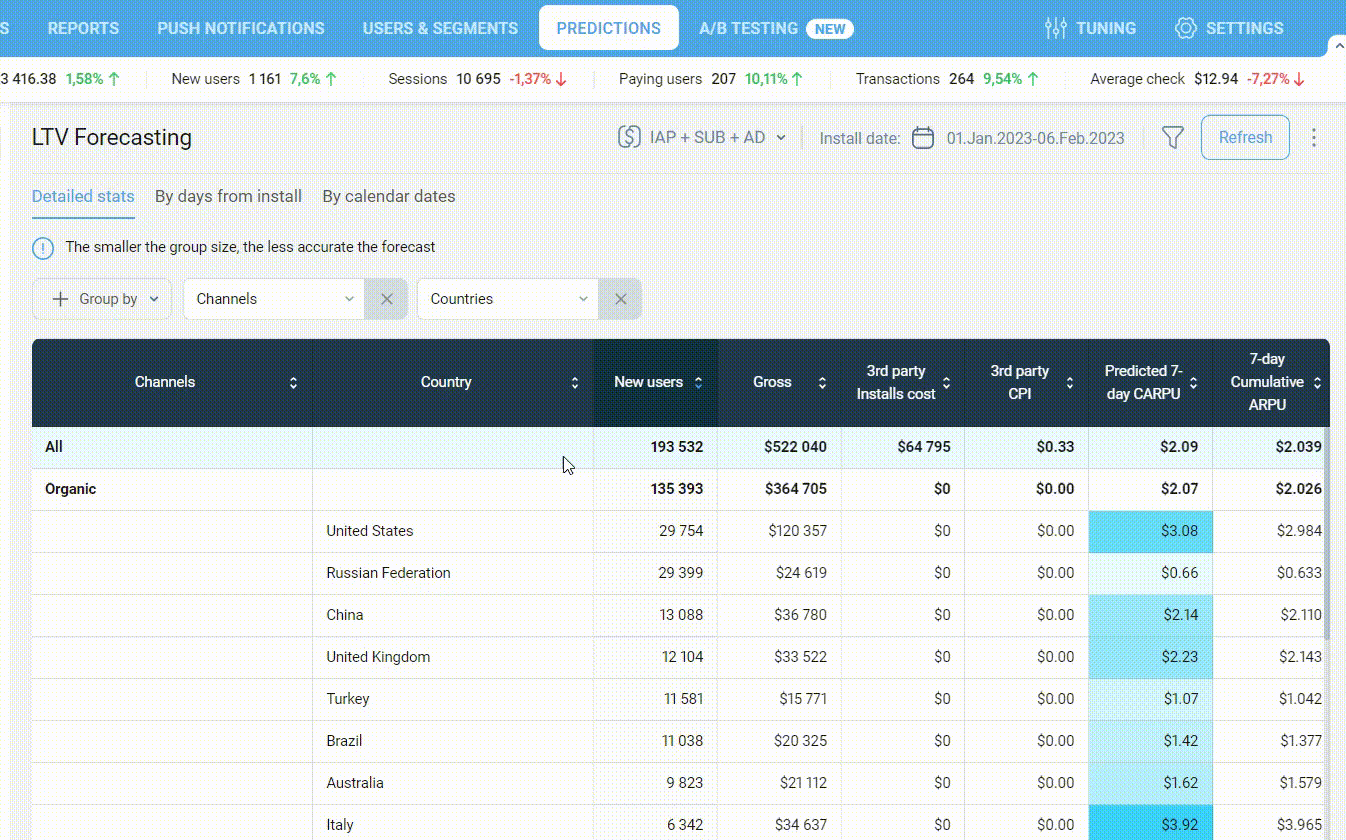
In the ‘LTV’ report, you need to look at the top right corner and specify a date range. It will limit the dates of users’ first visit to the app (keep in mind that we can calculate LTV only after three days since install, so the latest three calendar days will be unavailable).
Please also note that right next to the date range you can find a list of income sources. You can forecast LTV for ad monetization only, or for ad monetization and subscriptions, or even add in-app payments to the basket.
After that, select one of the two options for viewing information about LTV forecast: for days from install (the prediction is built for cohorts from specific sources and campaigns) or by calendar days.
By days from install
The chart below represents revenue per average active user after 1, 2, ..., N days from the first visit (Predicted LTV) and the amount of money they have brought in till now (Actual LTV).
For the Actual LTV calculation, we take into account only the income earned for the number of days that all the selected cohorts have ‘lived’ in the app. Therefore, when on the 31st day you build a report on users acquired from the 1st to the 10th day, you get the Actual LTV data for 20 days because the cohort that came to the project on the 10th day has ‘lived’ for 20 days only.
Read more: How to Analyze App and Game Subscriptions
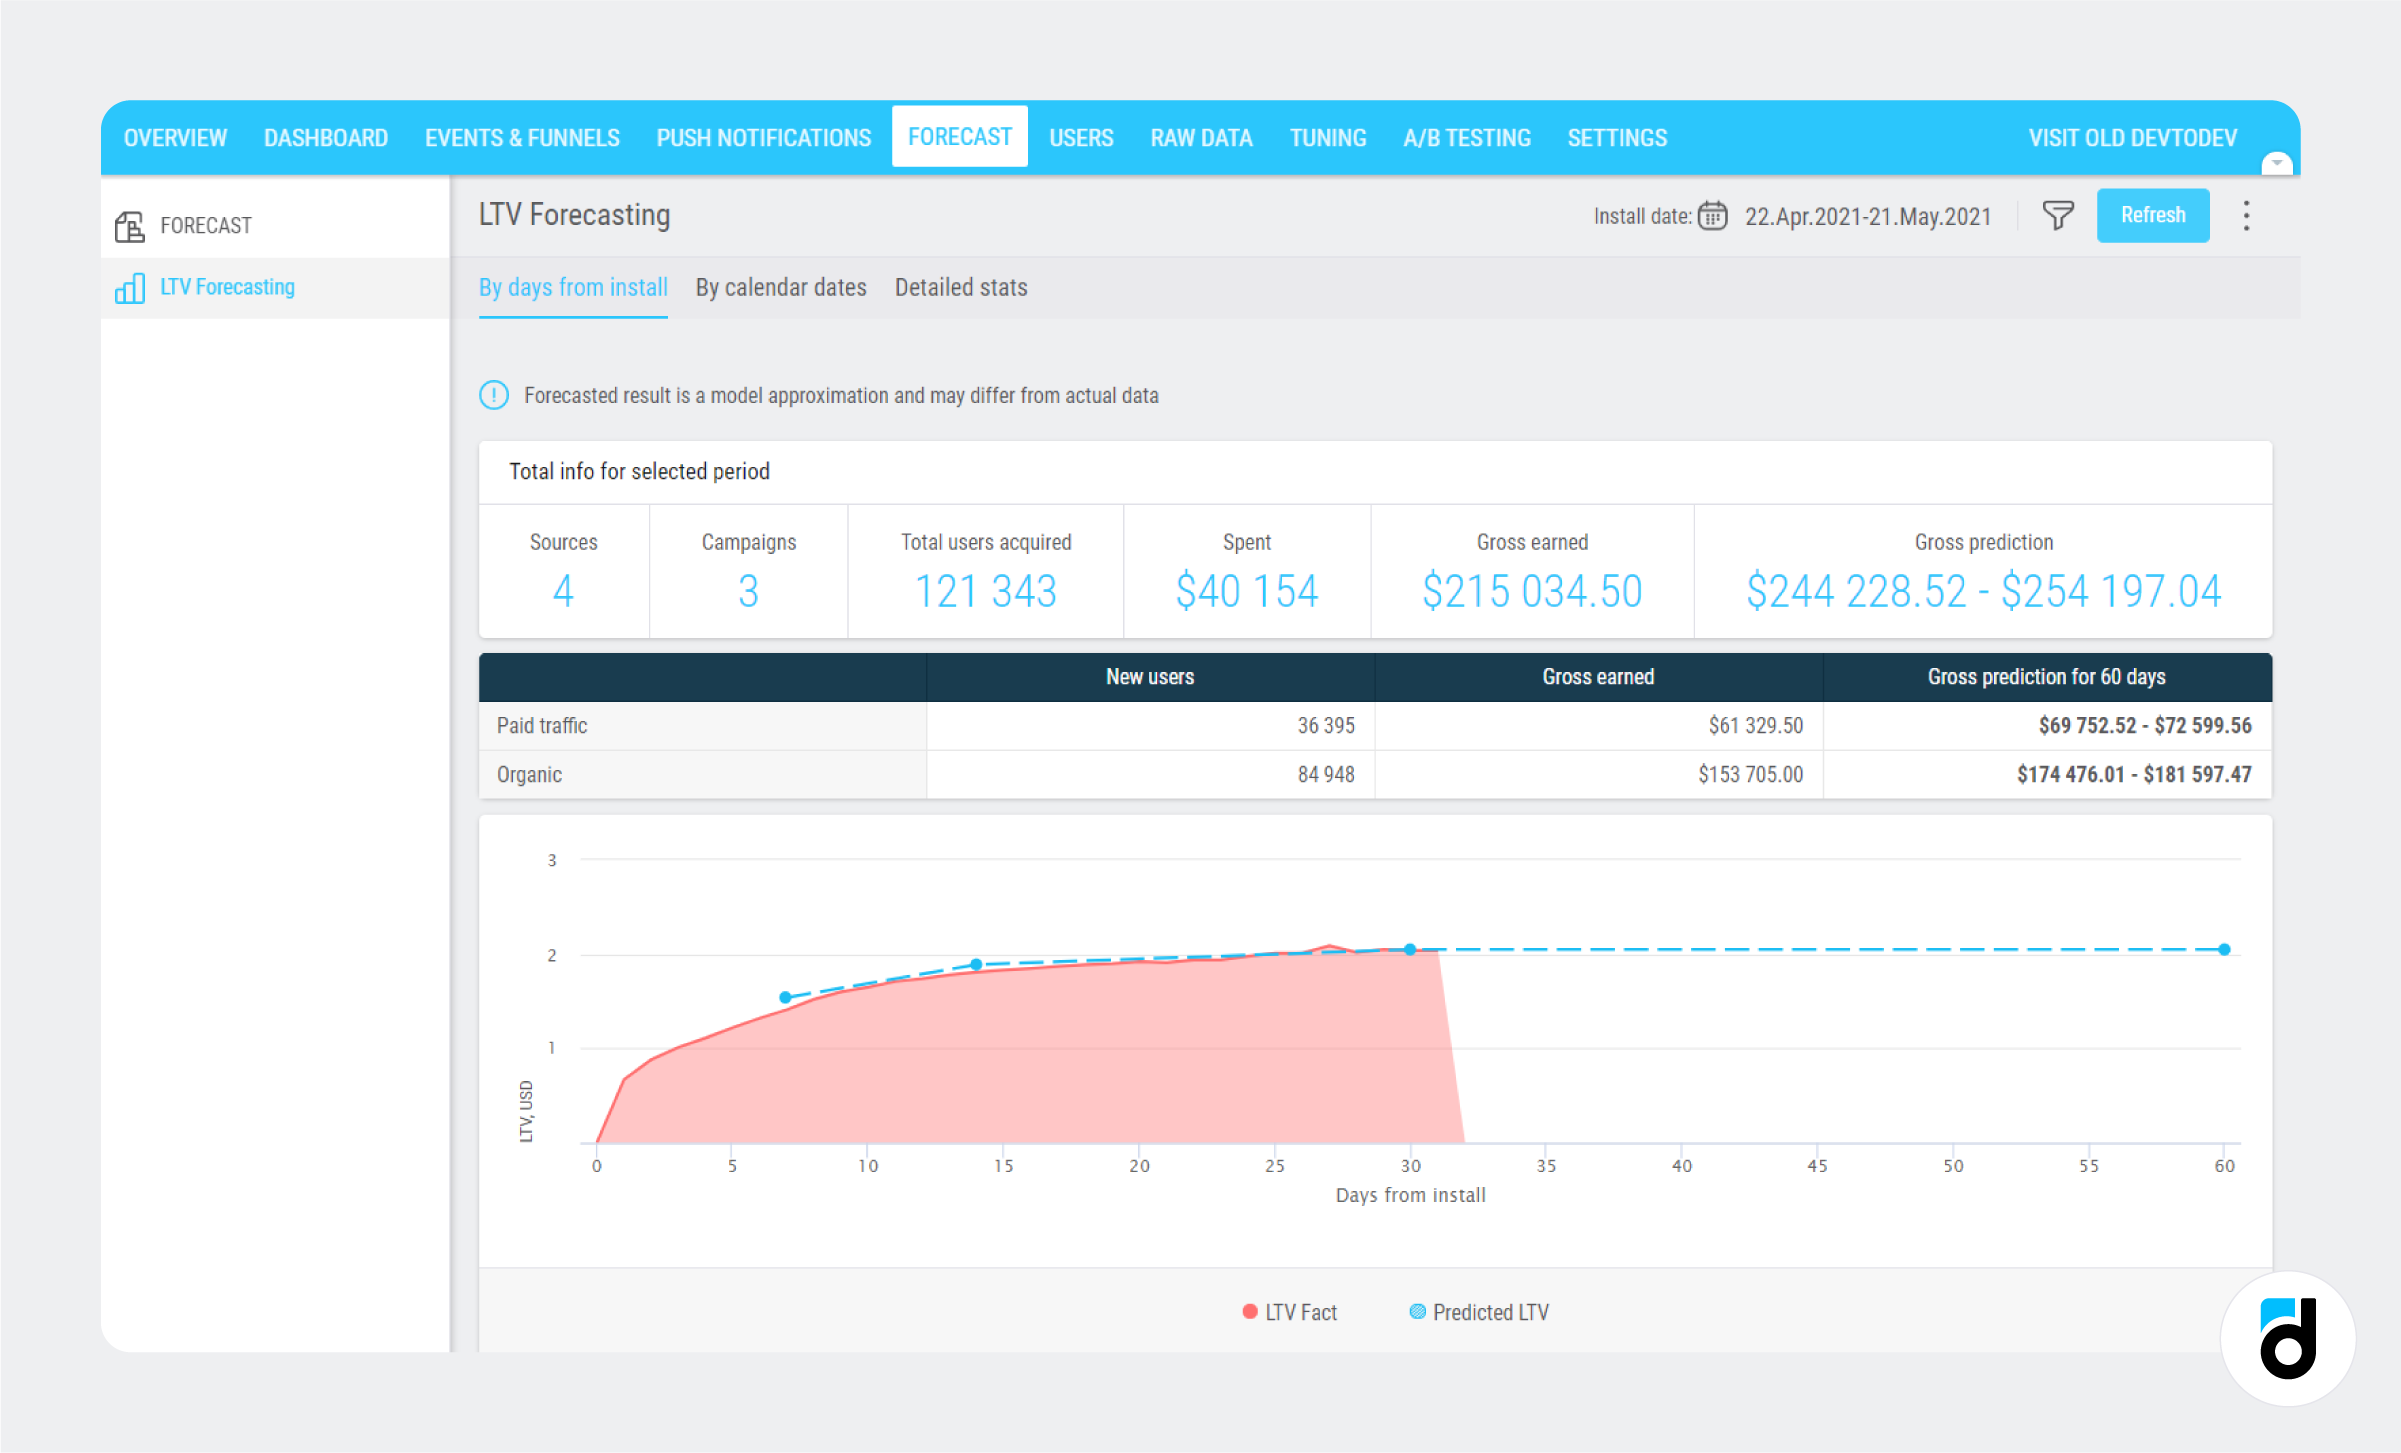
‘Total info’ above the graph and a table below it display the traffic sources, the amount of money spent on their acquisition, the income earned, and the expected total revenue from all the cohorts after 60 days in the project.
In case you need to select only a specific user segment, you can apply a wide range of filters on each report page, and build the LTV forecast only for your target audience.
Read more: Analyze 3 Revenue Sources - Ads, In-apps and Subscriptions
By calendar dates
The second page of the report shows how the Predicted LTV metric is changing over time. Here for any selected N-days Predicted LTV metric you can see the deviation between the Predicted LTV and the Actual LTV for every cohort according to their install dates.
For the latest N-days, we can’t calculate the actual LTV, so we use gray candlesticks to show predicted data and the dashed blue line to show the actual data.
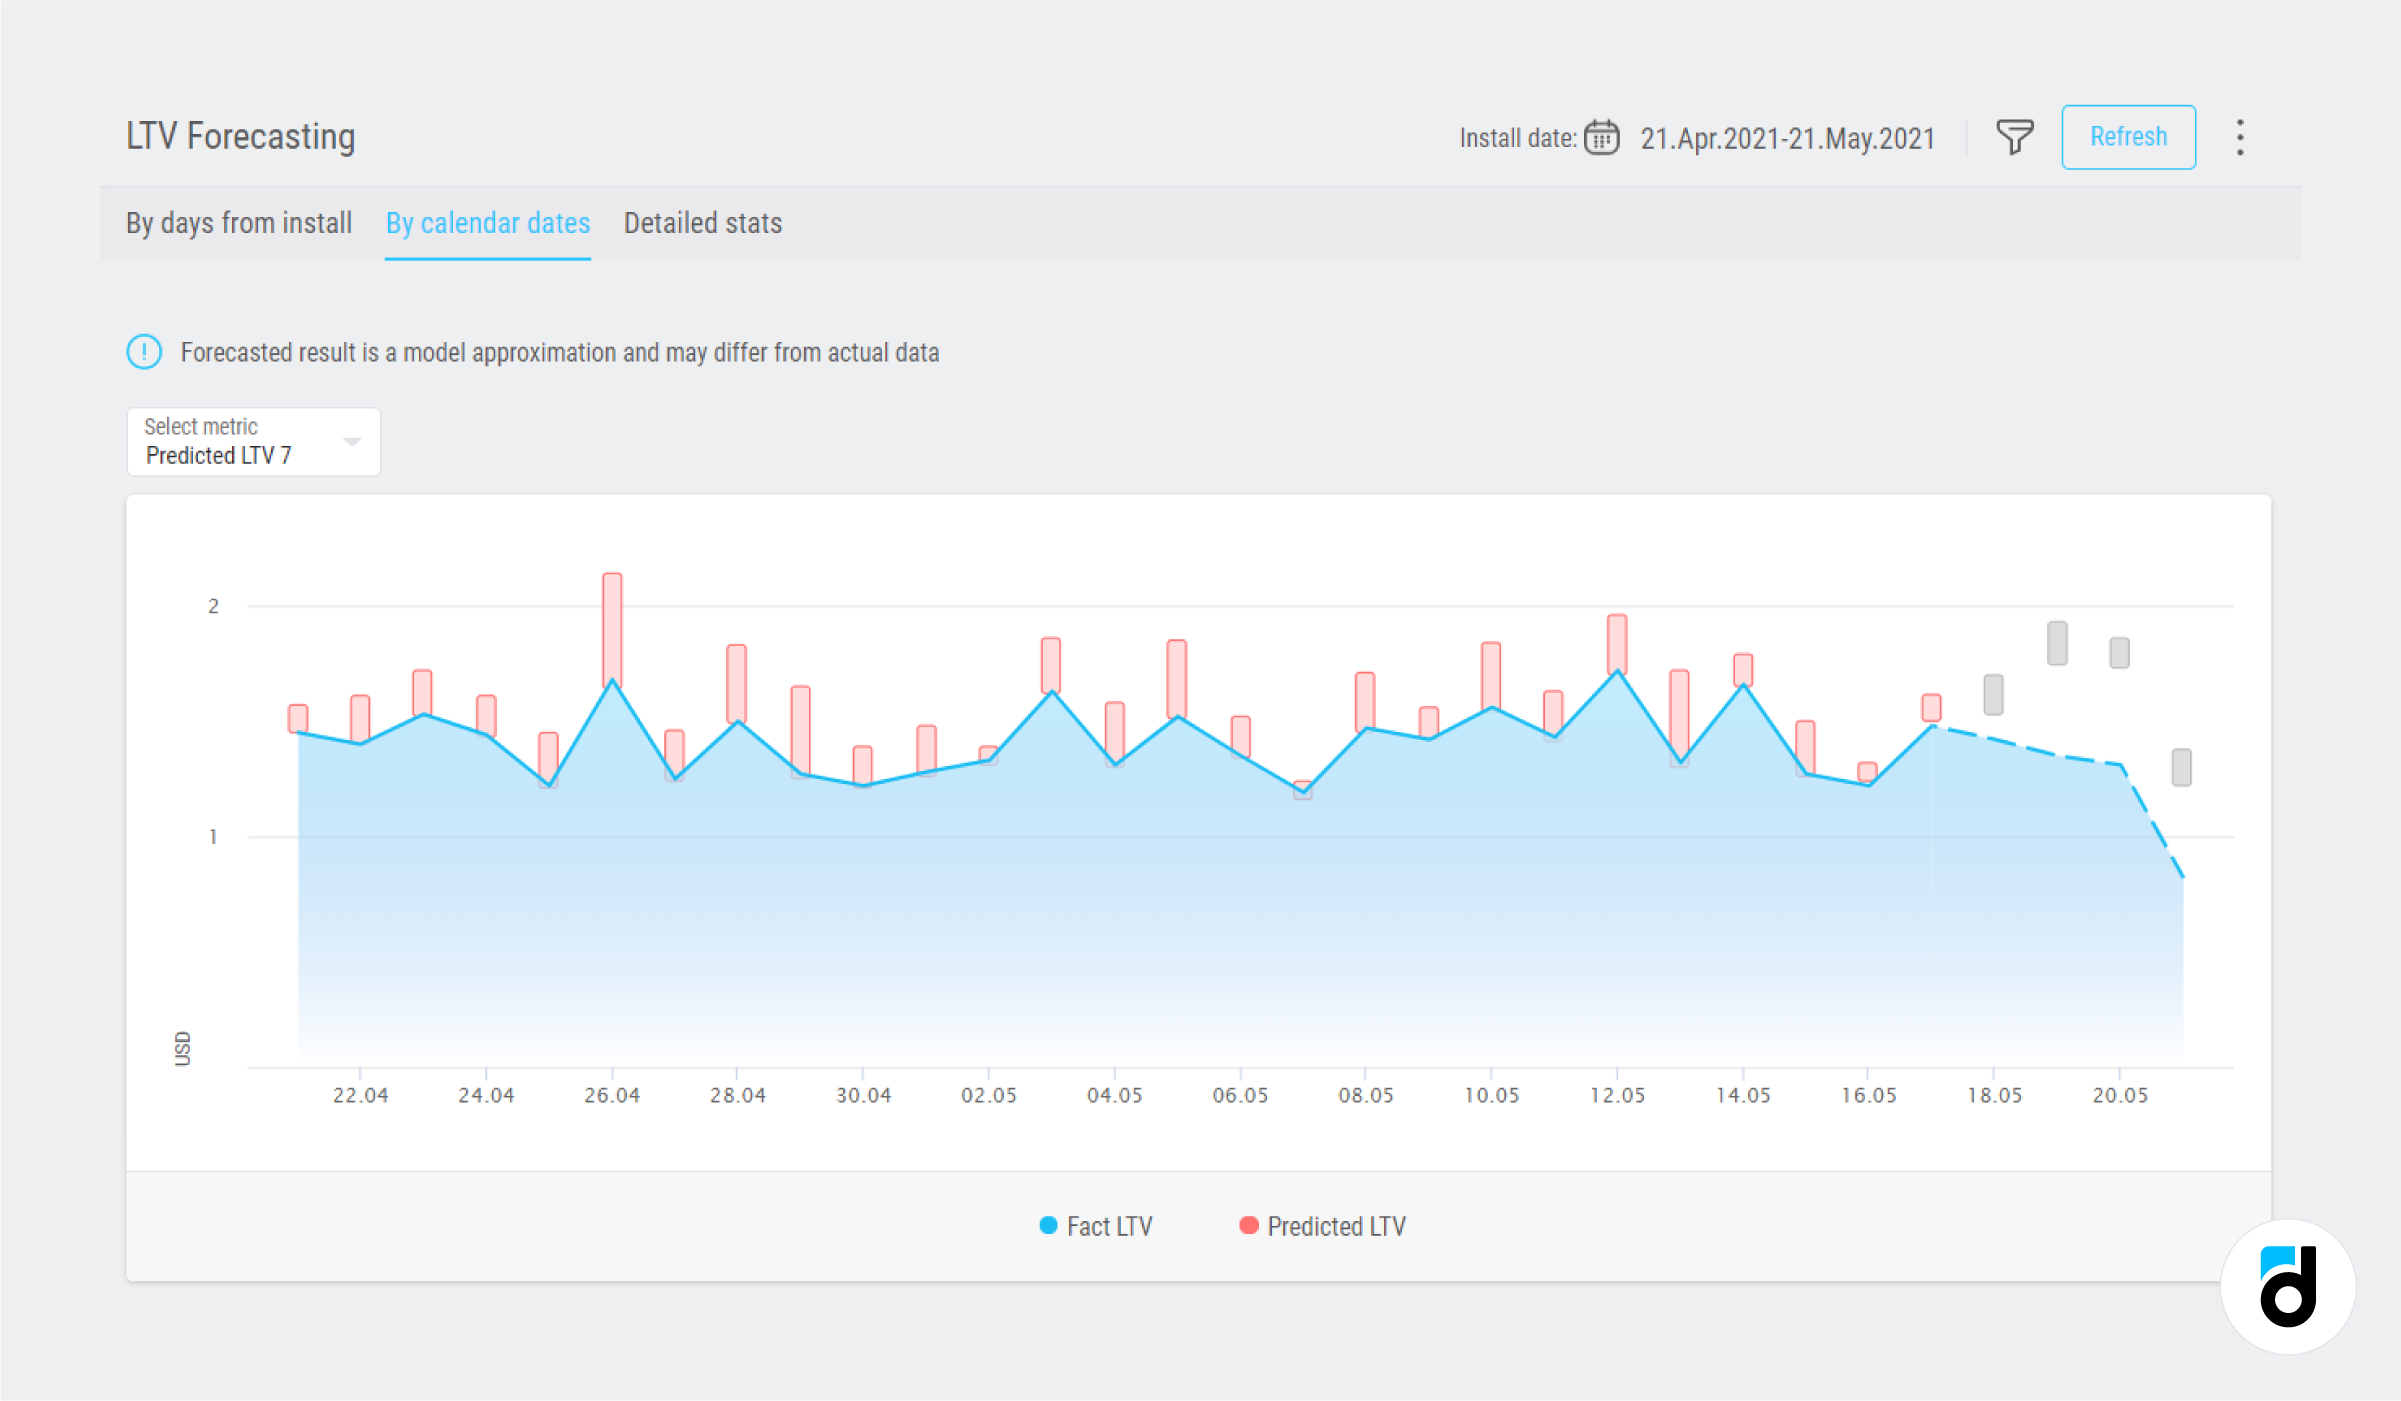
When you move the pointer over a cohort, you can see the intervals of predicted lifetime values (from min to max), and the actual LTV.
LTV Forecast a Year Ahead
If you want to know how much a certain cohort or users from a specific source is going to pay you in a year, you can ask us to build a report for you.
However, your project has to meet one condition — it has to be connected to devtodev for at least one year. If it doesn’t, the model won’t work properly. But if you became a devtodev client just recently, you can transfer your historical data for the past year and we will gladly provide you with the report!
Request a report
By default, the functionality is available for all apps. If you would like to get a report, navigate to your project, click the ‘Forecast’ tab, open the ‘LTV Forecast’ report, and request model building. Notice that if you want us to build an accurate model, your app has to meet certain requirements:
-
The app is integrated with devtodev for at least 90 days.
-
The MAU is 100k or more
-
Payment events are integrated.
-
Custom events are integrated.
Read more about LTV in our free BOOK!