
Analyze app revenue sources with Devtodev—a unique analytics platform that enables you to gather data on adds, in-app purchases, and subscriptions.
In case you run a free-to-play (f2p) or a subscription-based project, you only have three ways to earn revenue: through ads, in-app purchases, or subscriptions. Each revenue source has its own strengths, risks, and associated costs. It is crucial to conduct a thorough analysis of the source or sources you use, always keeping an eye on them and finding ways to increase revenue.
Ad Monetization
Smart view -> Monetization -> Ad monetization
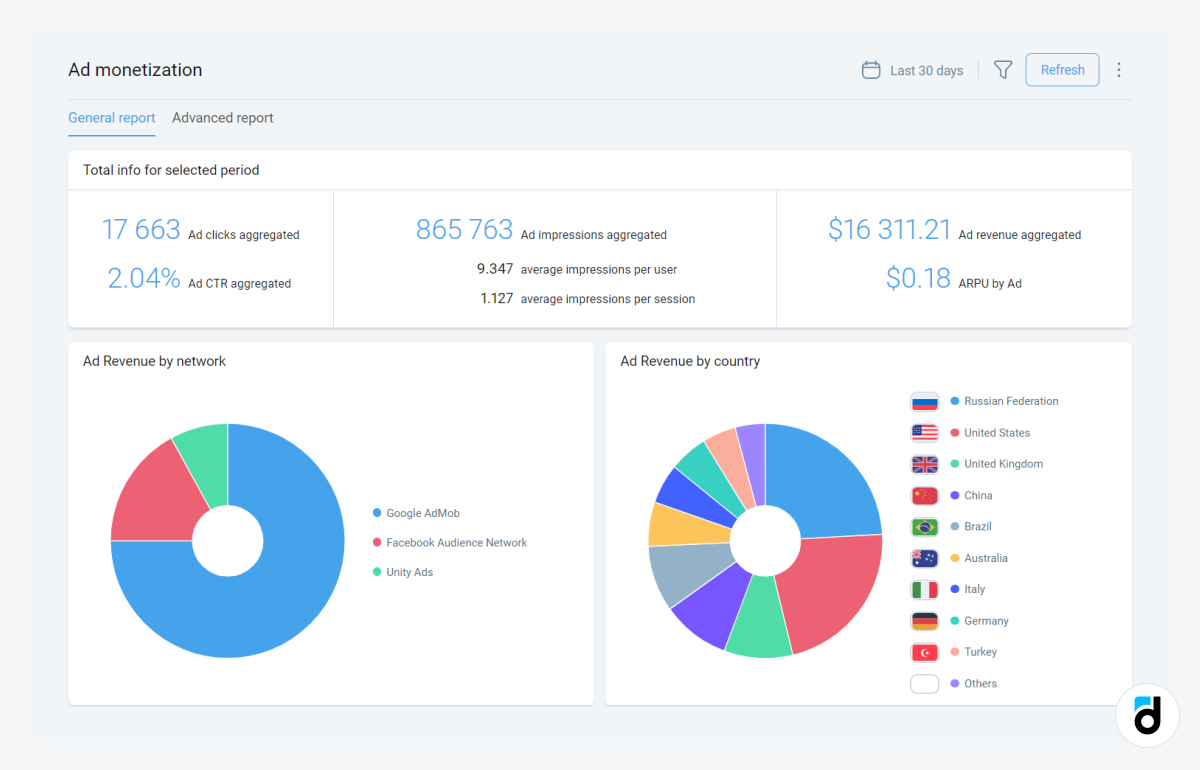
You can use this report to analyze common ad performance metrics that Devtodev obtains from ad networks: ad revenue, eCPM, impressions, average impressions per user, average impressions per session, and ad clicks per user.
Open the General report to get an overview of what’s going on with this revenue source:
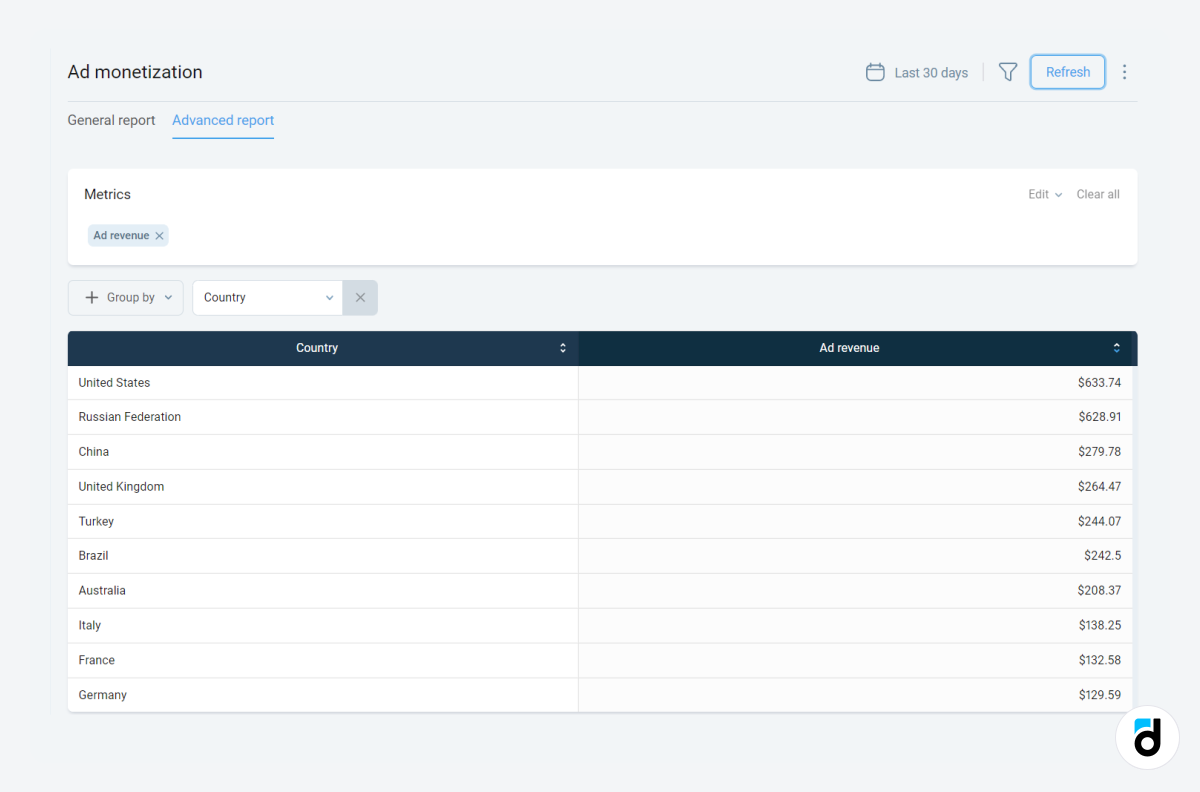
You can combine the metrics in the Advanced report section. For example, analyze ad revenue by country:
Or ad ARPU of different ad networks:
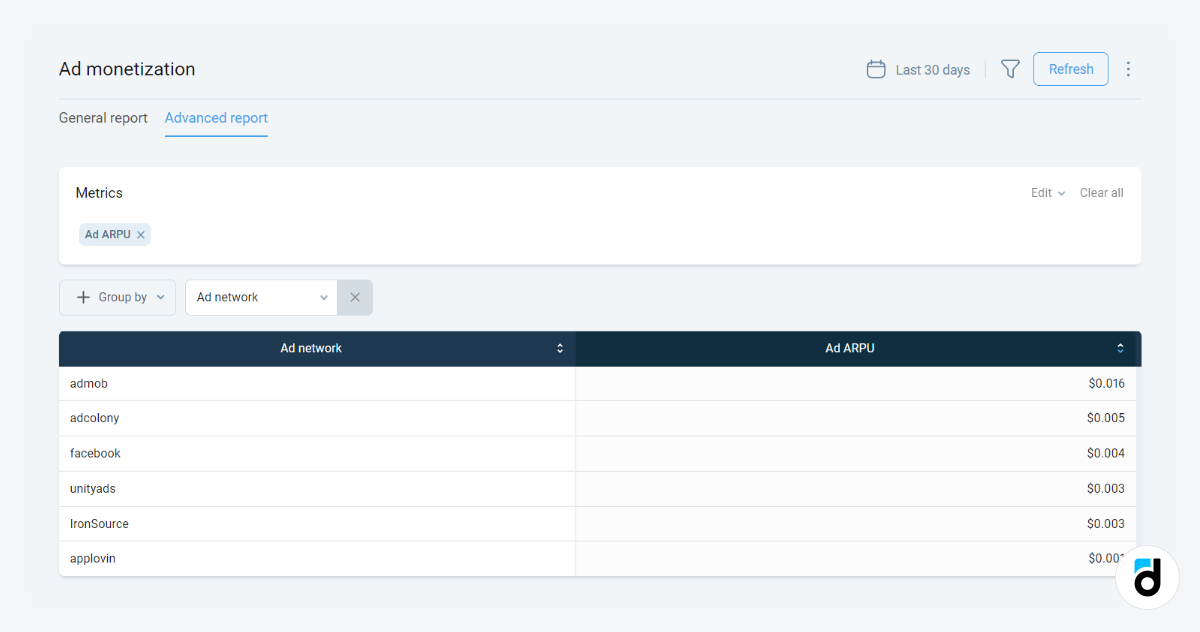
And so on. You can combine different metrics depending on the data you’re seeking.
If you implemented the ad monetization model, in this section you’ll find enough data to analyze, alter and improve your ad placements, types, etc.
Read more: Glossary of Ad Monetization Terms and Metrics
In-app Monetization
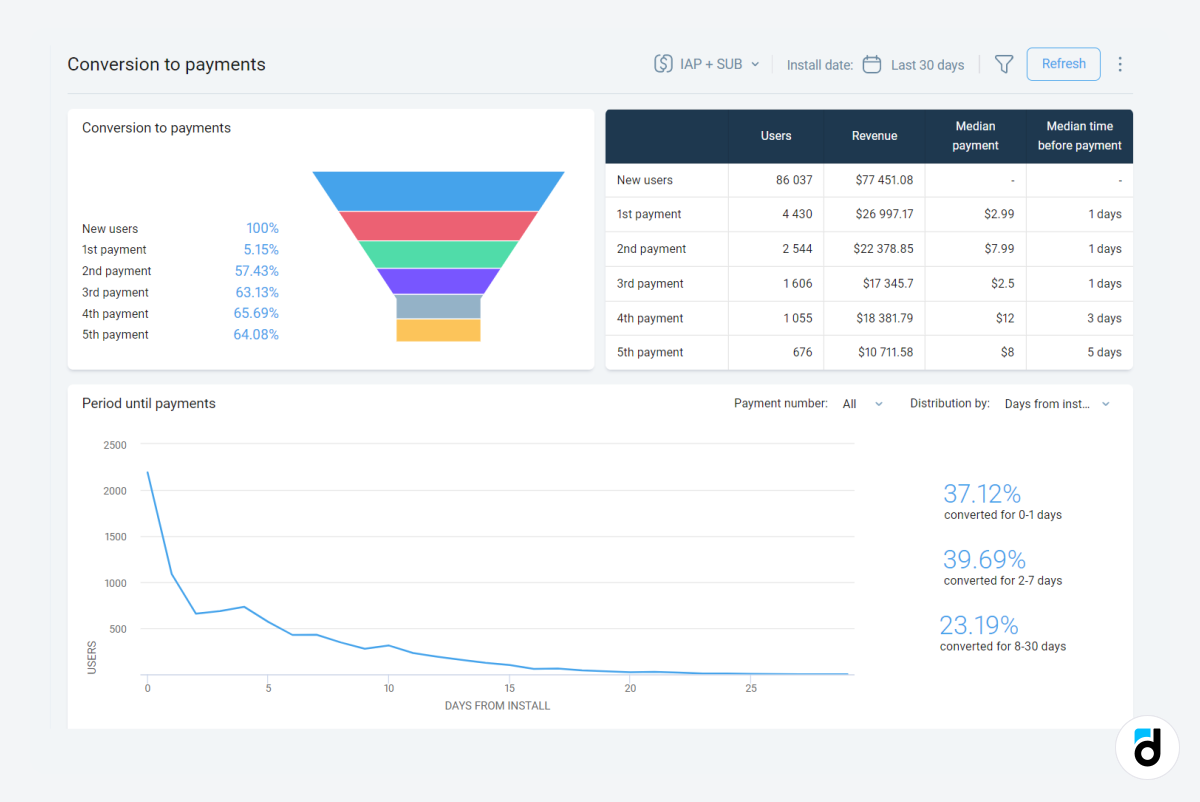
Smart view -> Monetization -> Conversion to payments
If your mobile app or game includes such a revenue source as in-app purchases, you can analyze them as well. Use basic events to gain a clear picture of how your users are enticed into a desired action, how many payments they make, how long it takes them to make a decision, etc.
IIf you want to understand what users did before making a purchase, you can open the User flow report (in this case, you need to have custom events integrated): Smart view -> Engagement -> User flow:
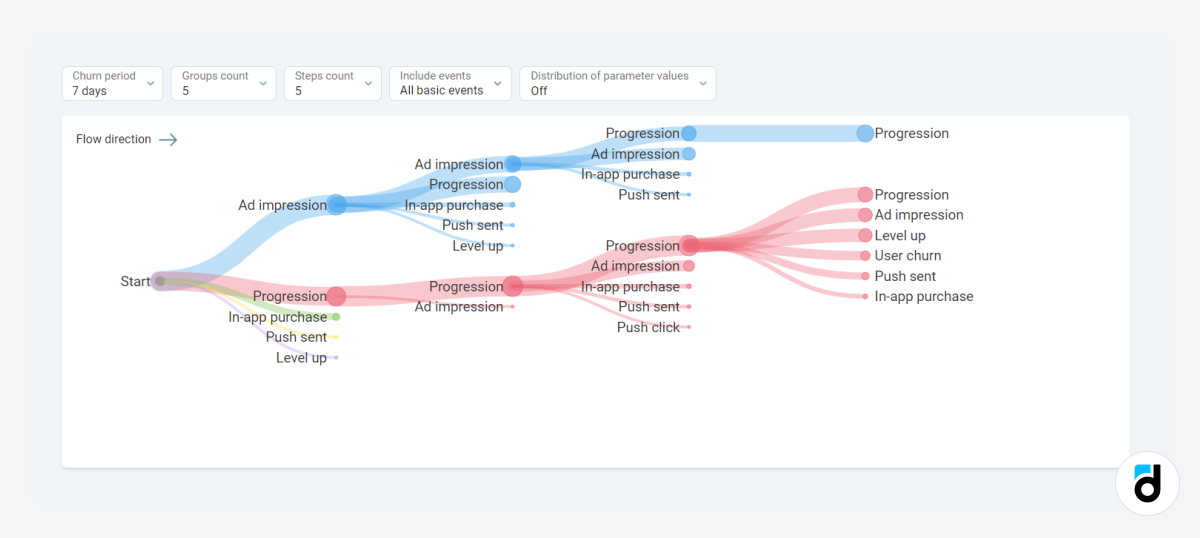
Devtodev has additional features for analyzing in-game purchases in even greater detail. Keep reading or jump straight to the last chapter!
Read more: How to Integrate an Analytics System into your Game
Subscriptions
Smart view -> Monetization -> Subscriptions
Subscriptions are another revenue source that needs to be analysed.
In general, the report provides:
-
A comprehensive picture of your subscribers, including the number of new subscribers, the count of renewals, reactivations, etc., for the subscription.
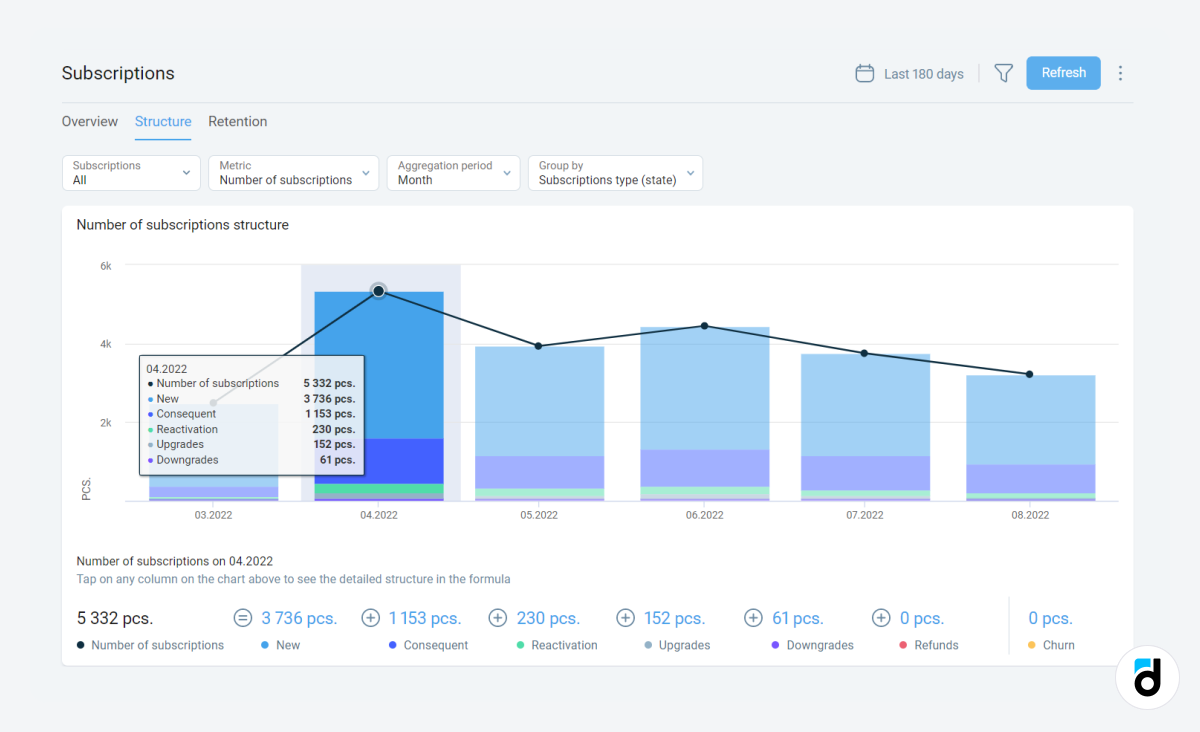
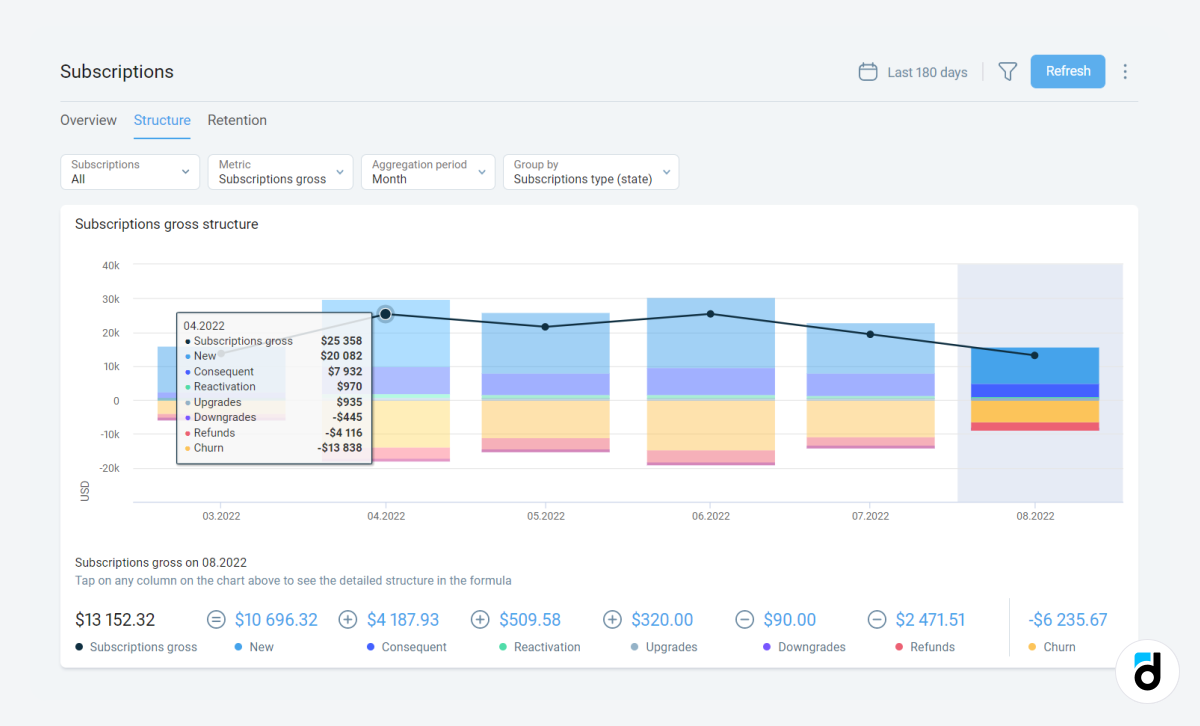
- The amount of money earned from subscriptions, broken down by type—whether it's a new subscription, a renewal of an existing one, etc. You can also determine the amount of revenue lost due to some people not renewing their subscription or requesting a refund. Alternatively, you can utilize other metrics from the Metrics list.
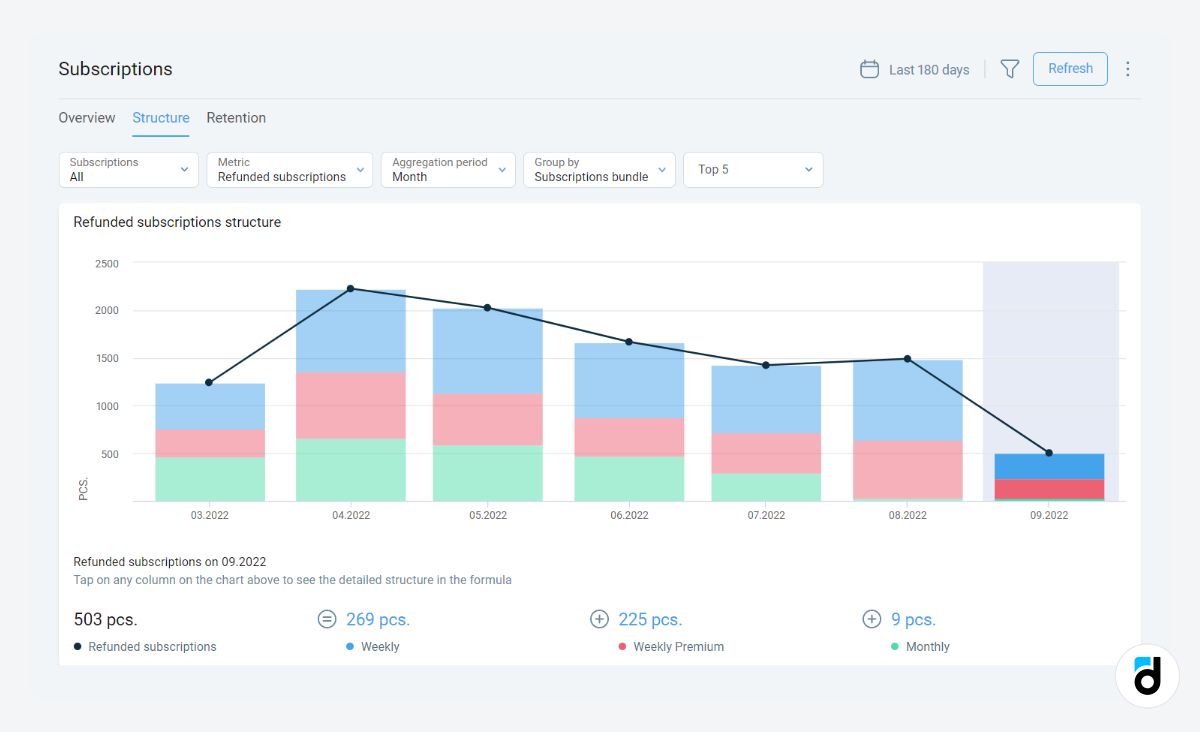
- The subscription timeframe, i.e., the number of months the subscription is extended:
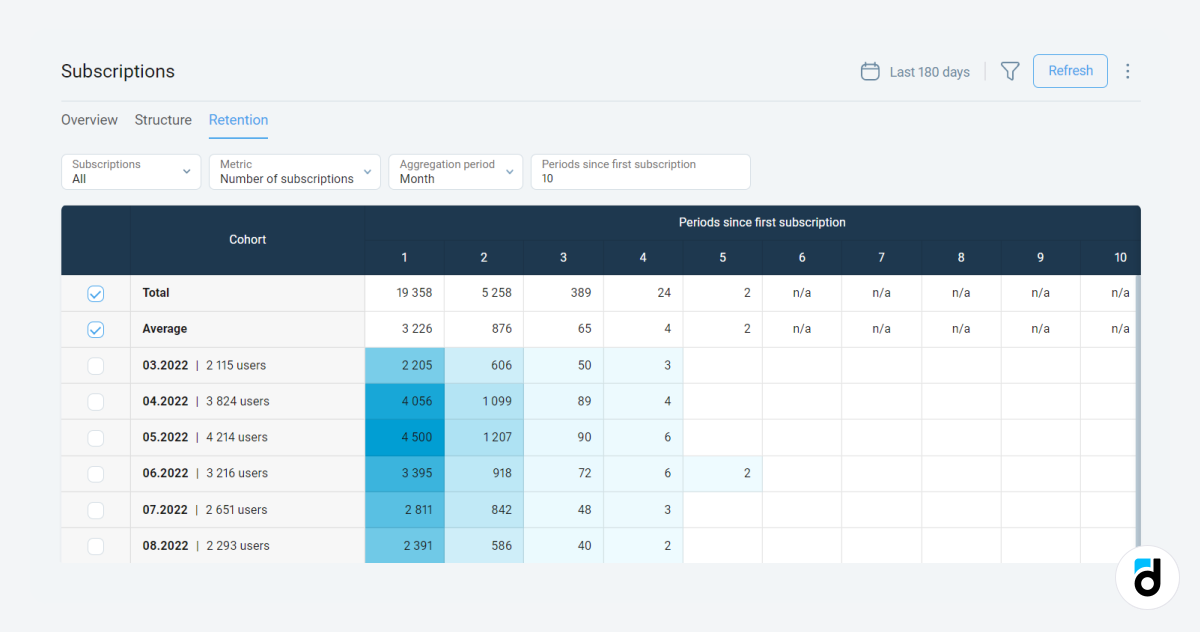
In fact, you can dig into more detail by simply changing either the subscription, metric, group by, or all of them at once.
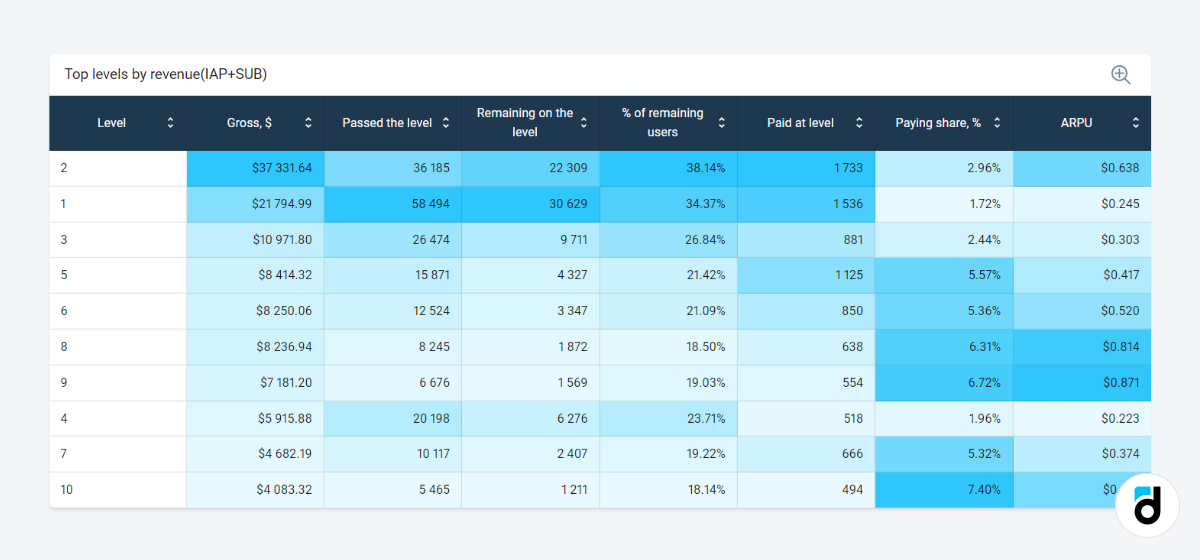
In-app + Subscriptions (for games)
Smart view -> In-game analysis
This report is tailored for games, allowing you to analyze not only purchases in real currency but also the balance of in-game currency and purchases made with that virtual currency.
Use it to analyze in-app purchases and subscriptions simultaneously. Alternatively, open the drop-down menu in the top-right corner and select one of the two monetization models.
The report comprises four sections:
-
Dashboard, where you can find the general overview: balance of currency, top purchases, most popular items, revenue by levels, etc.
-
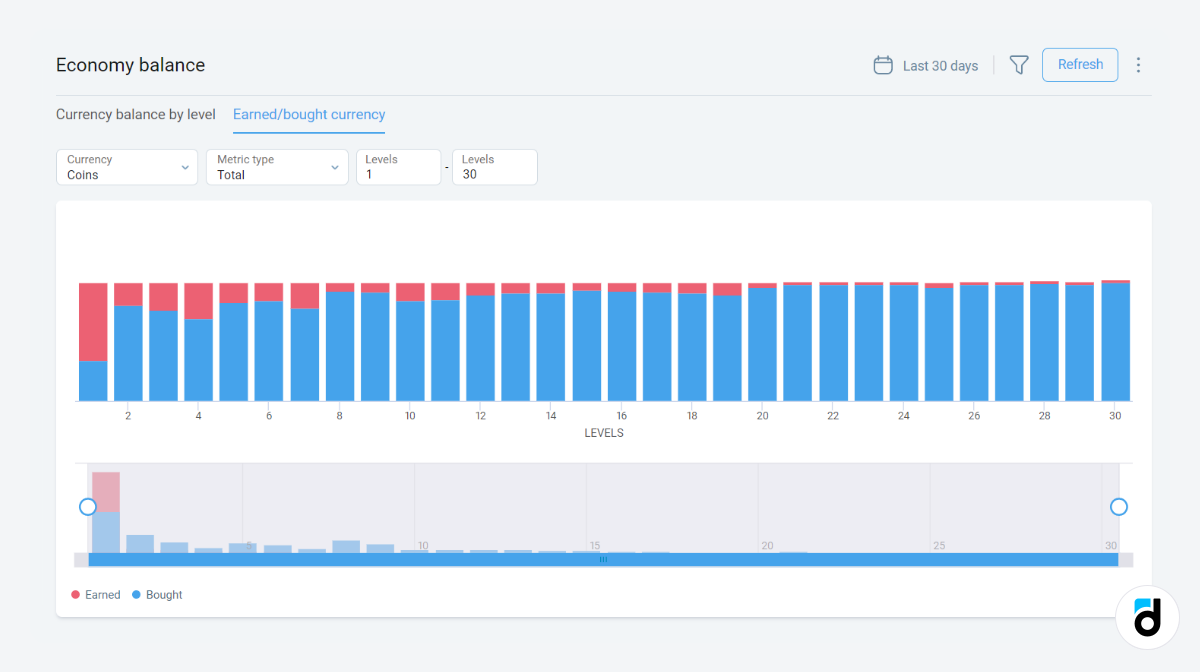
Economy balance with the data on earned/bought coins:
-
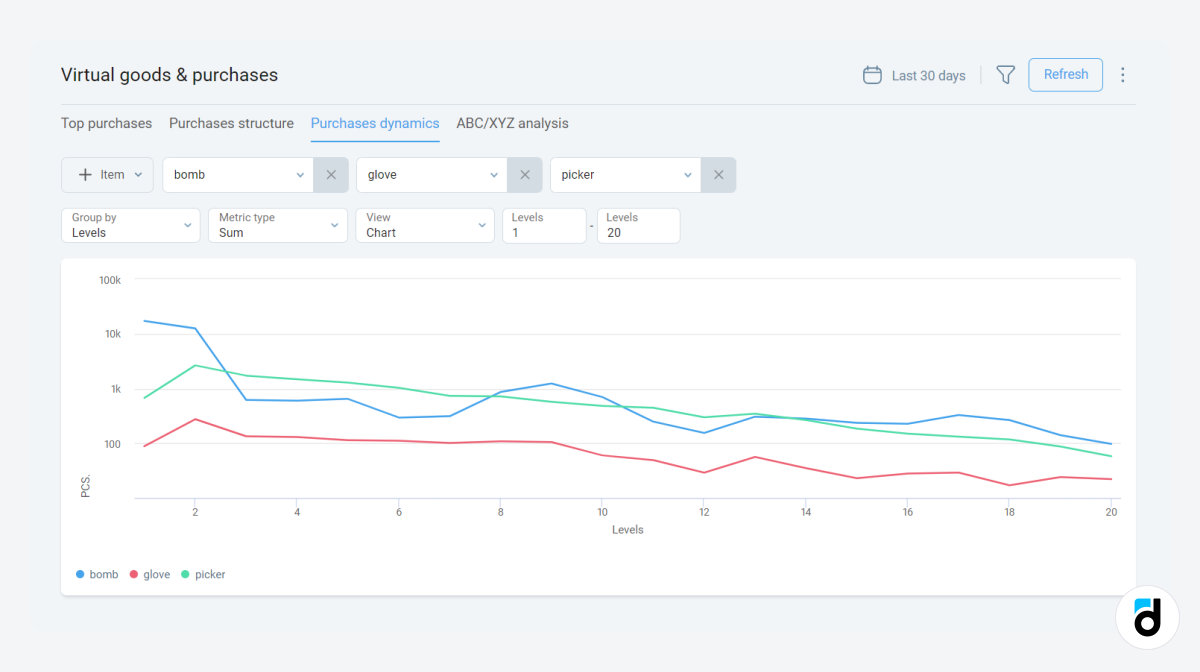
Virtual goods and purchases:
- And Game structure:
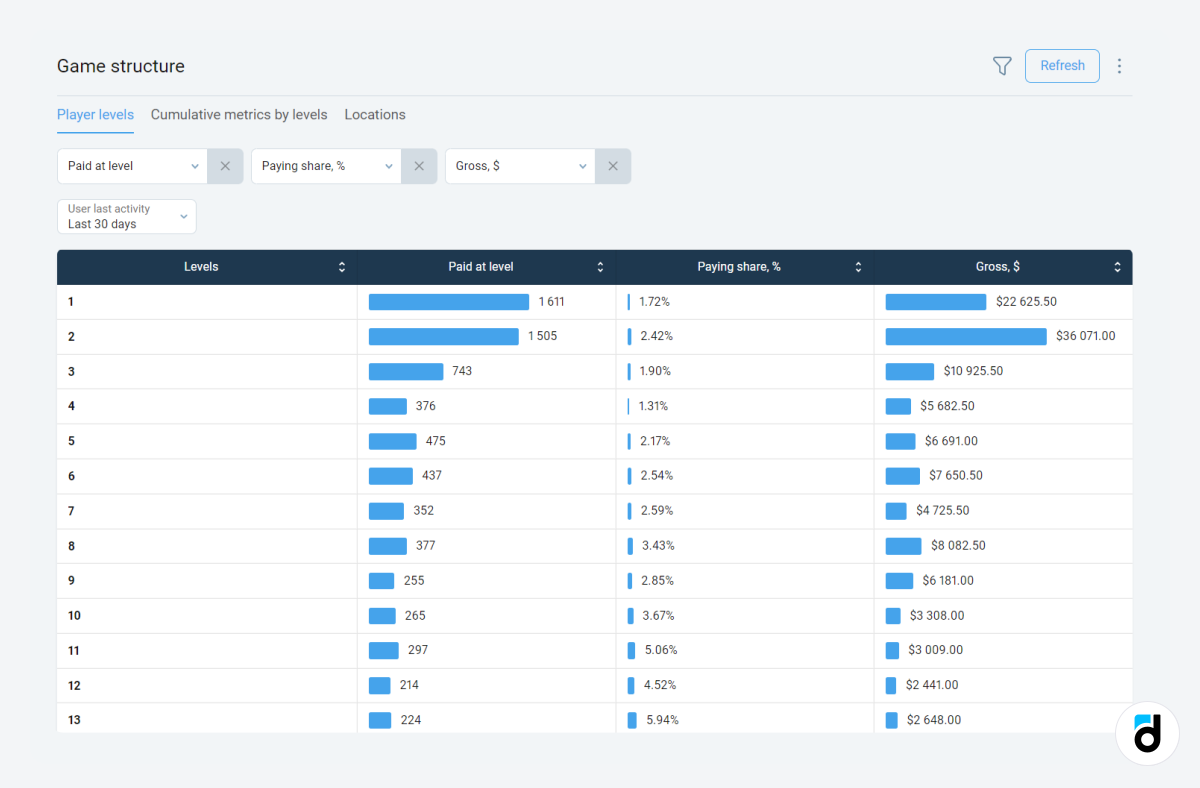
You don’t need to waste time on daily analysis because you can open the overview and get all the information you need.
With the right analytics tool, you can analyze all the revenue streams that your project generates. As you can see, Devtodev is one of the best options available in the market for mobile game and app analytics. It’s quick to implement, cost-effective, and easy to use!


: The Basics")
: The Basics")


 in Mobile Games")
 in Mobile Games")


")
")


")
")


")
")


 Tactics for Mobile Games")
 Tactics for Mobile Games")


