
In the following article you can find information on how to identify and re-engage lapsed or churned users by using the devtodev product analytics platform.
If you manage an app or a game or any other digital product, you certainly have faced a problem of churned users.
Who are they? Churned or lapsed users are any inactive users who haven’t interacted with your product for a certain period of time.
Why are they a problem for your business? Because they are the people who are already familiar with your product, probably you even spent money and effort on acquiring them but they don’t use your product anymore and therefore don’t earn revenue for you.
Read our free book: In-game Store: How to Boost your Revenue
How to Identify Churned Users
So, you’ve decided to increase your revenue by re-engaging your “experienced” users. Where do you find them? Let’s start with building a segment of churned users.
You can use the following devtodev features:
1. Dynamic segments
Open ‘Users and segments’ -> ‘Segments’. Create a dynamic segment.
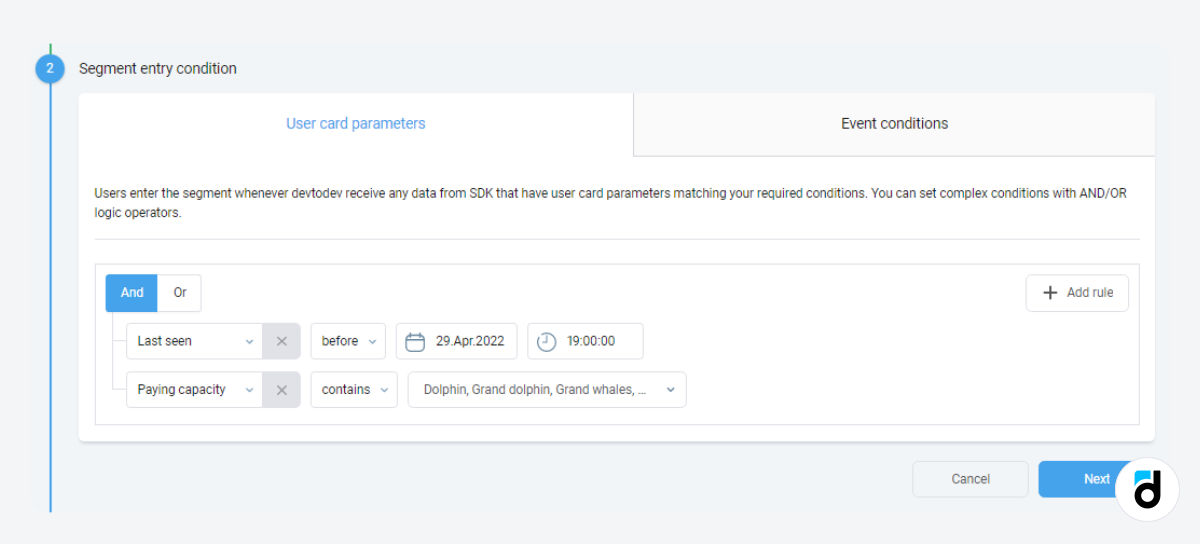
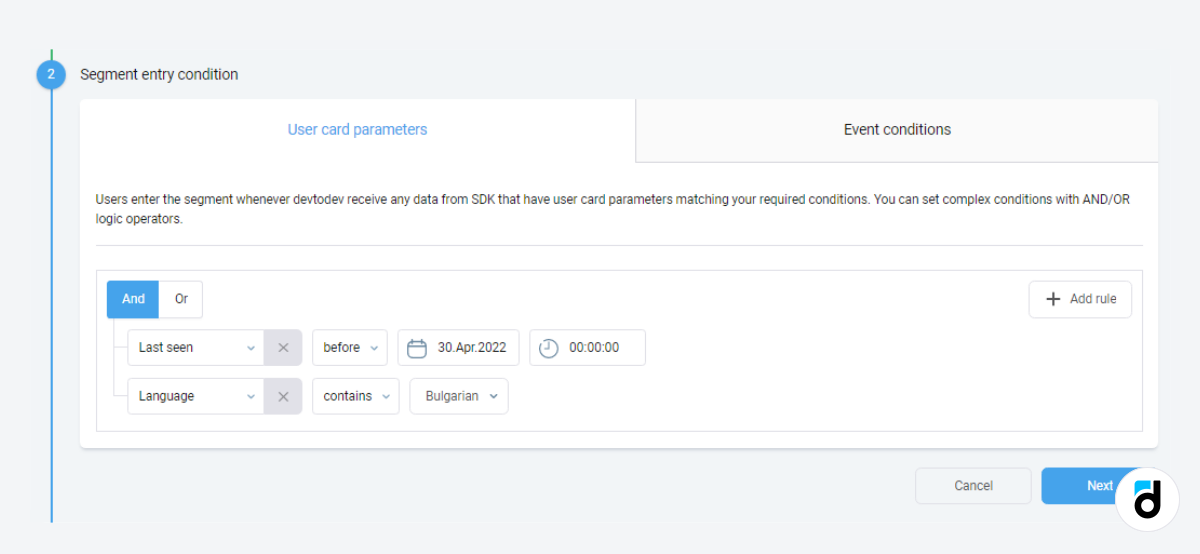
Set the entry condition on the ‘User card parameters’ tab.
Choose the last day the users opened your app (Last seen before).
And then select a property (e.g. you want to find people who left the project on April 29 and who were payers - dolphins or whales)
Then you select the exit condition ->’Users can't leave the segment’ or you can choose one of the exit conditions if you want to fine tune the segment.
2. The ‘Users’ section
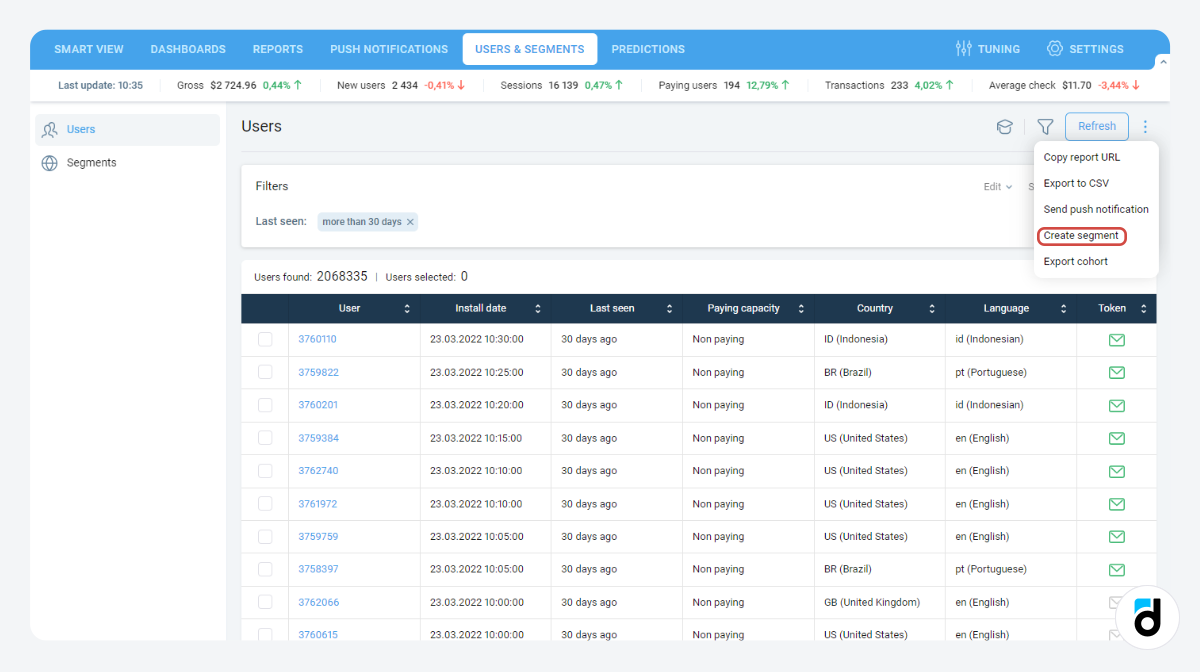
Open ‘Users and segments’ -> ‘Users’, filter by ‘Last seen’ and create a segment by selecting the corresponding option from the drop-down menu in the top right corner.
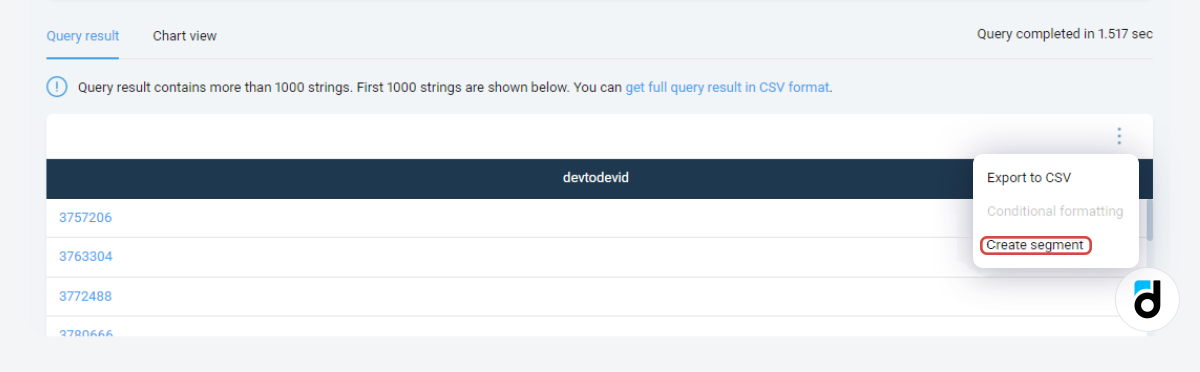
3. SQL
The third way is by using the SQL report. Each user has the ‘lasttime’ field (the date the user opened the app for the last time). You can set an interval or a specific date and create a static segment.
Read more: Glossary of Ad Monetization Terms and Metrics
Segment Them Further
Obviously, you don’t want to work with all churned users because they vary greatly and you need different approaches to them. Therefore, you want to segment them further into much smaller groups.
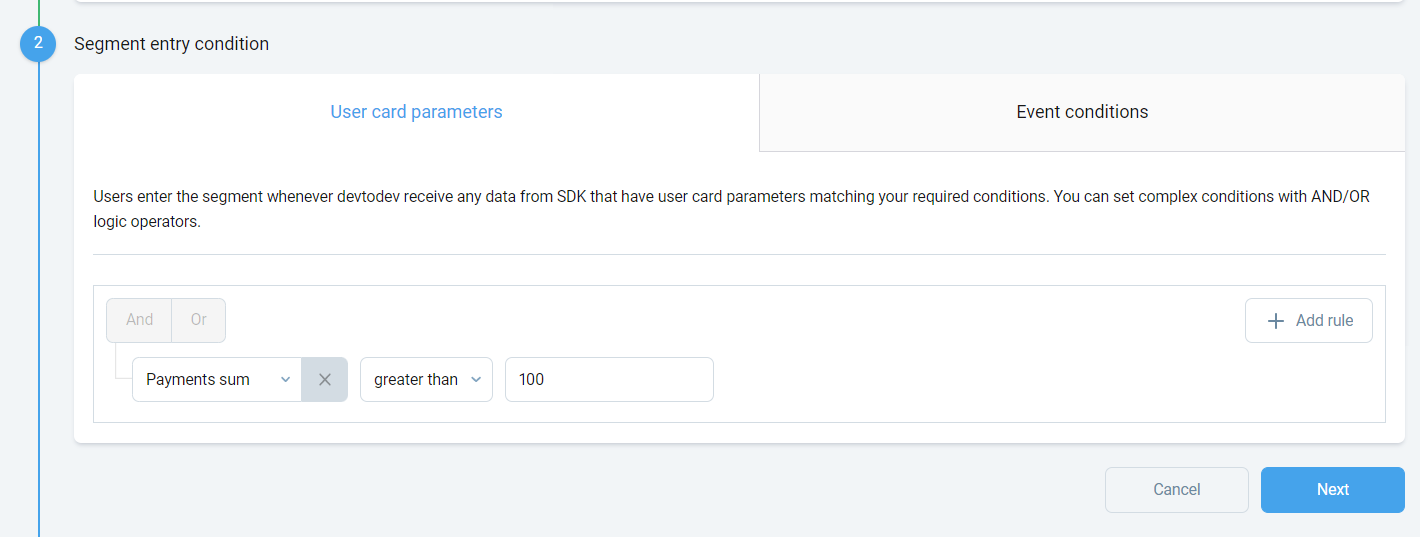
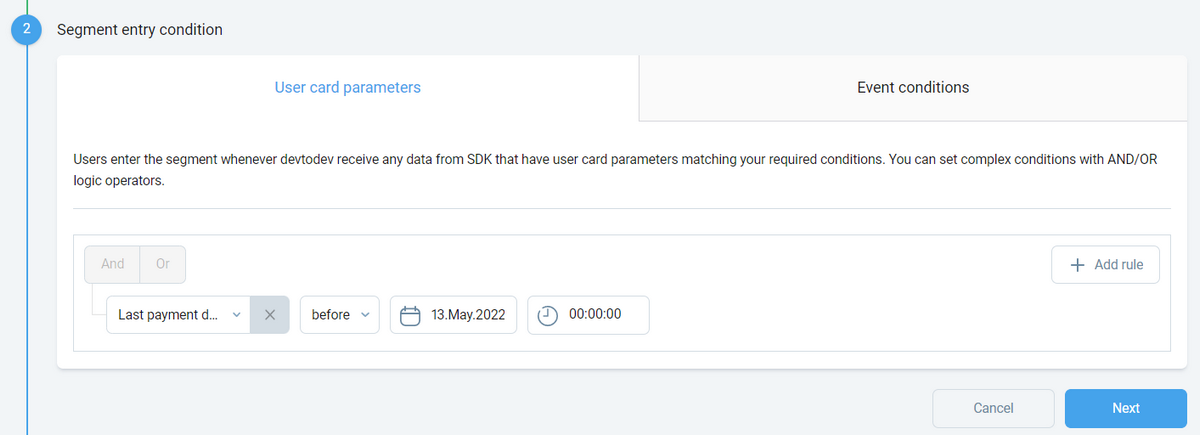
If you use the first method, you can apply some segmentation right there. You can build a segment of users who paid a certain sum of money:
Or to the ones who made their last purchase before a certain date:
Or to Bulgarian speakers:
The same goes with SQL. You are free to use the entire range of options provided by this language and extract the exact group of people you want to work with.
Read more: SQL for Beginners: Basic Metrics of Several Apps
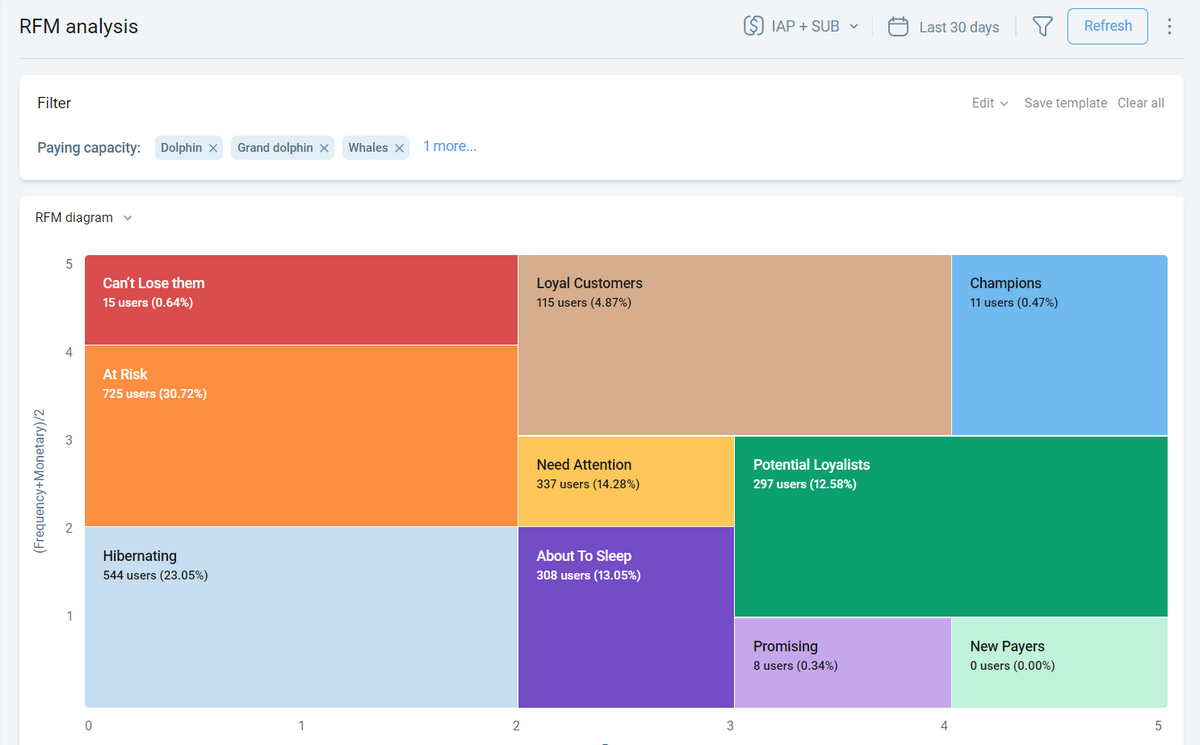
However, devtodev has one more great report for finding the exact users you want to keep with you at all cost - and that is RFM.
Open the report (Smart view -> Monetization -> RFM analysis), click ‘Filters’ in the top right corner and set the filter or select the segment you want to analyse.
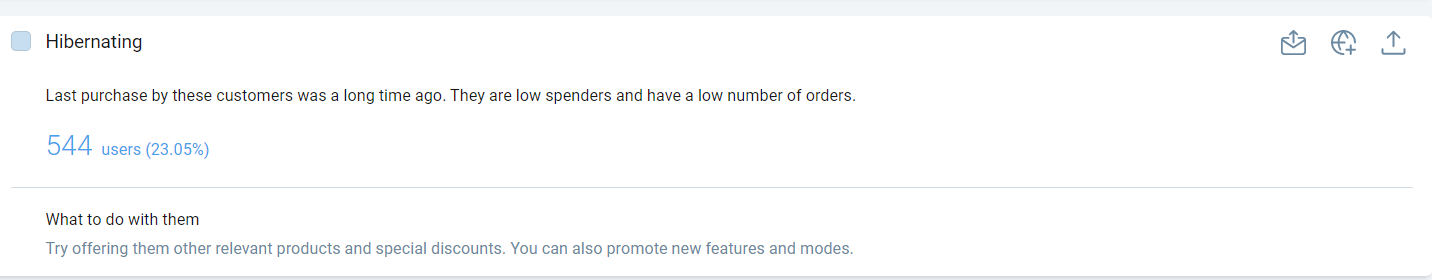
For example, here you can see that there are 544 users (Hibernating) who spent more than $20 on purchases but haven’t paid recently and haven’t opened the app for 15 days or more (you can change these numbers by clicking ‘Configure RFM scores’ in the three-dots menu).
Then you can click the section and save it as a segment.
Read more: RFM Analysis for Customer Segmentation
How to Re-Engage Churned Users
The people in the segments that you’ve just created abandoned your project for a reason. If you eager to re-engage them, you need to make the following two steps:
Step 1. Solve the problem that caused them to drop off
The segments that you created as described above, can be used as filters in the majority of devtodev reports. Use them to:
-
Analyse user behaviour and compare behaviour of lapsed users with those who still use the app (e.g. the New user path, Retention by event reports)
-
Analyse user actions before they drop off (the User flow report)
-
Analyse their purchasing power, the items they bought - probably they were disappointing (the Virtual goods & purchases, RFM analysis reports)
-
Find out the levels where they drop off most often and change their difficulty or add more content (the Game structure report)
-
Analyse the onboarding process (the Tutorial analysis report)
Step 2. Work with the churned users
So, at this step you already have very narrow segments of users that you want to re-engage. The only way of doing so is through direct contact with them.
However, your available options are quite limited.
What devtodev tools can you use?
Push notifications of all kinds (they are described in this article in great details).
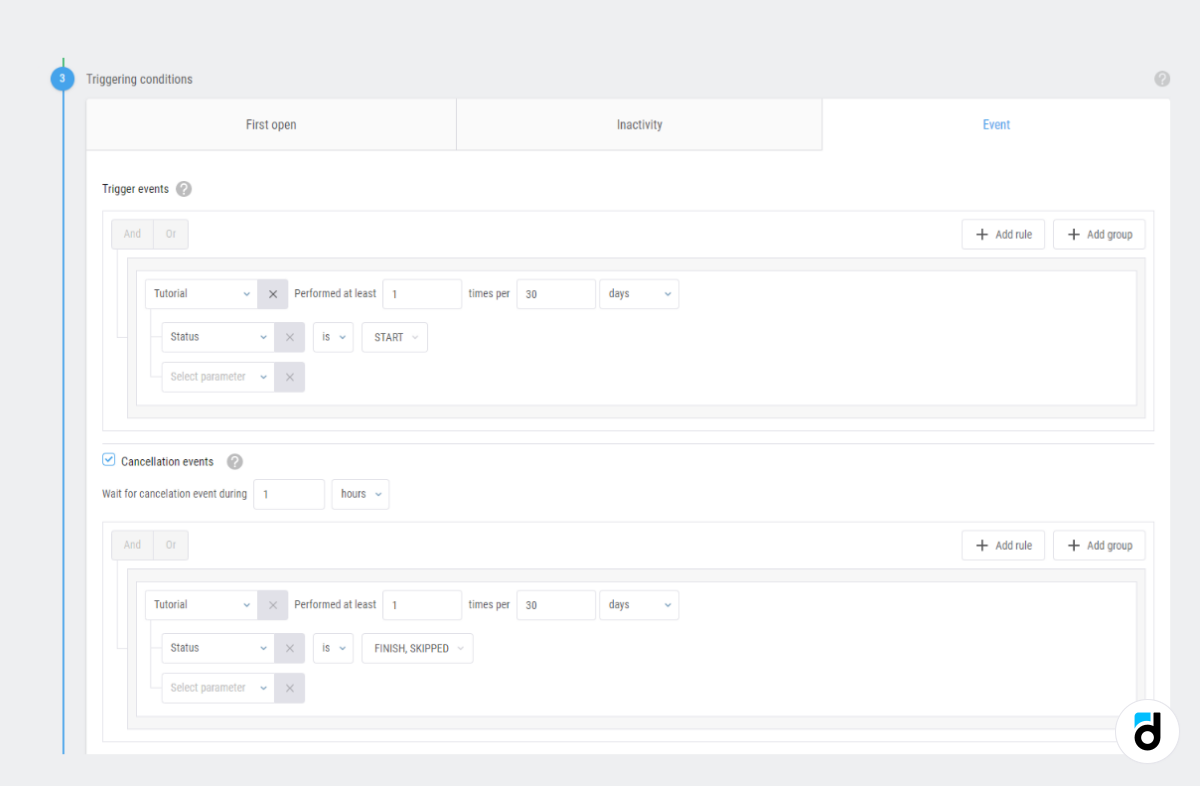
You can send them using the separate functionality from the main menu, or you can send them right from some reports, e.g. click the letter icon in the SQL report.
Churn Rate Overview
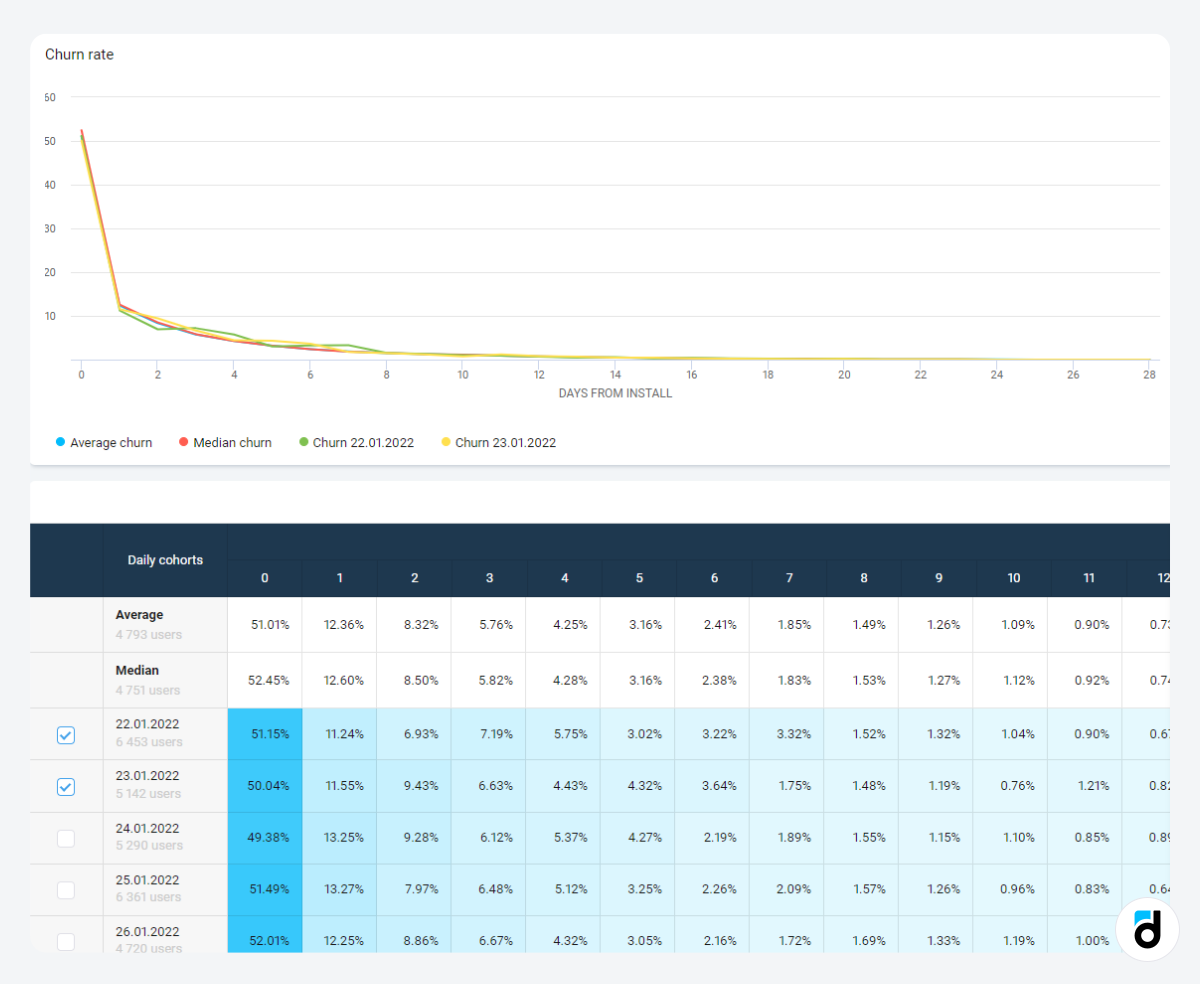
After you finish your work with churned users, you can compare the ‘churn rate’ metric before and after and see if the result satisfies you.
If you want to take a quick look at churn rate for the past week, last 30 or 90 days, etc., open Smart view -> Engagement -> Churn rate, select the churn period (this number of days need to pass before you consider users as churned) and click Refresh in the top right corner.
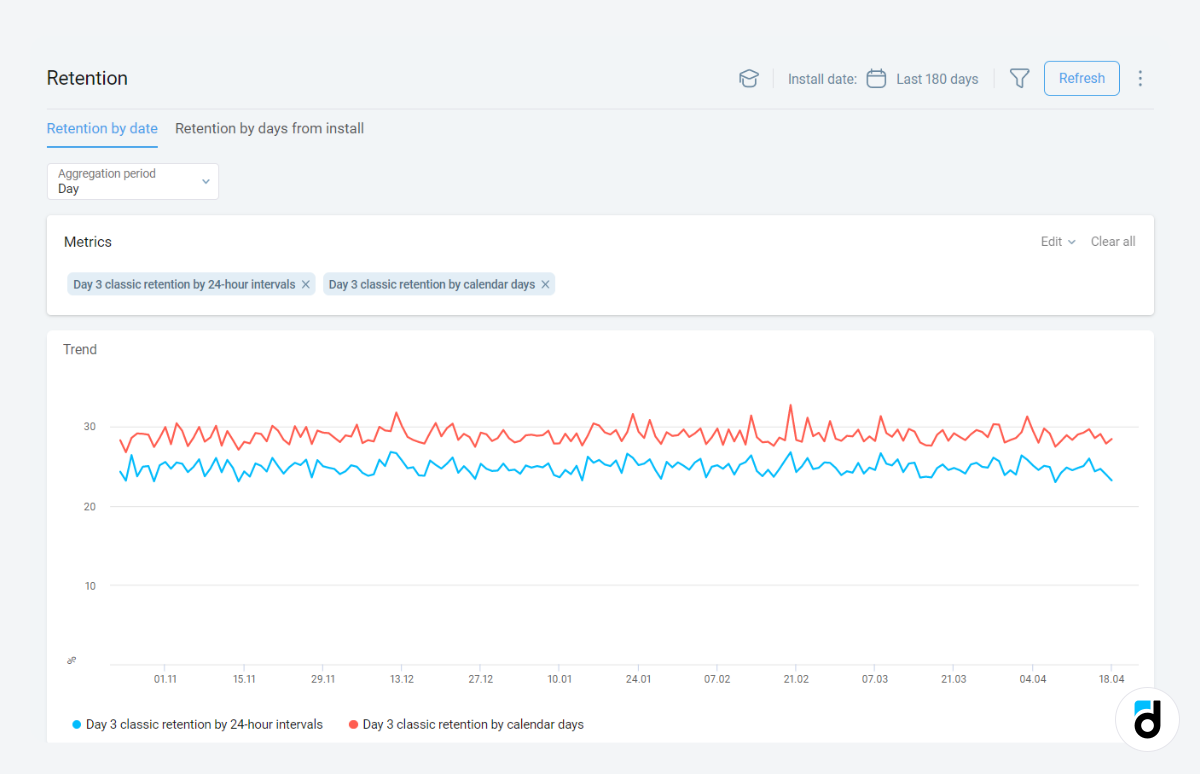
Another way to look at the number of churned users is through the Retention report. Here you can find more generalised data. For example, the percentage of people who continue using your project three days after installation (day 3 retention of any kind)
So, now you have extremely practical information on how to identify and re-engage your lapsed or churned users. Apply this in your project and make it even better!