
devtodev is helping you keep in touch with what’s happening in the game market. Every month we publish an overview of reports on the most popular games worldwide, top-grossing games, successful releases, favorite video game types, trends, etc. This overview is prepared by Dmitriy Byshonkov - the author of the GameDev Reports by devtodev Telegram channel. You can read the March and April reports.
Contents
- Newzoo: Cross-platform players are spending more time & buying more often in games
- Skillsearch: 80% of Gaming Industry workers would like to try a 4-day working week
- Apptica: Mobile Puzzles market in Q1 2023
- Circana: The US Gaming Market dropped by 5% in April 2023
- data.ai: State of Mobile Games Revenue 2023
- GSD: Game sales in Europe dropped in April 2023; hardware sales skyrocketed
- Hogwarts Legacy earned $1B+ in Q1 2023
- SocialPeta: Mobile Game Marketing Trends in Q1 2023
- Tenjin: Hypercasual and Hybridcasual Market in 2022 Report
- AppMagic: Top Mobile Games by Revenue & Downloads in April 2023
- GSD: The UK Gaming market in April declined
- SGA: Serbian game industry in 2023
- Stream Hatchet: Video Games Streaming in Q1 2023
- Star Wars is the most popular IP in the UK gaming retail since 1993
- Sony is breaking records with PlayStation 5
- Newzoo: Hogwarts Legacy is the top-grossing title on PC & Consoles in Q1 2023 in the US & UK
- AppMagic: Pokemon GO in April 2023 reached the minimum revenue in 5 years
Newzoo: Cross-platform players are spending more time & buying more often in games
More than 42 thousand people from different parts of the world participated in the research.
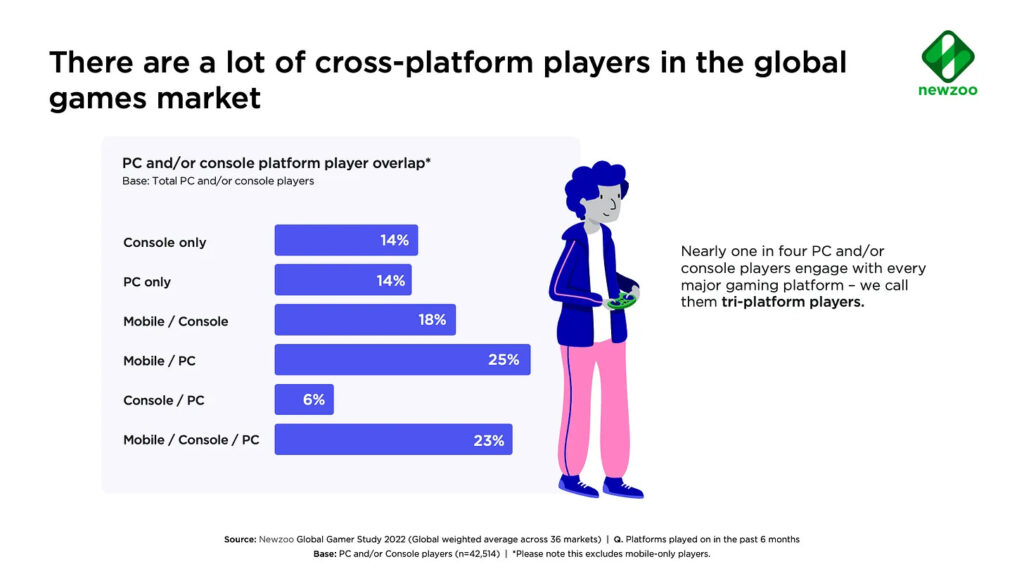
- Almost every fourth player has played on three platforms - PC, console, and Mobile - in the last half a year. Newzoo is naming such users as tri-platform players.
- The smallest audience is choosing PC & Consoles only without paying attention to Mobile, there are only 6% of such users. 14% are playing only on PC or only on Consoles.
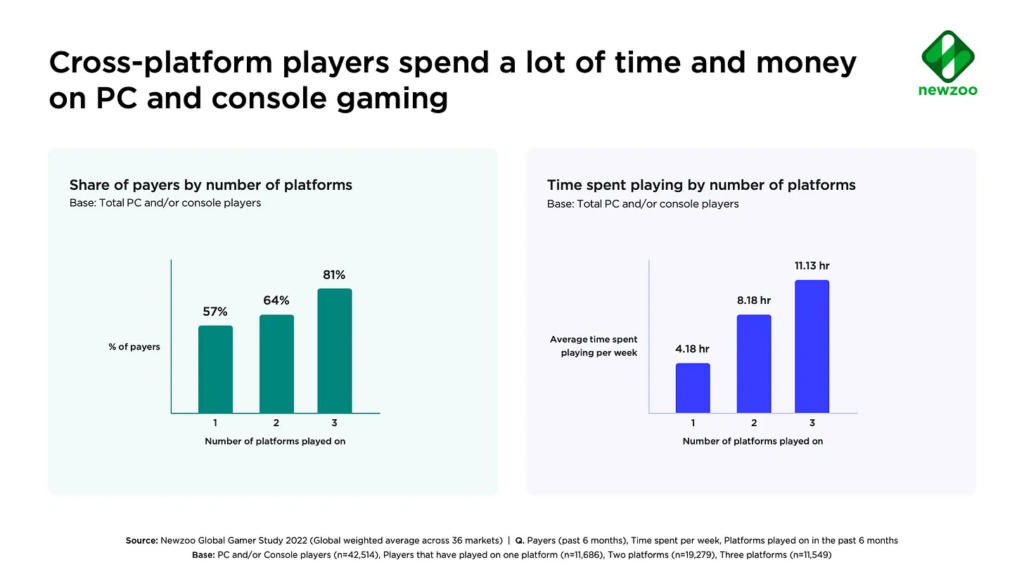
- There is a direct correlation between the number of platforms on which the gamer is playing, the amount of time, and the probability of payment.
-
Among those who are playing on one platform, the paying share is 57%. If the user is playing on two platforms, the probability of making a purchase is up to 64%. If the user is playing on three platforms, there is an 81% chance that he is paying.
-
A similar situation is with time. The player that prefers only one platform is spending on average 4.18h per week on games. If the user is playing on two platforms, the amount of time spent increases to 8.18h per week. Tri-platform players are spending 11.13h weekly.
-
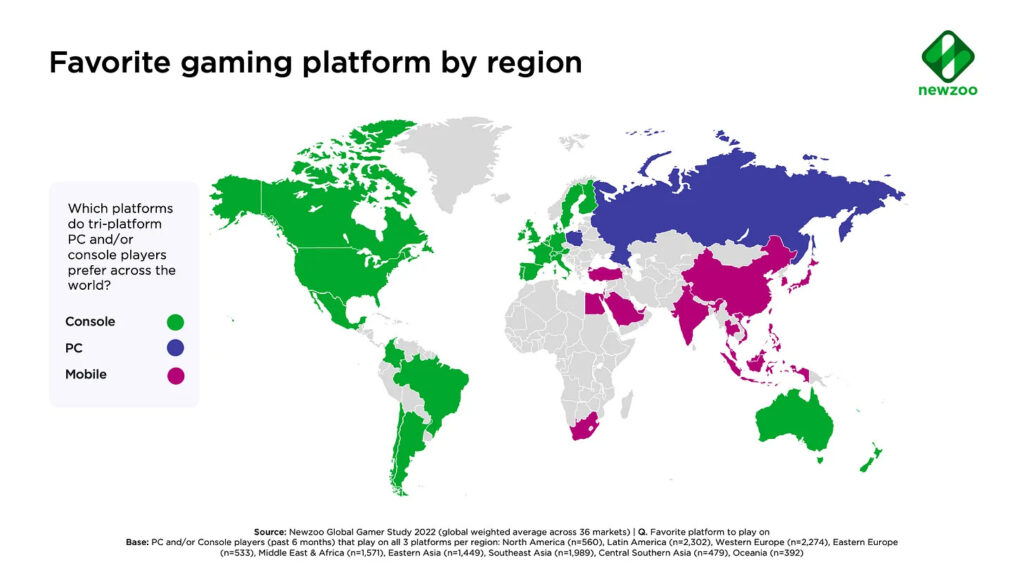
The majority of tri-platform users do prefer consoles (39%). Mobile (30%) and PC (29%) are next.
-
There is a regional pattern in platform preferences. North American and Western European users prefer consoles; Eastern European - PC; Asian - Mobile devices.
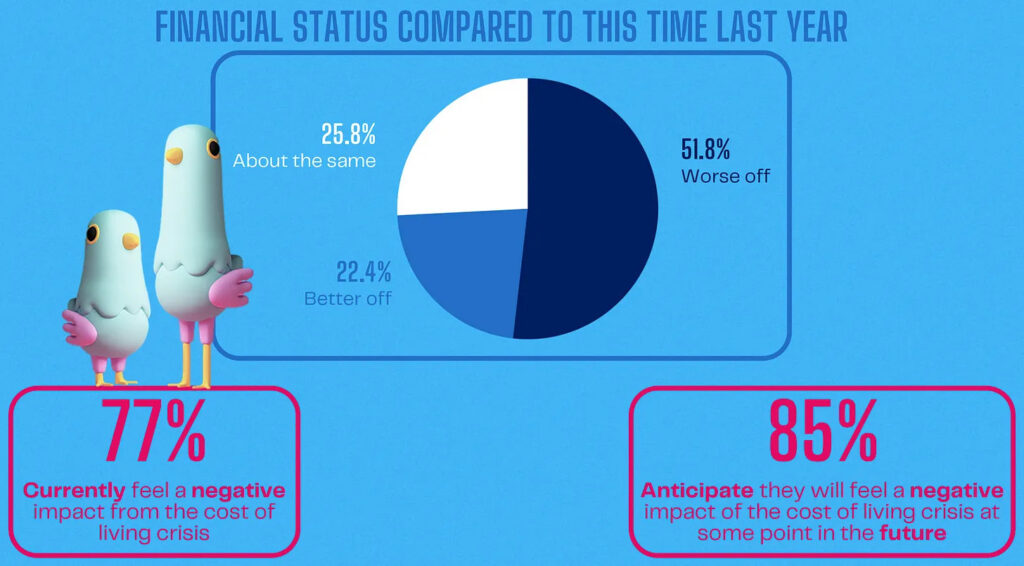
Skillsearch: 80% of Gaming Industry workers would like to try a 4-day working week
Skillsearch published research covering the working schedule, cost of life attitude, psychological conditions, in the gaming industry.
4 days working week
-
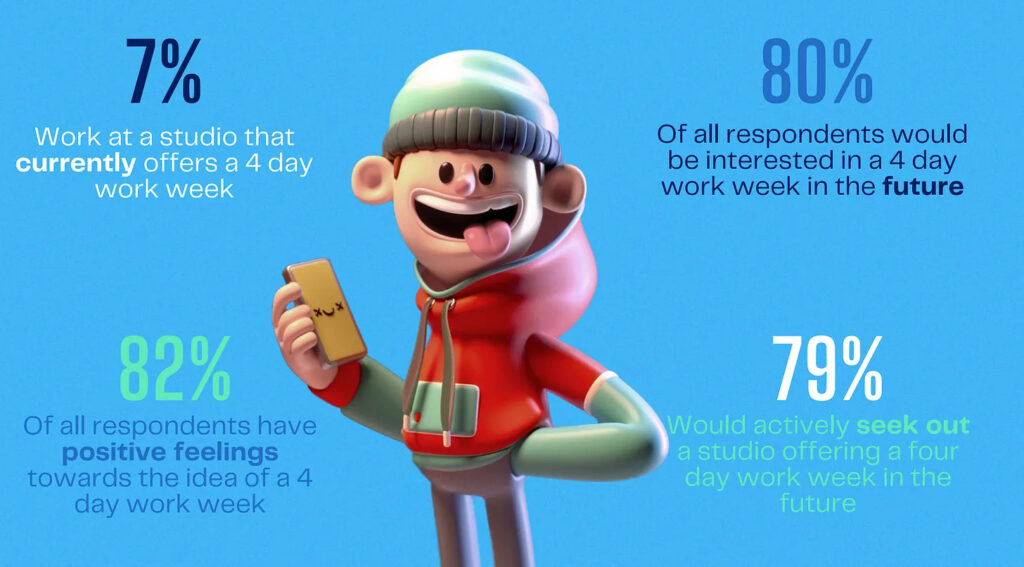
80% of respondents would like at least to try working 4 days per week sometime in the future.
-
Only 7% are working or have worked in the studio, which allowed them to have 4 days working week.
Cost of living
-
77% of respondents told about the negative effect of the increasing cost of living. 85% do expect negative changes in the future.
-
62% of workers feel that employers do not support them during the crisis period. 60% are reviewing the salary increase, and 42% are thinking of a job change because of this.
Psychological conditions
-
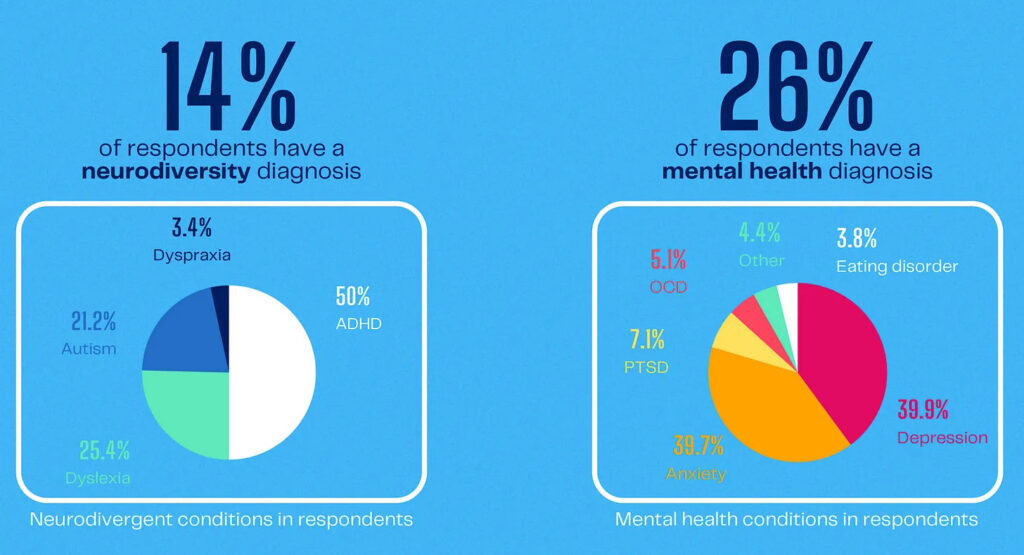
14% of game industry workers do have neurodiversity (ADHD, dyslexia, autism, dyspraxia) diagnosis.
-
26% of game industry employees do have a diagnosis connected with mental health. In most cases, it’s depression (39.9%) and anxiety (39.7%).
-
63% of workers do tell their employers about their conditions only if it affects their performance.
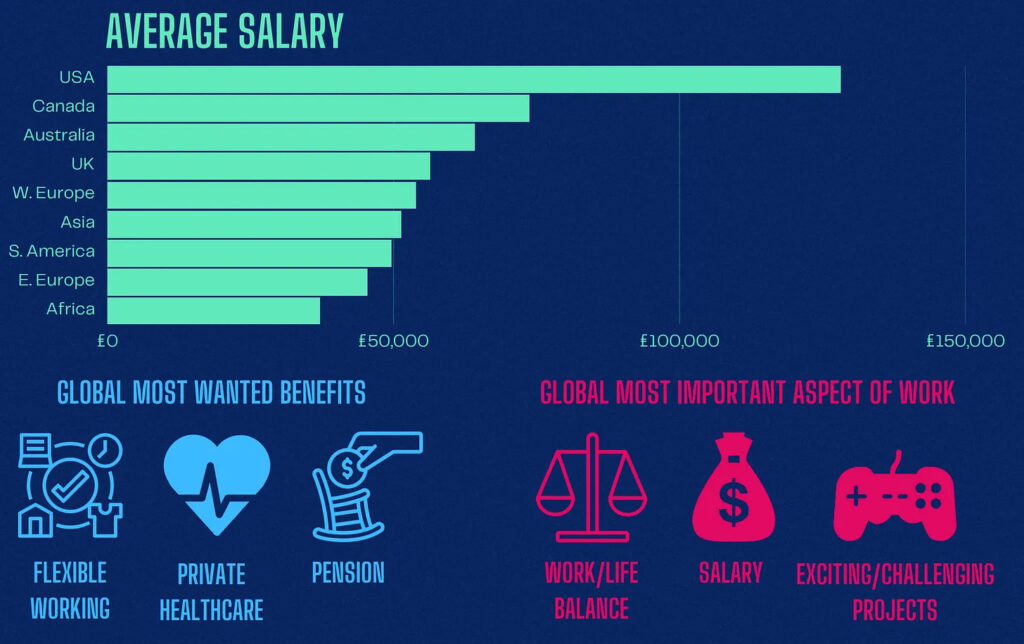
Game industry salaries
-
The average salary in the UK increased to £58k per year.
-
The largest average salary is in the US - about £125k per year. Canada is next with £71k per year. In Western Europe the average salary is about £57k; in Eastern Europe - £43.5k.
-
The smallest annual average salary is in Africa - about £38k.
2023_Games_and_Interactive_Salary_and_Satisfaction_Report
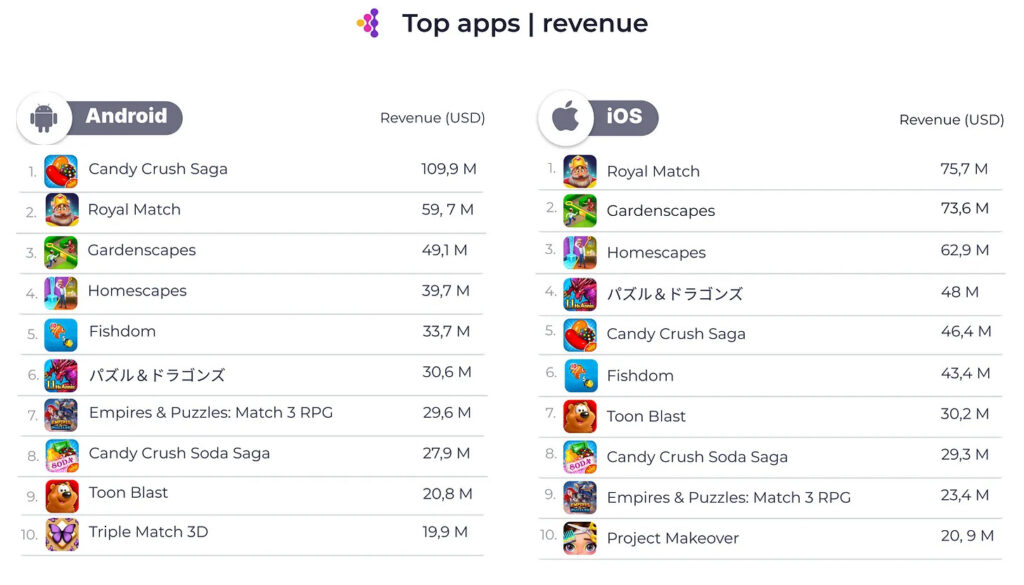
Apptica: Mobile Puzzles market in Q1 2023
The data was collected from 1 January to 31 March 2023 in 35 countries.
Top charts
-
Royal Match, Gardenscapes, and Homescapes are the top-grossing puzzle games of Q1 2023 on iOS. Leaders on Android are Candy Crush Saga, Royal Match, and Gardenscapes.
-
Candy Crush Saga is the leader by revenue from two platforms combined with $156.3M.
-
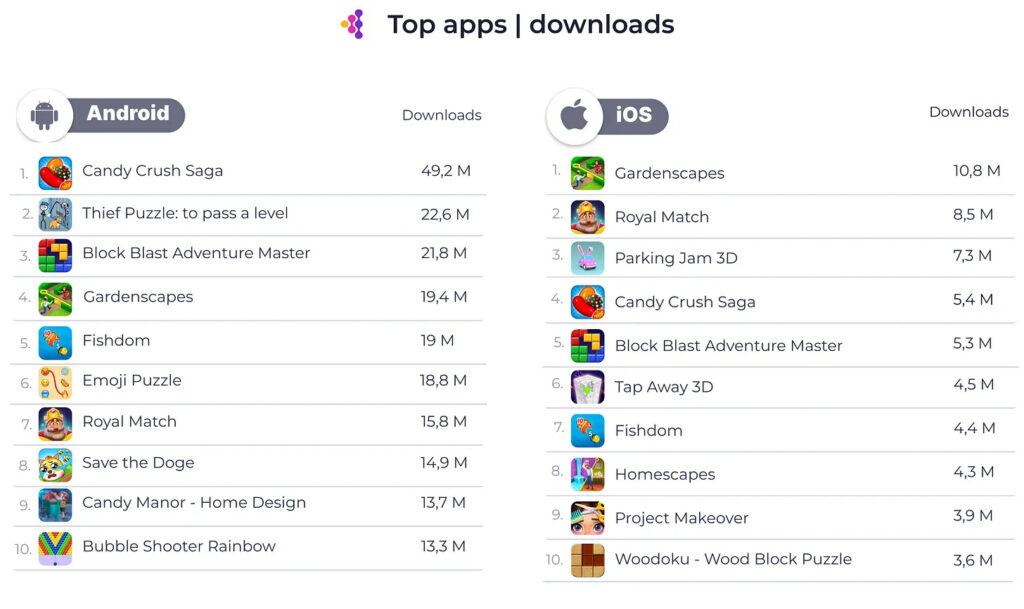
Gardenscapes, Royal Match, Parking Jam 3D are top titles by downloads on iOS. Candy Crush Saga, Thief Puzzle: To pass a Level, Block Blast Adventure Master is leading on Android.
-
Candy Crush Saga is also the leader in Q1 2023 by downloads (54.6M installs).
-
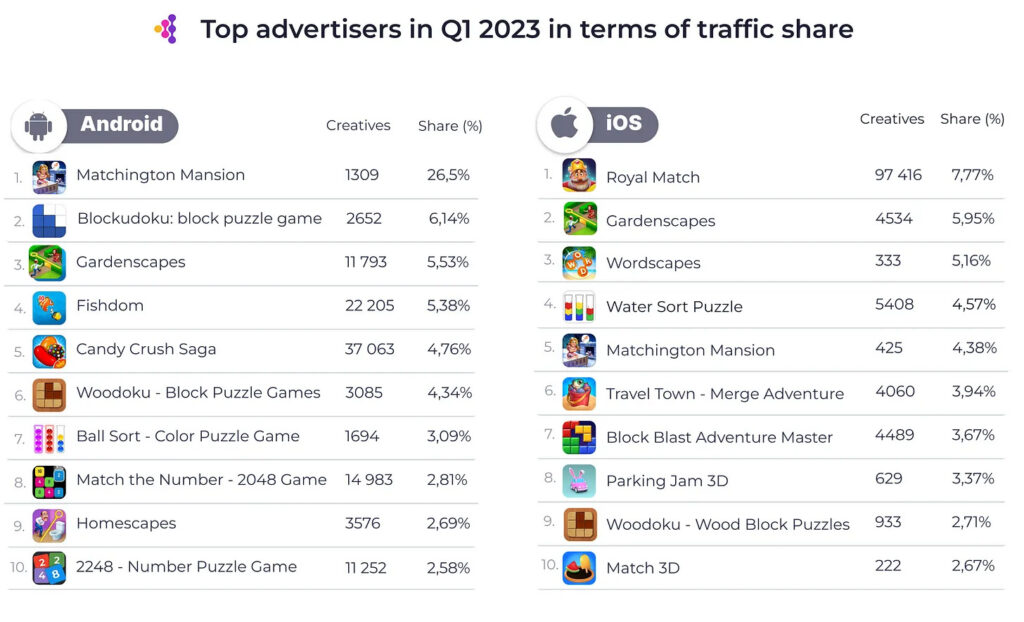
The top games by advertising on iOS are Royal Match (97,416 creatives - 7.77% of paid traffic); Gardenscapes (4,534 creatives - 5.95% of paid traffic), and Wordscapes (333 creatives - 5.16% of paid traffic). On Android are Matchington Mansion (1,309 creatives - 26.5% of paid traffic), Blockudoku: Block Puzzle Game (2,652 creatives - 6.14% of paid traffic), and Gardenscapes (11,793 creatives - 5.53% of paid traffic). The % of paid traffic is related to all paid traffic in the category.
Category overview
-
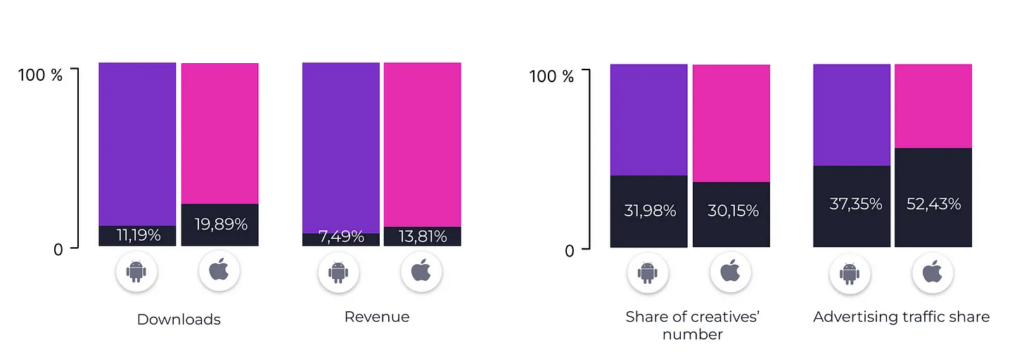
Puzzles are generating 11.19% of all Android downloads and 19.89% of downloads on iOS.
-
Puzzles are responsible for 7.49% of iOS and 13.81% of Android revenues.
-
Puzzle games are getting 31.98% of creatives and 37.35% of paid traffic on Android; on iOS it’s 30.15% of creatives and 52.43% of paid traffic.
-
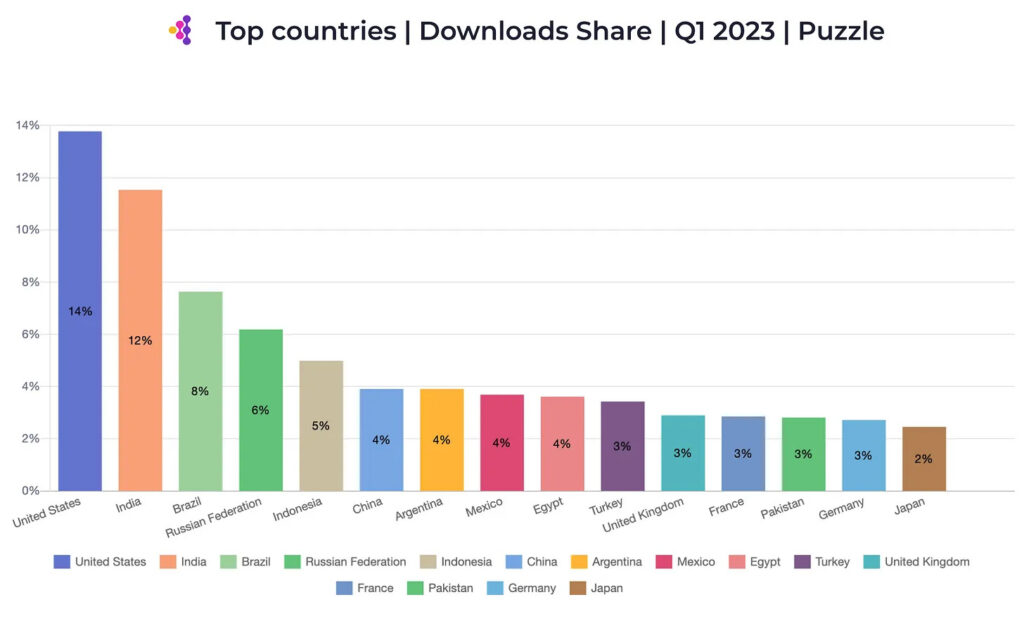
The US (14%), India (12%), Brazil (8%), Russia (6%), and Indonesia (5%) are countries in Q1 2023 with the most downloads for puzzle games.
-
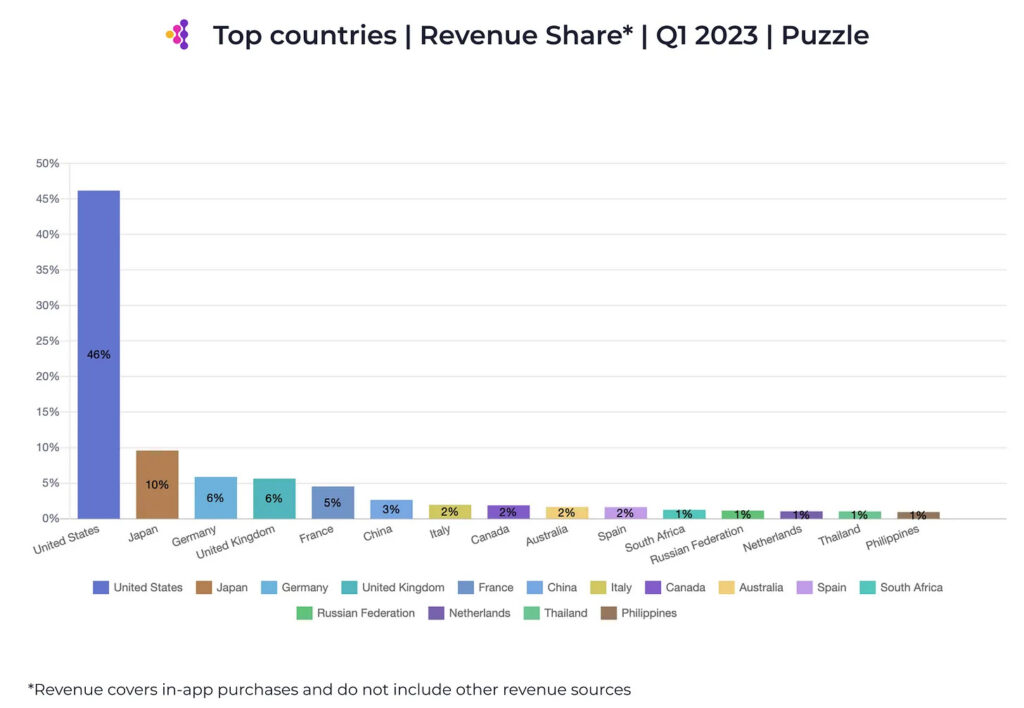
The US (46%), Japan (10%), Germany (6%), the UK (6%), and France (5%) are leaders in Q1 2023 by IAP revenue.
-
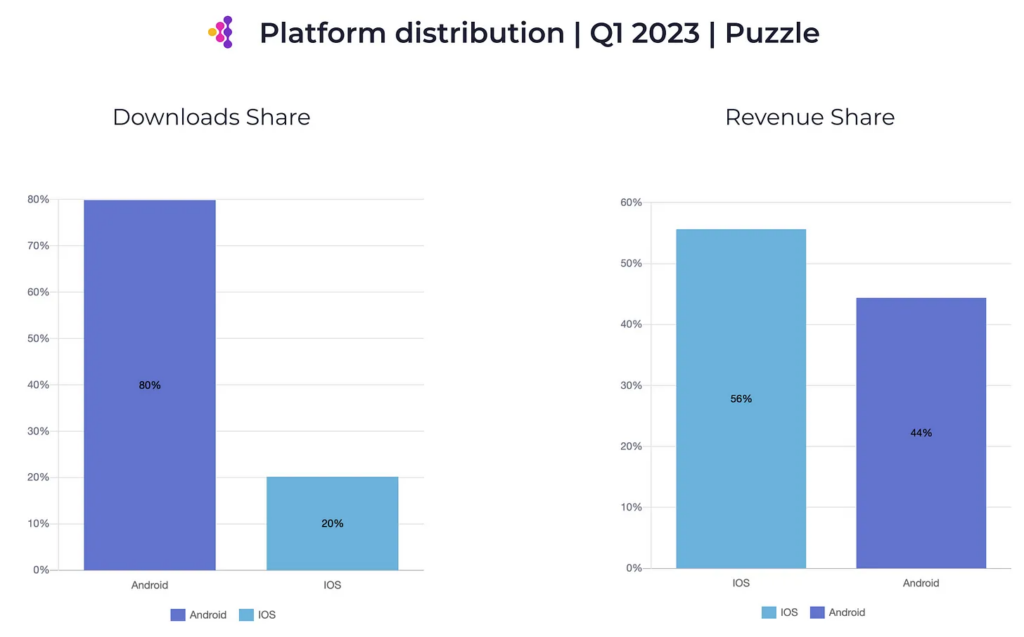
Despite the fact that iOS is getting only 20% of downloads, it’s generating 56% of all Puzzle revenue. Android is getting 80% of downloads with 44% of revenue.
-
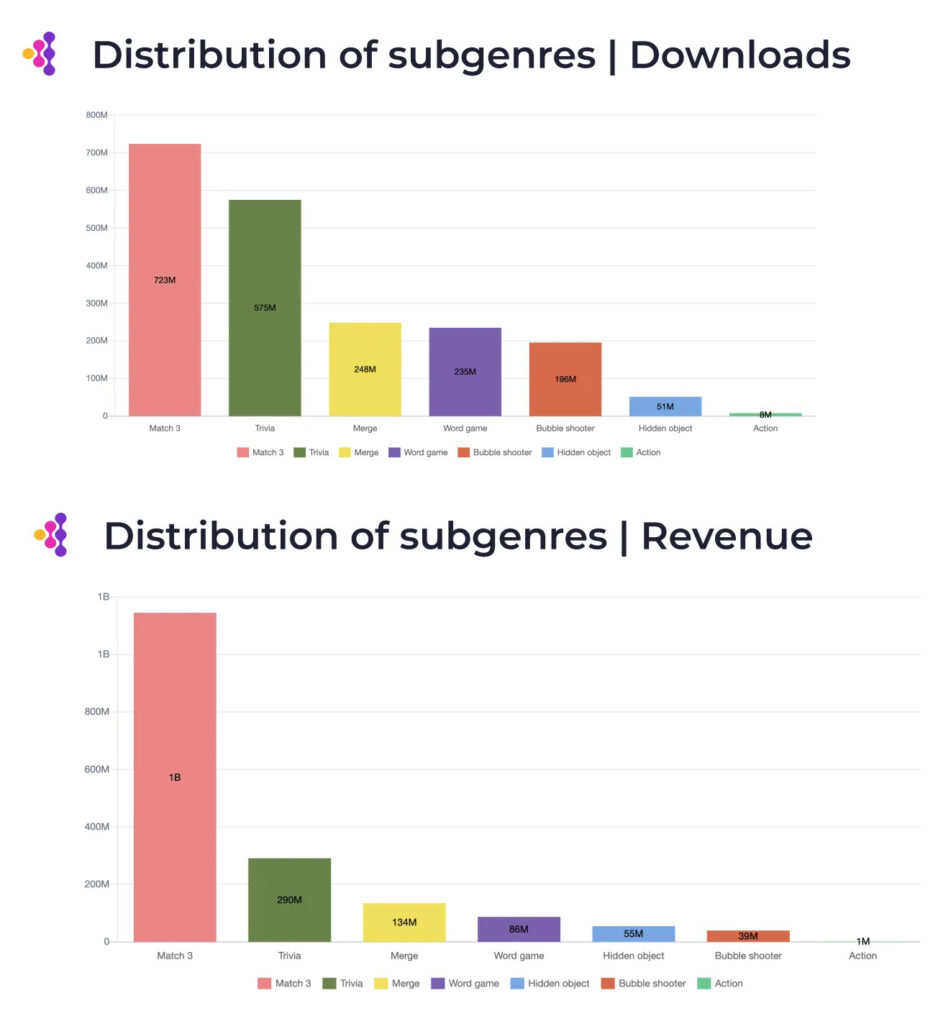
Match 3 is the leader by downloads (36%) and revenue (65%) in the genre. Trivia, Merge, and word games are next.
-
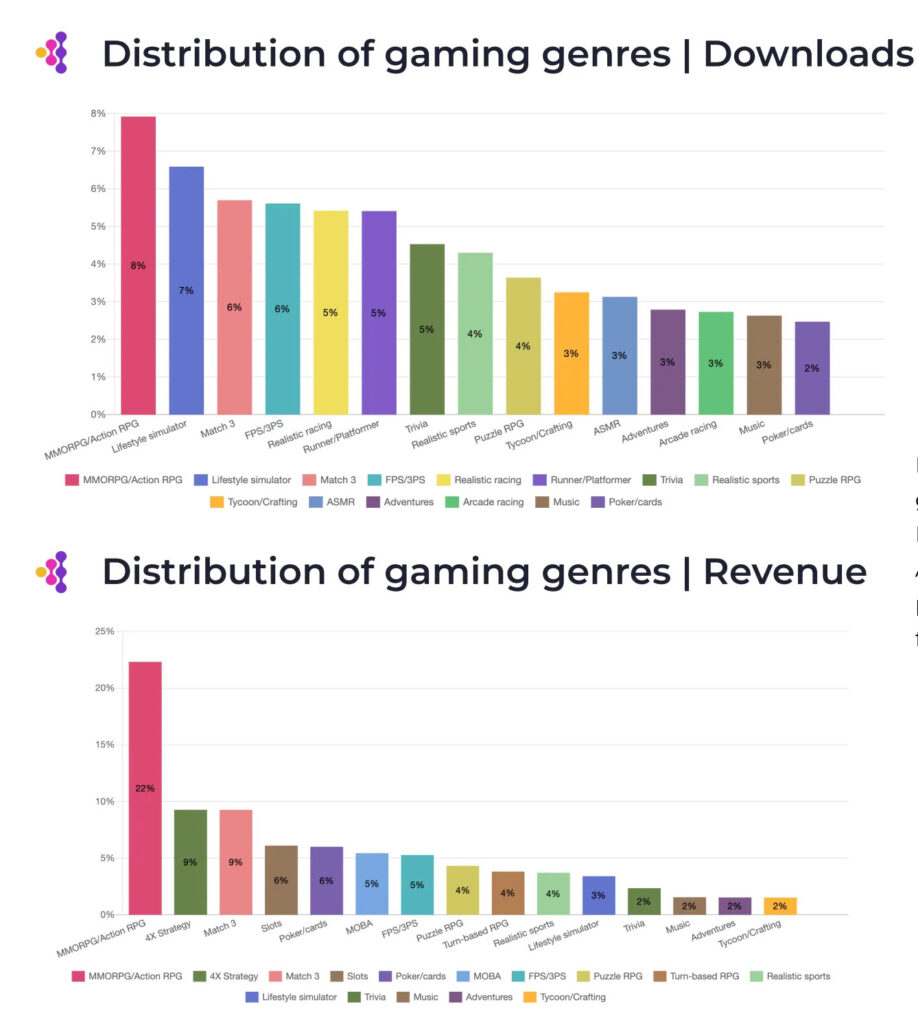
Match 3 is generating 6% of all mobile genre downloads.
-
Regarding revenue, Match 3 shares second place with 4X Strategies (9%). MMORPG is in first place by far (22%).
Circana: The US Gaming Market dropped by 5% in April 2023

-
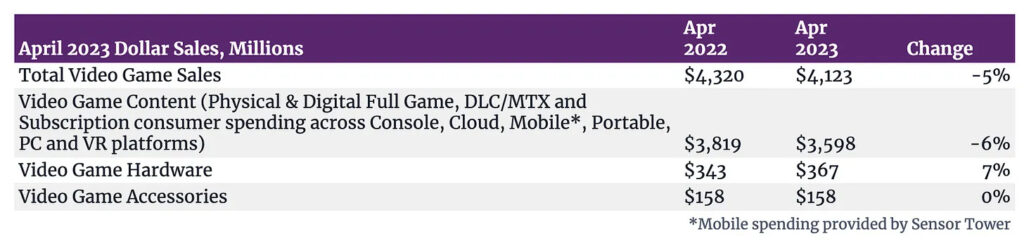
The US gaming market declined by 5% YoY to $4.1B. In the last month, the decrease percentage was the same.
-
Software sales decreased by 6% YoY to $3.6B.
-
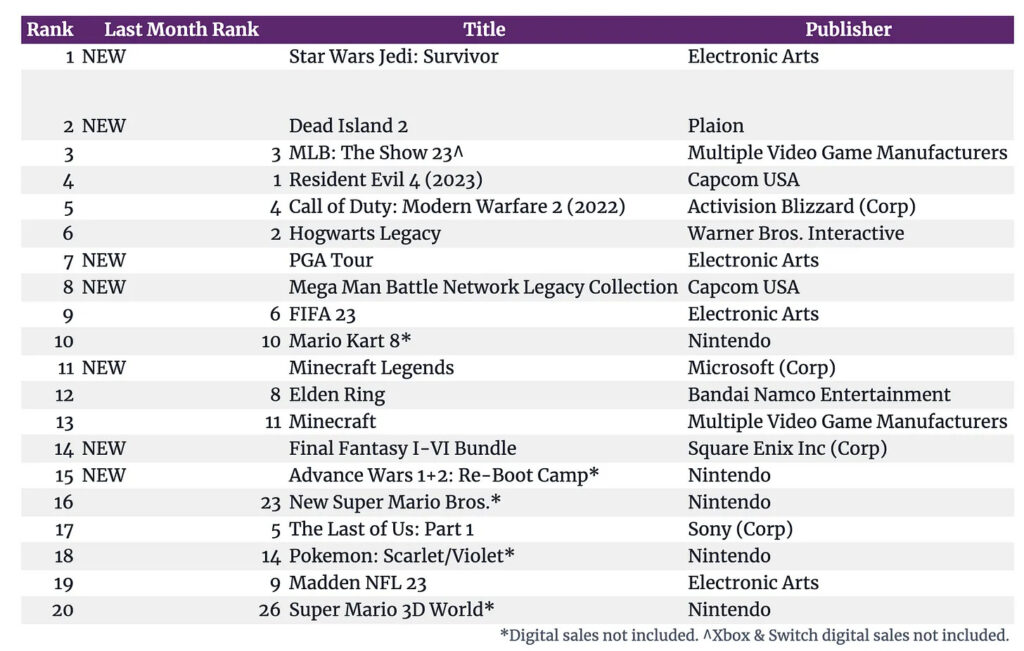
Star Wars Jedi: Survivor is the best-selling game of April; Dead Island 2 is second; MLB: The Show 23 picked third place.
-
7 new titles appeared in the US top-grossing 20. 3 of them are remakes/compilations.
-
US citizens’ spending on hardware increased by 7%, reaching $367M. This is a record number since April 2020 ($420M).
-
PlayStation 5 is the best-selling console by dollar sales. Nintendo Switch is the leader in the number of consoles sold.
-
Accessories sales haven’t changed YoY and remained at the $158M level. The black DualSense is the most popular product.
data.ai: State of Mobile Games Revenue 2023
-
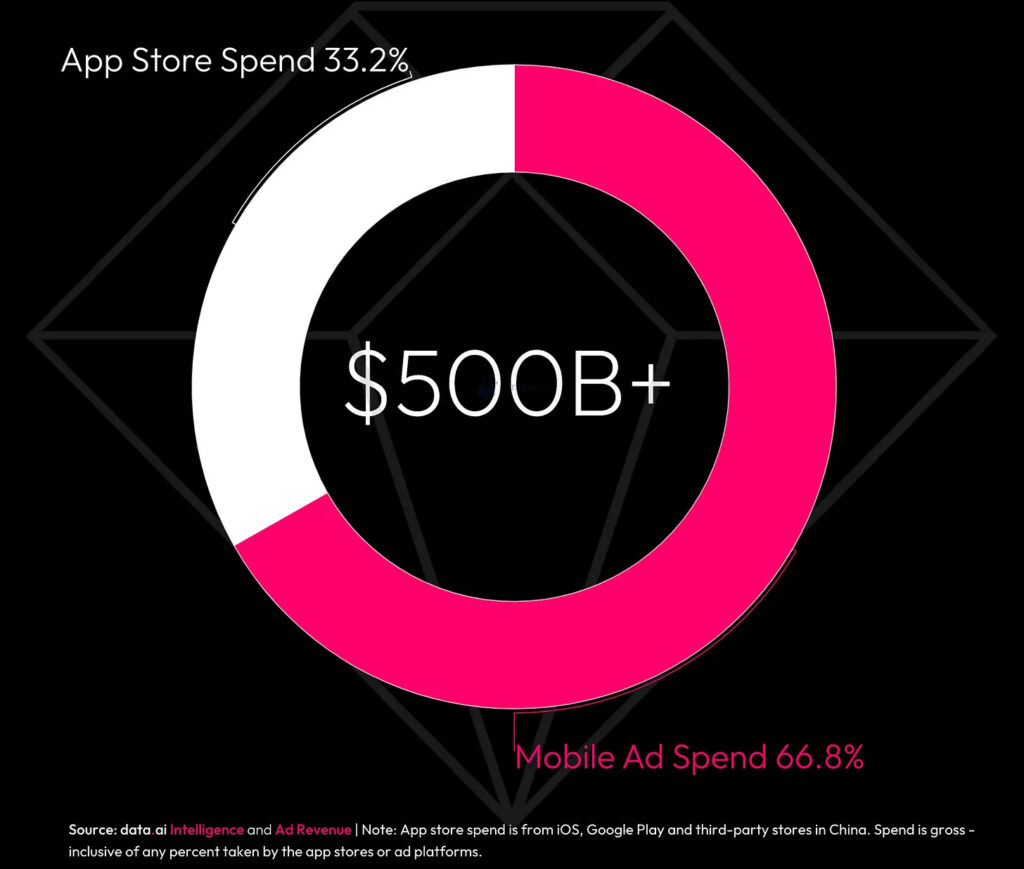
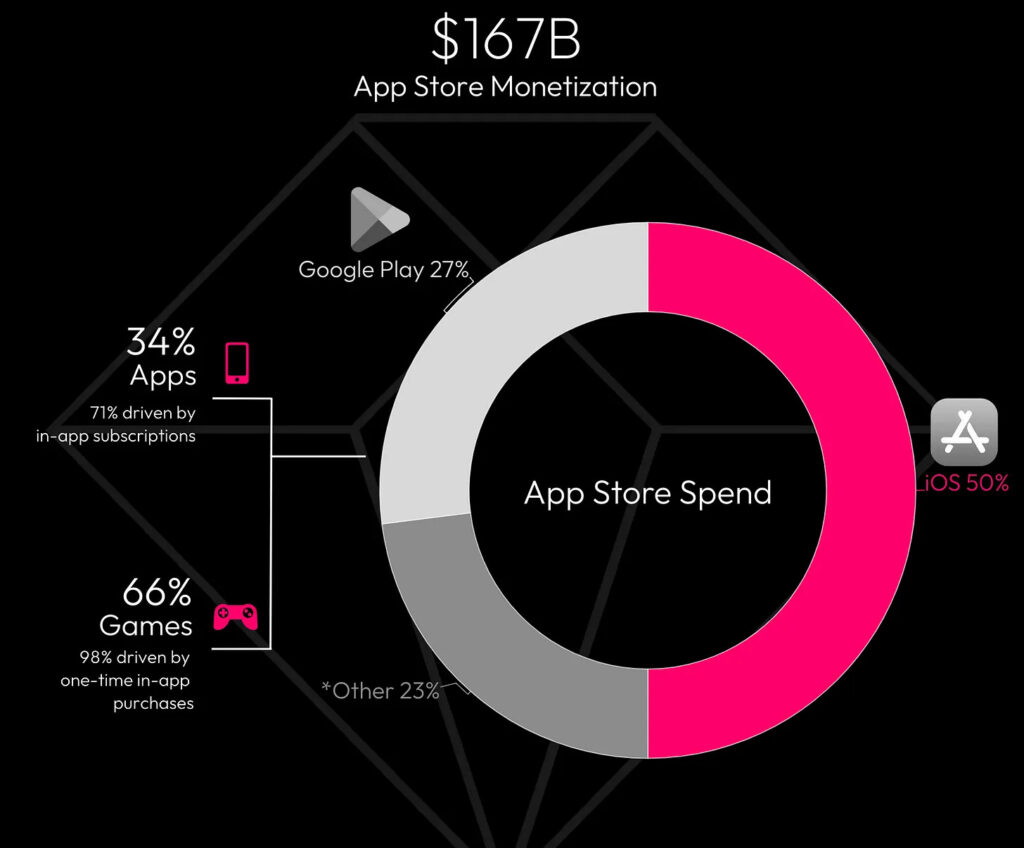
Mobile apps in 2022 earned $500B+. $167M (33.2%) of them came from the IAP purchases. The rest is from ads.
-
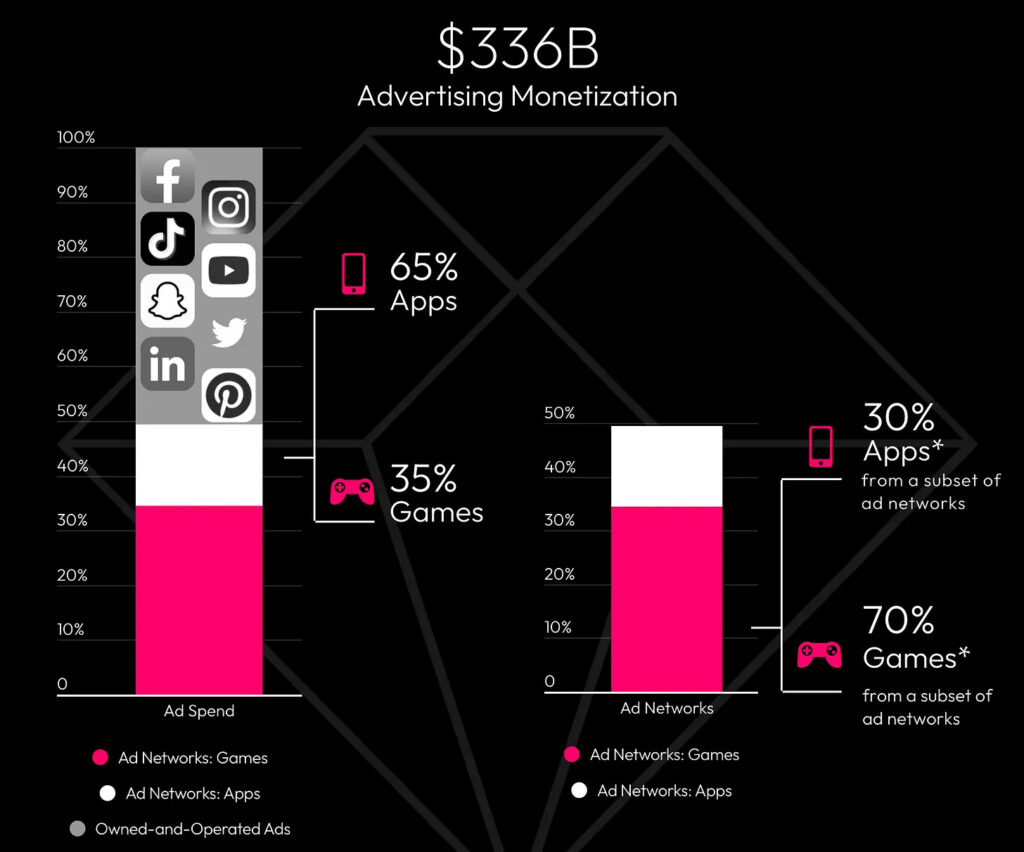
Only 35% of $336B of ad revenue was generated by games. However, if we don’t include giants like Facebook, TikTok, Instagram, YouTube, Snapchat, Twitter, Linkedin, and Pinterest - games are responsible for 70% of all ad revenue.
-
Users have made purchases of $167B in 2022. 66% of this amount came from games.
-
98% of all game IAP revenue comes from one-time IAP purchases (not subscriptions or recurring purchases).
-
App Store is responsible for 50% of all IAP revenue; Google Play - for 27%; 3rd-party Android Store in China - for the remaining 23%.
-
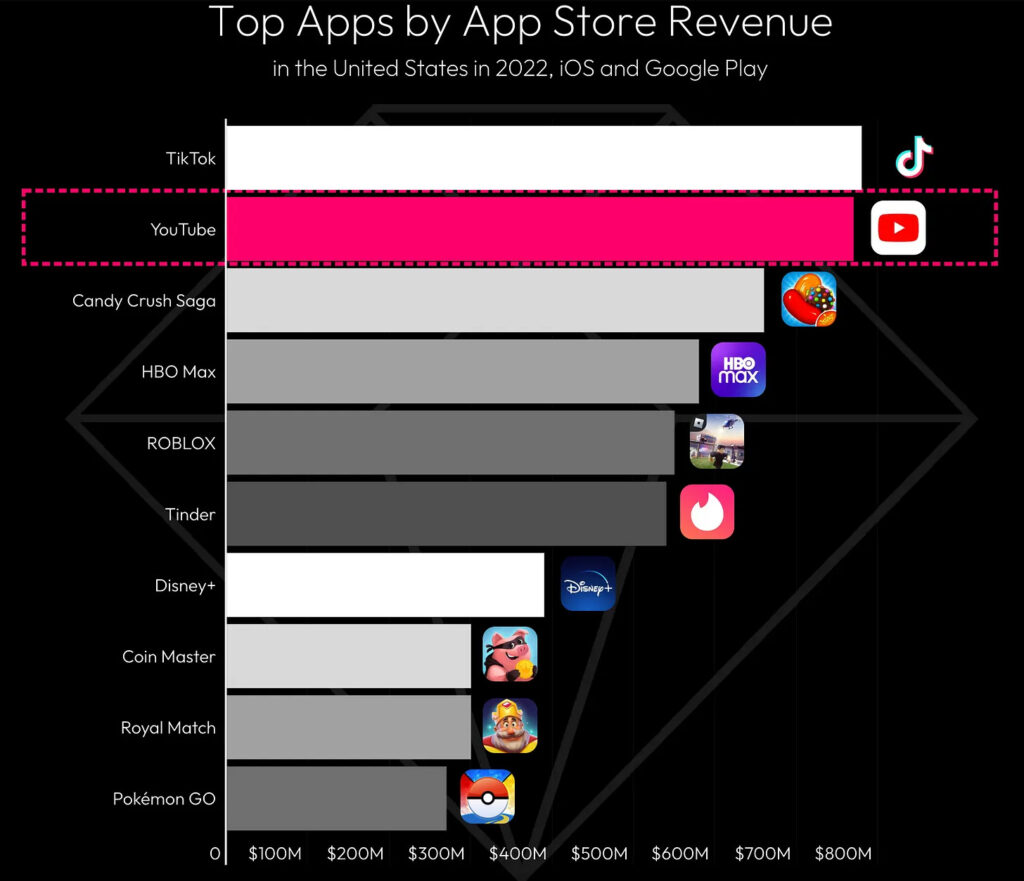
Candy Crush Saga, ROBLOX, Coin Master, Royal Match, and Pokemon GO - in top-10 by revenue in the US in 2022.
-
46% of the world’s ad revenue (by all segments) comes from the US. Asia (23%), Europe (19%), Latin America (7%), and MENA (4%) are next.
-
Amount of users that are making small purchases (up to $9) increased from 43.7% to 44.5%. The number of mid-purchasers (from $10 to $24) remained the same - 31.5%. Slightly increased the share of purchasers with an amount of $100+ - from 12.3% in Q1 2022 to 13.3% in Q1 2023. The share of purchasers with an average cheque from $25 to $99 decreased from 12.5% to 10.8%.
GSD: Game sales in Europe dropped in April 2023; hardware sales skyrocketed

GSD is reporting only the fact sales numbers were received from partners. Some partners (like Nintendo) are not sharing the digital sales numbers, which might affect the overall picture.
Games
-
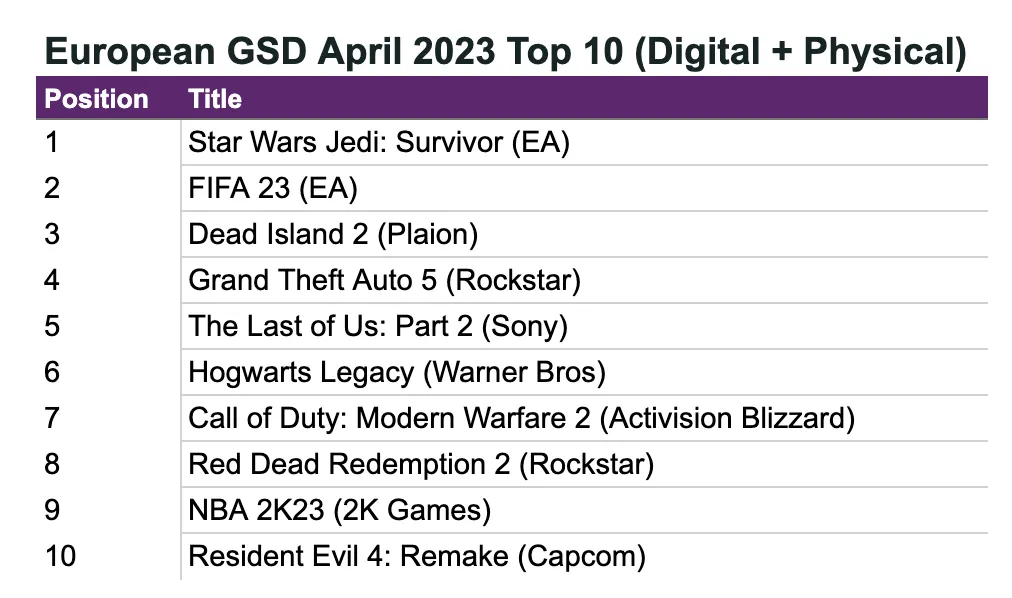
10.4M PC and Console game copies were sold in Europe in April 2023. It’s 5.3% less than a year before.
-
Become the newsletter sponsor
-
Star Wars Jedi: Survivor is the best-selling game of the month. Its sales are already 6% higher than the lifetime sales of Star Wars Jedi: Fallen Order.
-
53% of Star Wars Jedi: Survivor sales came from digital. The predecessor had 35%.
-
Dead Island 2 is third, the first two weeks’ sales are by a third lower than Resident Evil 4 Remake had.
Consoles and accessories
-
Console sales jumped by 58% compared to April last year.
-
PlayStation 5 is showing 144% YoY sales growth. Nintendo Switch sales increased by 38% before The Legend of Zelda: Tears of the Kingdom launch. Xbox Series S|X sales grew by 19%.
-
Nintendo Switch strengthened sales numbers not only to the previous year but to March too. Partly - because of the limited console edition branded with a new The Legend of Zelda title.
-
Accessories sales grew by 11% YoY in April with more than 1.2M devices being sold. DualSense is still a leader.
Hogwarts Legacy earned $1B+ in Q1 2023

Warner Bros. Discovery published a report about Q1 2023 results, which shared the game achievements.
-
$850M has been earned in the first two weeks after the release. The game launched on February 10 earned more than $1B in the first quarter.
-
By the end of March, the number of sales reached 15M copies. 12M of them have been sold in the first two weeks.
-
In Q1 2023 Hogwarts Legacy generated 9% of the whole Warner Bros. Discovery revenue.
SocialPeta: Mobile Game Marketing Trends in Q1 2023
-
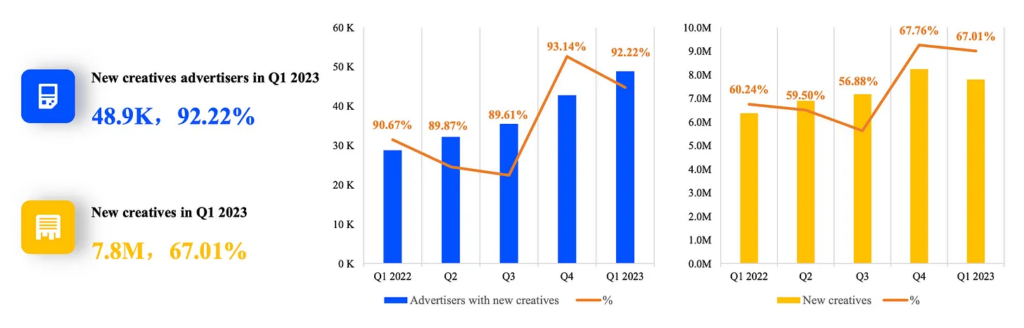
92.22% of advertisers (48.9k) in Q1 2023 used new creatives.
-
7.8M new creatives have been published in the market in Q1 2023. The share of new creatives was 67.01%.
-
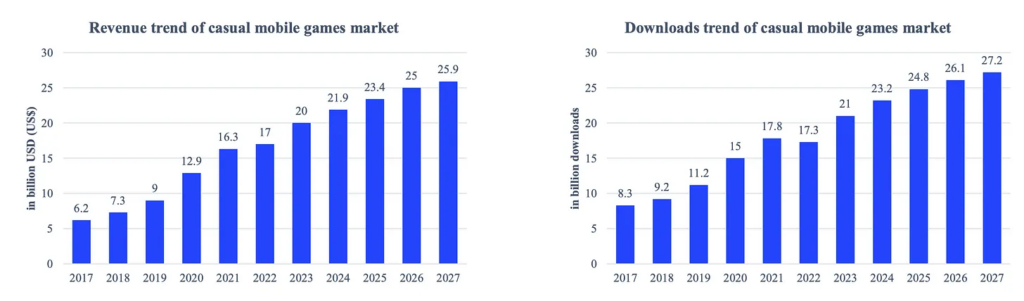
The number of creatives in the casual genre increased by 12.33% YoY. Casual games are responsible for 32.68% of all creatives. Puzzles (12.12% - decline by 1.91% YoY) and RPG (9.01% - decline by 2.02% YoY) are next.
-
The number of advertisers in casual games increased by 2.29% YoY - to 29.16% in Q1 2023. Puzzles are second (12.07% of advertisers, growth by 0.26% YoY); the Simulation genre is third (9.55% of advertisers, growth of 0.02%).
-
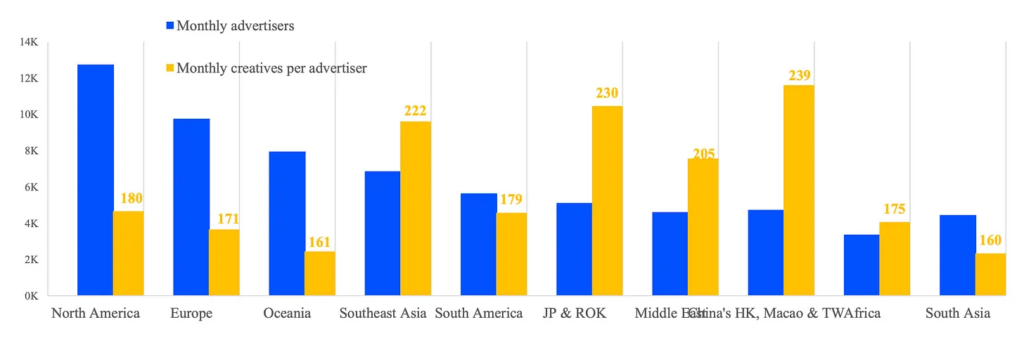
The largest number of monthly active advertisers is in the US - 12.7k. Leaders by a number of creatives for advertisers are Asian countries.
-
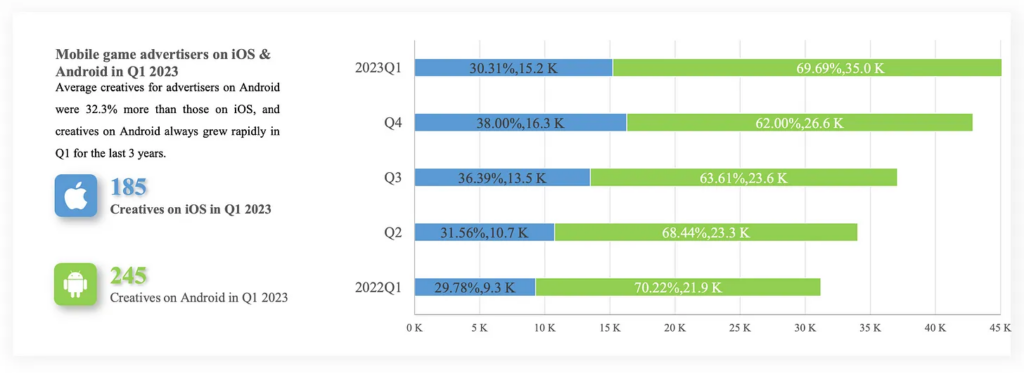
The number of advertisers on Android increased dramatically in Q1 2023 - from 62% in Q4 2022 to 69.69%. The share of iOS advertisers decreased accordingly from 38% in Q4 2022 to 30.31% in Q1 2023.
-
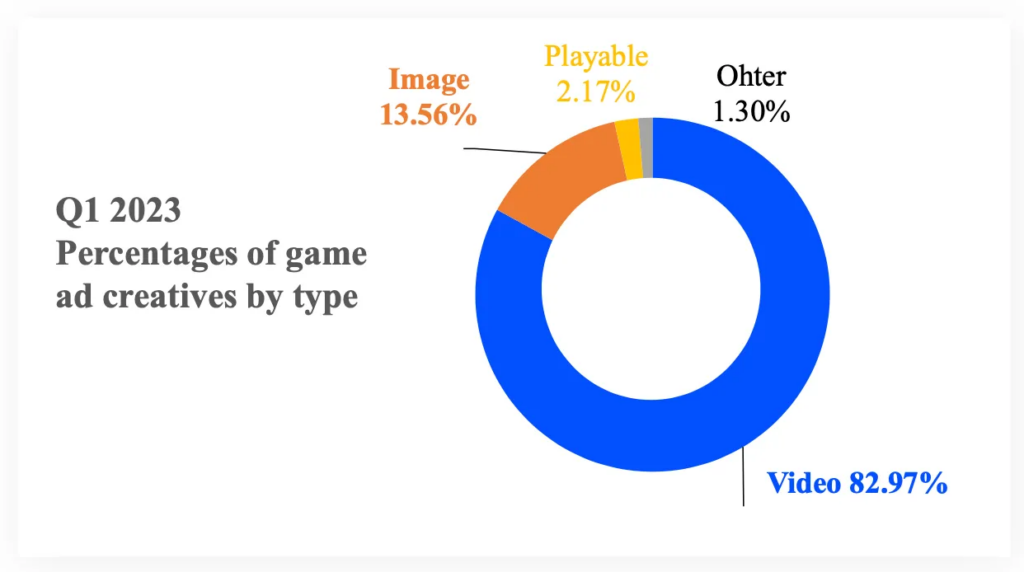
82.97% of all creatives in Q1 2023 has been videos; 13.56% - images; 2.17% - Playable; 1.3% - other types of creatives. Since Q1 2022 the number of impressions on videos and images is decreasing.
Trends by genre
-
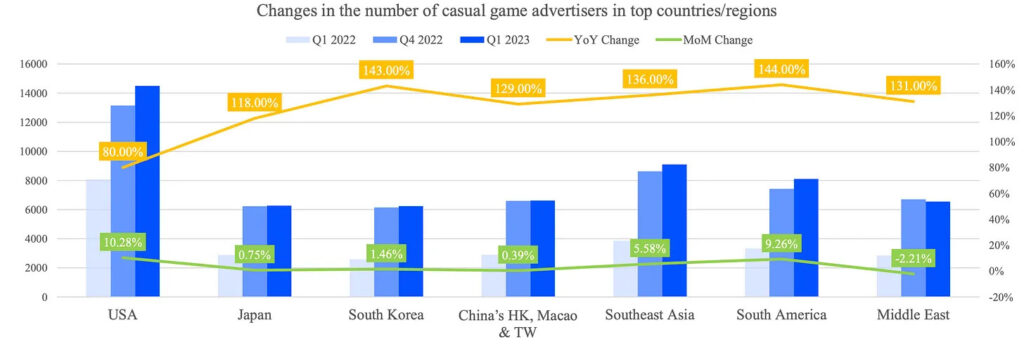
The number of advertisers in casual games in all regions increased from 80% to 144% in a year. This comes with the fact that in 2022 casual games dropped in downloads for the first time.
- The “Roguelike + casual gameplay” formula seemed to work for hit games in 2022 and Q1 2023.
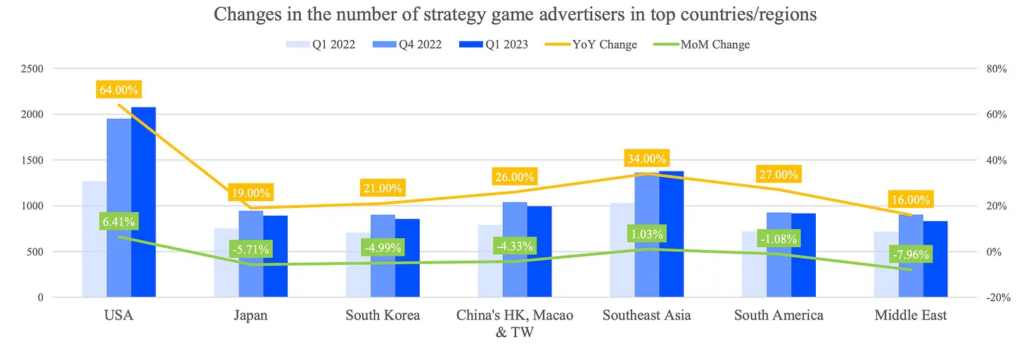
- The competition on mobile devices in the strategy genre increased. Growth of revenue slowed, but the number of new advertisers increased by 64% YoY in the US.
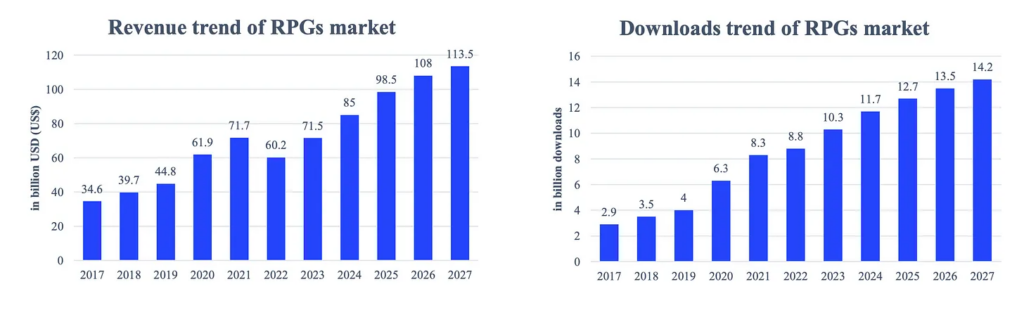
- The RPG genre in 2022 has been struggling. Revenue decreased by 16%. SocialPeta thinks that the interest in the genre is cooling down.
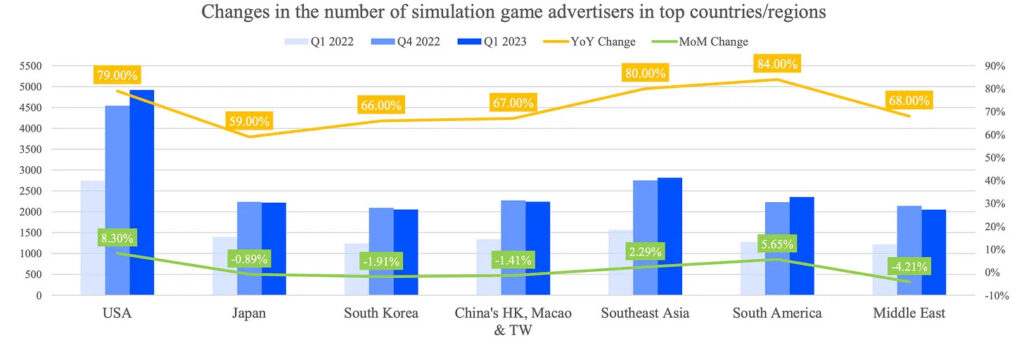
- The simulation genre is stagnating in revenue and downloads despite the growth of advertisers by 50%+ YoY in all regions.
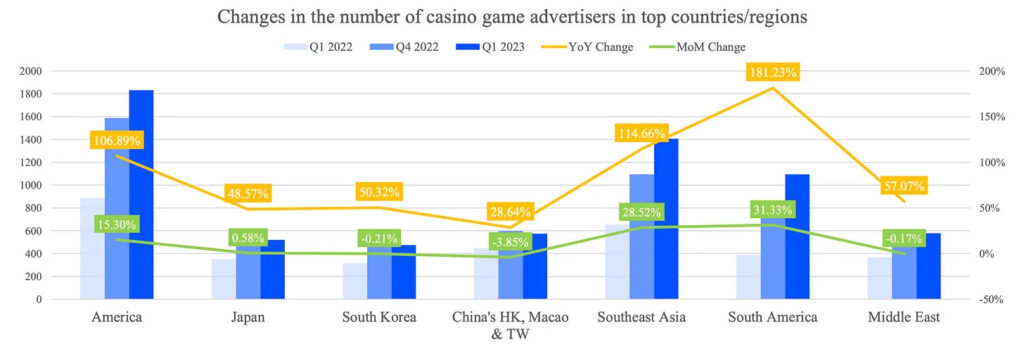
- Mobile casinos are growing in revenue but staying on a plateau in downloads. The number of advertisers in Latin America grew by 181% YoY - it might be the next big region for the genre.
Q1 2023 Insights into Global Mobile Game Marketing Trends
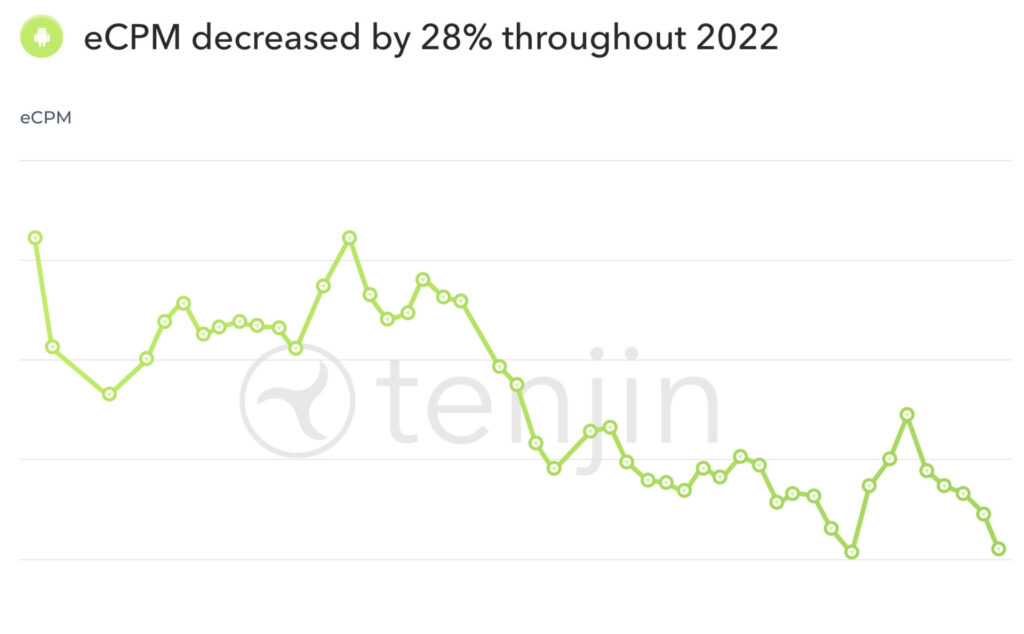
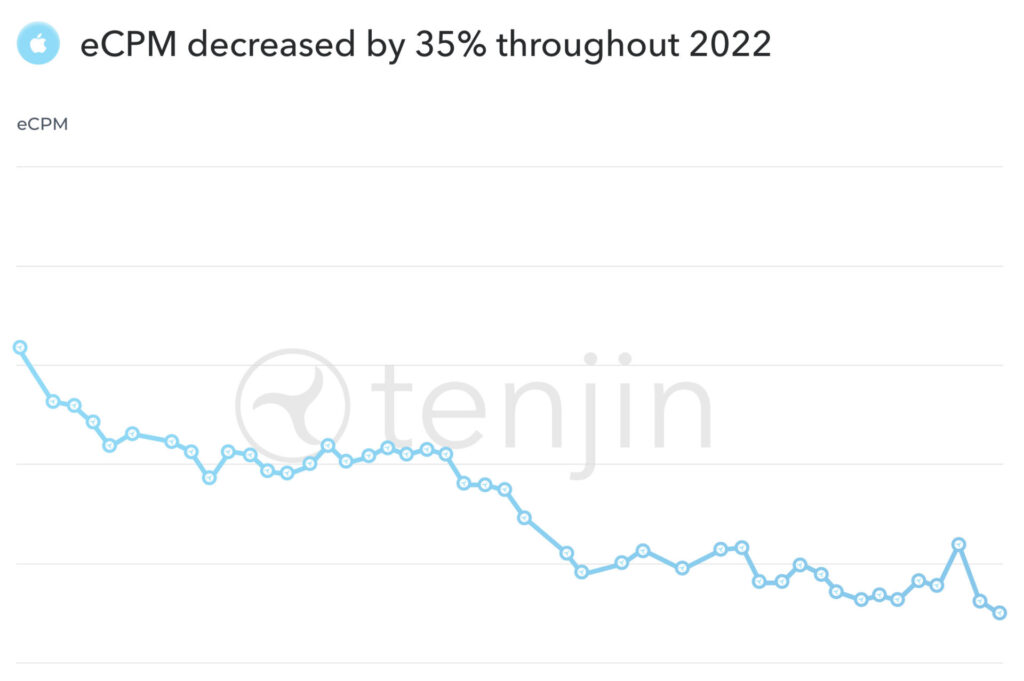
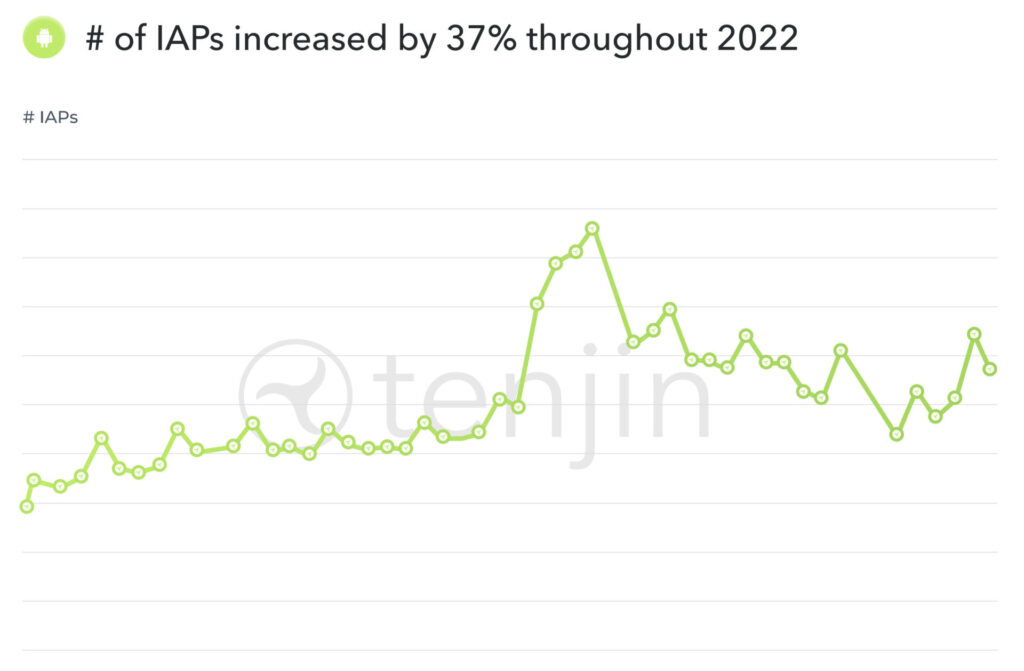
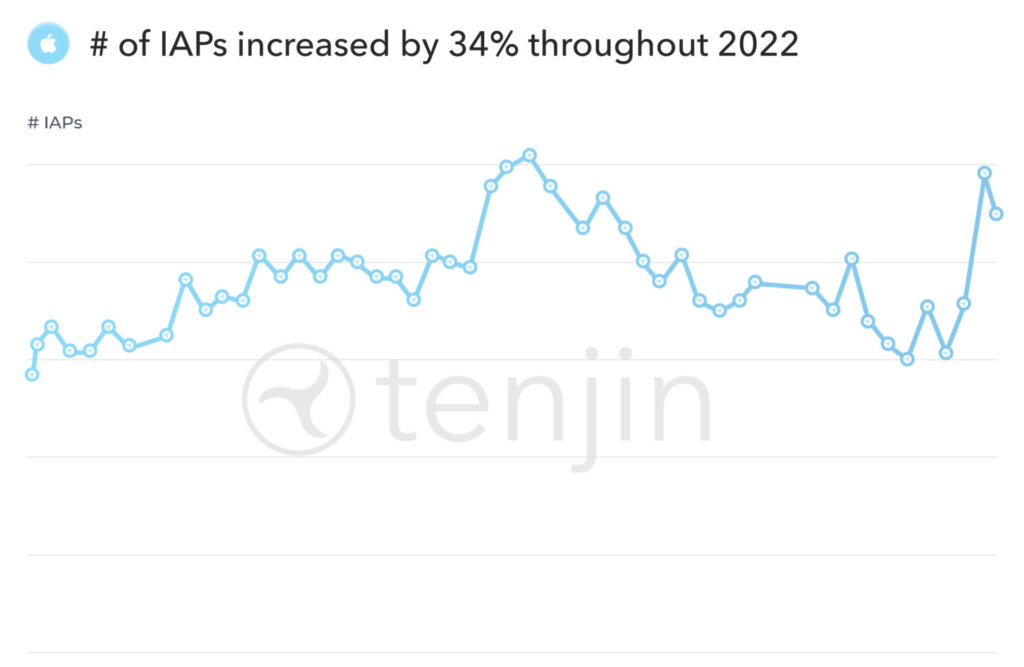
Tenjin: Hypercasual and Hybridcasual Market in 2022 Report
The data has been collected from January to December 2022.
2022 trends
-
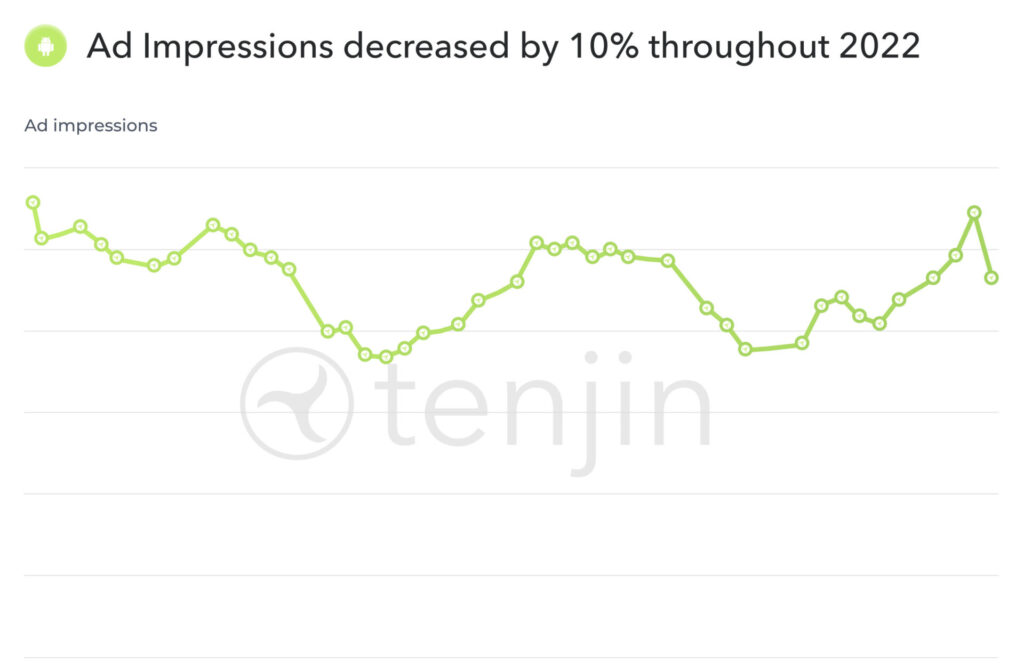
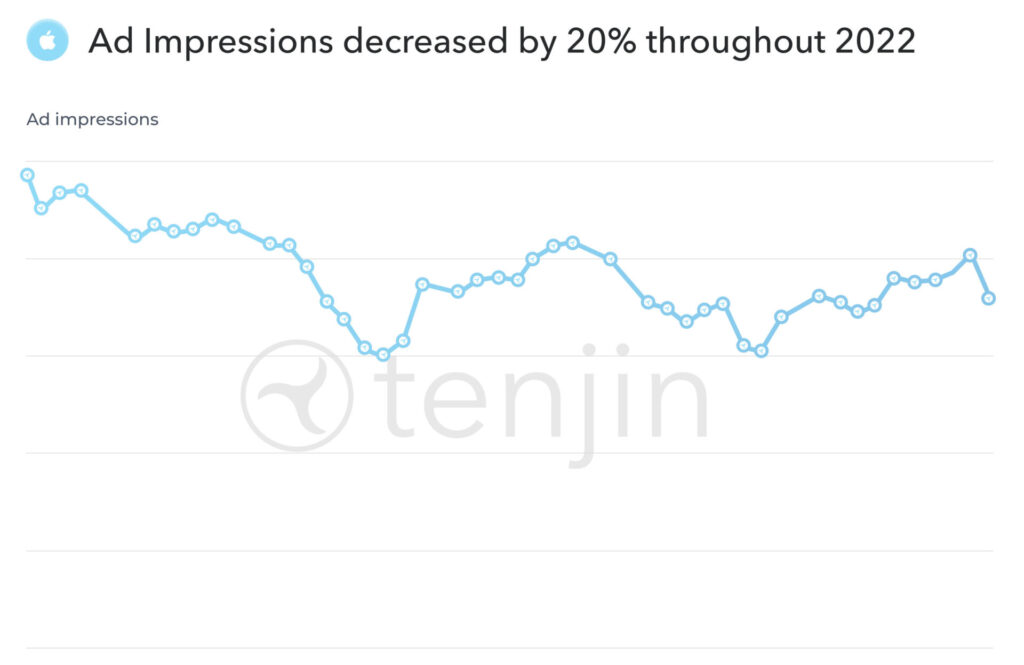
Ad Impressions in 2022 dropped by 10% on Android and by 20% on iOS.
-
eCPM on Android declined by 28%; iOS decrease was 35%.
-
The number of IAP purchases increased by 37% on Android; iOS grew by 34%.
Ad networks ratings
-
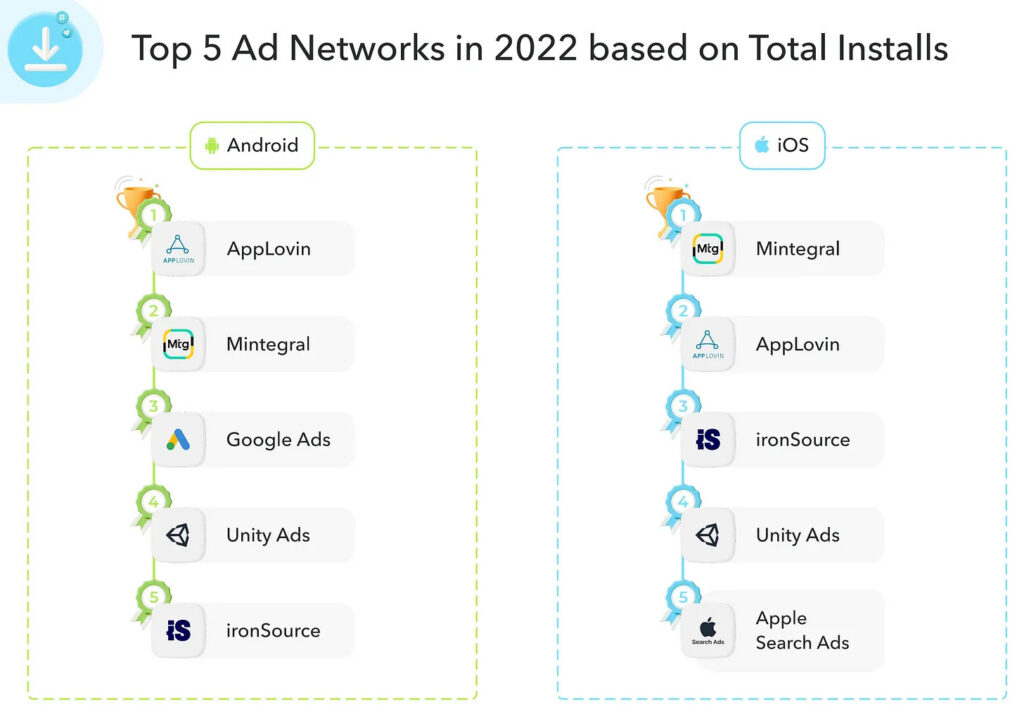
AppLovin, Mintegral, Google Ads - leaders by downloads on Android. Mintegral, AppLovin, and ironSource - leaders on iOS.
-
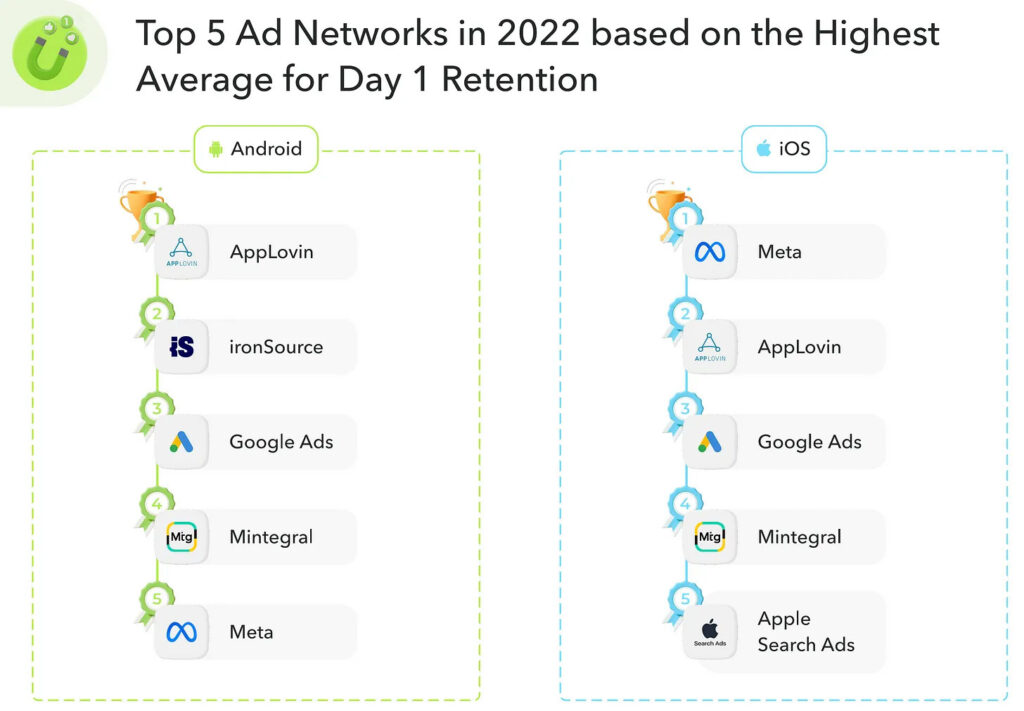
AppLovin, ironSource, and Google Ads are ad networks with the highest average D1 Retention on Android. It’s Meta, AppLovin, and Google Ads for iOS.
-
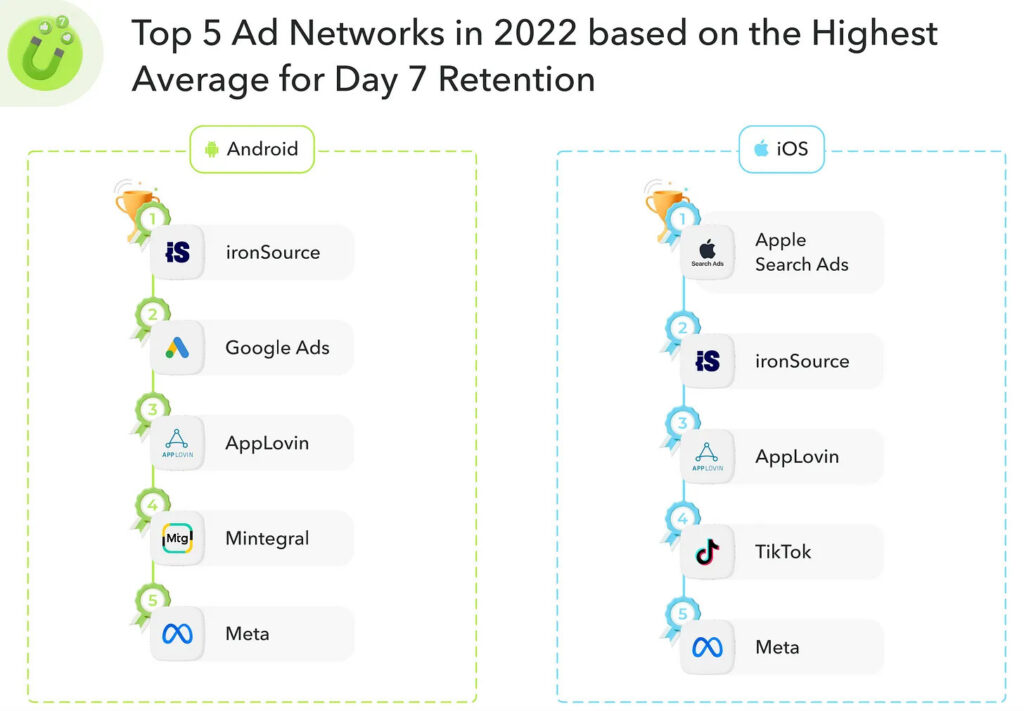
The best average D7 Retention on Android showed users from ironSource, Google Ads, and AppLovin. On iOS - users from Apple Search Ads, ironSource, and AppLovin.
-
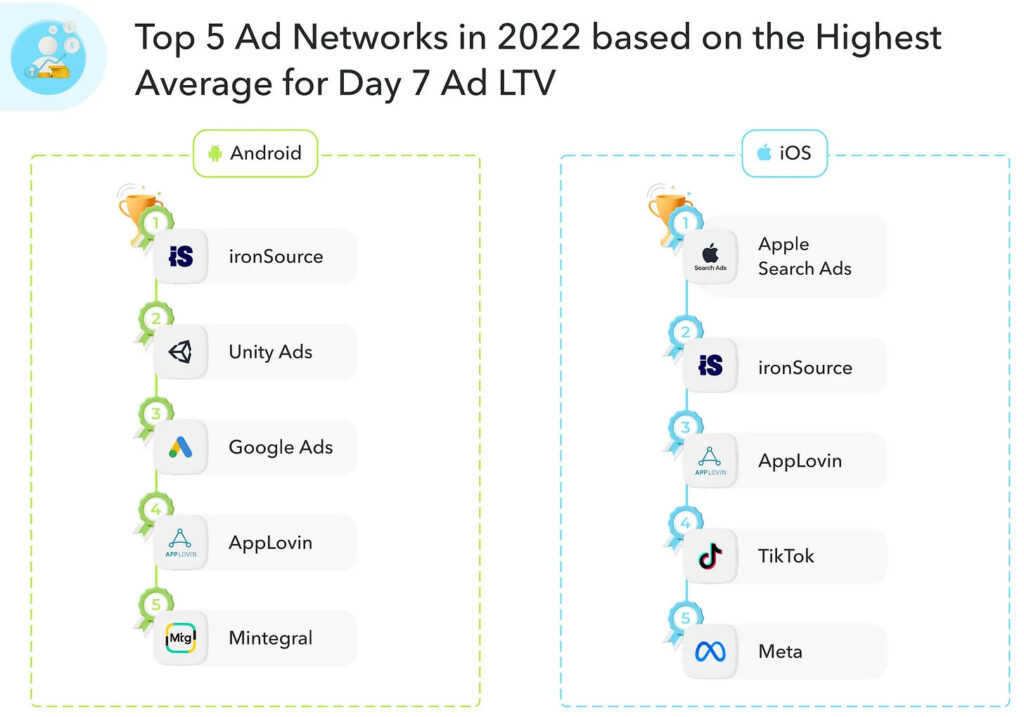
The best users by D7 Ad LTV on Android are from ironSource, Unity Ads, and Google Ads. On iOS - from Apple Search Ads, ironSource, AppLovin.
-
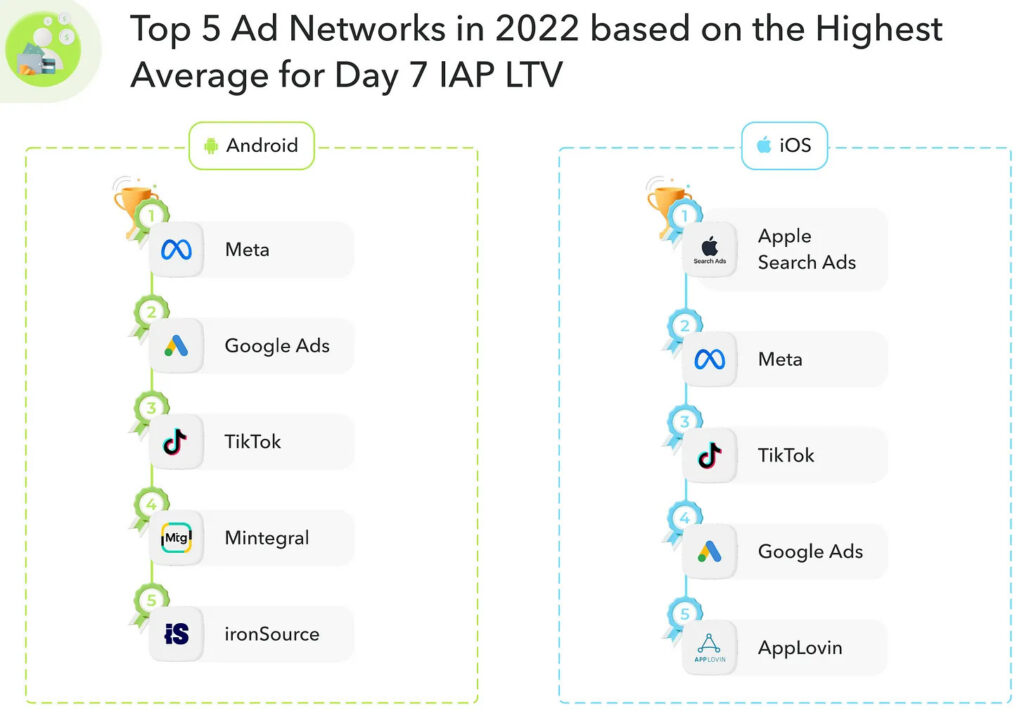
D7 IAP LTV rating on Android looks as follows: Meta, Google Ads, TikTok. On iOS - Apple Search Ads, Meta, TikTok.
Country ratings
-
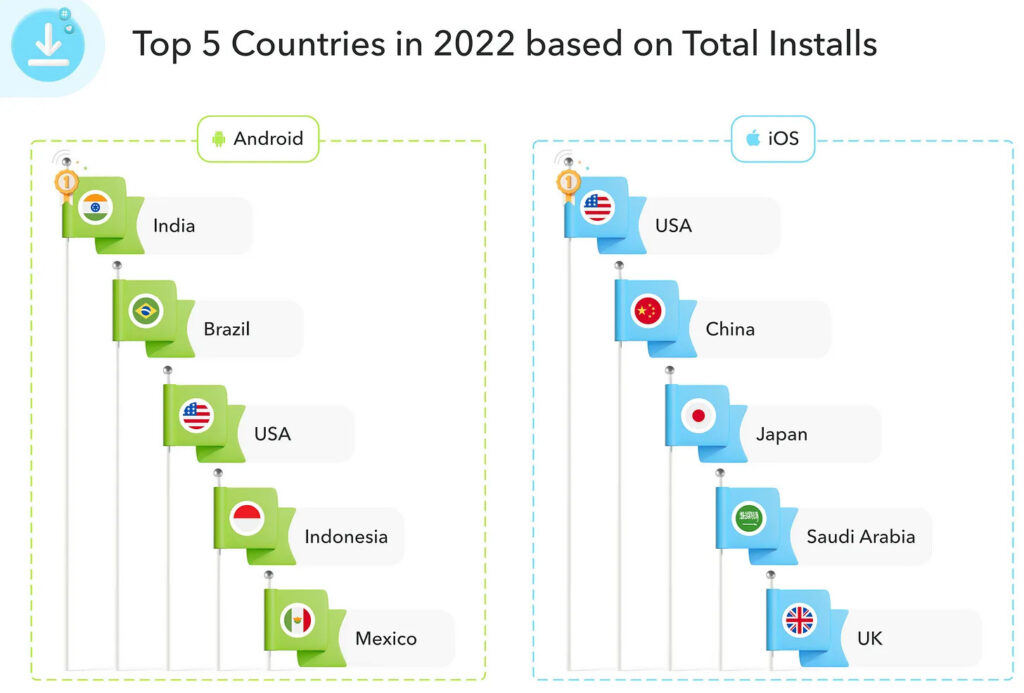
Leaders by downloads on Android are India, Brazil, and the US. On iOS - the US, China, and Japan.
-
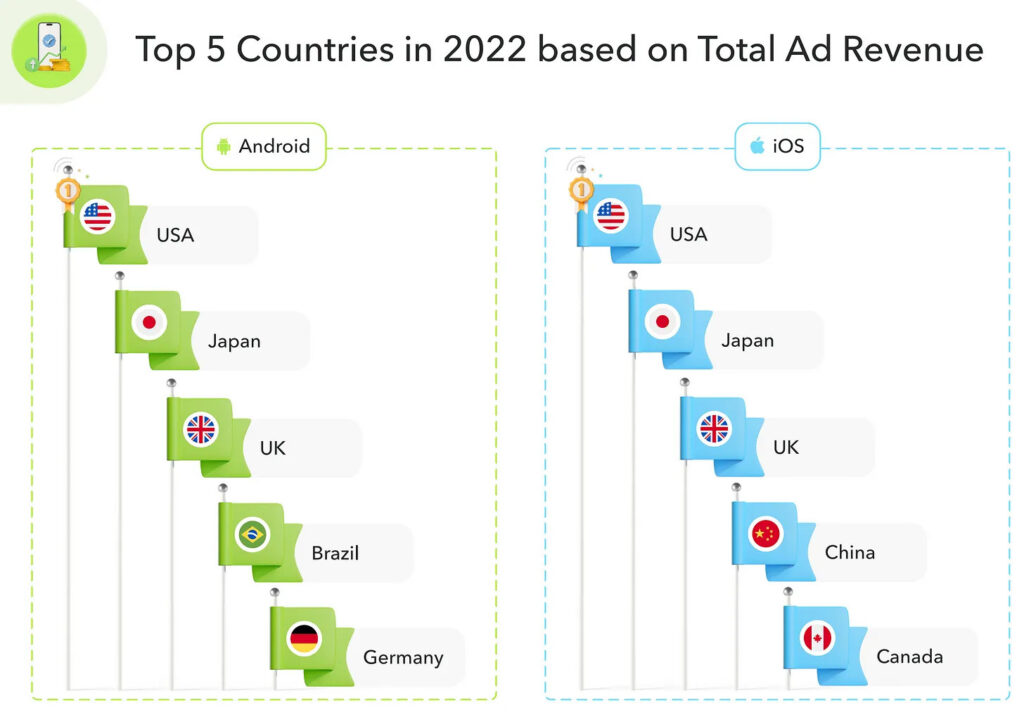
The top countries by ad revenue on Android are the US, Japan, and the UK. A similar picture is on iOS. It’s worth mentioning that #4 on Android by ad revenue is Brazil.
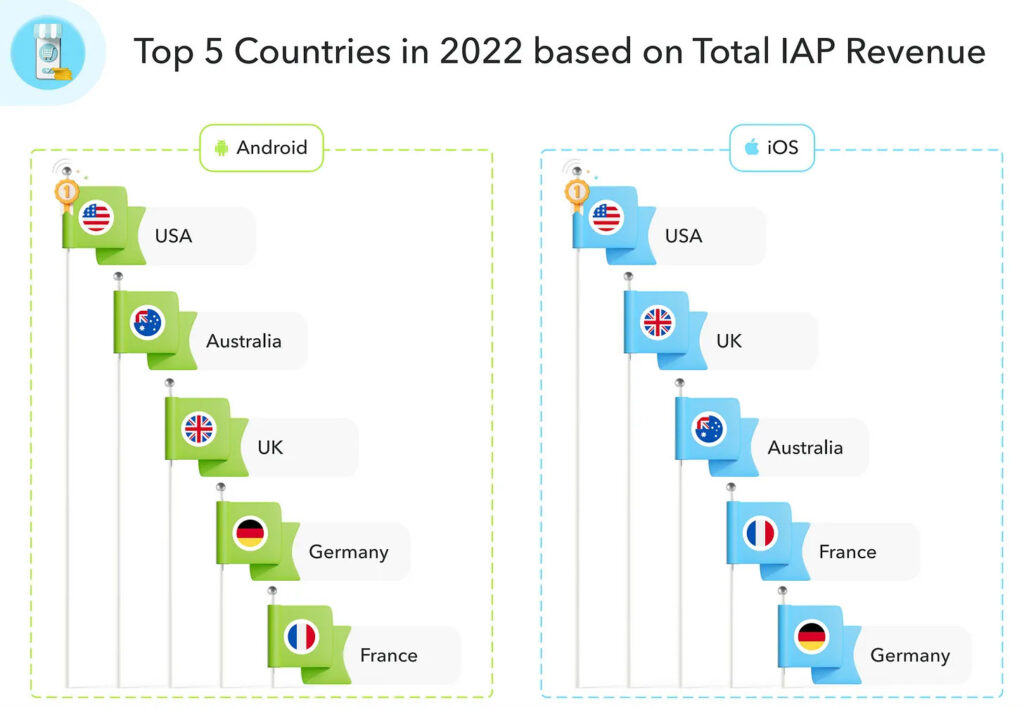
- The US, Australia, and the UK are the top countries by IAP purchases on Android and iOS. The only difference is that on iOS Australia is third, and the UK is second.
Best Ad Monetization sources
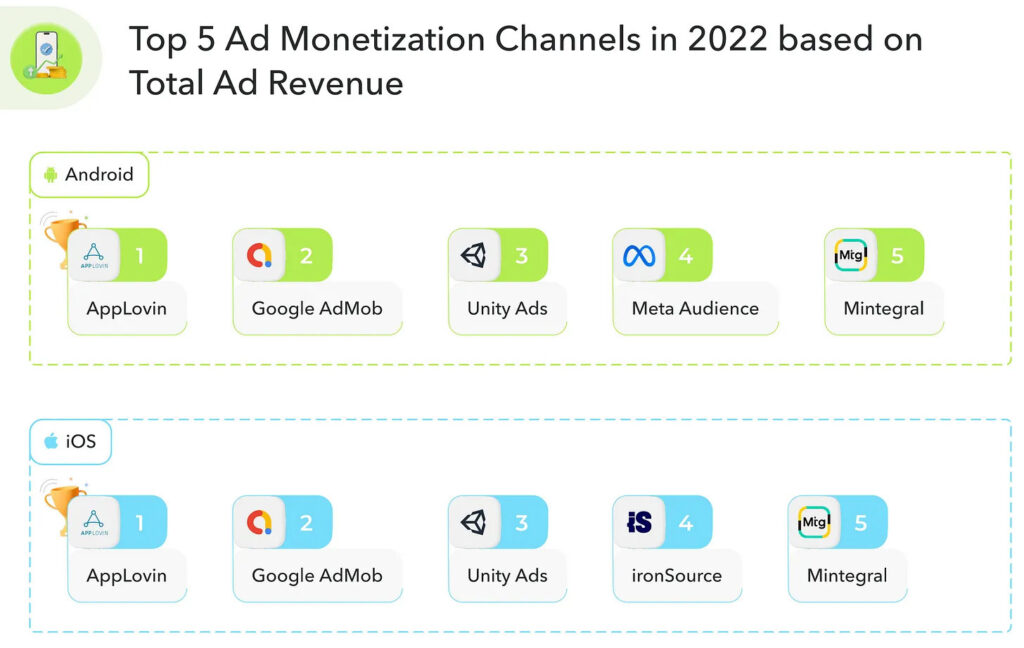
-
Leaders on both iOS, and Android, by overall ads revenue, are AppLovin, Google AdMob, and Unity Ads.
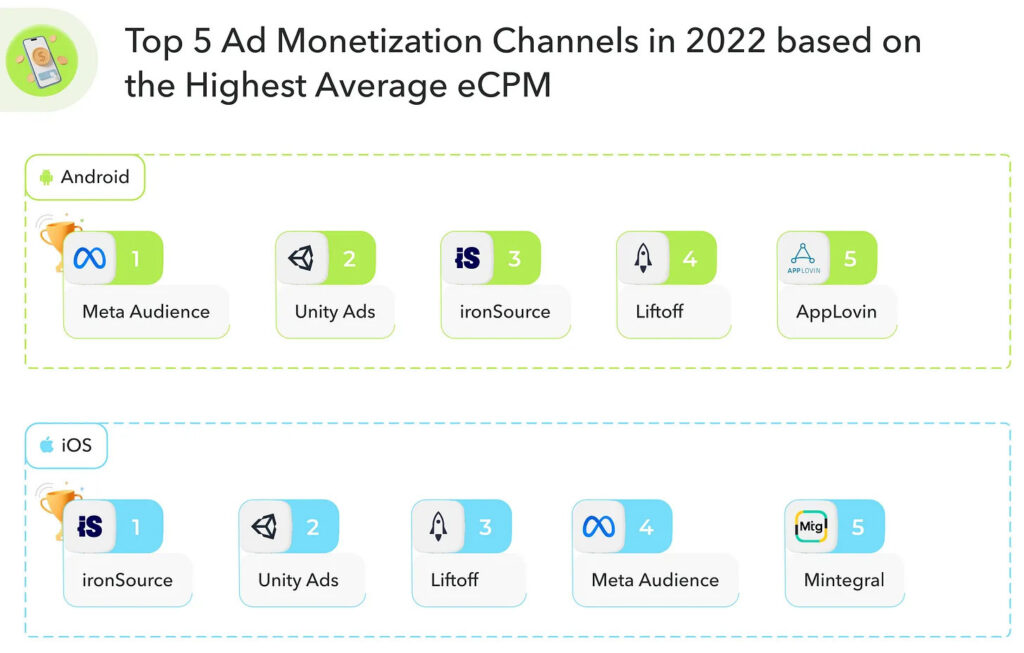
- The largest average eCPM on Android was provided by Meta Audience, Unity Ads, and ironSource. iOS leaders are ironSource, Unity Ads, and Liftoff.
AppMagic: Top Mobile Games by Revenue & Downloads in April 2023
Revenue
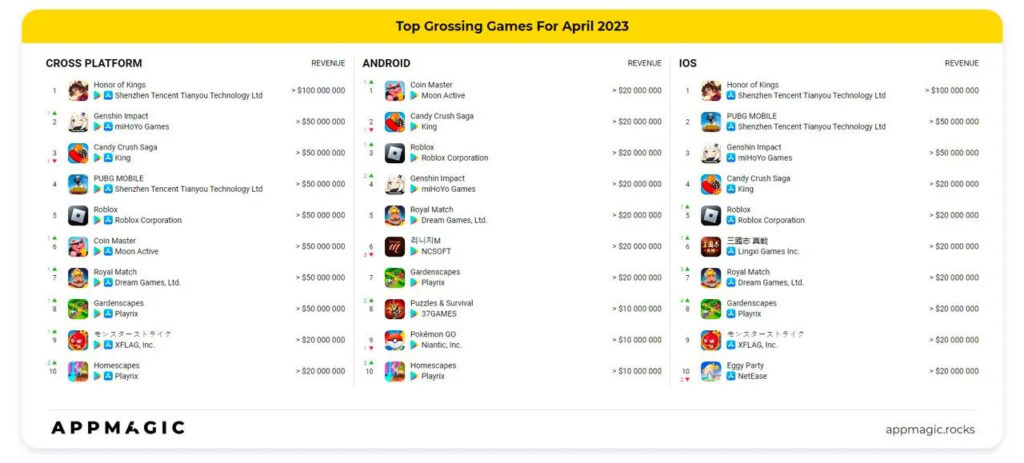
-
Genshin Impact moved Candy Crush Saga from second place.
-
Homescapes returned to the top 10 titles by revenue on iOS and Android.
-
Honkai: Star Rail earned $28M in April, which was not enough to enter the top 10. Now the game is earning about $4M daily with a slight downward trend.
Downloads
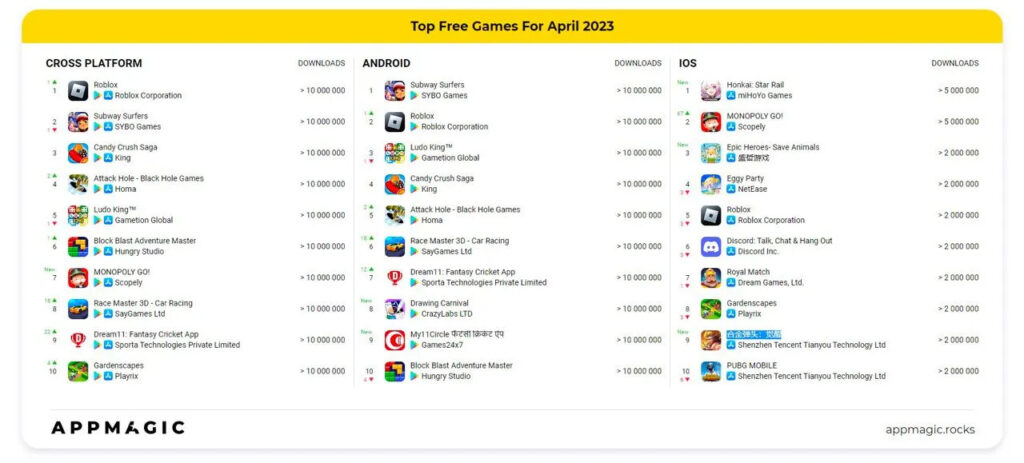
-
The downloads chart is much more livelier than revenue - in April there were 6 new games.
-
MONOPOLY GO! from Scopely has been downloaded 14.1M times in April. 7.5M came from Android; 6.6M - from iOS.
-
Drawing Carnival from CrazyLabs - the game in which you need to draw images by contours - generated 12.2M downloads (12M - Android; 0.2M - iOS).
-
My11Circle - a fantasy sports app from India - has been downloaded 11.9M times in April. All downloaded were on Android.
-
Honkai: Star Rail - a new hit title from miHoYo Games - earned 12.4M downloads in April. The game managed to become #1 by downloads on iOS (7.6M downloads), on Android, it didn’t work to enter even the top 10 (4.8M downloads).
-
Tencent released Metal Slug Awakening in China - the game reached #9 place on the iOS chart with 3.2M downloads.
GSD: The UK Gaming market in April declined
GSD is reporting only the fact sales numbers were received from partners. There are partners (like Nintendo), who are not sharing the digital sales numbers, which might affect the overall picture.
Games
-
2.2M games on PC & Consoles were sold in April 2023. It’s 8% lower than a year before.
-
Star Wars Jedi: Survivor became the leader by sales - it performed 31% better than Star Wars Jedi: Fallen Order after the first week. The digital sales share of Star Wars Jedi: Survivor is 66% - the predecessor had 36%.
-
Dead Island 2 was second by sales.
-
However, even combined, the top two sellers of April 2023 were unable to reach LEGO Star Wars: The Skywalker Saga’s results of April 2022.
Consoles & accessories
-
111k consoles were sold in the UK in April 2023. It’s 20% higher than last year, but 20% lower than a month before.
-
PlayStation 5 is the leader by sales, Nintendo Switch is second; Xbox Series S|X is third.
-
Sales of PlayStation 5 dropped by 35% to the previous month but grew by 15% YoY. Xbox Series S|X experienced a MoM decline of 32%, and growth to the previous year by 8%.
-
Nintendo is feeling great. Nintendo Switch sales are up by 26% MoM and by 30% compared to the previous year with the release of a console’s limited Zelda edition (which generated 29% of all sales).
-
487k accessories were sold in April 2023 - it’s 21% lower than in March, and 6% lower than the last year. The most popular device sold was the white DualSense.
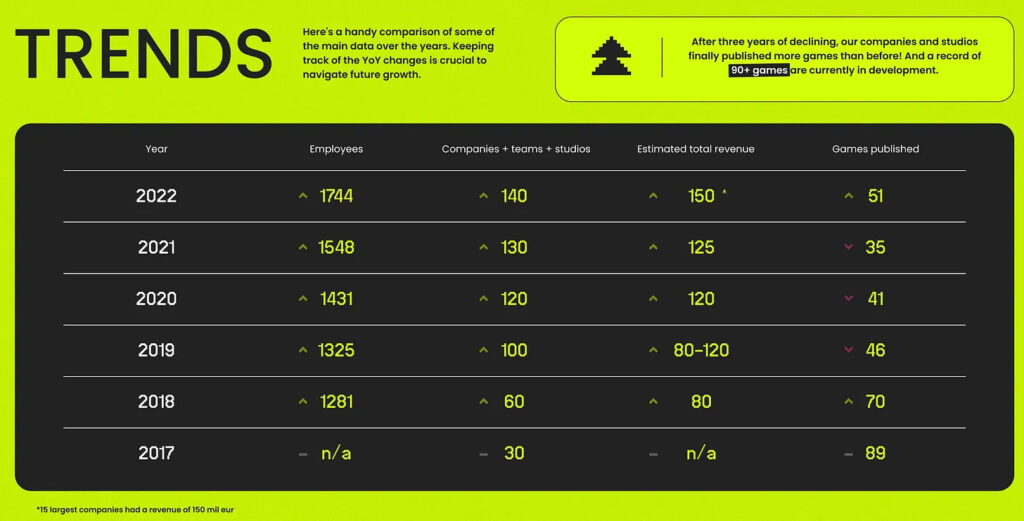
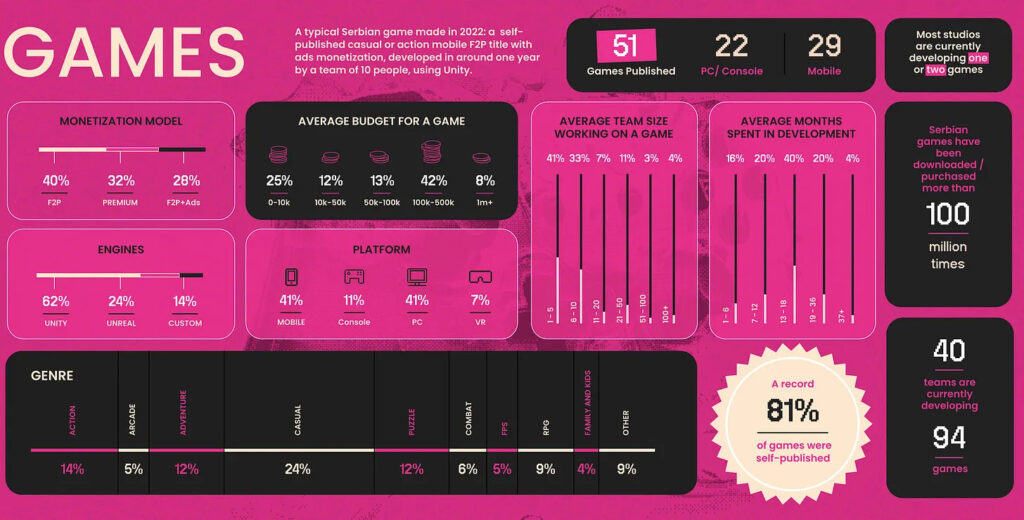
SGA: Serbian game industry in 2023
-
15 largest companies earned €150M in revenue in 2022. The major chunk of this amount is generated by mobile titles.
-
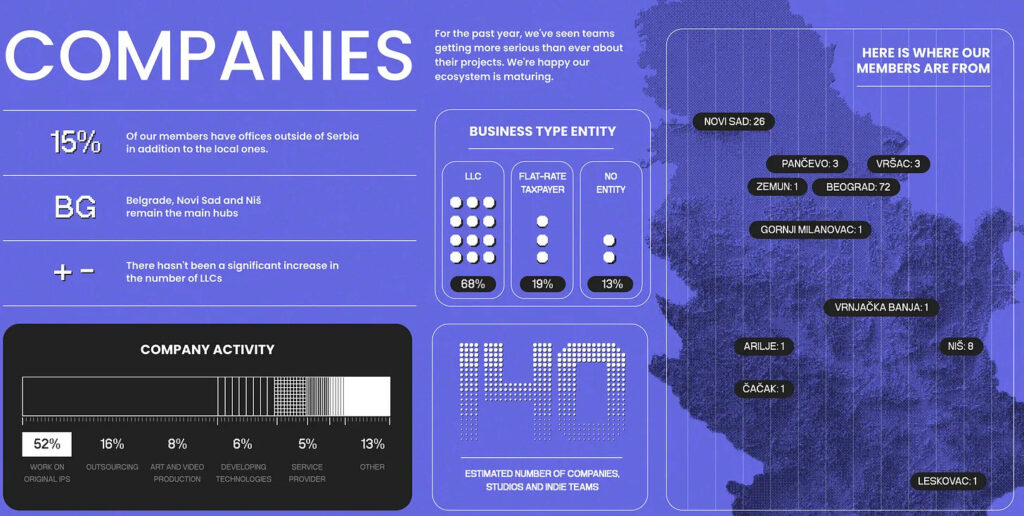
There are more than 140 companies in Serbia, in which 1,700+ people are employed. 1/3 of them are female. Among leading positions, females are having half.
-
52% of those companies are developers, which are working on original IPs.
-
51 games have been published in 2022 by Serbian companies. 94 projects are in development.
-
42% of games have a budget from €100k to €500k. Only 8% of games have a budget higher than €1M.
Serbian Gaming Industry Report 2023 made by SGA
Stream Hatchet: Video Games Streaming in Q1 2023
-
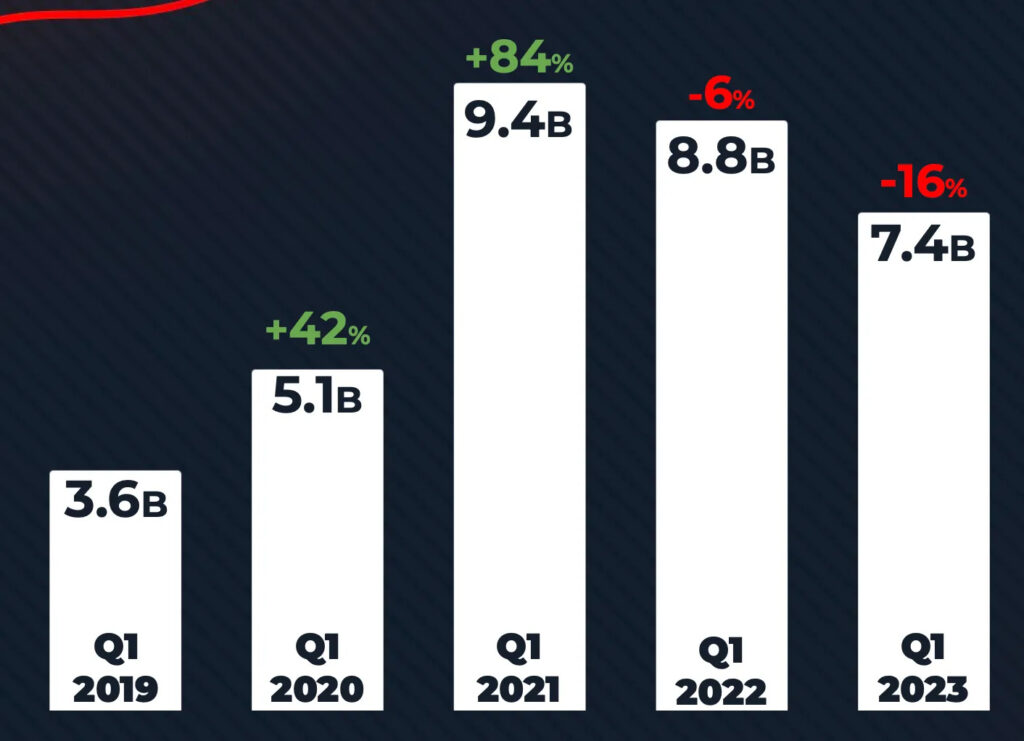
The number of watched hours is declining for the second year straight. In Q1 2022 there was a decline of 6%. Now - by 16% to Q1 2022.
-
However, if we compare the number of watched hours with Q1 2019, we’ll see an increase of 46%.
-
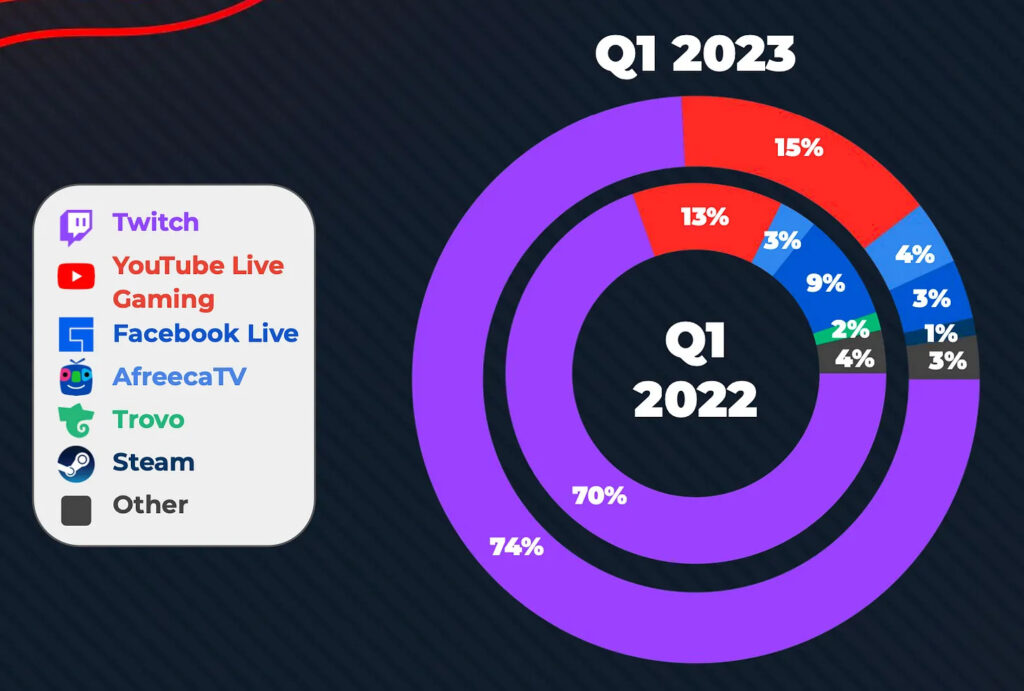
In Q1 2023 Twitch expanded its market share from 70% in Q1 2022 to 74%. YouTube Live Gaming is growing too - from 13% in Q1 2022 to 15% in Q1 2023. Facebook Live is not feeling so strong, it lost market share from 9% in Q1 2022 to 3% this year’s first quarter. This allowed AfreecaTV to become the third streaming platform in the world with 4% of the audience.
-
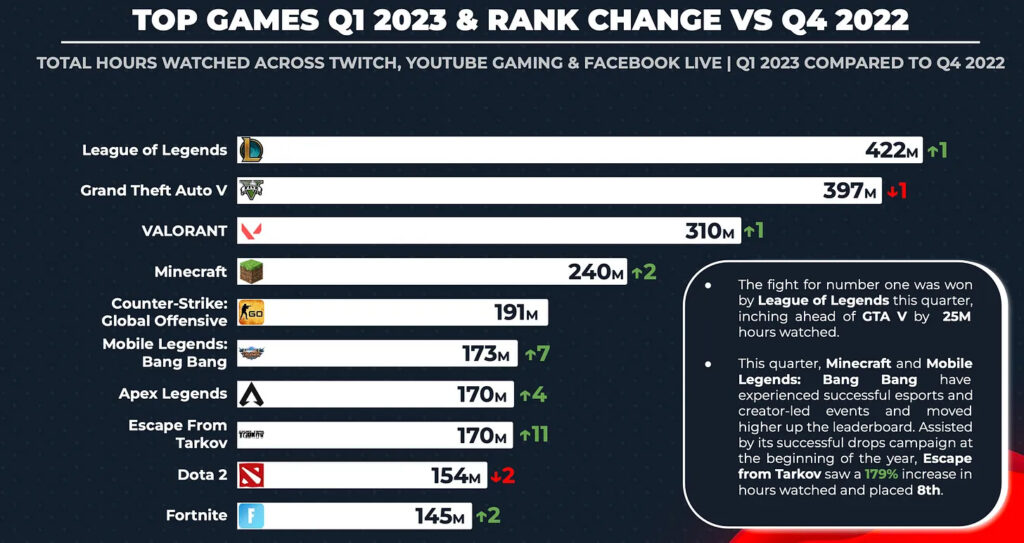
League of Legends (422M watched hours), Grand Theft Auto V (397M watched hours), and Valorant (310M watched hours) are leaders in Q1 2023.
-
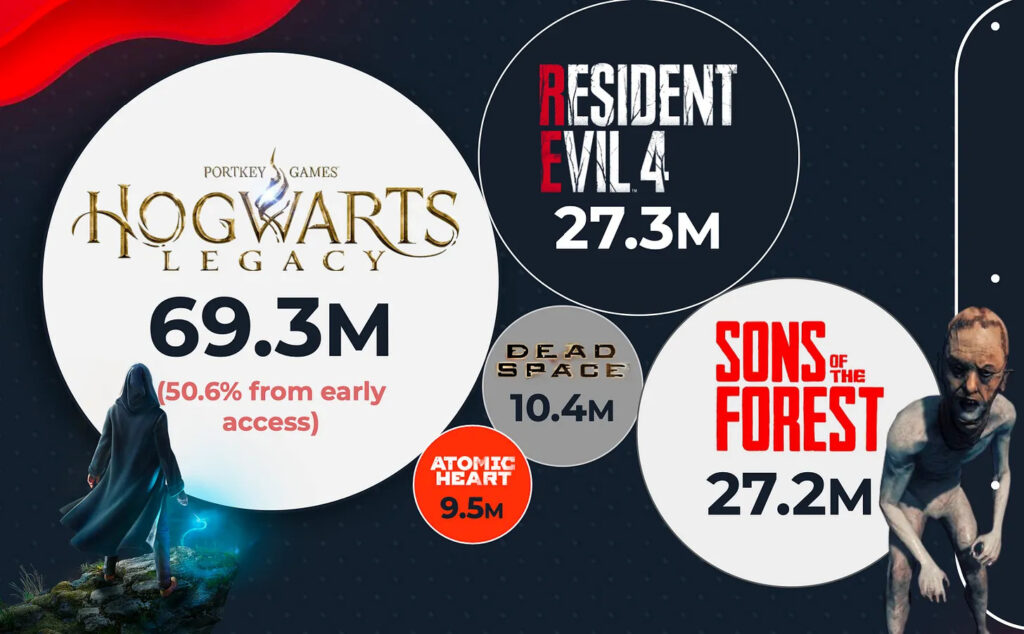
Hogwarts Legacy in the first week (and 3 days of early access) got 69.3M hours watched. The game set a record for the number of simultaneous users for a single-player game - 1.28M people have been watching it.
-
Resident Evil 4 received 27.3M hours watched in the first week; Sons of the Forest - 27.2M. Dead Space is #4 with 10.4M hours watched. Atomic Heart got 9.5M hours.
-
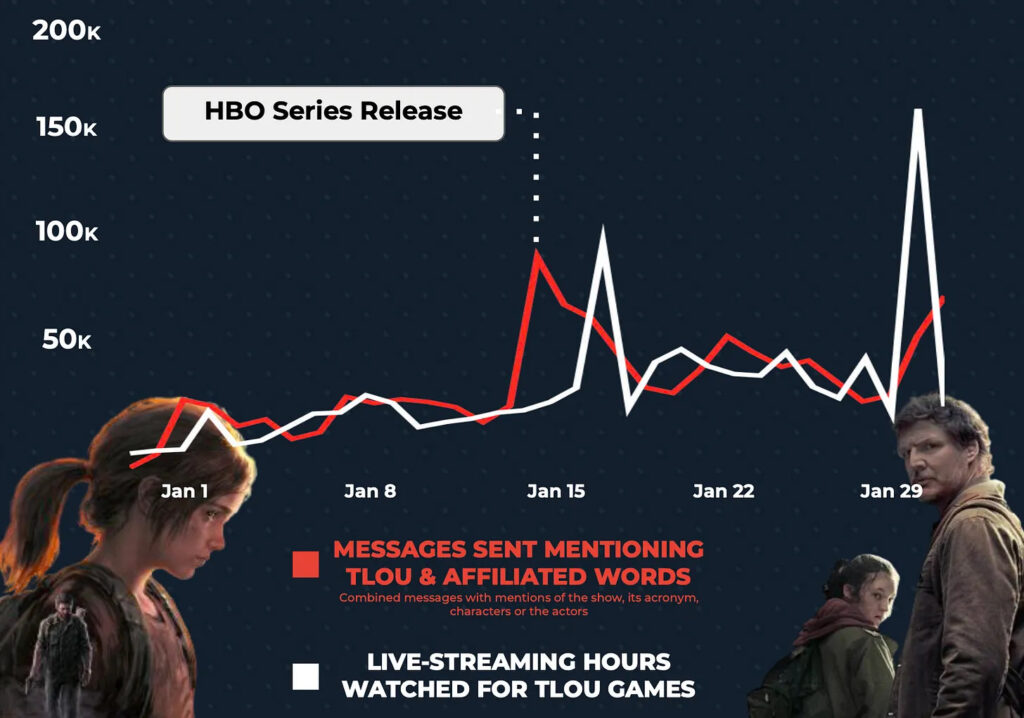
The Last of Us series release positively affected the franchise gaming streams. The number of viewers increased by 106%, and the hours watched - by 107%.
Stream Hatchet: Video Games Streaming in Q1 2023
Star Wars is the most popular IP in the UK gaming retail since 1993
The research was prepared by Dorian Bloch, one of the leading analysts at GfK.
-
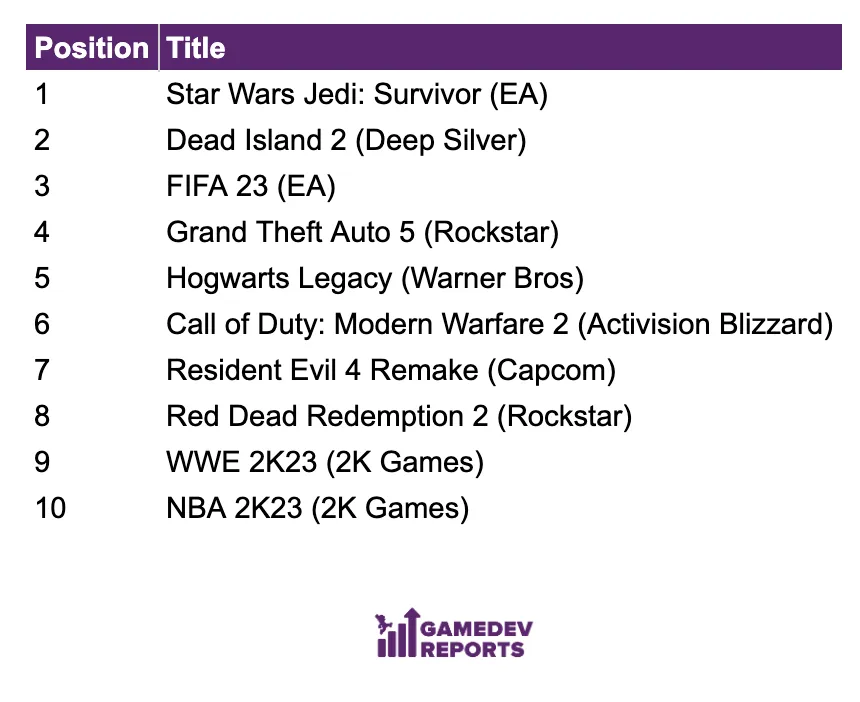
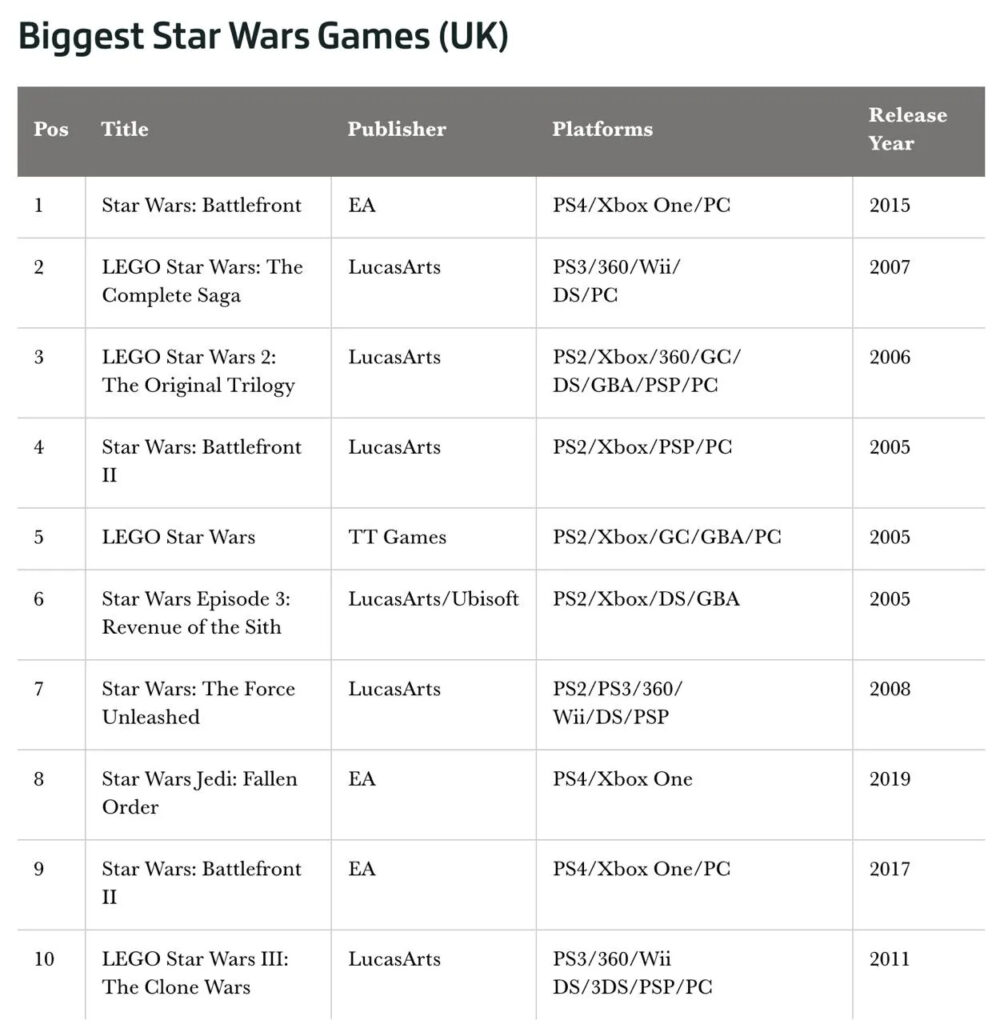
Star Wars Jedi: Survivor became the 119 game in the Star Wars franchise since 1993 (when LucasArts released X-Wing). On average, 4 games have been released per year since then. The table above is showing 107 releases, but it’s tracking since 1995.
-
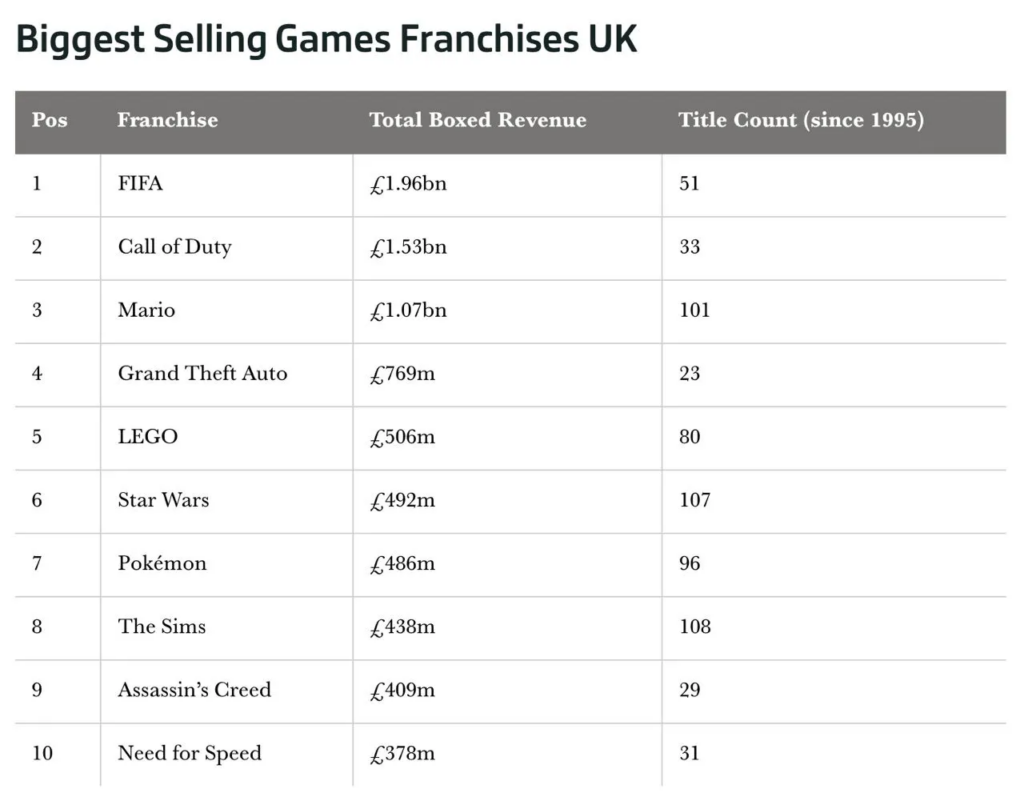
That’s more than any other franchise. Even The Sims - including all add-ons released in retail - had less - 108 releases. Mario is third with 101 releases.
-
In the UK games developed by the Star Wars franchise earned £492M (without Star Wars Jedi: Survivor). That’s the 6 place by revenue, LEGO, Grand Theft Auto, Mario, Call of Duty, and FIFA are ahead.
-
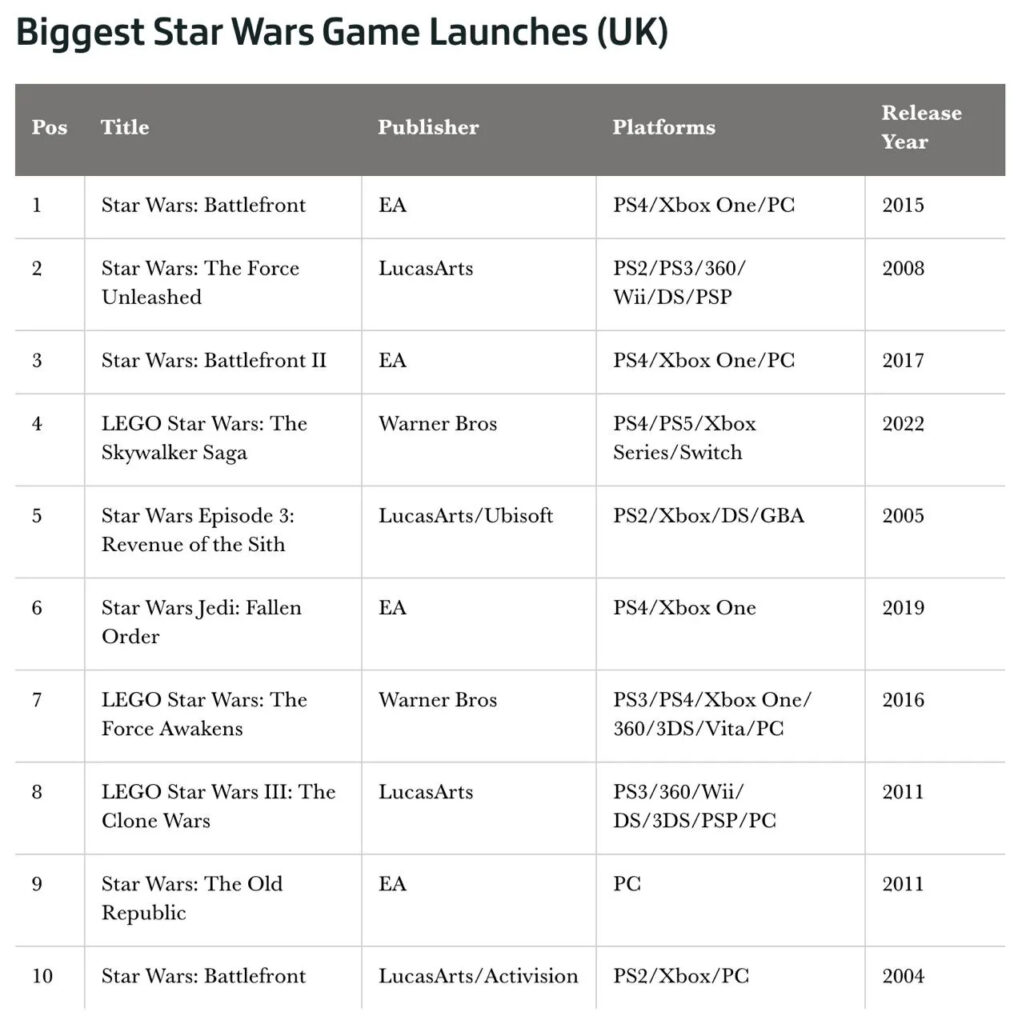
The largest physical release in the UK is Star Wars Battlefront (2015). The previous record was handled by Star Wars: The Force Unleashed (2008).
-
First Star Wars Jedi: Survivor results show that the game - despite perfect press - is selling 35% worse than the first title. However, it’s important to mention that we’re speaking about retail only, so digital sales might change the picture completely.
Sony is breaking records with PlayStation 5
-
Sony shipped 19.1M PlayStation 5 consoles in the 2022 financial year (March 2022 - March 2023). The initial goal was 18M consoles.
-
Console shipping in the 2022 financial year increased by 66%.
-
Especially successful was financial Q4 2022 (calendar Q1 2023), in which Sony shipped 6.3M consoles. It's 215% more than a year before.
-
Ampere Analysis is highlighting that PlayStation 5 sales in calendar Q1 2023 (or financial Q4 2022) are the best calendar Q1 in all console’s history. And 2 times better than PlayStation 4 ever achieved in calendar Q1.
-
67% of all PlayStation sales are digital. A year before it was 66%.
-
MAU on PlayStation consoles reached 108M users.
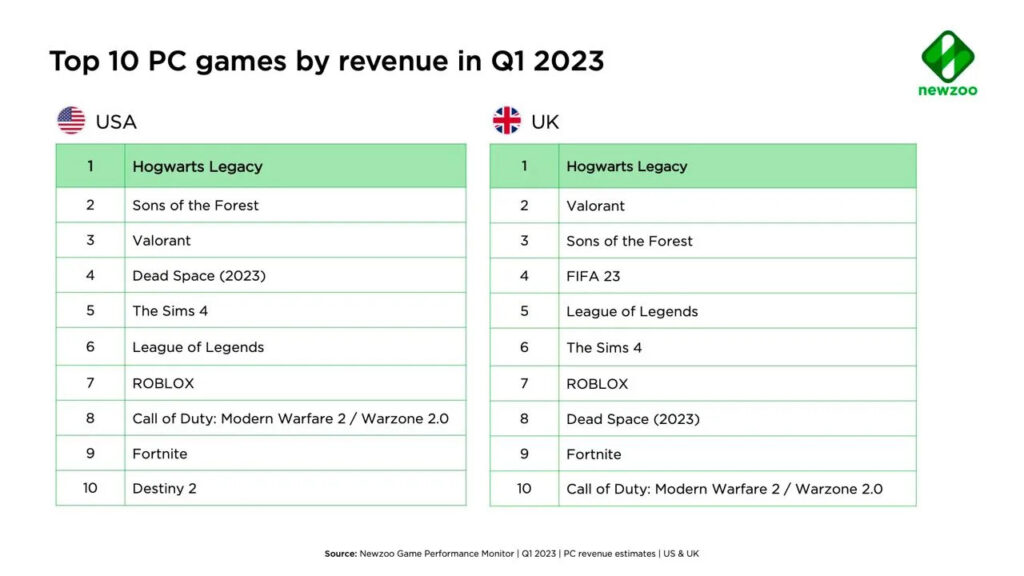
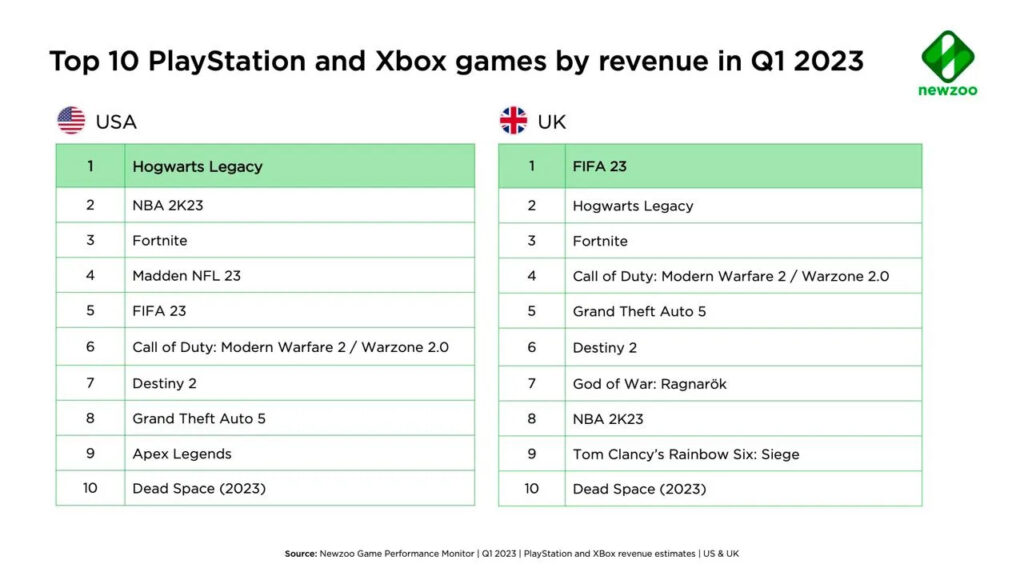
Newzoo: Hogwarts Legacy is the top-grossing title on PC & Consoles in Q1 2023 in the US & UK
-
Hogwarts Legacy reached the #1 place by revenue in all titles and platforms except the UK. Console versions of FIFA 23 outperformed Hogwarts Legacy there.
-
Despite stereotypes, FIFA 23 is feeling great in the US market too. The console version of the game reached #5 place by revenue.
-
Sons of the Forest performed pretty well on PC. The game reached second place by revenue in Q1 2023 in the US and third in the UK.
-
Dead Space Remake is showing good results too, especially in the US - the game reached #4 place by revenue on PC and #10 by revenue on consoles.
-
God of War: Ragnarok is the only console exclusive on the charts. It reached #7 in the UK revenue console chart. And this is quite an achievement, considering the release date of the game which happened in late-2022.
-
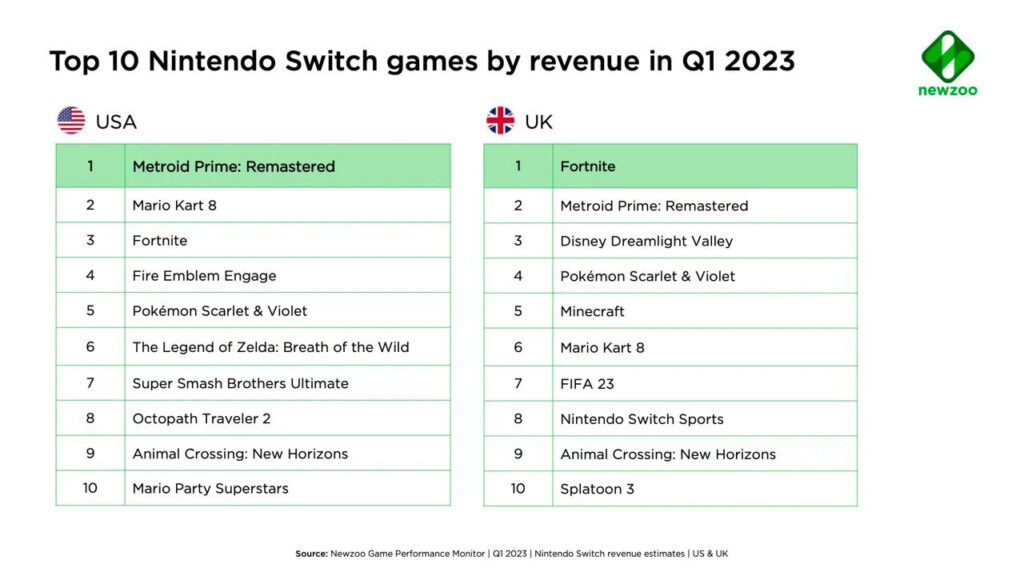
The US users prefer to play exclusives on Nintendo Switch, that’s why Metroid Prime: Remastered and Mario Kart 8 are on top of the revenue chart in Q1 2023. 8 out of 10 games by revenue in the US are Nintendo exclusives.
-
In the UK “only” 6 games in the chart are Nintendo exclusives.
AppMagic: Pokemon GO in April 2023 reached the minimum revenue in 5 years
Niantic disagreed with AppMagic data and noted that the title revenue depends heavily on events.
-
By AppMagic platform data, the game earned $34.6M in April 2023. Last year it was $43M.
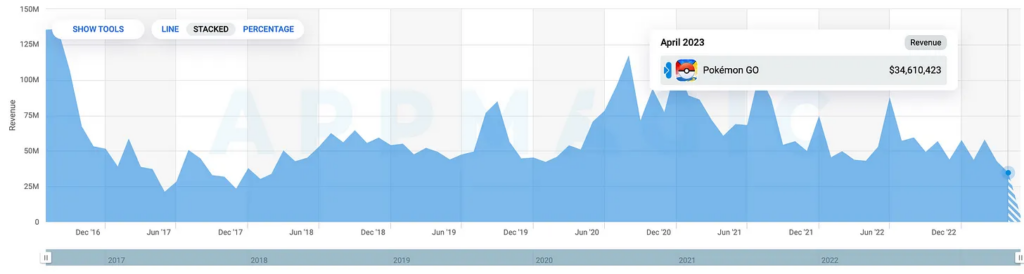
- The last month, when revenue was lower than in April 2023, was in February 2018 - Pokemon GO earned $33.7M then.
- The drop in revenue started in February this year ($58M). In March the game, according to AppMagic, earned $42.8M.
- The possible decline is happening against the background of game changes. Niantic restricted remote raids, which provoked a community backlash. People are offering to boycott the game on Reddit.
Tune in next month for more updates!