
Statistics plays a crucial role in various fields, and anyone dealing with app and game analysis should understand it and be able to use it. To make sense of data and draw meaningful conclusions, it is essential to grasp some fundamental concepts and statistical indicators. In this article, we will explore key terms such as mean value, median value, mode value, statistical distribution, percentile, quartile, and decile.
Read more: Game Analytics Metrics Glossary
Mean Value
The mean, often referred to as the average, is a widely employed term in analytics. It is calculated by summing up all the values in a dataset and dividing the sum by the total number of values.
Median Value
The median represents the middle value in a sorted list. In essence, after selecting a parameter, the list is organized accordingly, and the median is identified as the central value within the sorted arrangement.
Mode Value
The mode is the value that occurs with the highest frequency in a dataset, proving particularly beneficial for categorical or discrete data analysis. In cases where no single value surpasses others in frequency, the dataset is deemed to have no mode.
Statistical Distribution
A statistical distribution offers insights into the dispersion of data and the probabilities associated with different outcomes. Put simply, it reveals the commonality and rarity of various values within the dataset.
The graph visually represents users and their session times, including the distribution. However, it can be converted into a density graph. To achieve this transformation, normalization to 100% is required, ensuring that the cumulative sum of all values in the graph equals 1.
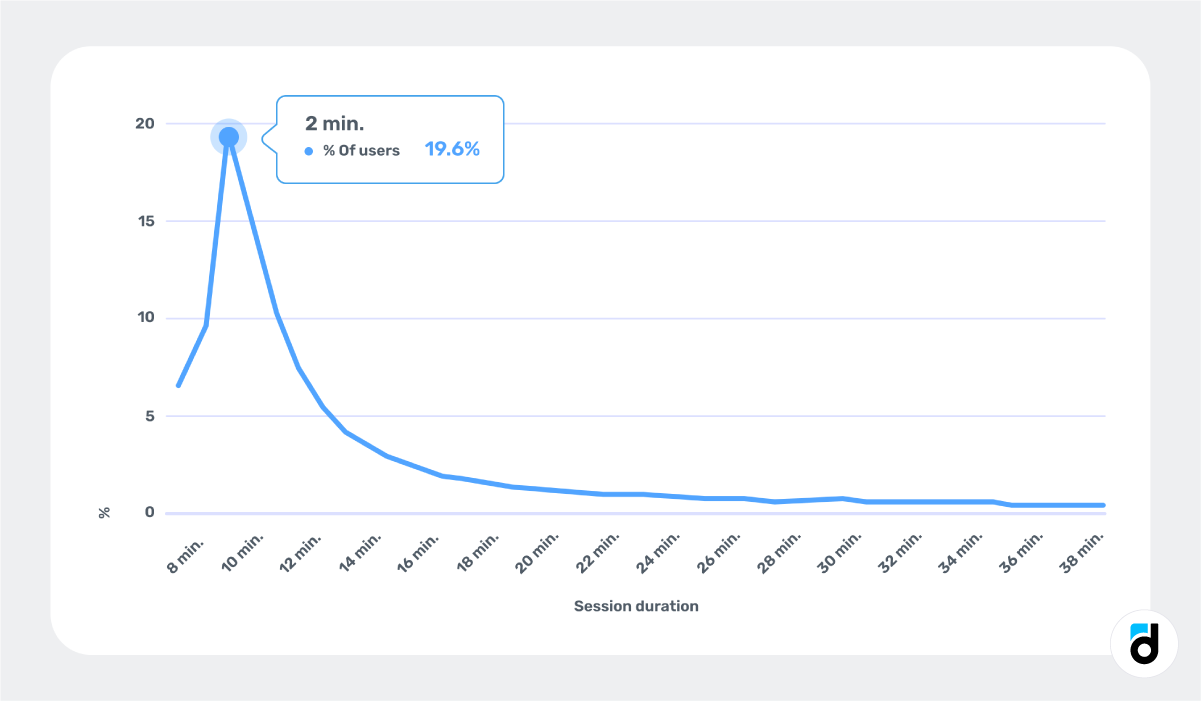
The graph mirrors the one in the preceding image, but with a modified y-axis that now signifies the proportion of all users sharing the same session duration.
This information conveys that, for 20% of users, the initial session duration is 2 minutes. Also, if we were to select a random user and calculate their session length, there is a 20% probability it will be 2 minutes, a 15% probability for 3 minutes, and so forth.
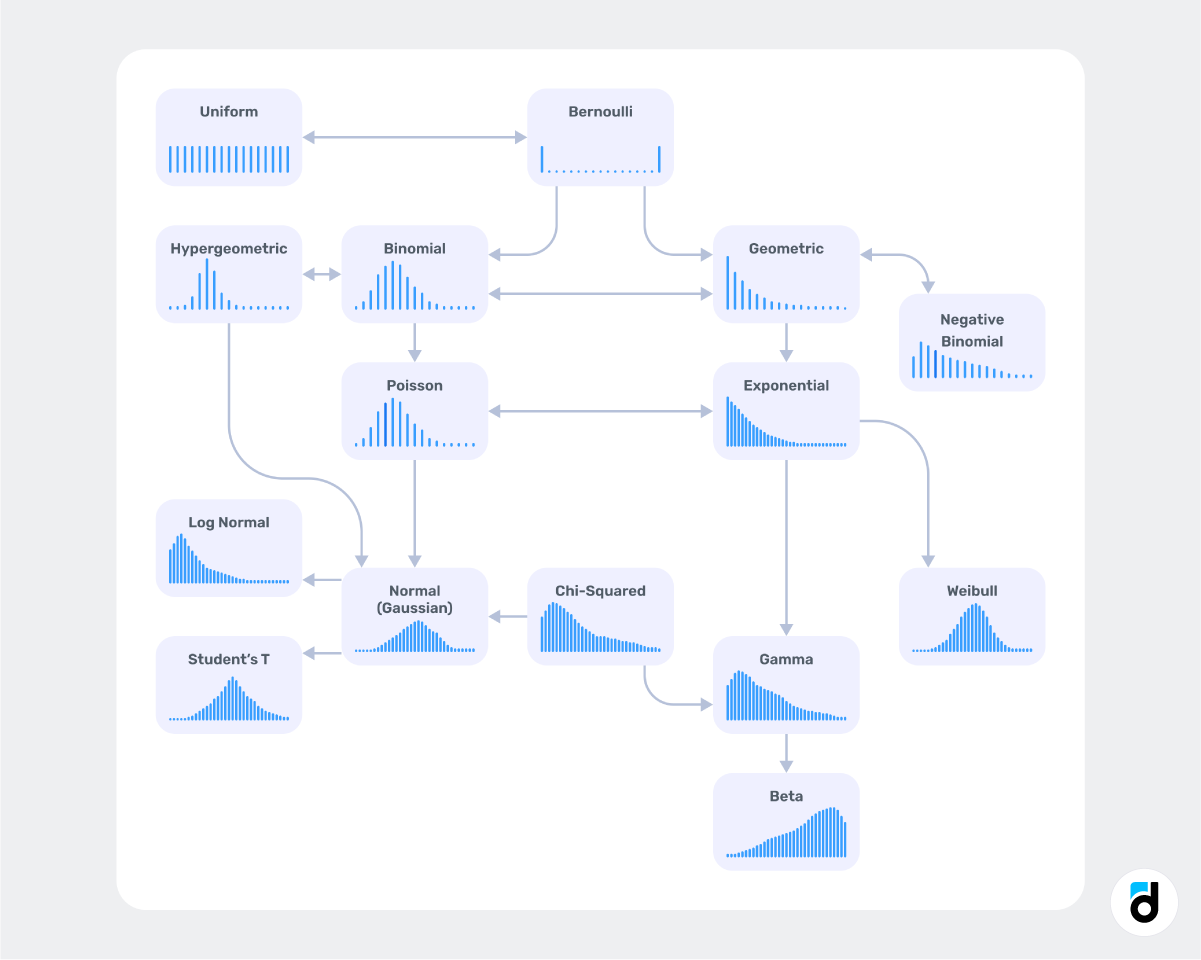
Common statistical distributions include the normal distribution, characterized by a bell-shaped curve, and the uniform distribution, where all values have an equal probability. In each scenario, the mode, mean, and median exhibit distinct patterns. For instance, in a normal distribution, they tend to be nearly identical. In a log-normal distribution, the median consistently falls below the mean, and so forth.
The key takeaway is that reliance on mean values alone is not always necessary. Considering the distribution of an attribute provides valuable insights into the variability and nature of the data.
Read more: Mobile App Metrics to Track for Success
Percentile
A percentile serves as a metric indicating the relative position of a specific value within a dataset, denoting the percentage of values equal to or below the given value.
Let's apply this concept to our example. In the graph, approximately 6% of users had a session duration of around 0 minutes (rounding applied to calculations). This value corresponds to the 6th percentile, signifying that 6% of the sample has a value less than or equal to 0 minutes.
An essential prerequisite for percentile calculation is having properly sorted data.
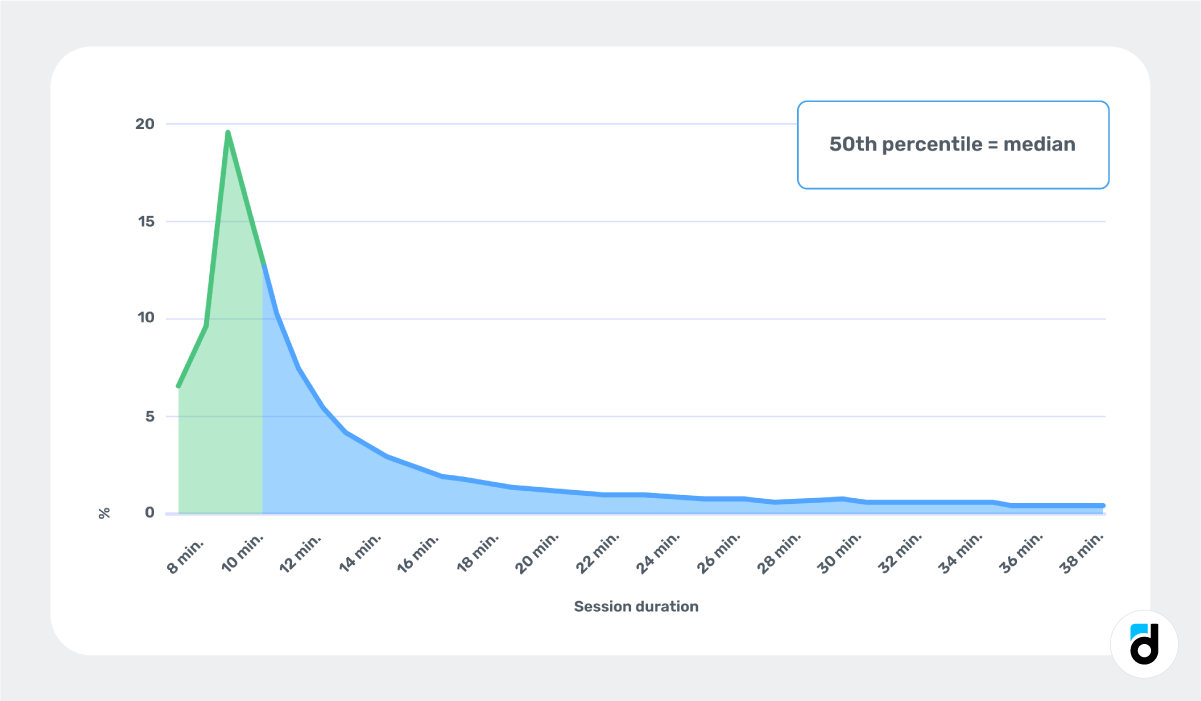
This might sound familiar — it's the same way how we interpret the median. The median is essentially a special percentile, specifically the 50th percentile.
Quartile
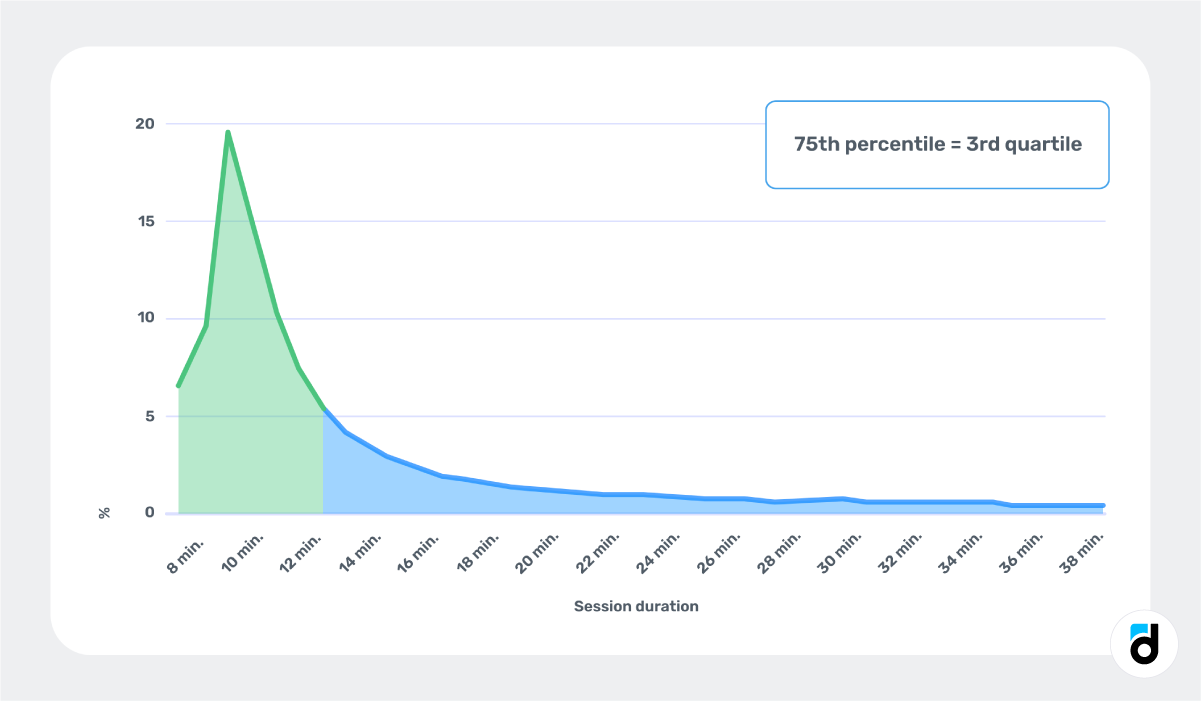
The quartile is a specific instance of the percentile, specifically denoting the 25th percentile. Quartiles serve to divide a dataset into four equal parts, representing distinct segments of the data distribution. These quartiles, labeled as Q1, Q2, and Q3, provide valuable insights. Q2, commonly known as the median, partitions the data into two equal halves. Q1 represents the lower quartile, signifying the value below which the lowest 25% of the data lies. Conversely, Q3 represents the upper quartile, indicating the value below which the highest 25% of the data resides. Quartiles offer a robust tool for comprehending data spread and pinpointing outliers.
For example, a 3rd quartile value of 6 minutes implies that 75% of users experienced their first session in 6 minutes or less, while only 25% had a longer session. This distinction is noteworthy, especially when contrasted with the mean value for the entire sample, which stands at 5.7 minutes. It underscores how statistics can occasionally mask the nuances inherent in the actual data.
Read more: Main Metrics. Average Session Length
Decile
A decile constitutes a 10th part of the overall sample, corresponding to the 10th percentile. The division of a dataset into ten equal parts characterizes deciles, delineating diverse segments of the data distribution. Similar to quartiles, deciles offer a nuanced understanding of data spread. The first decile, denoted as D1, signifies the value below which the lowest 10% of the data resides, while the ninth decile, marked as D9, represents the value below which the lowest 90% of the data falls. Deciles prove particularly valuable in the analysis of large datasets, facilitating the identification of patterns and trends across various segments.
Read more: Glossary of Ad Monetization Terms and Metrics
Let’s Practice
If these terms and indicators seem similar, let's move on to the example.
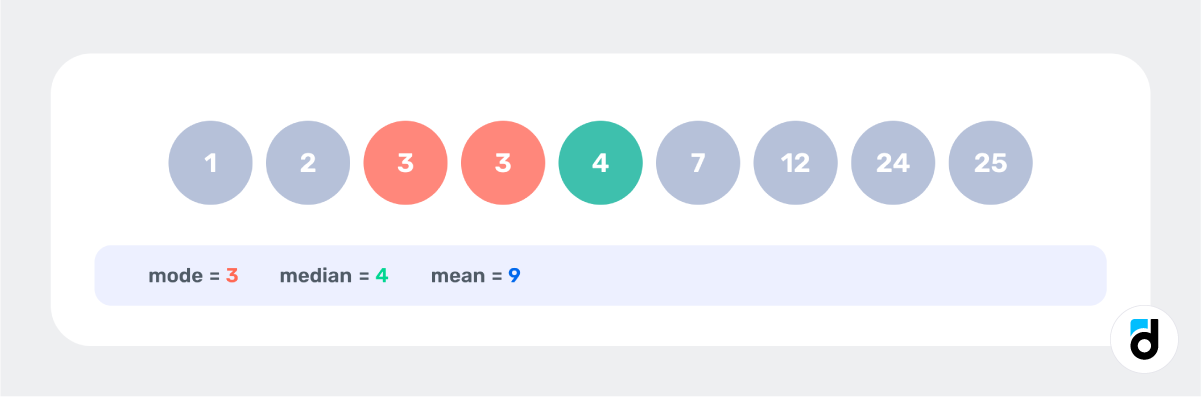
Imagine you're tasked with estimating the duration of app usage during the first session. You manually selected nine users and calculated the first session duration in minutes for each. Now armed with this small dataset, you proceed to calculate the mean, median, and mode.
The most frequently occurring session duration is three minutes, observed in two users.
The median time is four minutes. With nine values, the median, positioned as the 5th value in the sorted list, reveals that half of the users had a first session lasting four minutes or less, while the other half exceeded this duration.
The mean duration of the first session is calculated to be nine minutes.
But could it be that our results were influenced by the luck of the draw with the selected users?
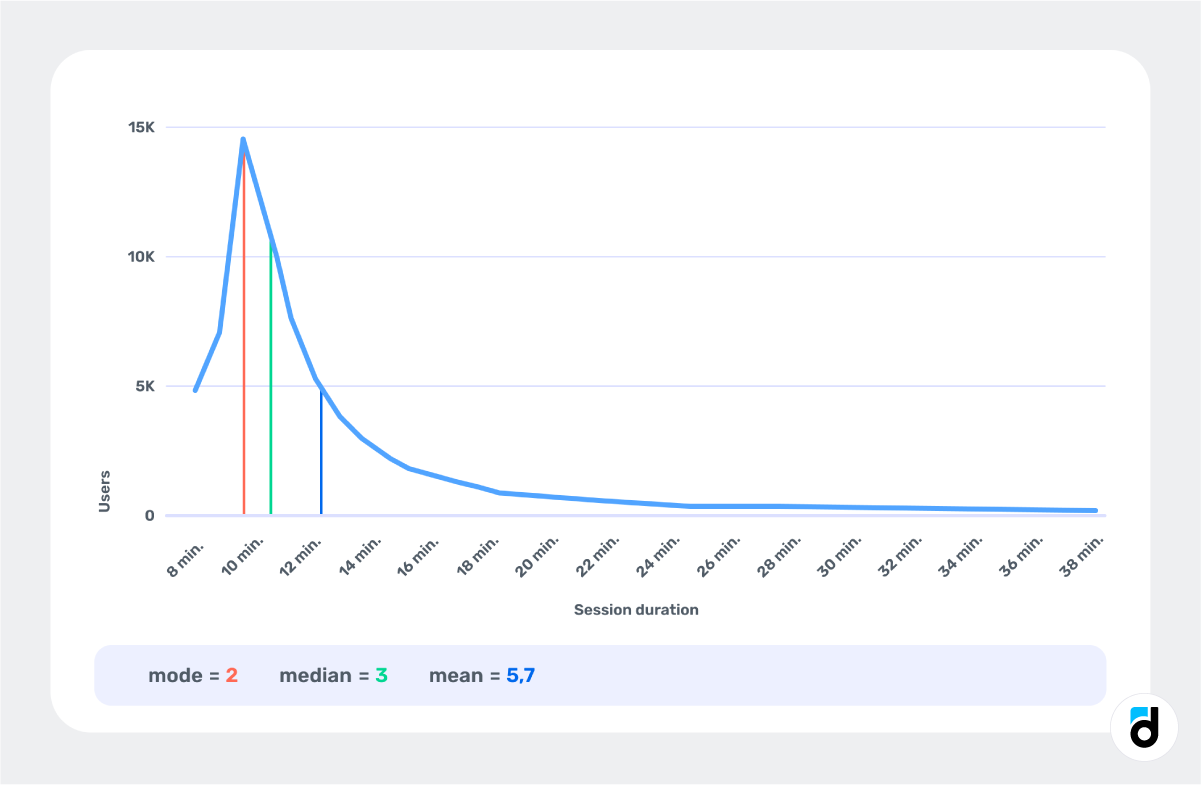
To mitigate this, we expanded our analysis to encompass 75 thousand users in the latest app version, plotting the results on a graph. The x-axis represents session length, and the y-axis denotes the number of users with corresponding session lengths.
Here's what we found: the most common session duration is two minutes, true for nearly 15 thousand users. The median time is 3 minutes, and the mean is 5.7 minutes. Despite the apparent similarity in these indicators, they yield significantly different results.
In real-world scenarios, such variations are commonplace because the distribution of indicators in research can differ markedly.
In conclusion, a grasp of fundamental concepts, statistical terms and indicators is imperative for effective data analysis. We trust that this article equips you to differentiate between these notions and fosters a healthy skepticism toward mean or average data.
Read more: 20 Best Books for Game Analysts