
devtodev is helping you keep in touch with what’s happening in the game market. Every month we publish an overview of reports on the most popular games worldwide, top-grossing games, successful releases, favorite video game types, trends, etc. This overview is prepared by Dmitriy Byshonkov - the author of the GameDev Reports by devtodev Telegram channel. You can read the December and January reports.
Table of Content
- GfK: Hogwarts Legacy is the largest Harry Potter launch in the UK
- NPD: The US gaming market in January dropped by 5% YoY
- ExpressVPN: Millennials in the US & the UK are playing games the most
- GSD: European Game sales dropped in January 2023; PS5 sales skyrocketed
- Sensor Tower: Apex Legends Mobile results
- Newzoo: PC gaming hardware market insights
- DappRadar: Games are responsible for 48% of blockchain activity
- Niko Partners: Gaming Markets of UAE, Saudi Arabia, and Egypt will reach $2.79B in 2026
- Sensor Tower: Mobile Market Downloads in Q4 2022 Report
- GSD & GfK: The UK game sales in January 2023 dropped; PS5 sales increased almost twice
- Newzoo: How people of different ages interact with digital and real worlds
- SocialPeta: Mobile Games marketing in 2022
- AppMagic: Top Mobile Games in January 2023 by Revenue & Downloads
- Tenjin & GameAnalytics: Hypercasual Games benchmarks in Q4 2022
- The Last of Us TV series effect on the game series
- Apptica: Mobile Advertising in 2022
- AppLovin: Mobile Creatives trends in 2022
GfK: Hogwarts Legacy is the largest Harry Potter launch in the UK

-
Physical sales are 64% higher than Harry Potter and the Philosopher’s Stone released in 2001.
-
It’s important to mention that Harry Potter and the Philosopher’s Stone's peak sales were in the second week due to the movie's release. Even in this case, physical sales of Hogwarts Legacy are 2% higher.
-
Physical sales of Hogwarts Legacy are 80% higher than Elden Ring’s.
-
82% of copies sold in the UK are for the PlayStation 5. The remaining 18% are for the Xbox Series S & X.
NPD: The US gaming market in January dropped by 5% YoY

-
The US people spent $4.3B on games in January 2023. It’s a 5% decline compared to the previous year.
-
$3.79B (88%) has been spent on software. Hardware sales remained the same - $393M.
-
PlayStation 5 is the January leader by both unit sales and revenue. Nintendo Switch is second.
-
Call of Duty: Modern Warfare 2 is January’s best-selling game. Dead Space successfully started from second place; Madden NFL 23 is third.
-
Accessories sales dropped by 14% YoY to $165M. Black DualSense is a best-seller.
ExpressVPN: Millennials in the US & the UK are playing games the most
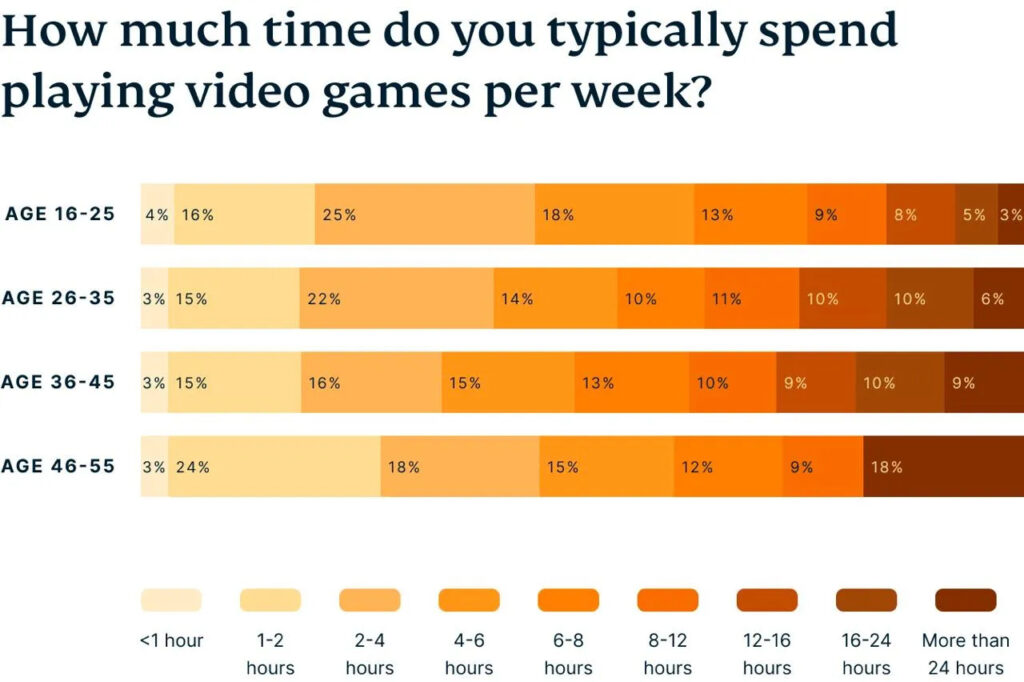
Service made a survey of 1,000 gamers from the US and 1,000 gamers from the UK.
-
68% of millennials are playing games daily. Among generation Z there are only 58% of such game lovers.
-
Millennials are spending more time playing games than younger generations. Moreover, 59% of millennials are playing games at night harming their sleep.
-
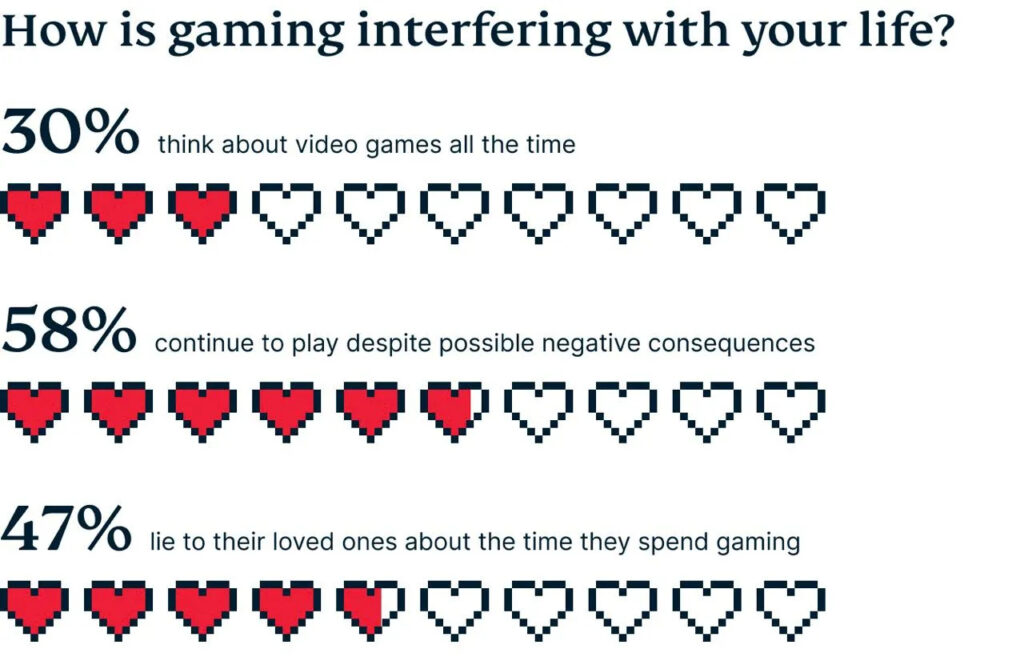
5% of millennials and 3% of generation Z are feeling addicted to games. The most common outcome of such addiction is an inability to focus on other activities.
-
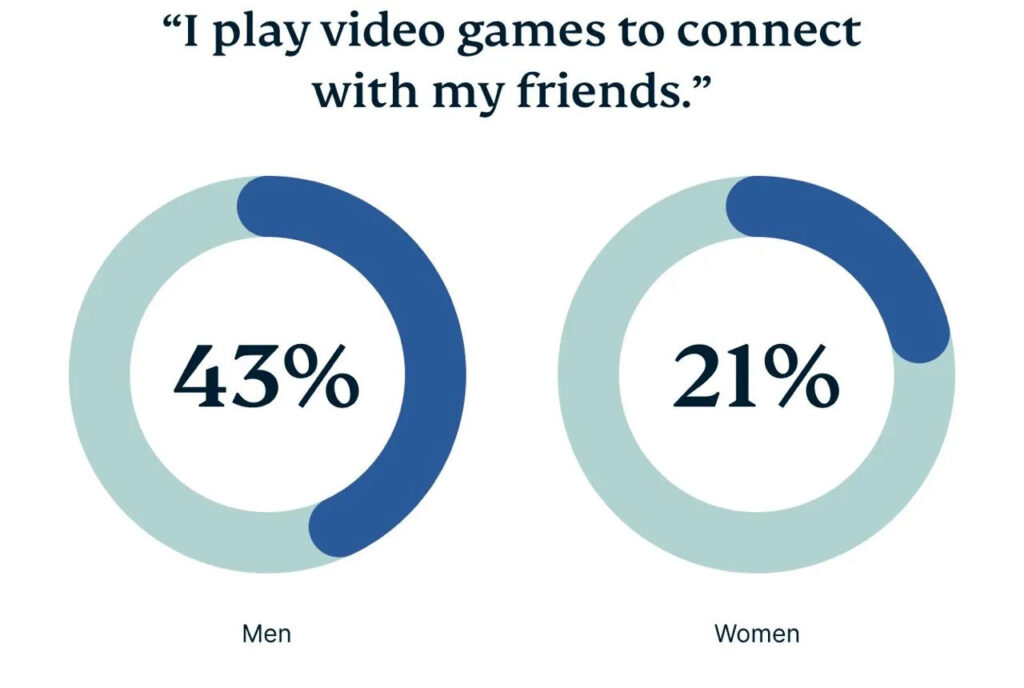
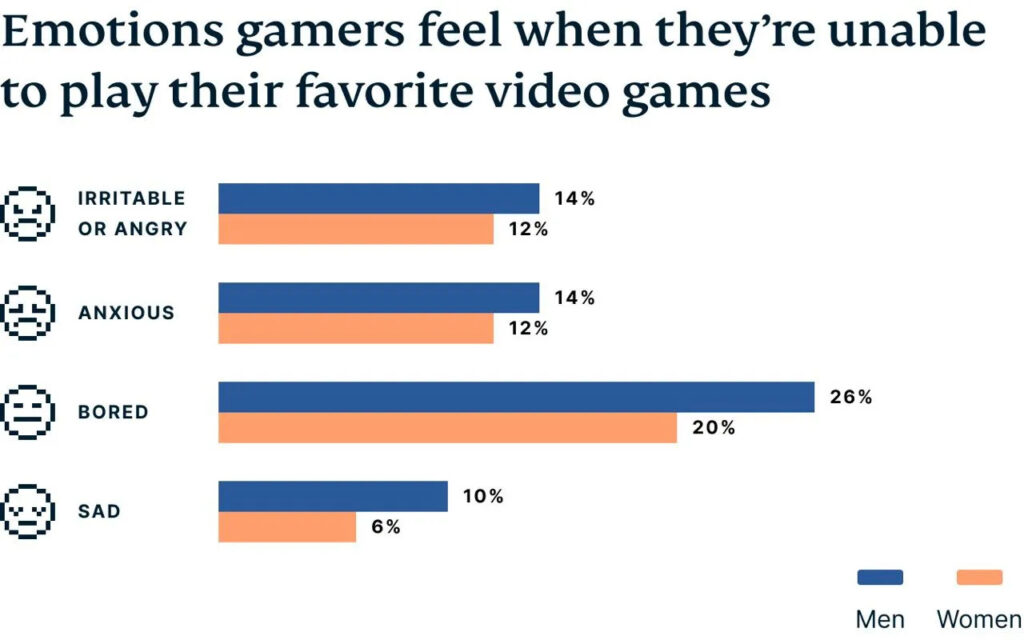
The emotional connection of men to games is stronger. For 43% of men, games are the socialization method. And only 21% of women are connecting with friends when playing games. Plus, men are feeling negative emotions when being unable to play their favorite game more often than women.
-
79% of respondents are playing retro games. For 38% of them, nostalgia is the main driving factor.
-
70% of interviewees are playing on mobile devices; 61% - on consoles; 50% - on PC/laptop. 34% are using the tablet, and 9% - VR-devices.
GSD: European Game sales dropped in January 2023; PS5 sales skyrocketed

Games
-
12.1M games were sold in Europe in January 2023. It’s 19% lower than a year before.
-
FIFA 23, Grand Theft Auto V, and Red Dead Redemption 2 are top-sellers.
-
Dead Space remake started from the 6th place on the chart. However, data comparison of the first two sales with The Callisto Protocol shows that the European audience liked the latter more.
Consoles and accessories
-
493k consoles were sold in Europe in January 2023 (without the UK & Germany). It’s 15.5% more than a year before.
-
PlayStation 5 sales showed a massive growth of 202% YoY. It’s connected with a supply restore.
-
Nintendo Switch is second (-11% YoY), and Xbox Series S|X is third (-32% YoY).
-
1.76M accessories were sold in January 2023 - a 2.1% decline MoM. DualSense is still the best-selling accessory.
Sensor Tower: Apex Legends Mobile results
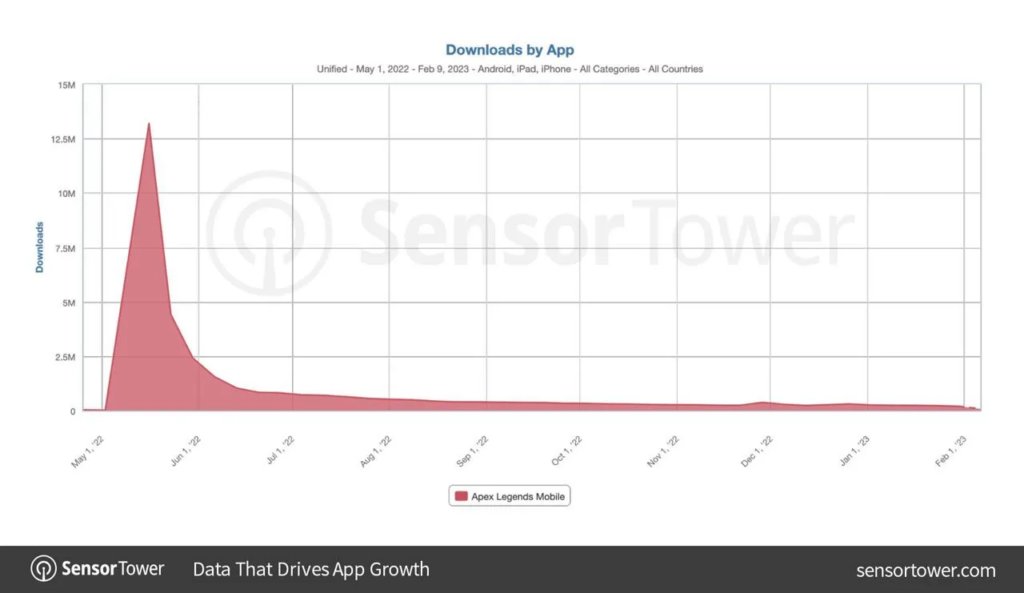
-
Since its release, the game received $37M from users and generated 37M downloads.
-
Revenue of Apex Legends Mobile dropped by 96% in 8 months since its release. The shooters market in general decreased by 25% YoY in Q4 2022.
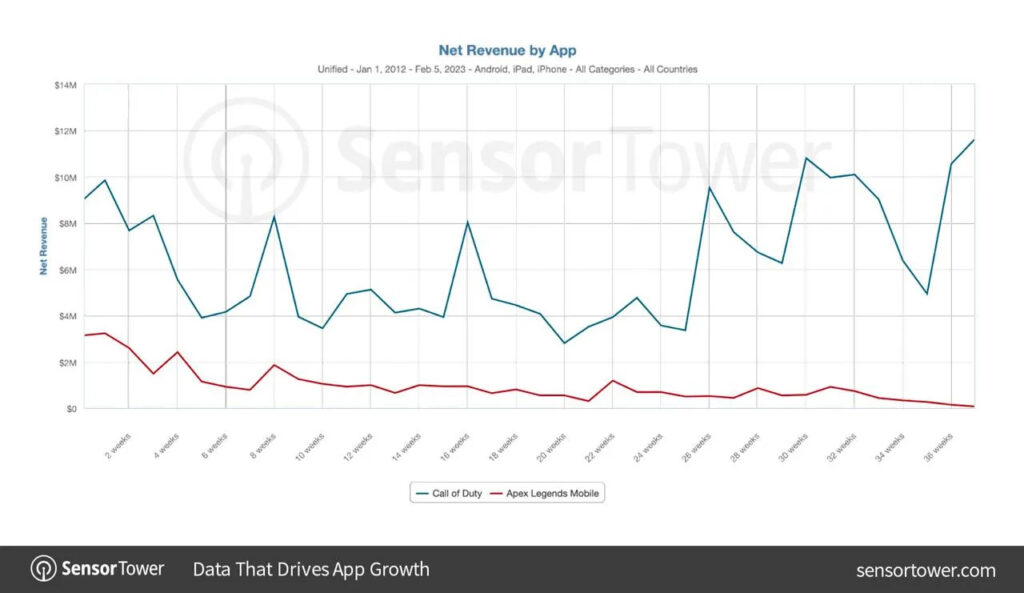
-
However, Call of Duty Mobile revenue (main Apex Legends Mobile benchmark) increased in the same period by 7%.
Other interesting numbers of EA mobile journey
-
Glu Mobile (was purchased by EA in 2021) games revenue in Q4 2022 was 64% lower than in Q2 2021 (moment of acquisition).
Newzoo: PC gaming hardware market insights
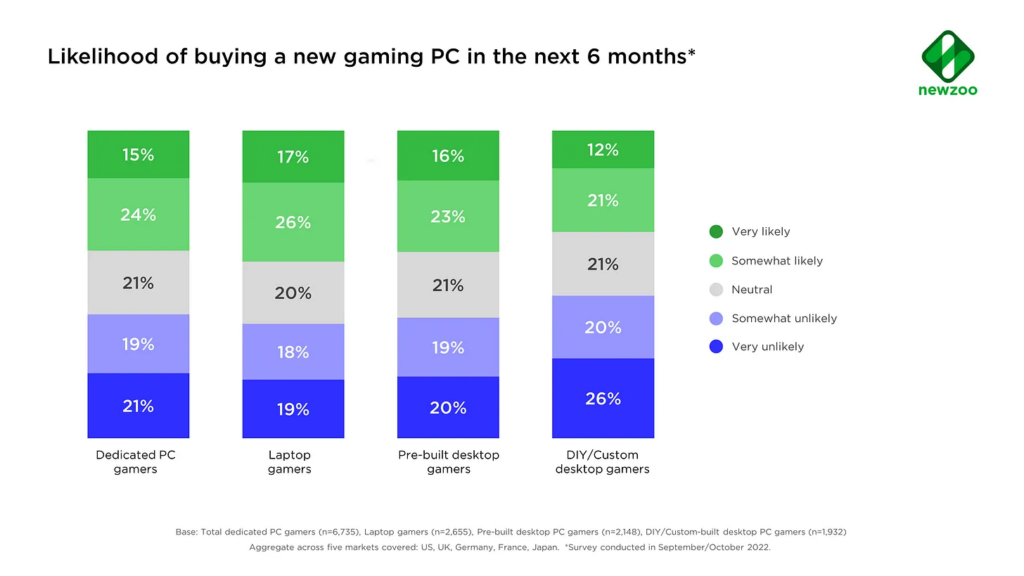
Newzoo surveyed US, UK, Germany, France, and Japan users from September 2022 to October 2022.
Buying a new gaming PC
-
39% of dedicated gamers (those who play once a week or more often on the PC) are planning to buy new hardware to play in the next 6 months. In 2021 there were 55% of such users.
-
40% of dedicated gamers do not have plans of updating their gaming hardware. In 2021 there were only 29% of them.
-
Laptop gamers are the most interested segment in buying new gaming hardware. Less interested are those who have built their gaming PC by themselves.
Upgrading the existing gaming PC
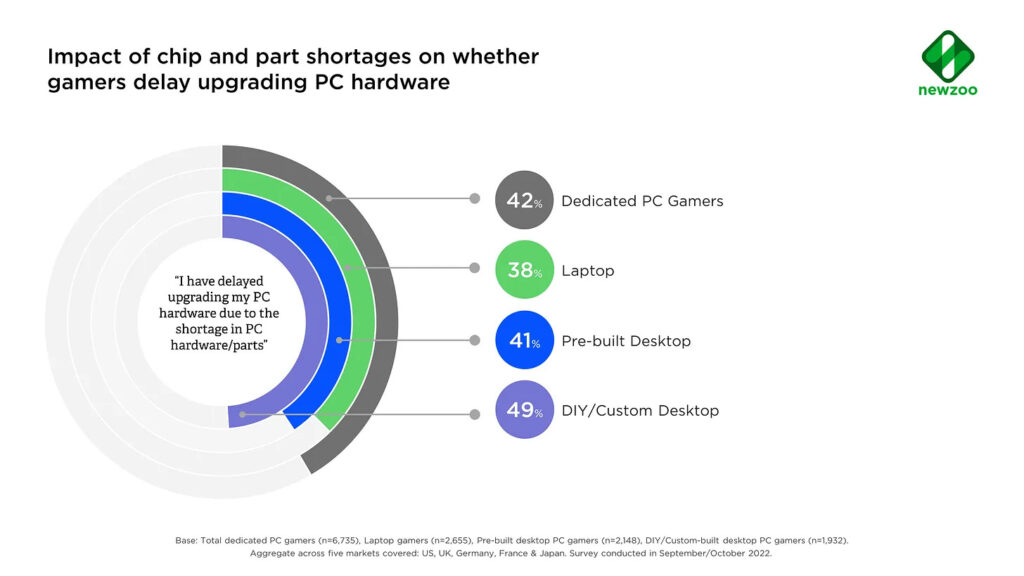
-
42% of dedicated gamers postponed the update of their gaming PC until better times. It’s connected with both a lack of hardware and price increases.
-
33% of dedicated gamers agreed on more budget gaming PC updates; 40% decided to overpay for the hardware they wanted.
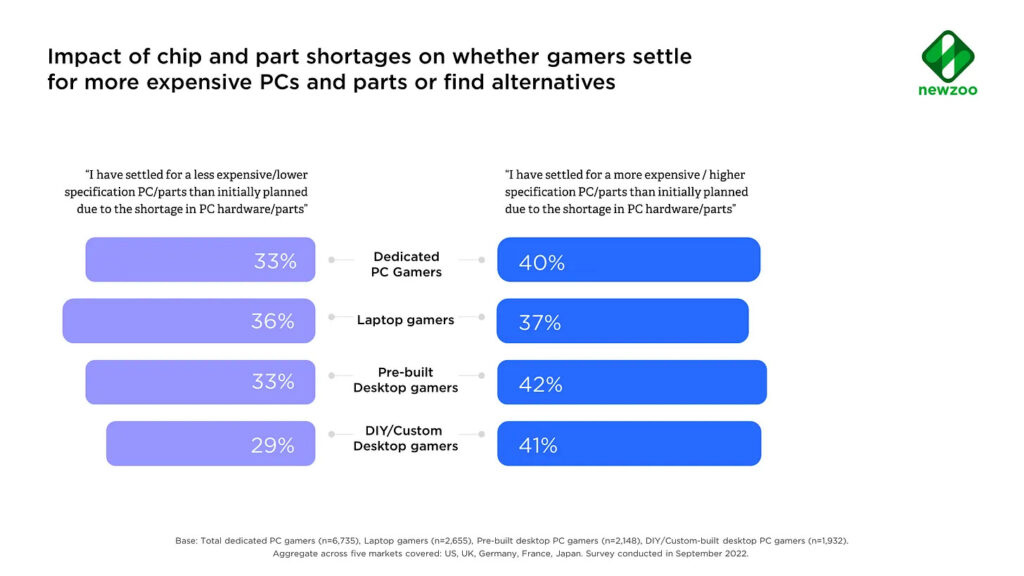
-
Players who are buying pre-built desktops are most inclined to overpay - 42% of gamers in this category did it.
DappRadar: Games are responsible for 48% of blockchain activity
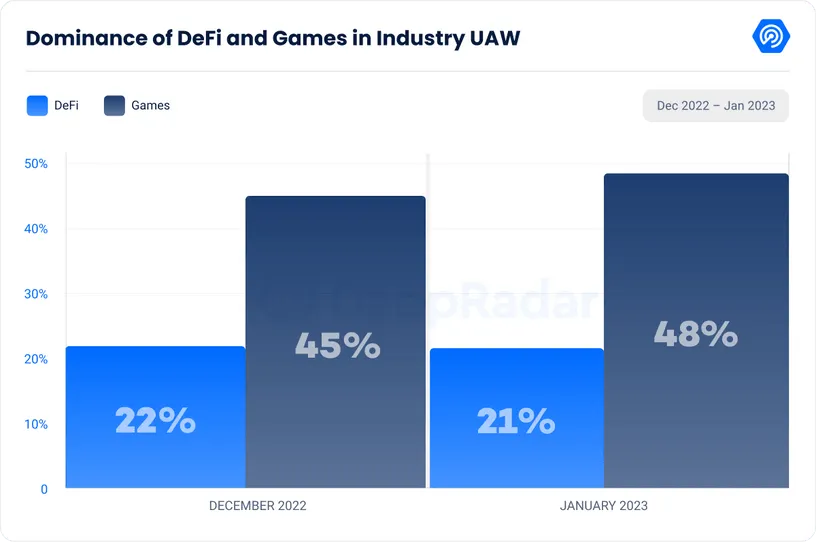
-
DappRadar is sharing information about UAW (unique active wallets) that perform transactions. In January 2023, 48% of all blockchain activities came from blockchain games. In December 2022 this number was 45%.
-
However, this number shouldn’t mistake you. The overall number of UAW in blockchain games in January was 839k. That’s too far from the massive adoption.
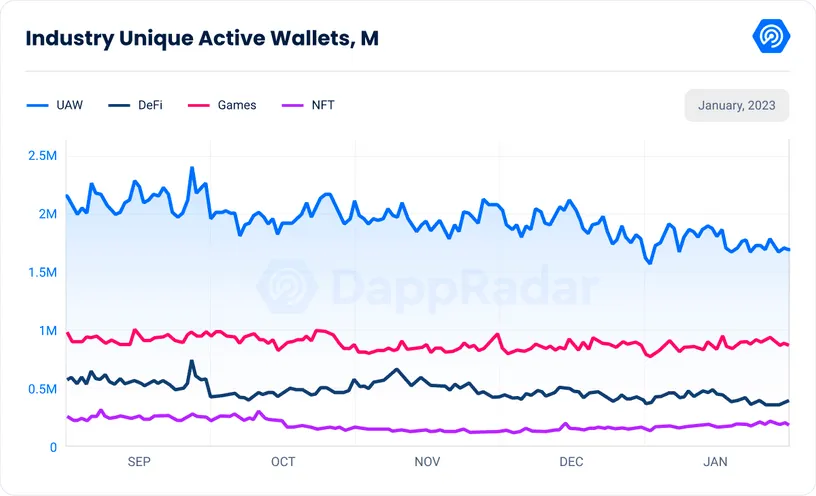
-
It’s also fair to mention that despite the growing share of UAW in games, it’s overall number decreased by 0.89% compared to December. The overall number of UAW dropped by 9.55%.
Niko Partners: Gaming Markets of UAE, Saudi Arabia, and Egypt will reach $2.79B in 2026
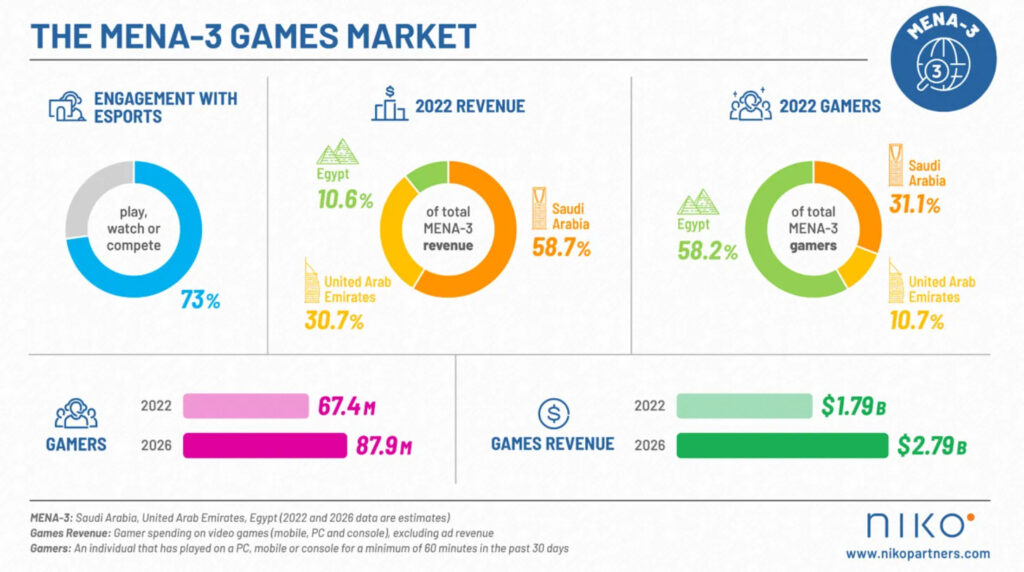
Niko Partners call UAE, Saudi Arabia, and Egypt the MENA-3 markets.
-
The market intelligence agency evaluated the size of those markets in 2022 at $1.8B. In 5 years their CAGR will be about 10%.
-
The number of gamers in MENA-3 markets reached 67.4M in 2022. By 2026 this amount will increase to 87.3M with a 6% CAGR.
-
Egypt is the country with the largest gaming population, and it’s also the fastest growing. Saudi Arabia is the leader in revenue, and UAE is the ARPU leader.
-
76% of gamers in Egypt, UAE, or Saudi Arabia are younger than 35 years. In Egypt, a significant number of gamers are younger than 25.
-
73% of gamers in MENA-3 markets are interacting with eSports content.
Sensor Tower: Mobile Market Downloads in Q4 2022 Report
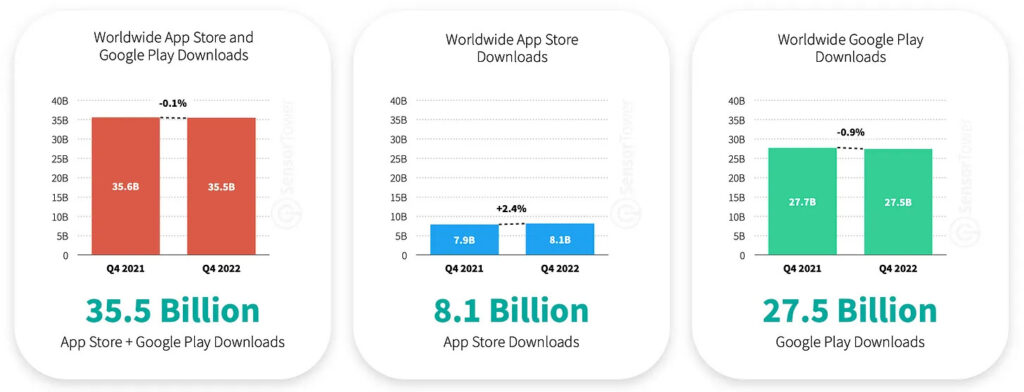
Overall numbers
-
Apps downloads worldwide in Q4 2022 reached 35.5B. A decline from the previous year is 0.1%.
-
Downloads in the App Store increased by 2.4% YoY to 8.1B. Downloads in Google Play decreased by 0.9% YoY to 27.5B.
-
Stumble Guys was the fastest-growing app by downloads in the world.
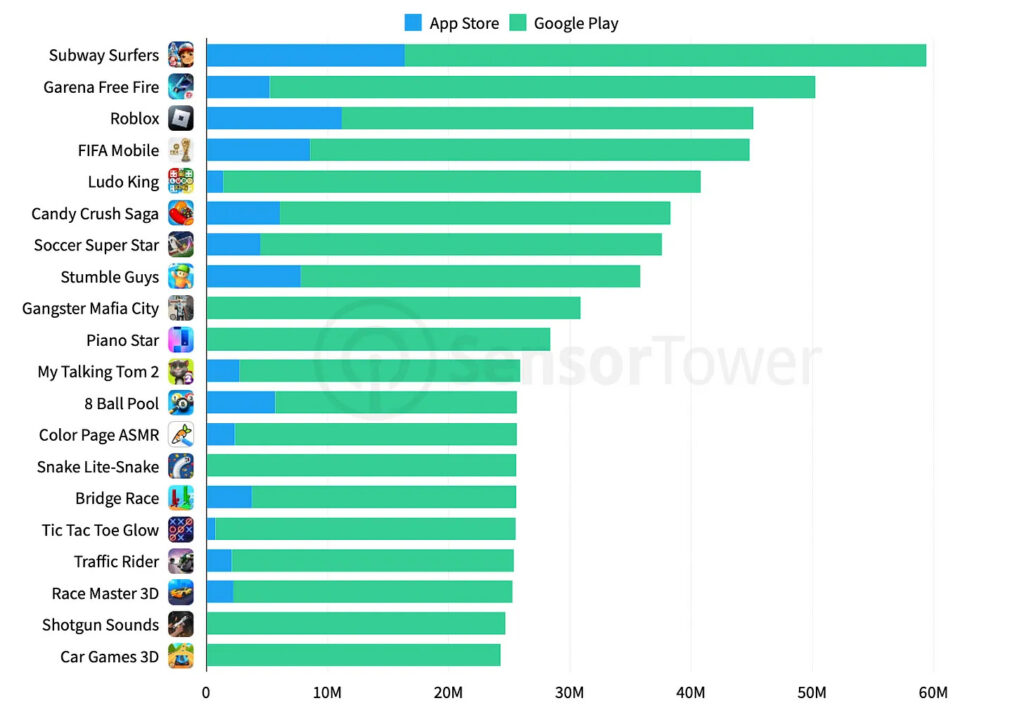
Downloads - games
-
The number of downloads in games in the Q4 2022 in AppStore is 6.9% lower than in Q4 2021. Google Play is showing growth of 0.6%.
-
Subway Surfers was downloaded 59M times in Q4 2022. It’s 29% lower than in the previous quarter.
-
The World Cup helped FIFA Mobile to reach 44M downloads with a QoQ growth of 137%.
-
Games from the App Store's top 20 increased download results significantly compared to the previous quarter.
-
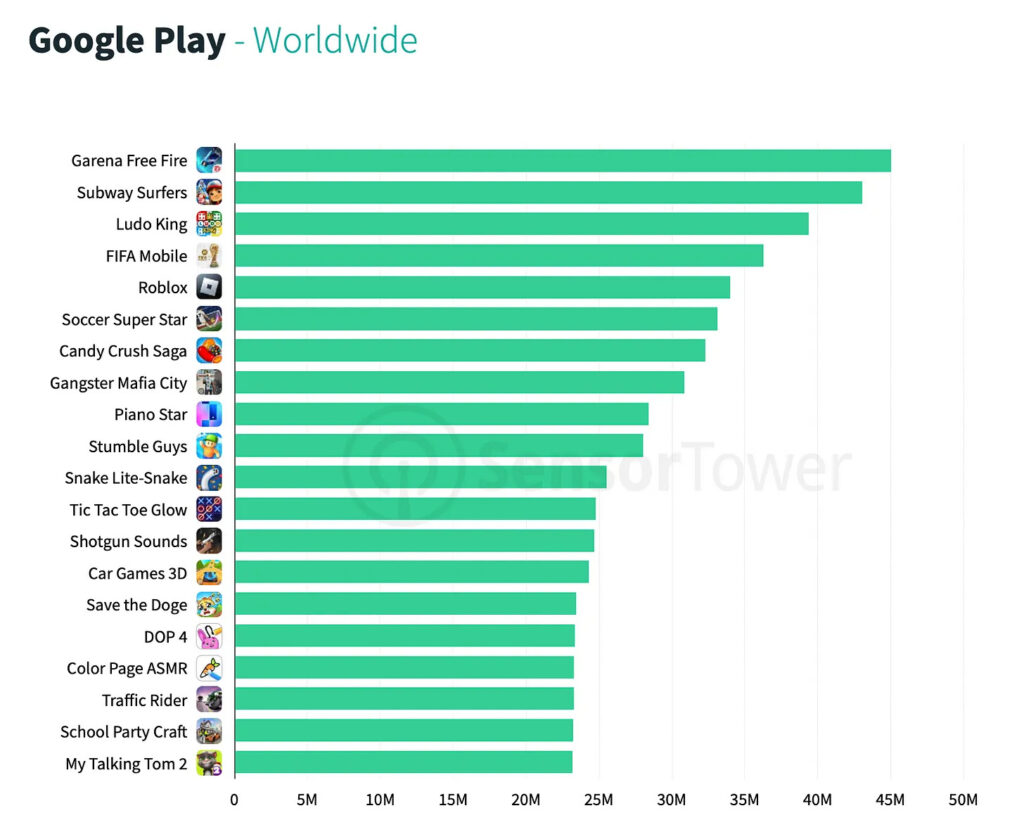
Garena Free Fire received almost 45M downloads in Google Play in Q4 2022. It’s the most popular game on the platform despite a decrease in downloads by 15.8% QoQ.
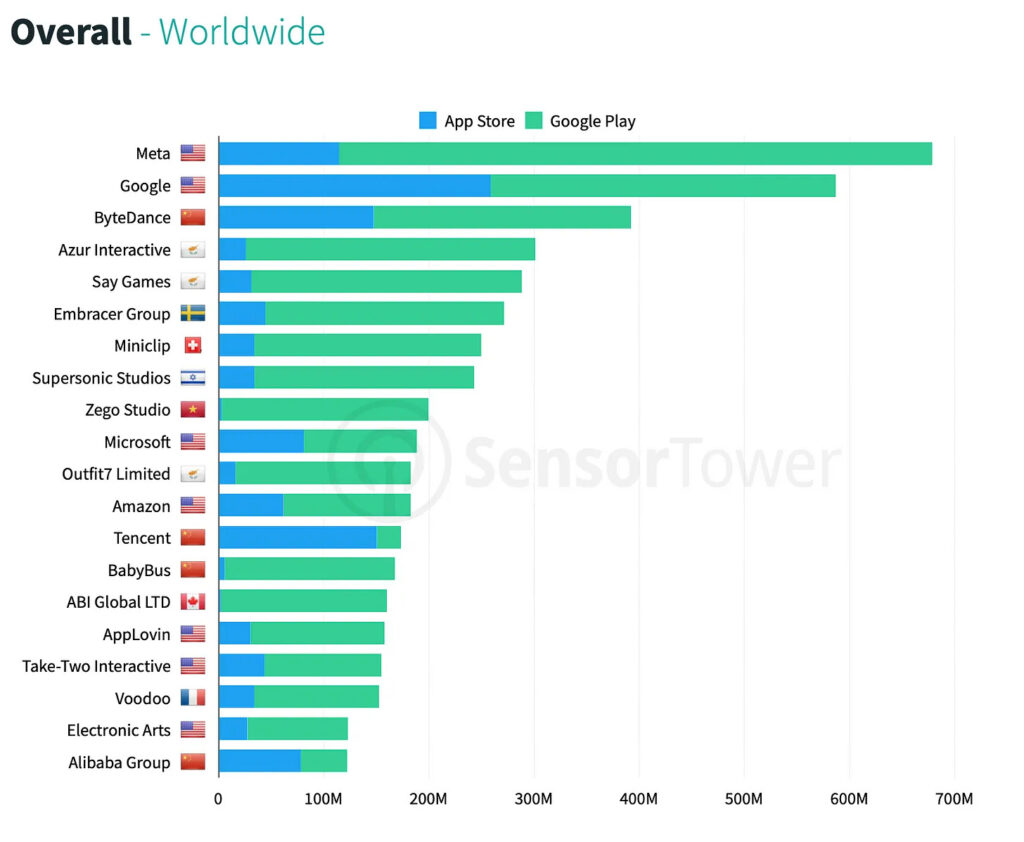
Downloads - publishers
-
6 out of 10 companies in the top 10 by downloads are game publishers. It’s Azur Interactive, Say Games, Embracer Group, Miniclip, Supersonic Studios, and Zego Studio.
Downloads - countries (all apps)
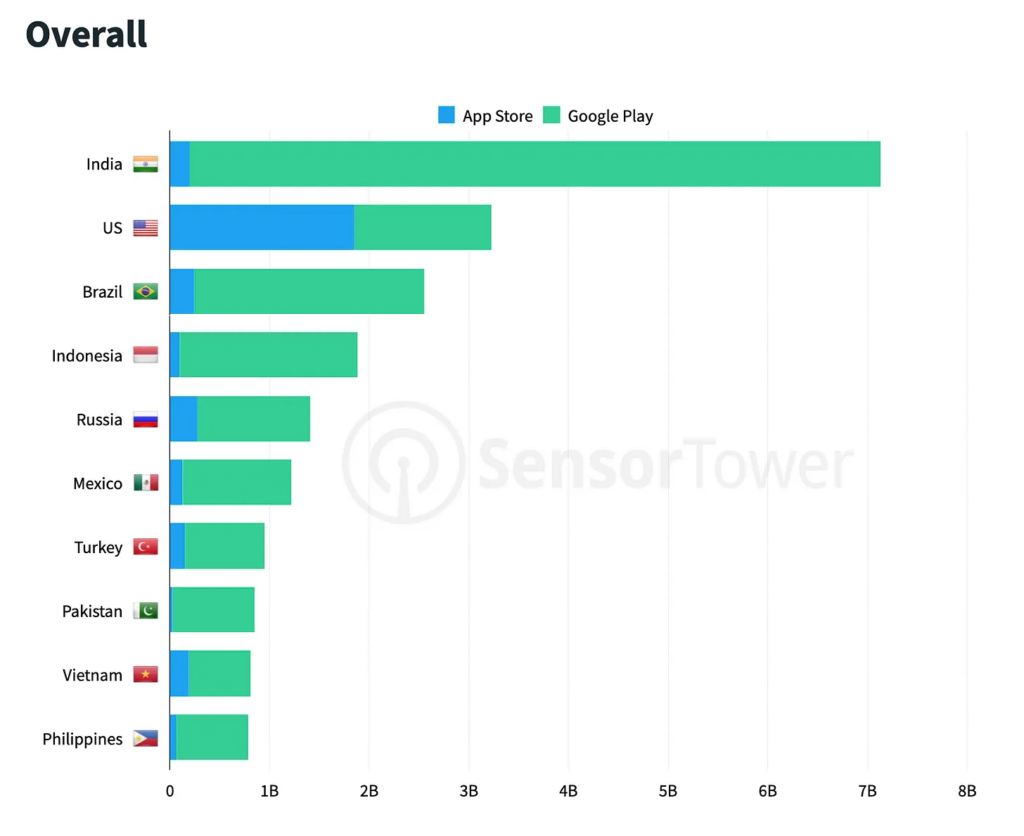
-
India (7.1B), the US (3.2B), Brazil (2.5B), Indonesia (1.9B), and Russia (1.4B) are the top-5 countries in the world by downloads.
-
The number of downloads in the US compared to Q4 2021 increased on both iOS (+0.3%) and Android (+2.4%).
Sensor-Tower-Q4-2022-Data-DigestDownload
GSD & GfK: The UK game sales in January 2023 dropped; PS5 sales increased almost twice

Games
-
2.24M games were sold in the UK in January 2023. It’s 4.4% less than a year before.
-
Analysts are connecting it with a lack of new releases. In January 2022 the release of Pokemon Legends: Arceus happened.
-
FIFA 23 was the leader in sales in the UK in January 2023. GTA V and Call of Duty: Modern Warfare 2 are next.
-
Dead Space remake started from the 6th position on the chart.
Consoles
-
More than 125k consoles have been sold in the UK in January.
-
PlayStation 5 sales increased by 98% compared to the previous year. The main reason for such growth is that last year there was a significant problem with supply.
-
55% of sold PS5 consoles are bundled with God of War Ragnarok.
-
Nintendo Switch is in second place by sales. And the tempo continues to decline.
Newzoo: How people of different ages interact with digital and real worlds
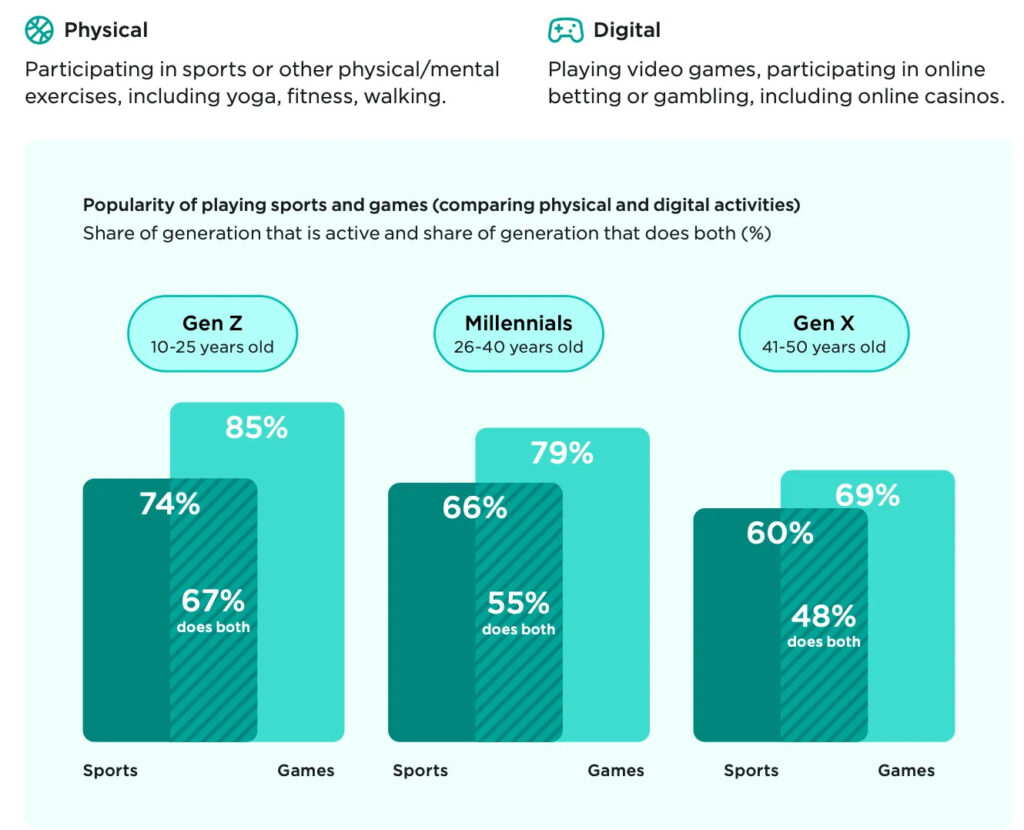
All numbers are relevant for the US market. Newzoo conducted research with people from 10 to 50 years old.
-
67% of Generation Z (from 10 to 25 years old) play in both real life (doing sports) and virtual worlds. There are 55% of such people from Millenials, and 48% from Generation X (41-50 years).
-
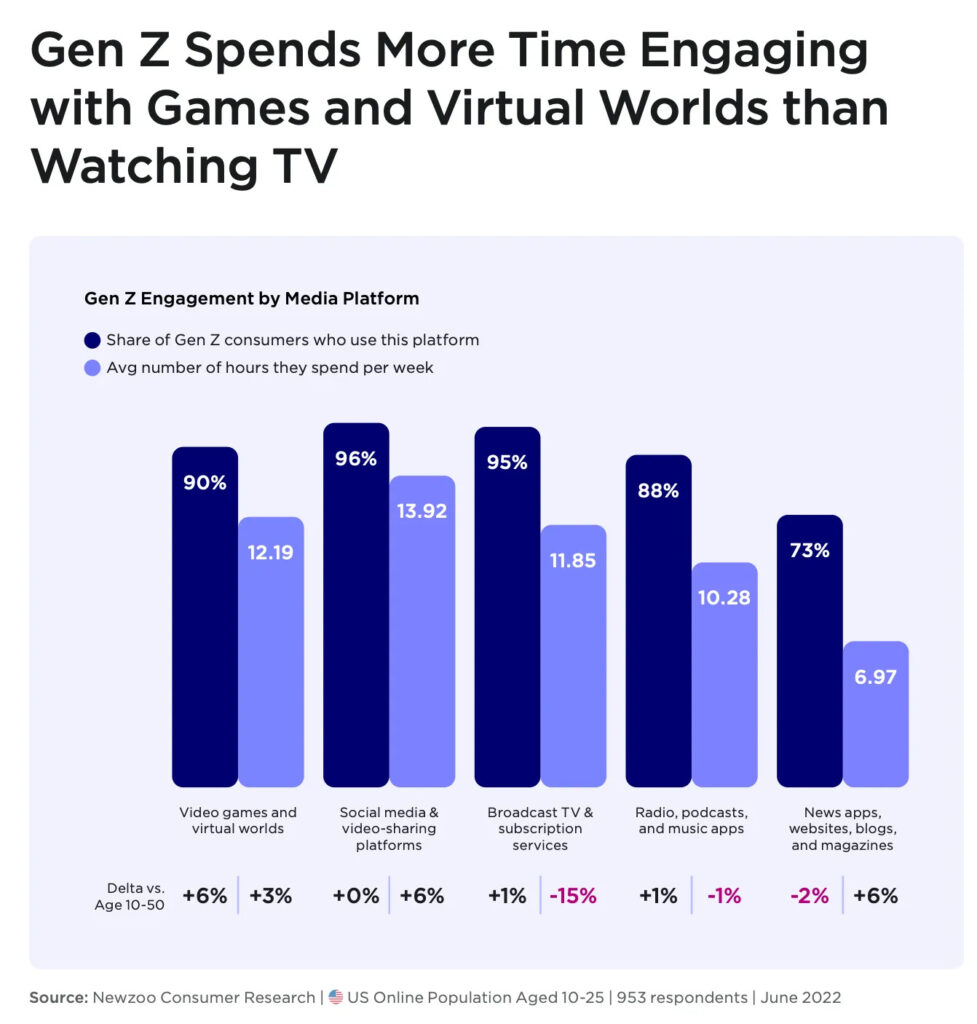
Generation Z (10-25 years) spends about 12.2 hours per week on games.
-
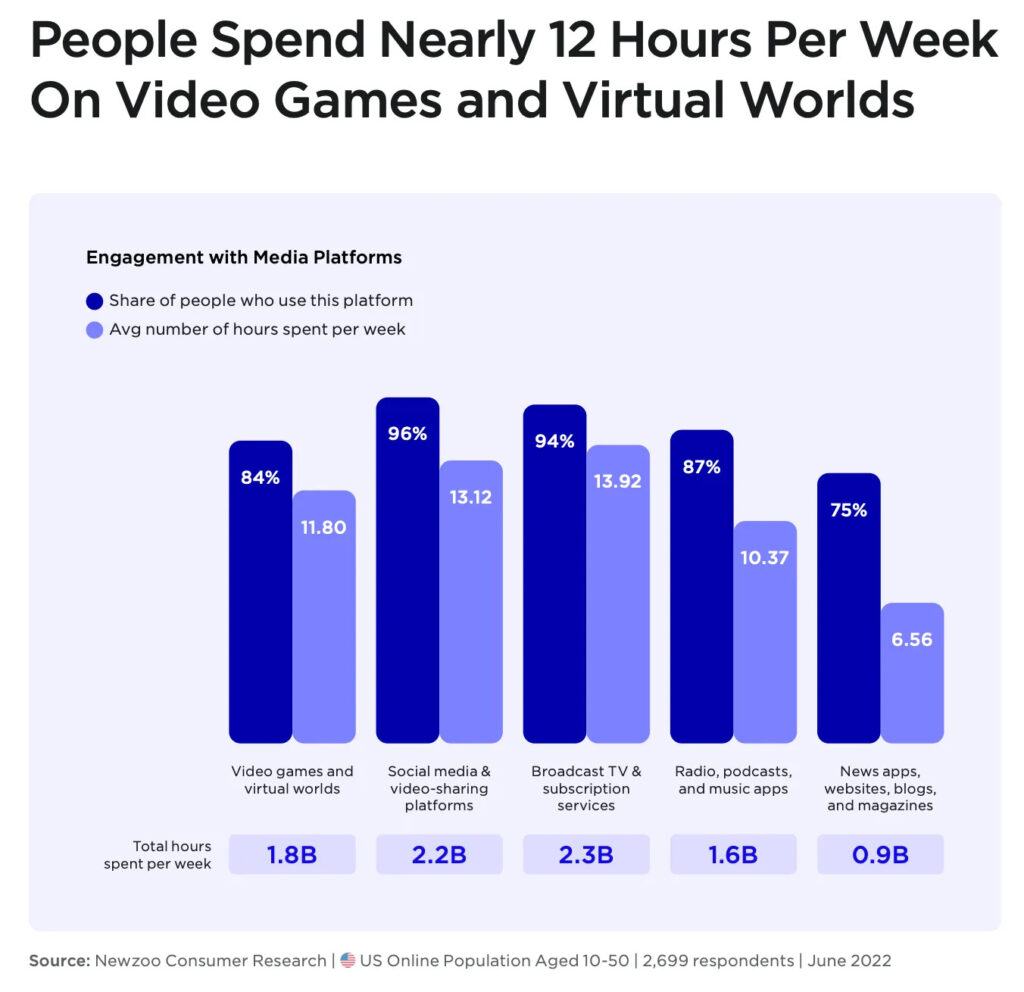
Mobile devices are the dominant platform for content consumption. The average person in the US is spending about 4.3 hours per day with a smartphone in their hands. All other devices combined are talking about 3 hours per day.
-
People of all ages in the US are spending in games & virtual worlds about 12 hours per week. This amount counts people who are not playing games at all. If we count only gamers, the number will increase to 14.46 hours per week.
-
Gaming content is becoming more & more popular outside of the gaming community. TV series, movies, and bloggers are helping it.
-
Generation Z (10-25 years) in the US is spending more time playing games than watching TV.
-
People in the US are spending on average 4.5 hours per day on passive content consumption (watching or listening to something) and 4.3 hours per day on active (reading, creating something, playing).
-
Only 47% of all gaming content consumption in the US is actually playing. The remaining is creating something new, reading about games, watching new content, and listening to podcasts & radio about games.
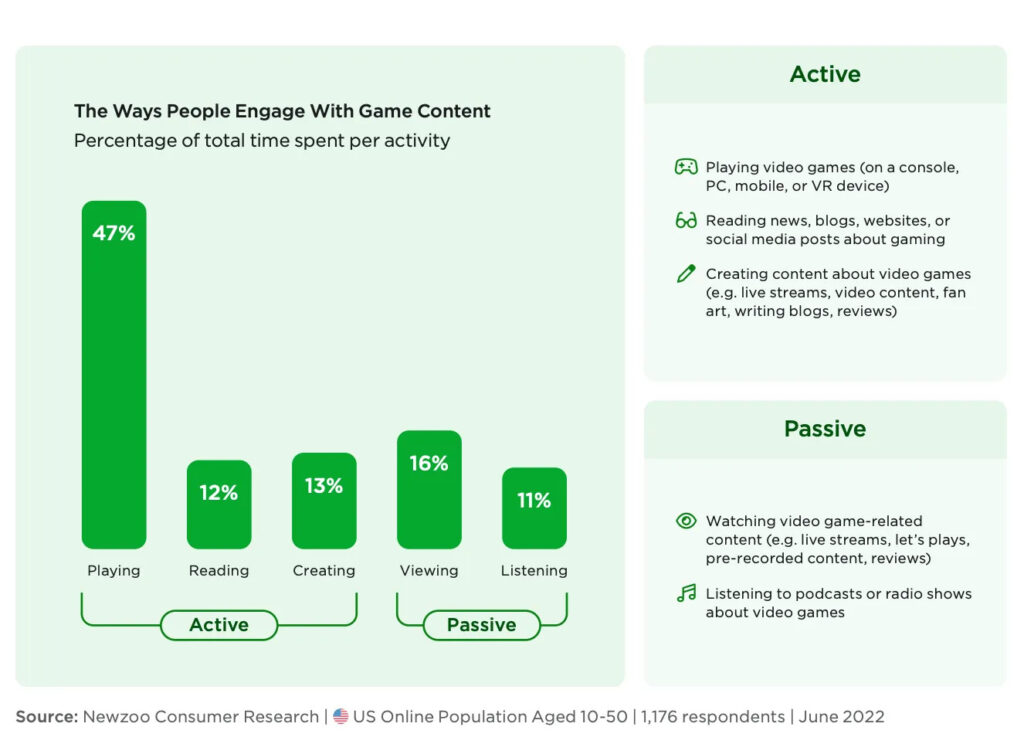
-
People in the US, on average, are spending 6.6 hours per day on digital activities and 2.9 hours on physical.
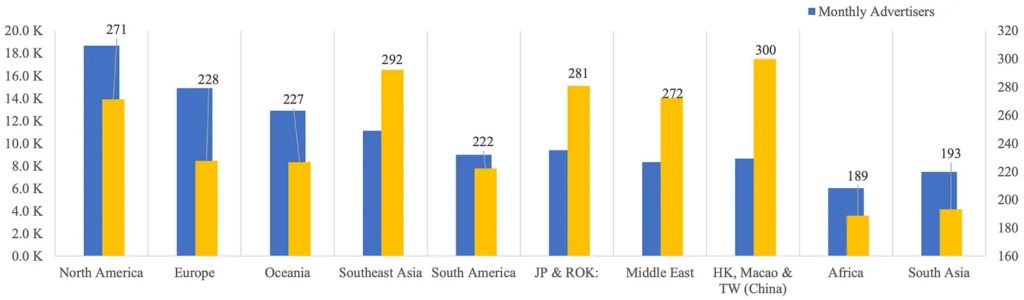
SocialPeta: Mobile Games marketing in 2022
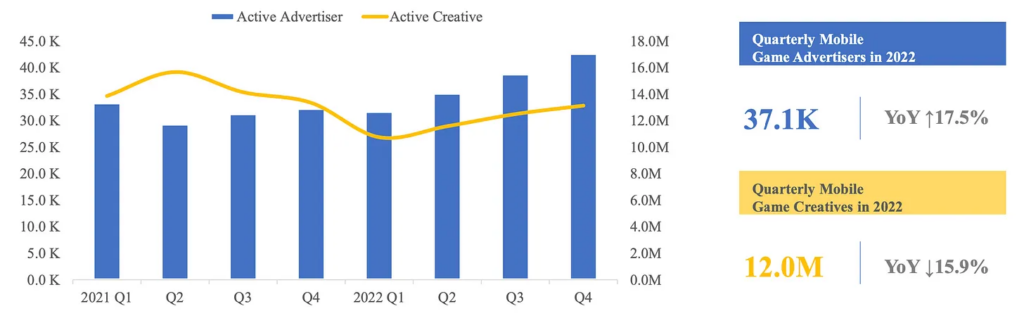
-
The number of advertisers in Q4 2022 increased to 37.1k (+17.5% YoY).
-
The number of creatives despite growth in all quarters of 2022 was lower than in 2021 by 15.9% (12M creatives).
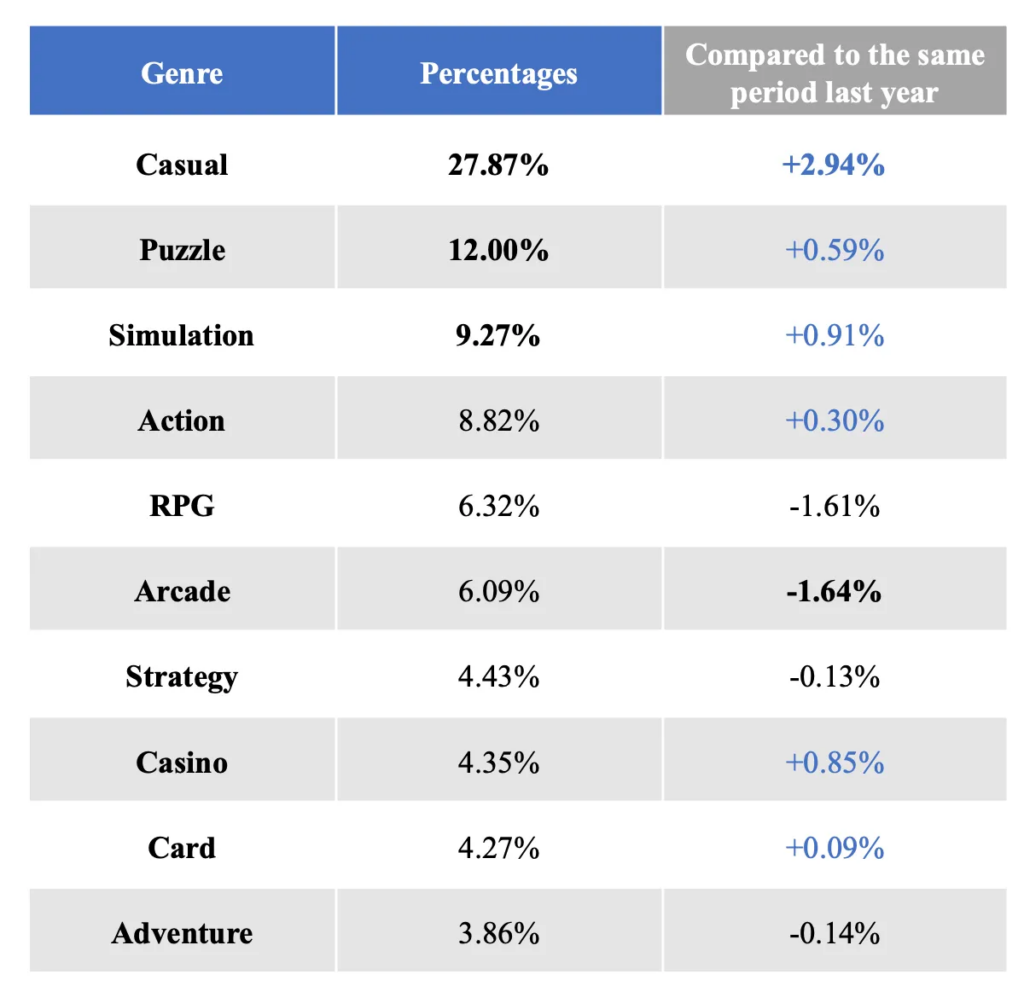
-
Casual games (27.87%), puzzles (12%), and simulators (9.27%) are the genres with the largest share of advertisers.
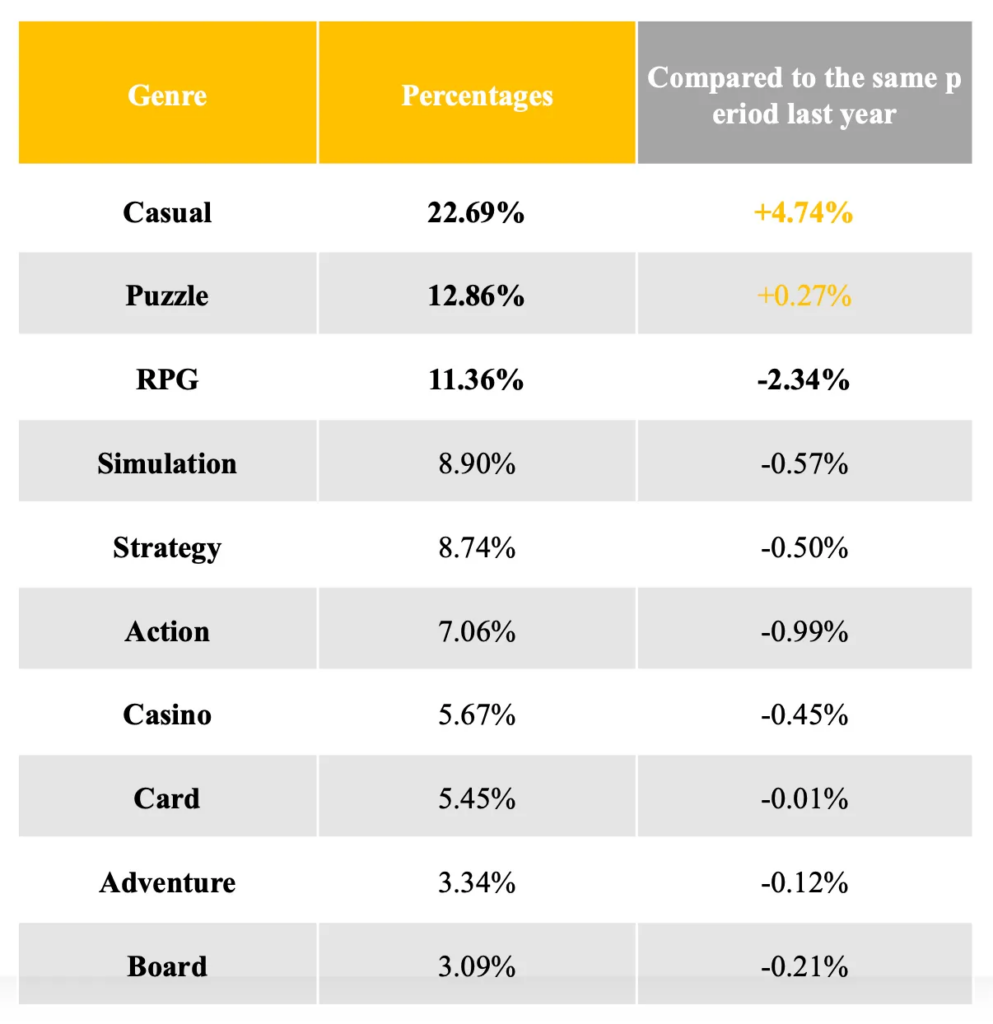
-
Casual games (22.69%), puzzles (12.86%), and RPG (11.36%) are leaders by the number of creatives.
-
The US by the end of 2022 has become the leader by a number of advertisers. Asian users saw the most creatives last year.
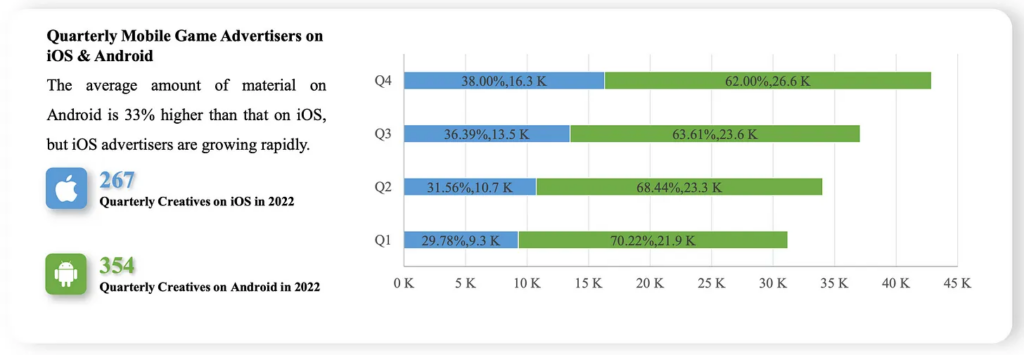
-
The share of advertisers on iOS was increasing during the year. Its share increased from 29.78% in Q1 2022 to 38% in Q4 2022.
-
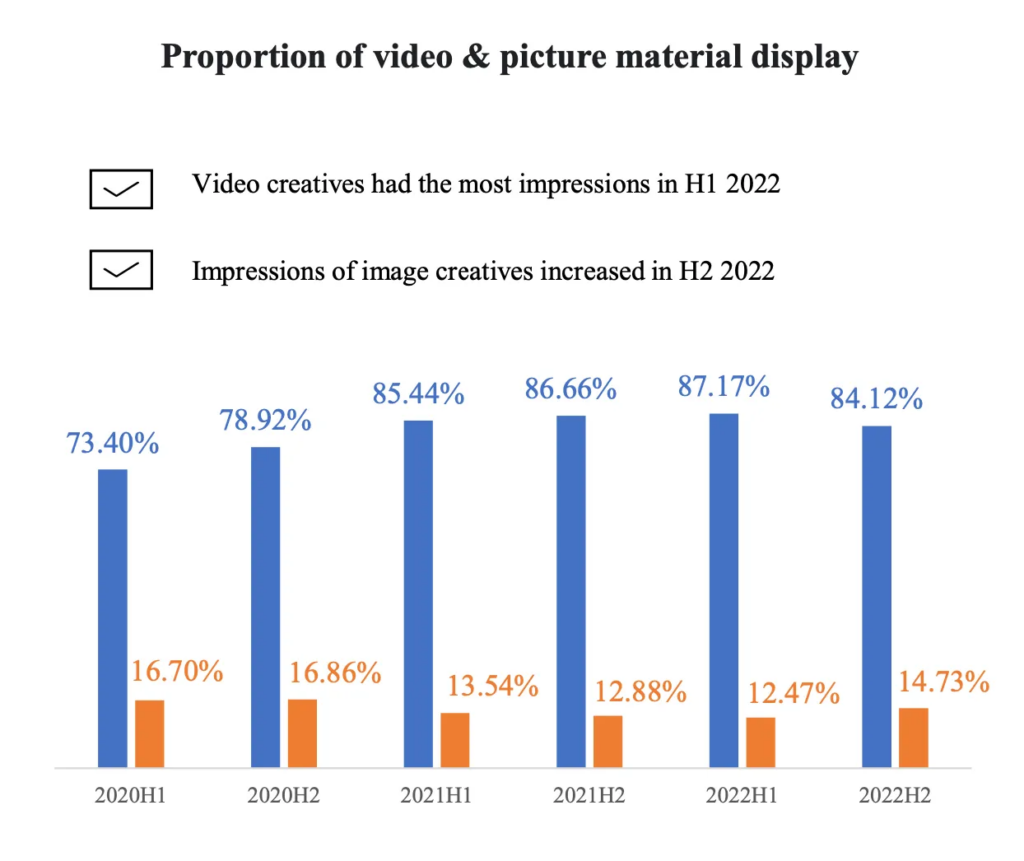
80.76% of all creatives in 2022 are videos. 14% are images. Playables are taking 2.36% of the share. Other creatives SocialPeta put in the “other” section.
-
Coloring Book!, Fishdom, and The Ants are leaders in iOS by marketing. Google Play's top performers are Jackpot World, The Grand Mafia, and Lords Mobile.
Genres results by downloads and revenue
-
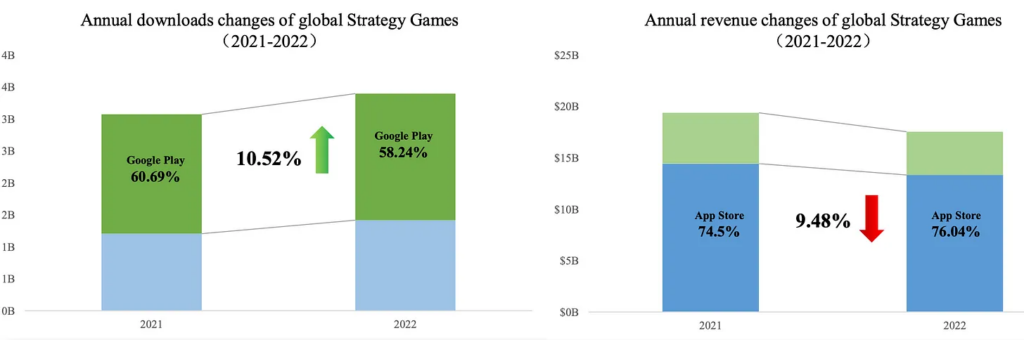
Strategy games - downloads in 2022 increased by 10.52%. Revenue declined by 9.48%.
-
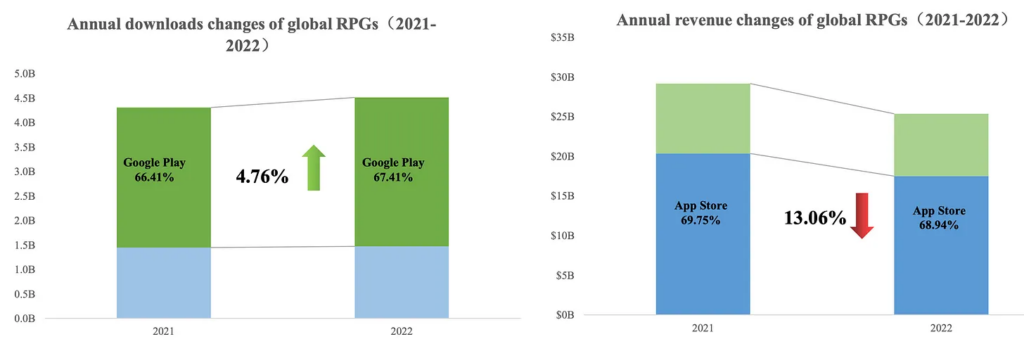
RPG - downloads increased by 4.76%, and revenue dropped by 13.06%.
-
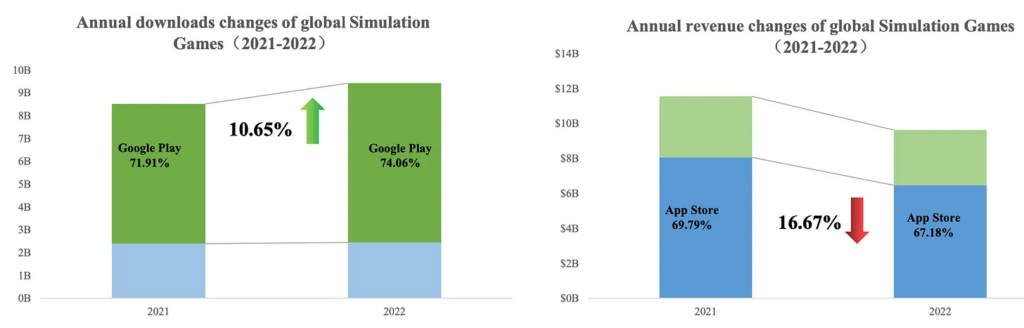
Simulation games - downloads grew by 10.65%, and revenue reduced by 16.67%.
-
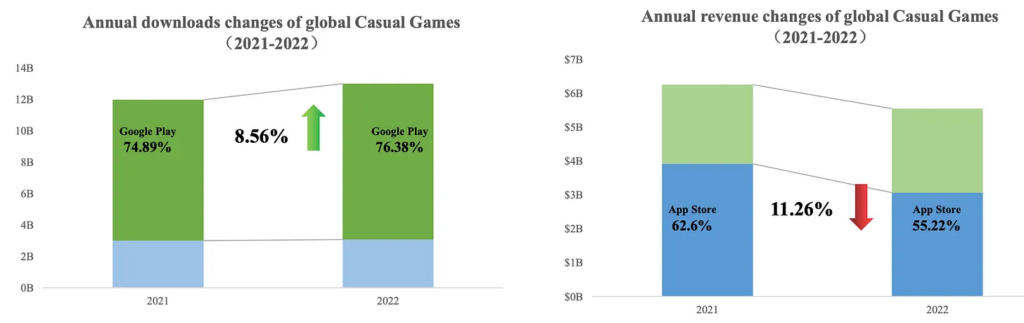
Casual games - downloads climbed up by 8.56%, and revenue shrank by 11.26%.
-
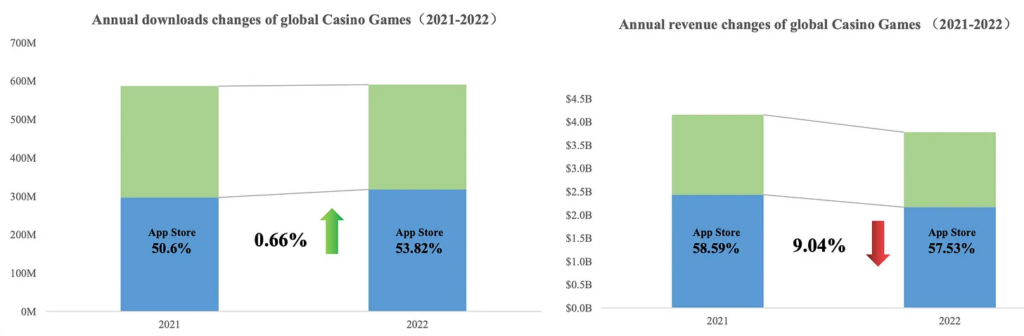
Casino - downloads improved by 0.66% while revenue dropped by 9.04%.
Markets results
-
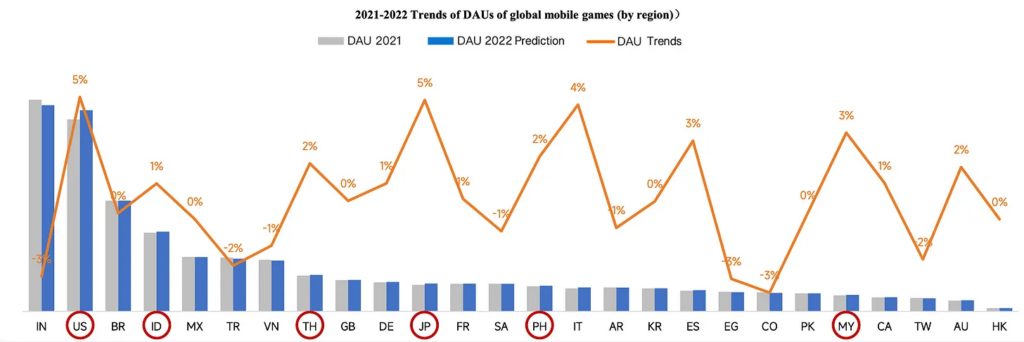
Southeast Asian countries showed the best result in DAU growth. The US is second (+5%), and Japan showed the same increase.
-
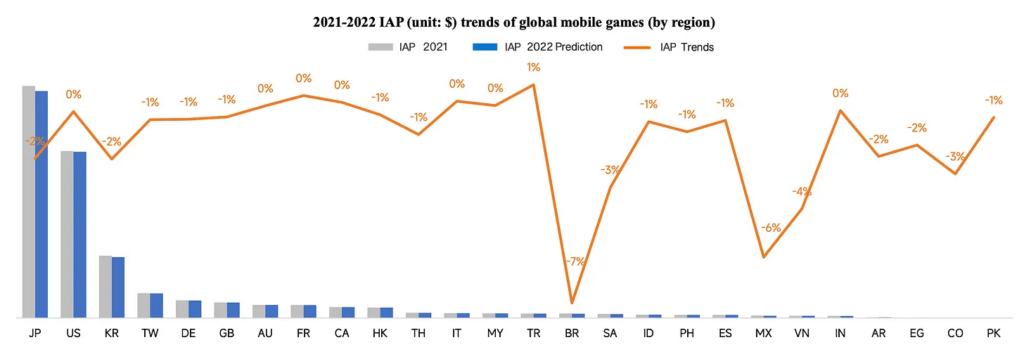
According to SocialPeta data, revenue declined in all countries despite Turkey, which managed to show a 1% growth.
SocialPeta-2022-global-mobile-game-app-marketing-white-paper-finalDownload
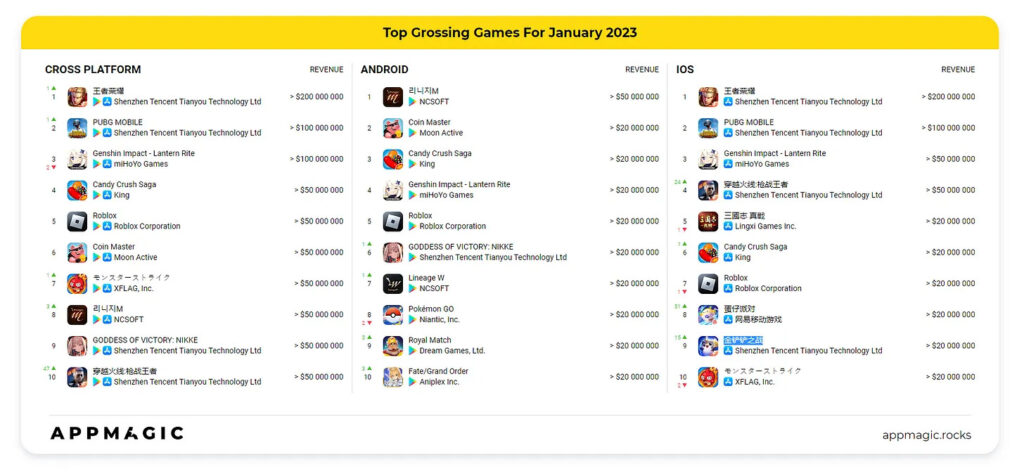
AppMagic: Top Mobile Games in January 2023 by Revenue & Downloads
Revenue
-
First three games by revenue remain unchanged - Honor of Kings, PUBG Mobile, and Genshin Impact.
-
CrossFire: Gunfight King made it to the top 10 despite it being an 8 year of the game in live ops. It earned $56M in January.
-
Eggy Party successfully launched in China - the game reached the top 10 on iOS by Revenue and earned $46.1M.
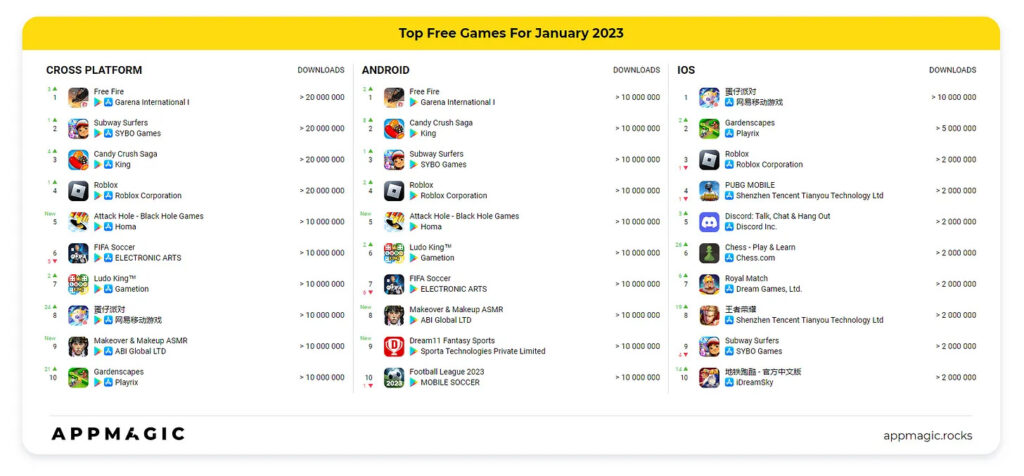
Downloads
-
Garena Free Fire, Subway Surfers, and Candy Crush Saga are top-downloaded games in January.
-
Attack Hole from Homa Games is the most successful newcomer with 17.1M of revenue.
-
Eggy Party is not only having significant revenue, but also great downloads. In January the game was downloaded 12.2M times. The western release should happen sometime this year.
Tenjin & GameAnalytics: Hypercasual Games benchmarks in Q4 2022
Companies were collecting the data from 01.10.2022 to 31.12.2022. Only countries with more than $1M spend during this period were included in the CPI report.
Marketing
-
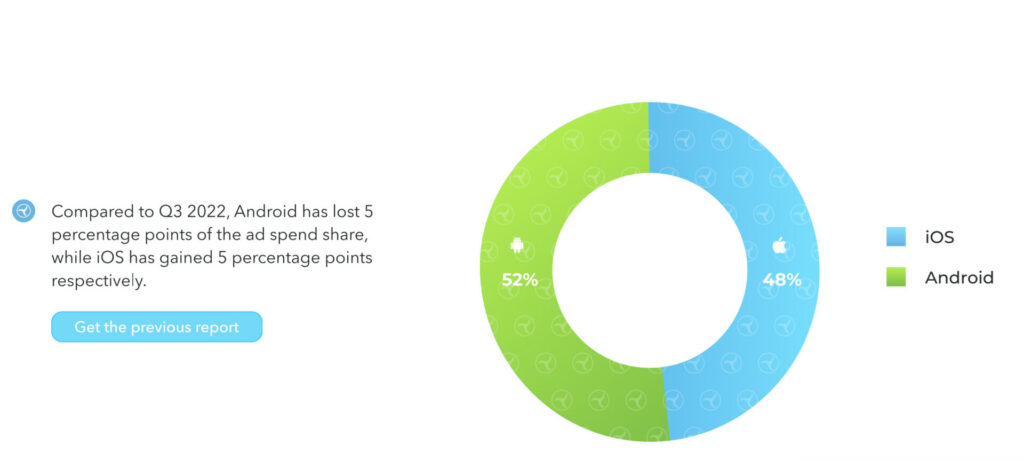
Share of marketing spending on iOS in Q4 2022 increased by 5% compared to the previous quarter. iOS in Q4 2022 was responsible for 48% of all spending and Android for the remaining 52%.
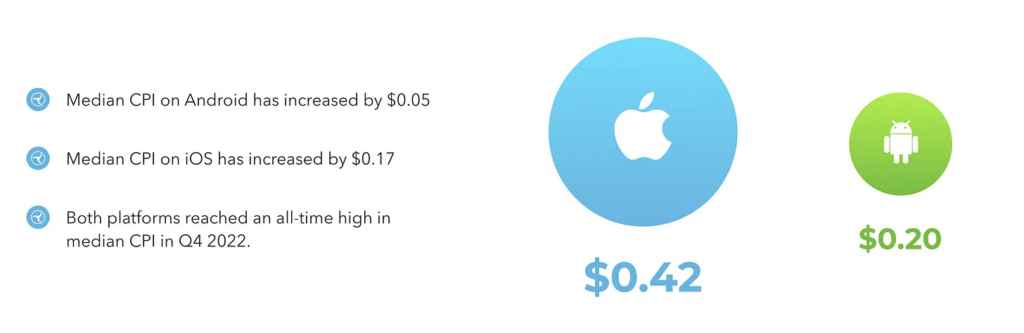
-
Median CPI on iOS reached $0.42, on Android - $0,2. It’s an all-time high.
-
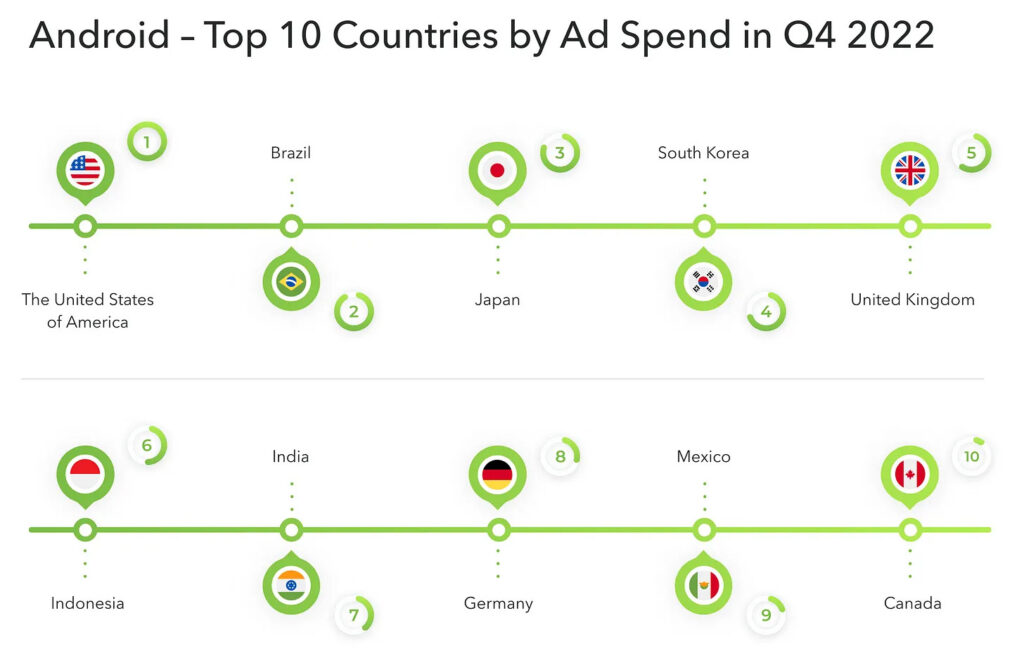
The US (CPI - $0.58), Brazil (CPI - $0.07), Japan (CPI - $0.45), South Korea (CPI - $0.33), and the UK (CPI - $0.3) are the top-5 countries by marketing spend on Android.
-
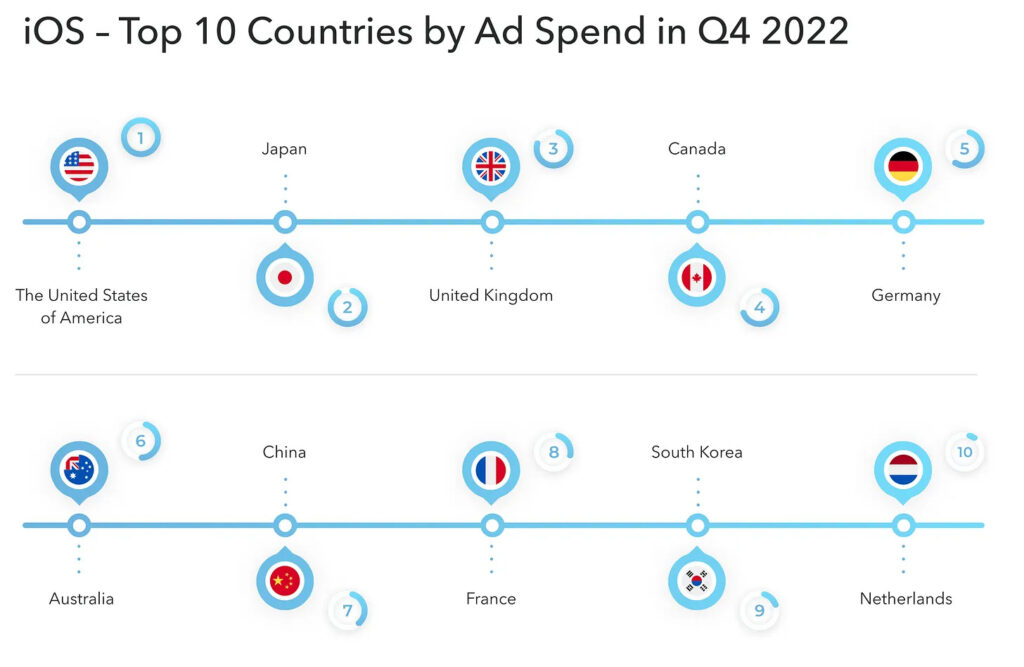
The US (CPI - $0.65), Japan (CPI - $0.61), the UK (CPI - $0.39), Canada (CPI - $0.49), and France (CPI - $0.33) are leaders on iOS by marketing spend.
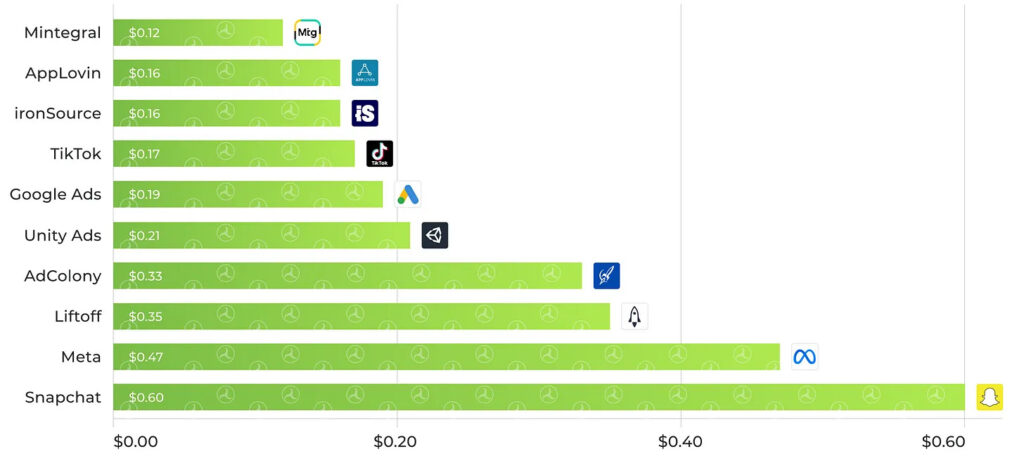
- AppLovin, Google Ads, Mintegral, Meta & ironSource are Android's most popular ad networks. The lowest median CPI has Mintegral ($0.12), highest - Snapchat ($0.6).
-
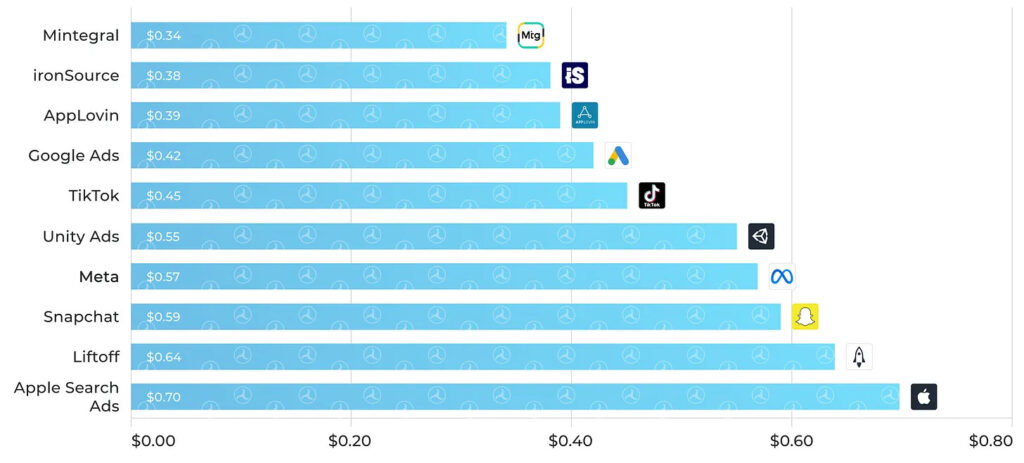
AppLovin, Mintegral, ironSource, TikTok, and Google Ads are the iOS most popular ad networks. Mintegral as on Android has the lowest median CPI ($0.34); while Apple Search Ads has the highest ($0.7).
Product metrics
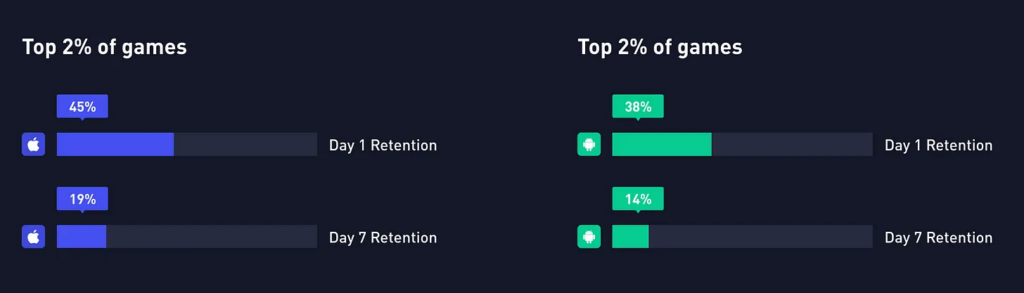
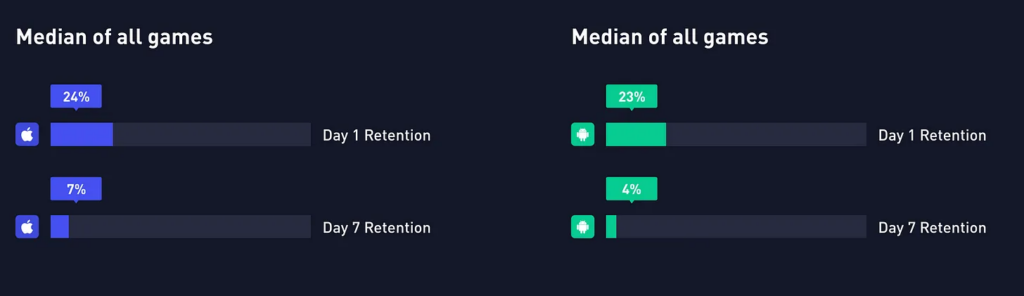
- An average D1 Retention of the top-2% of hypercasual games in Q4 2022 was 45% on iOS and 38% on Android. An average D7 Retention on iOS was 19% and 14% on Android.
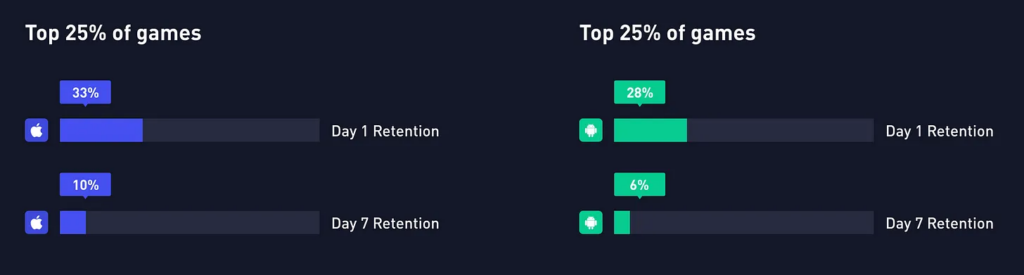
- Among the top-25% of games, an average D1 Retention on iOS was 33%; on Android - 28%. D7 Retention on iOS - 10%; on Android - 6%.
-
Median D1 Retention across all hypercasual games in Q4 2022 on iOS was 24%; on Android - 23%. Median D7 Retention on iOS was 7% with only 4% on Android.
Tenjin & GameAnalytics: Hypercasual Games benchmarks in Q4 2022 Download
The Last of Us TV series effect on the game series
-
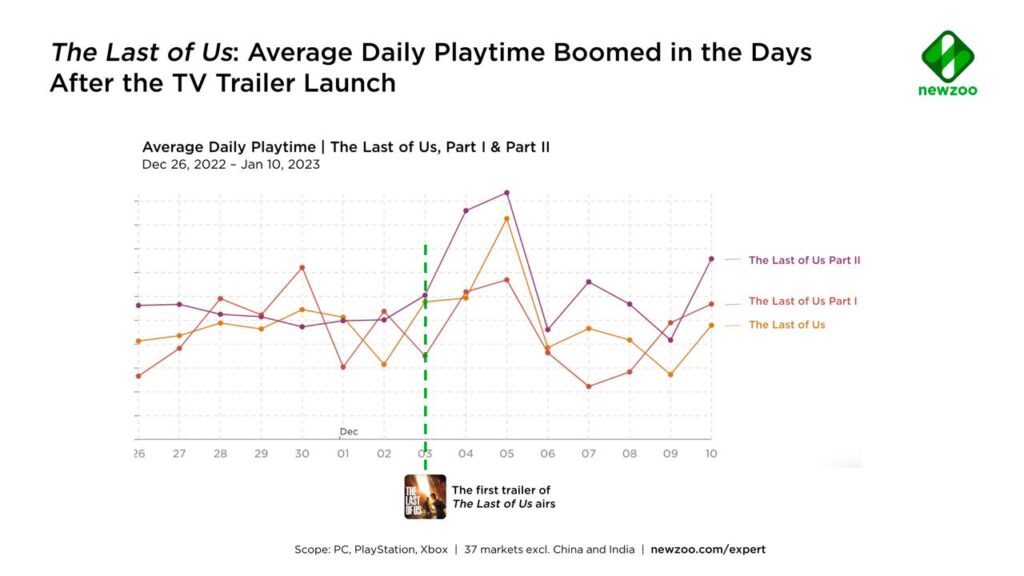
The release of the trailer on December 3 led to the DAU increase in multiple titles of the series. However, days after it went back to normal.
-
The interest in the video content about The Last of Us increased a lot after the release of the trailer.
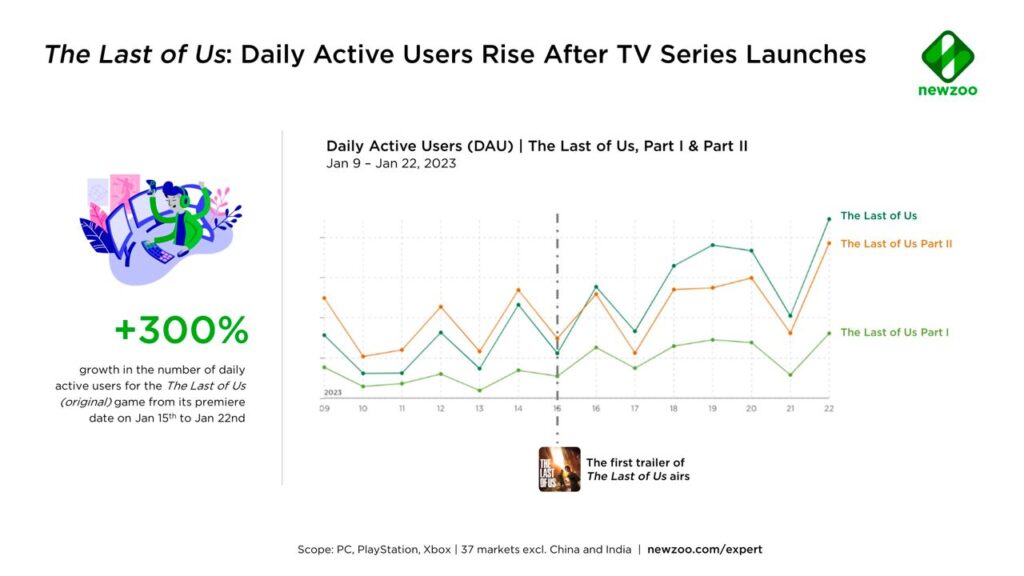
-
After the release of the TV series, DAU in the original The Last of Us increased by 300%. Number of players in The Last of Us: Part I and The Last of Us: Part II increased too.
Sales effect
-
GfK reports that The Last of Us: Part I sales in the UK increased by 238% after the TV series release.
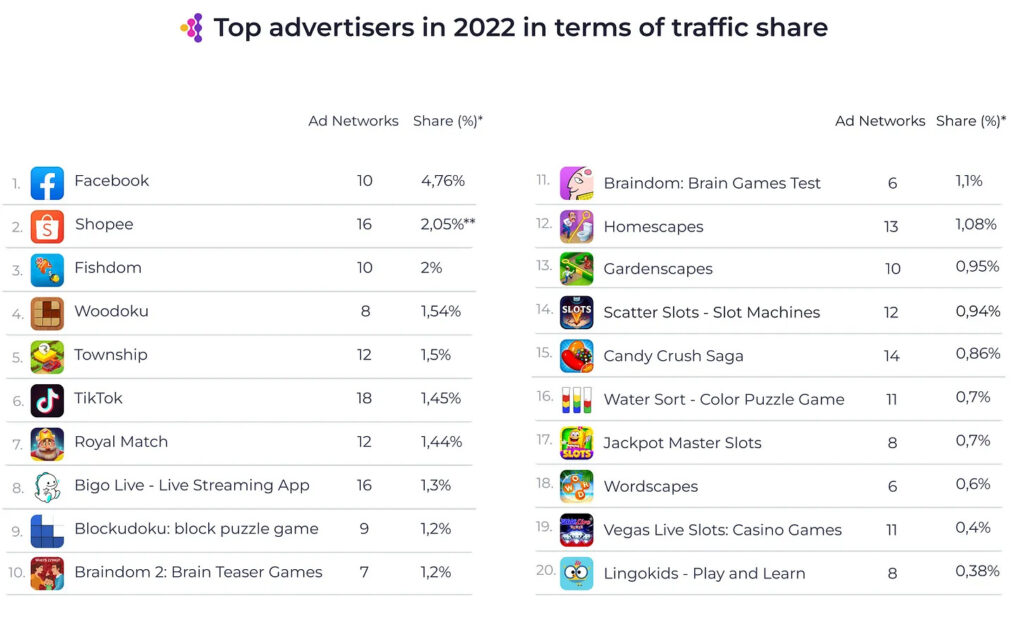
Apptica: Mobile Advertising in 2022
-
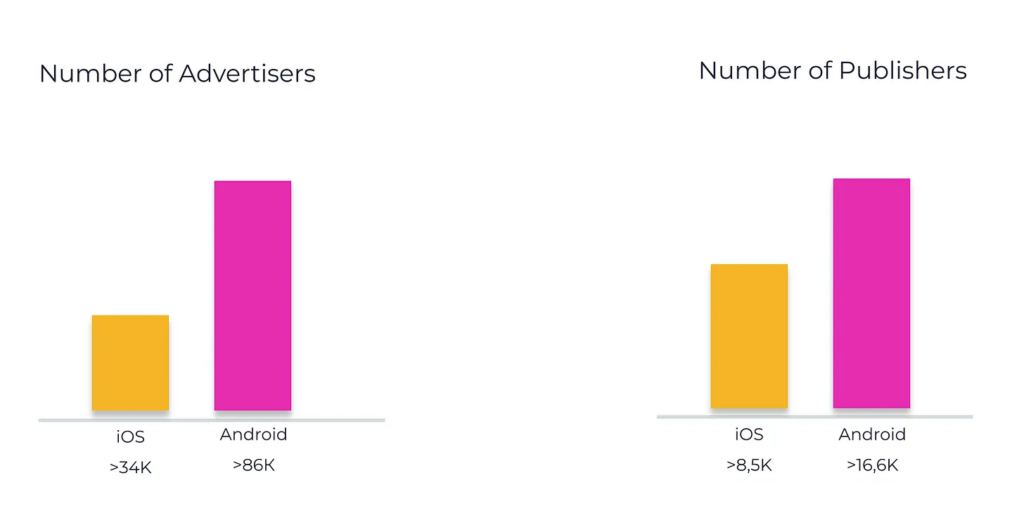
The number of advertisers in 2022 reached 120k (29% are on iOS; 71% are on Android). In 2019 there were 2 times fewer advertisers in the market.
-
Gaming ads are responsible for 69.02% of mobile traffic on the App Store and 55.58% of mobile traffic on Google Play.
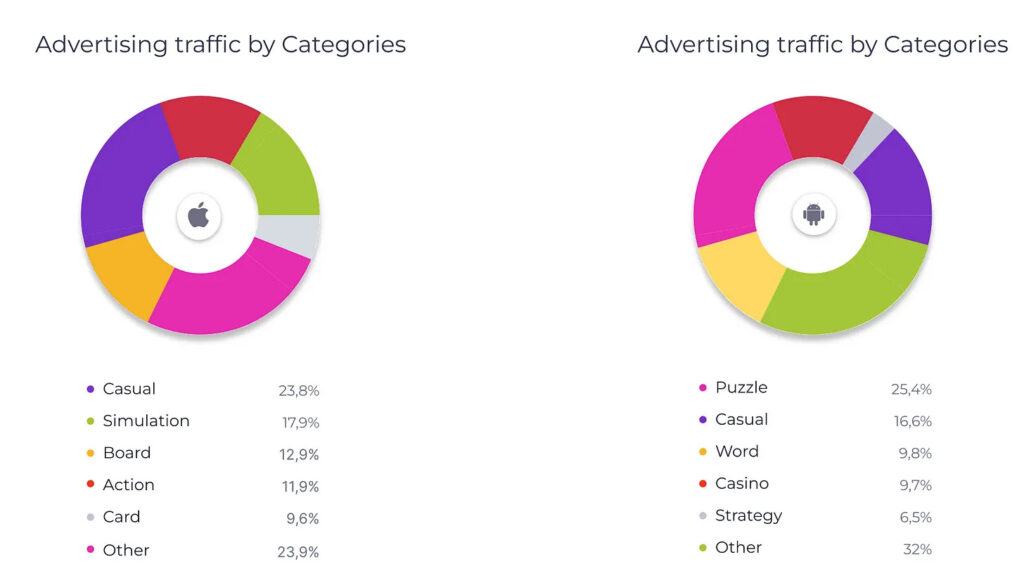
-
Casual games and puzzles are the top genres by share of advertising traffic.
-
Fishdom (2%), Woodoku (1,54%), Township (1,5%), Royal Match (1,44%), Blockudoku: Block Puzzle Game (1,2%), and Brandon 2: Brain Teaser Games (1,2%) are game industry leaders by the share in the ad traffic.
-
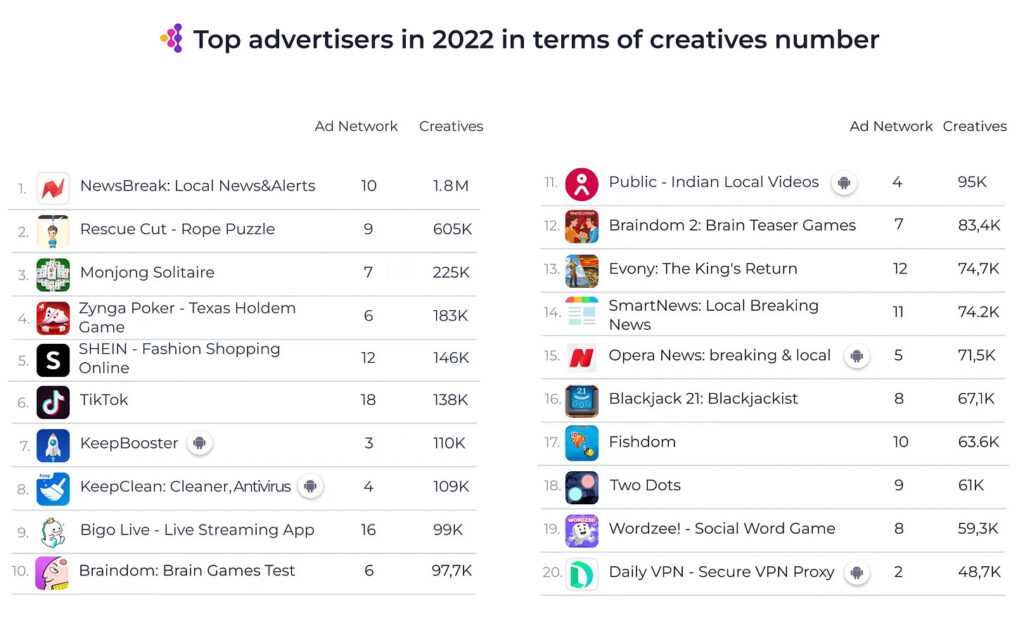
Playrix (6.1% on Android and 5.4% on iOS) is the leader of the game industry by the volume of published ads.
-
Rescue Cut - Rope Puzzle is the leader by creatives in 2022. Developers made 605k creatives for this game. Playrix, for comparison, created 177k creatives.
-
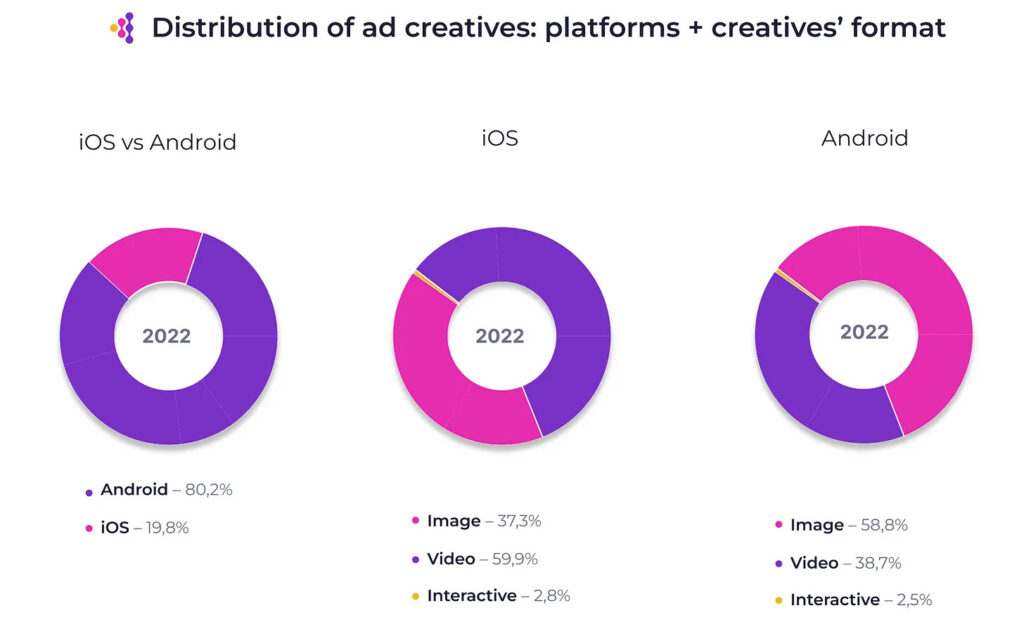
On iOS, the creative split was the following: video (59.9%), images (37.3%), and interactive creatives (2.8%).
-
On Android images are more popular (58.8% of the overall amount), videos are next (38.7%), and interactive creatives are about 2.5%.
-
14.6M creatives were published in 2022.
Apptica: Mobile Advertising in 2022 Download
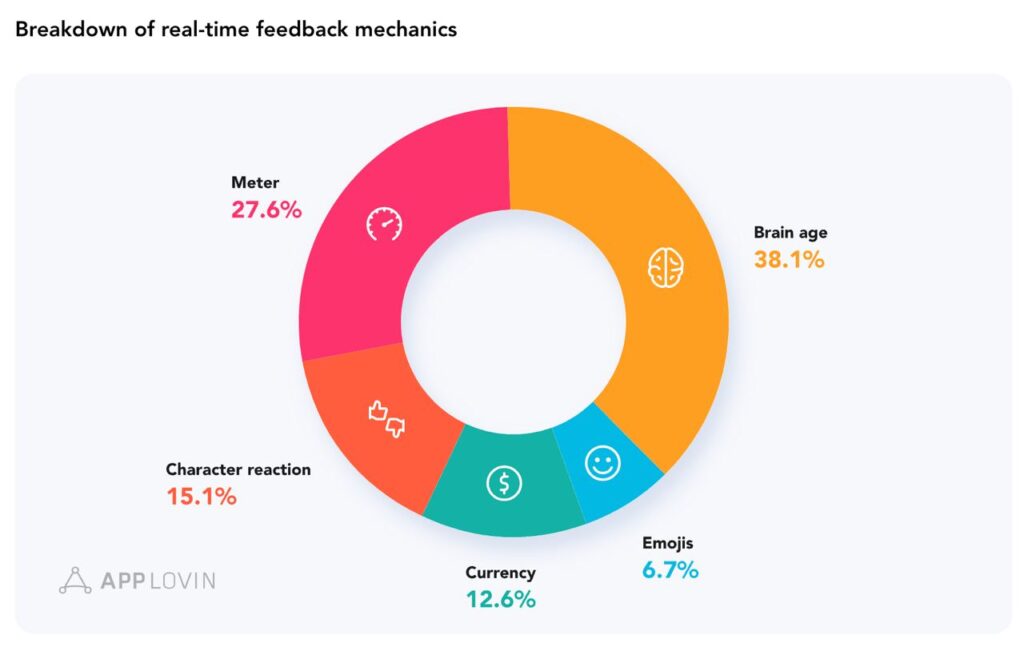
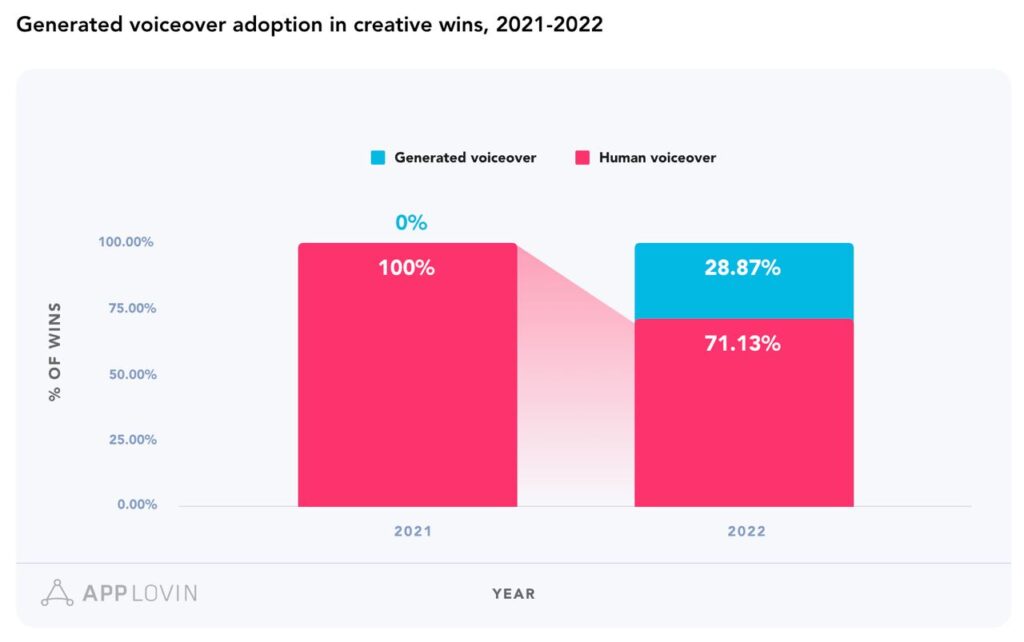
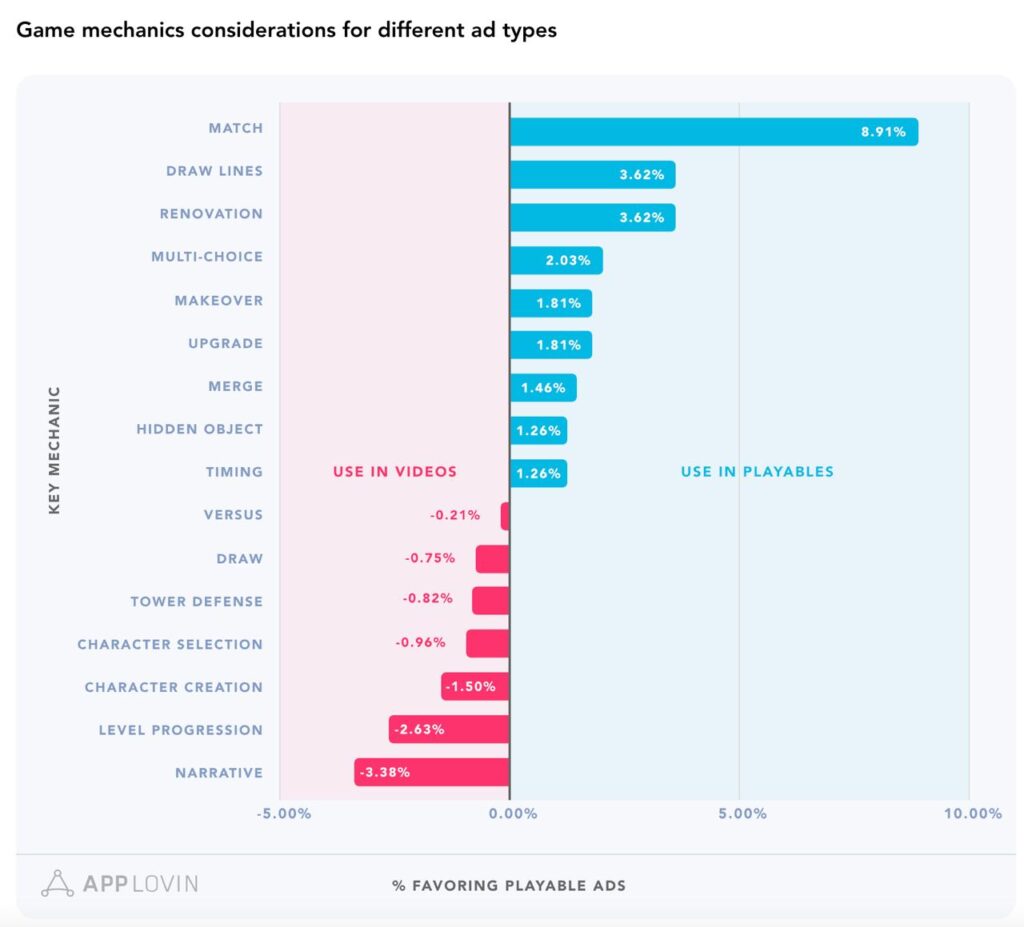
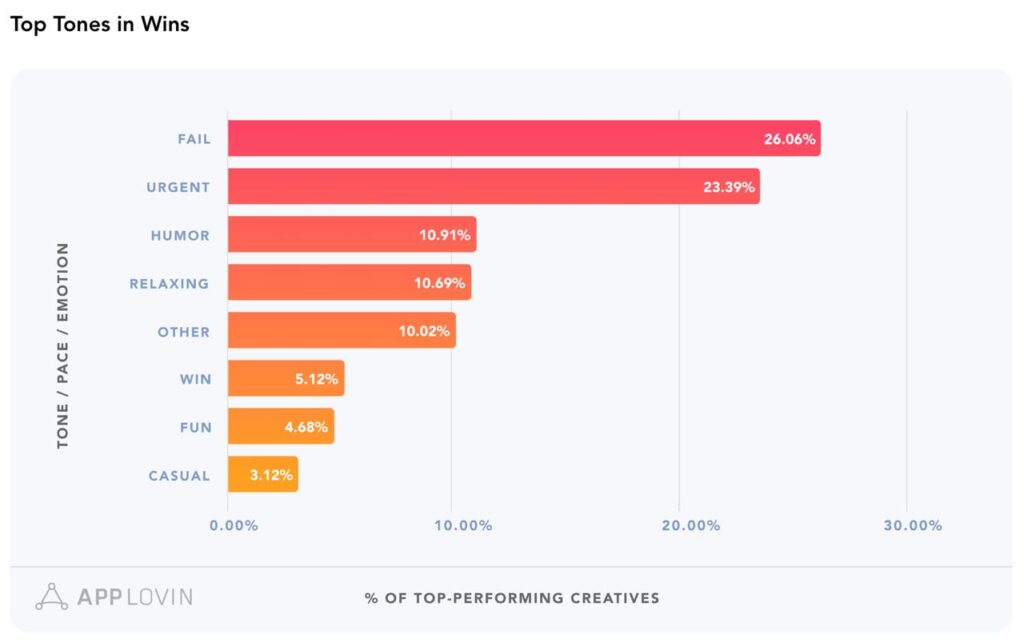
AppLovin: Mobile Creatives trends in 2022
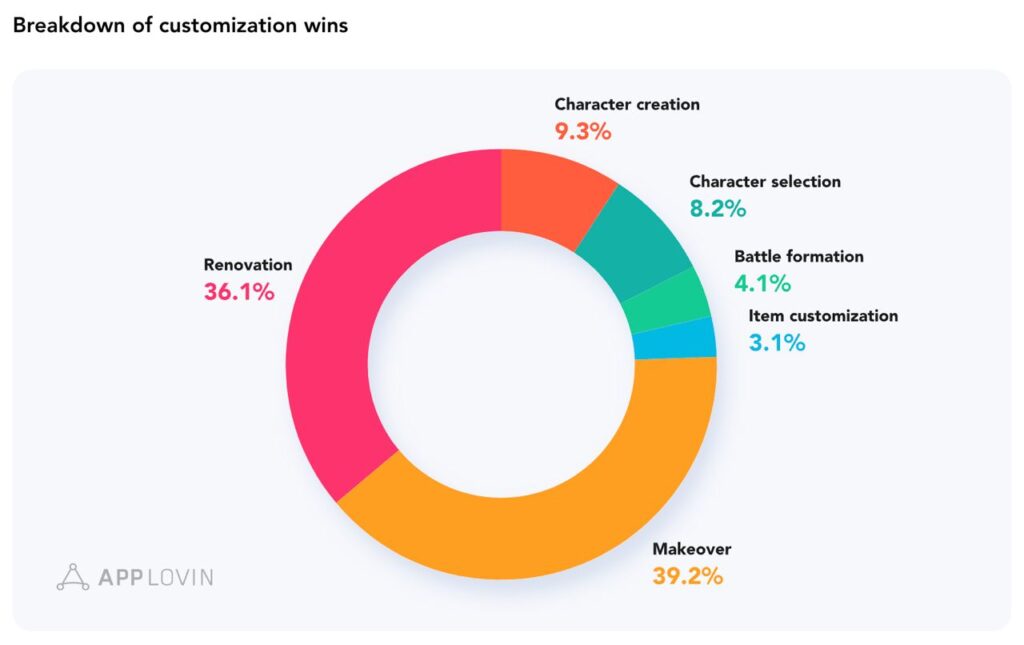
AppLovin analyzed creatives from 52.3B impressions; 22.4B clicks; 267M installs and 200+ apps.
-
Customization works well in creatives. Ones with renovation and makeovers show better results in 75% of cases.
-
Creatives with dramatic narratives are still working well. They’re showing better performance for the social casino titles (65% better than average), and for the strategy games (155% better than average).
-
Generated voiceover started to be used in creatives in 2022. The number of such creatives among those with voiceovers reached 29% of the overall amount (from 0% in 2021).
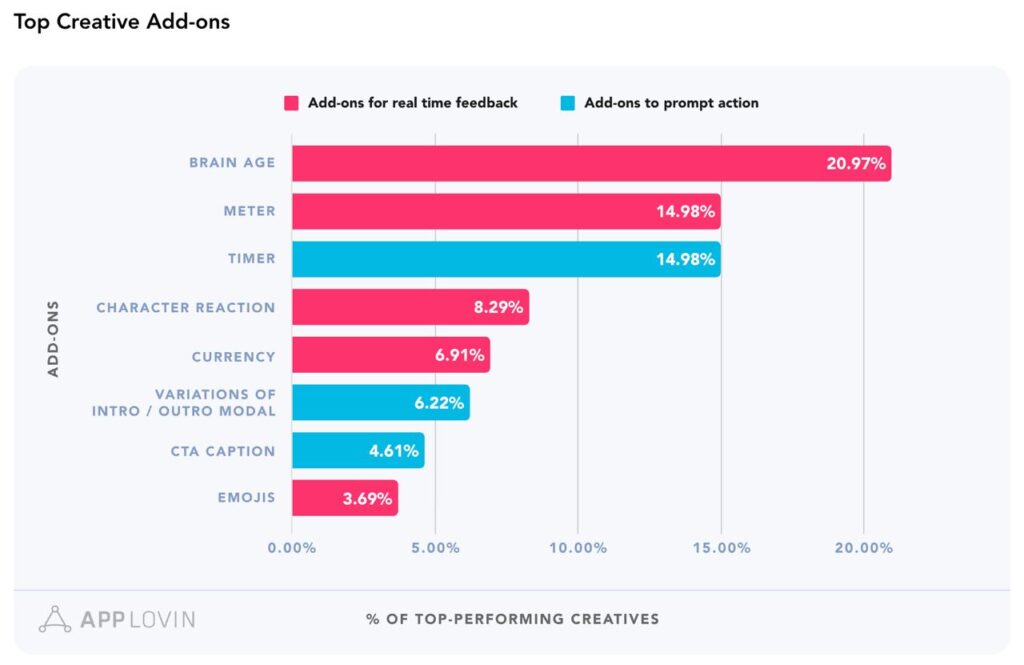
- Match mechanics, renovation, and drawing lines were good mechanics for Playables in 2022.
- On average, creatives with a show of failure and urgency show better results.
- Strategy is a genre with the largest amount of misleads or creatives that are not showing the real gameplay.
The full version of the report with examples.
Now you have the entire picture of the current game market. If you have any questions, feel free to ask the author using the contact details provided at the beginning of this review.