
Mobile game studios often struggle to find investments because of many reasons related to the business model and its organization, as well as for the reasons of the current investment climate. For some years, the quality capital partners are more cautious on recession fears and take more time to analyze and think before investing into a new project. However, a little optimism is peeking through here and there now and they continue to invest in some businesses like gaming.
In this article, we are going to help startup founders to prepare for meeting with an investor. We will tell you exactly what metrics they are looking at in the first place and why these metrics are so important.
Actually, there are dozens of monetary and retention metrics out there but you don’t need to prepare information about 20+ indicators as it will sail the investor into the sea of meaningless data. About a dozen or less basic metrics will do the job: help evaluate your mobile game and assure the investor that your game will make them a lot of money in the near future.
devtodev allows for easy sharing of information with investors. You can send a link to a report or create a dashboard, make it into a PDF file and send it.
Monetary Metrics
1. User acquisition cost payback
This is the time period necessary to recoup investments in acquiring a new user. Acquiring plenty of paid traffic is an industry standard because in the current busy market you simply can’t rely on organic users. However, there are plenty of fraudulent traffic sources that will empty investor’s pockets but will not give you the necessary number of paying users. Traffic acquisition is an art in itself and whether or not you have such specialists will decide on this metric. Basically, the lower this figure is, the better.
This metric helps investors gauge the effectiveness of acquisition campaigns run by the company.
Read more: SQL Knowledge Levels: Beginner, Middle, Advanced
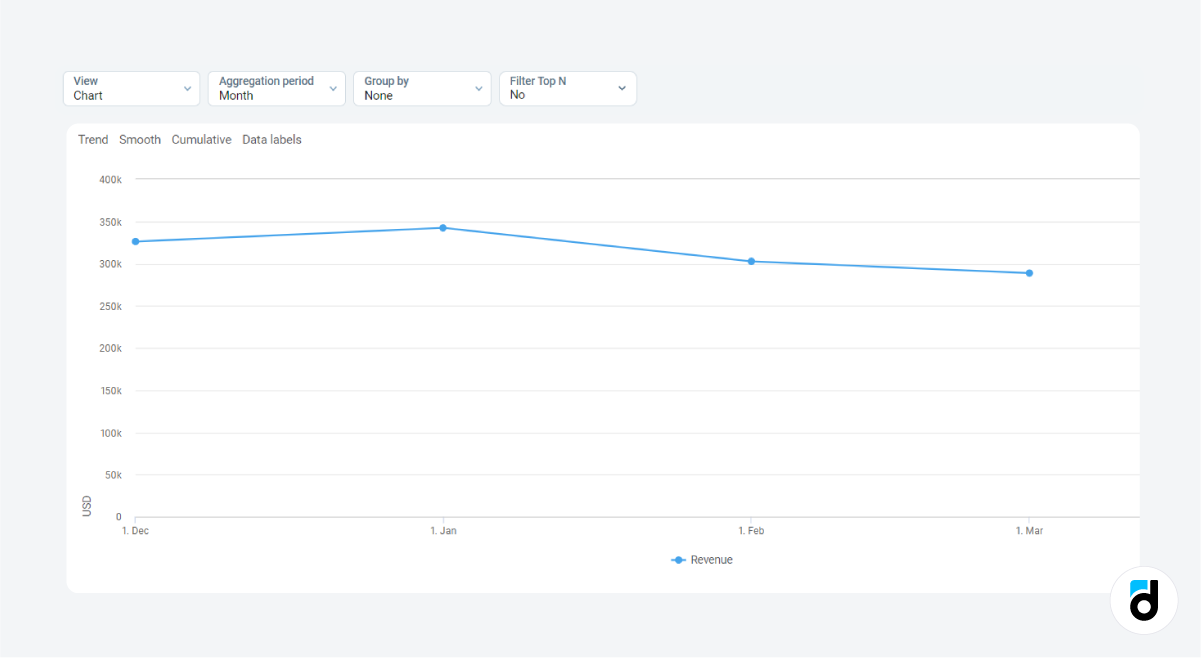
2. Monthly revenue
Monthly revenue is basically total sales revenue for the month. It is the metric that showcases the customer's love for the product and their readiness and willingness to pay.
This metric gives investors the overall picture of a company's financial health.
3. Monthly recurring revenue (MRR)
It is a metric of regular demand on the items that you sell in-game in a given month or on the subscriptions if the game uses this monetization model. If players renew their subscriptions over and over again or if they buy items and do not churn, it is a great sign of its viability.
Also, if possible, you can provide information about the Annual recurring revenue (ARR) metric so that the investor will be able to analyze it together with MRR just to make sure that the numbers are real.
This metric gives investors an overall picture of the game's stickiness, appeal of the items and demand on them.
Read more: How to Launch a Promo Campaign and Increase Product Revenue
4. Recurring purchases (purchase frequency in general)
If the game has a big number of recurring purchases it’s a very good sign for an investor. It means that the game is fun, well-balanced and well-structured. It promotes the items when and where they are needed if it is a free-to-play game. Or they eagerly renew their subscriptions if it applies a subscription model.
This metric gives investors an overall picture of the game's stickiness, appeal of the items and demand on them.
Read more: How to Create an Ideal Dashboard for Analyzing Mobile Games and Apps
5. Gross margin
It is gross profit in a given month divided by total revenue in the same month and calculated as a percentage. This shows the amount of money left in the pockets of the game developer after paying for all direct costs. Investors should be interested in this metric too because if it’s good, it guarantees that the invested funds will be paid back.
This metric helps investors gauge the amount of money they can pull out from the company.
Read more: How to Analyze App and Game Subscriptions
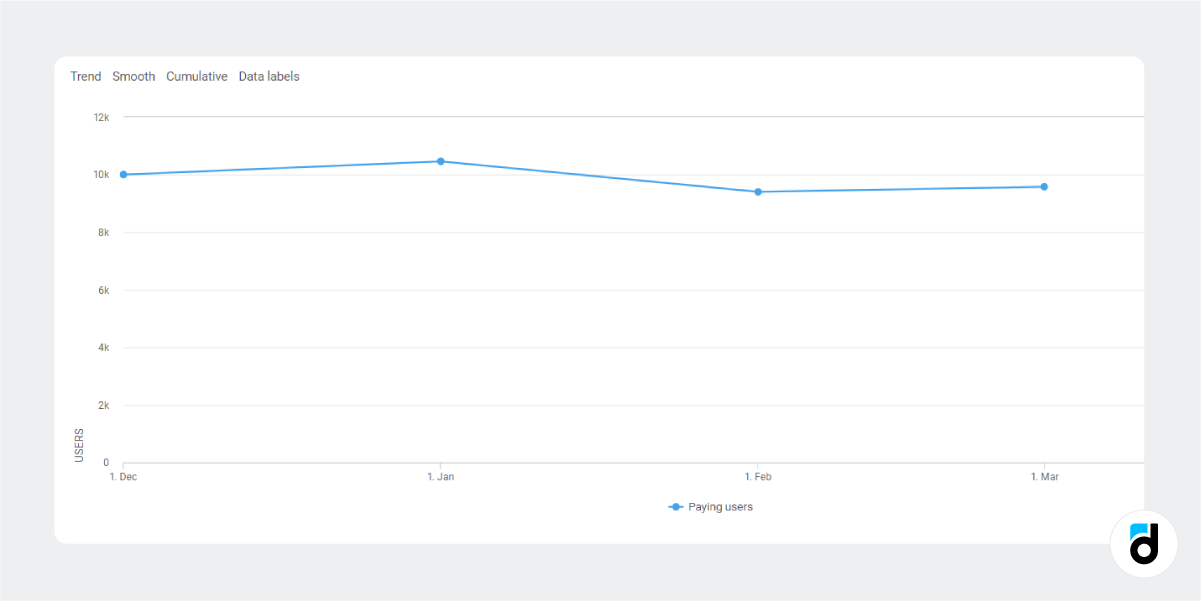
6. Number of people paid over a month and over time
This number gives the investor an overview of the game's user base. Is the paying audience of the project large enough? Is it growing? Is it shrinking? This is vital information in case the game has been on the market for a while. The investor may doubt that players have already lost interest in it and moved to the next game.
This metric gives investors a picture of the game’s paying user base.
7. Historical LTV
Historical LTV (as opposed to predictive LTV) is a sum of revenue divided by the number of customers. Simply put, this is an average amount of revenue per user. When the investor is presented with the graphs, they can see the historical trend of the LTV across the specified time period. Also, they can see the months with the highest and lowest LTV, as well as sudden spikes and drops and analyze them.
This metric is good for analyzing the time necessary for breaking the initial investment and the time necessary to double/triple it.
Read more: Accurate LTV Prediction using Machine Learning Model
If you used a different analytics platform prior to devtodev, you can export historical data and get all the necessary numbers.
Retention metrics
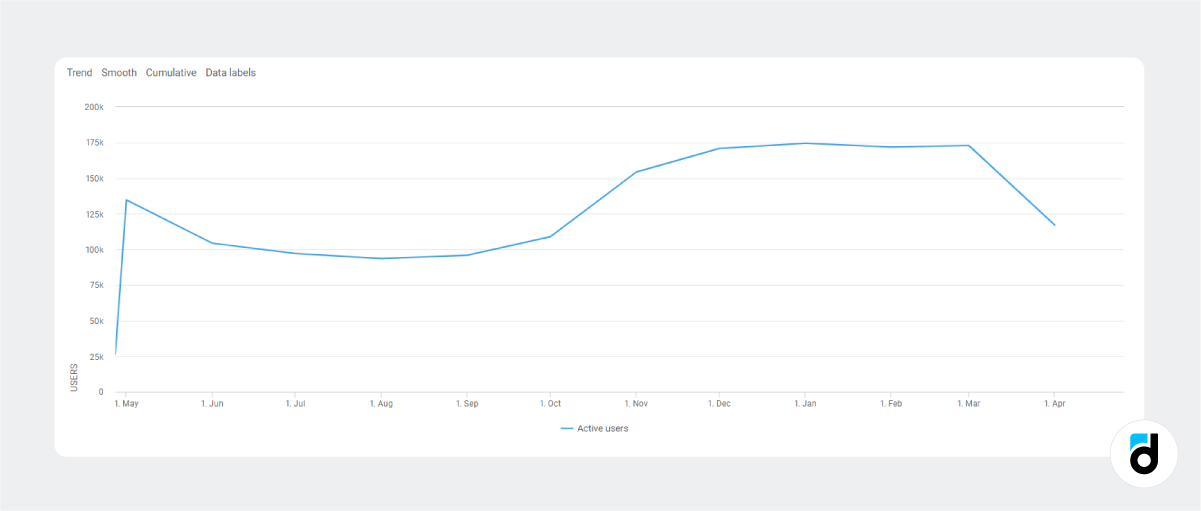
8. Active users
Another good indicator is related to active users - daily, weekly or monthly active users. Before the investor goes through the numbers, make it clear who exactly is considered as an active user in your game. Is it someone who made a purchase? If so, how recent? Or maybe they are the users who spent a particular amount of time in the game. It can be almost anything depending on the game genre and monetization model. If you are not sure, ask your analyst.
This metric helps investors gauge the real size of the audience.
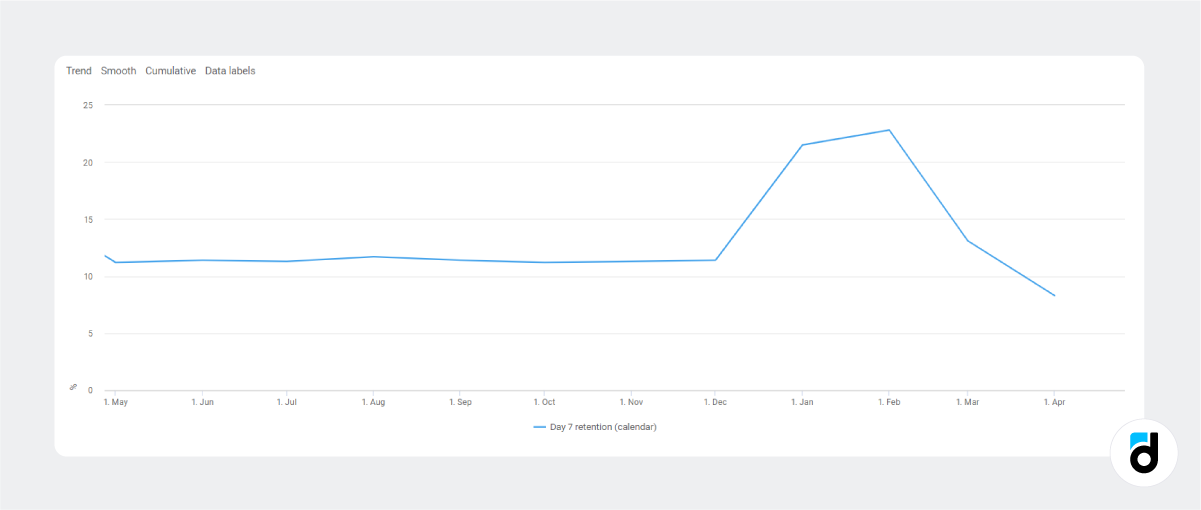
9. User retention
This metric alone can say a lot about whether players like the game and whether it can earn the investor some money. The metric indicates how many players keep on using the game after a certain period of time (day 1 retention rate, day 7 retention rate, day 368 retention rate are used widely). It plays a big role for two reasons. One - because it shows player satisfaction. And another - because most revenue comes from recurring purchases and not from the new acquisitions. This is even more so for games using the subscription model.
This metric helps investors gauge playability of the game.
10. Gross user churn
Churn represents the percentage of players lost in a specific amount of time (subscription cancellations included). The metric is vital for understanding the stickiness of the game, as a high churn causes users base to shrink and drives the need for paid acquisition. As with active users, the time frame of the number needs an explanation. Are they lost if they are absent for one week? Two weeks? One month? Clarify these questions to give the investor the full picture of the game they are going to invest in.
This metric helps investors gauge the stickiness of the game and future ad budgets.
Read more: How to Identify and Re-Engage Churned Users
11. Player conversion rate
It is the percentage of players who visited the landing page and actually signed up and launched the game. If your game studio purchases traffic, you will need to answer more questions, say: How many of them complete the tutorial? Or, how many of them complete the first level? There are tons of fraudulent traffic out there.
This metric helps investors gauge the effectiveness of marketing and acquisition campaigns run by the company.
At devtodev, we want to help small gaming companies grow into large businesses. This is why we offer our users with up to 10k MAU access to all the features of the analytics platform for free!