
One might think that the perfect analytics platform is a bunch of robots that analyze all data and make wise decisions while you sit tight and count your profit. Sadly, all of this is just a pipe dream, therefore, in this article we are going to describe a real platform that may exist in current space and time.
First up, let’s agree that the main goal of our ideal platform is profit. It means that you start making much more money after integrating the platform than before doing so. In case you want to highlight something else – user impression, etc., you can use all the same criteria described in part two of this article.
Part 1. Basic Function. Calculate Your Profit
Let’s start with the basic formula:
Total Revenue = LTV * Active Users,
where LTV is Lifetime Value.
It’s not very clear yet. Let’s dig deeper and take a look at how we can calculate LTV.
LTV = Lifetime * ARPDAU,
where Lifetime is an average time a user remains in the project and ARPDAU – Average Revenue Per Daily Active User (it is calculated for free and premium users combined).
This all means that if you want a user to drive more revenue, you need to maximize two values – the lifetime of this user and the amount of money they bring in.
Let’s figure out ways to achieve both goals using a product analytics platform such as devtodev.
Maximizing Lifetime
If your game is perfect, gamers will play it every single day. If they don’t play it every day, it means it’s not perfect, therefore there is a vast room for improvement and our goal is to identify its weak points and fix them.
The search for bottlenecks should start with the first user encounter with the product – their first session. The first session turns out to be the last one for the vast number of users. We can see it from the D1 retention rate analysis.
Let’s say that we’ve got 100 new users yesterday. But only 10 of them opened the app today. This means that our D1 retention rate is 10%. This is a relatively low number because the reference percentage is 30%. As a result, we need to understand the root cause of the problem, that, as we know for sure, lies somewhere in the first-time user experience with the product.
This means that our ideal analytics platform has to give us tools to both assess all the necessary metrics and detect the exact point where the users drop off. In this case we can use funnels and it would be perfect if we can build a detailed funnel for the first session.
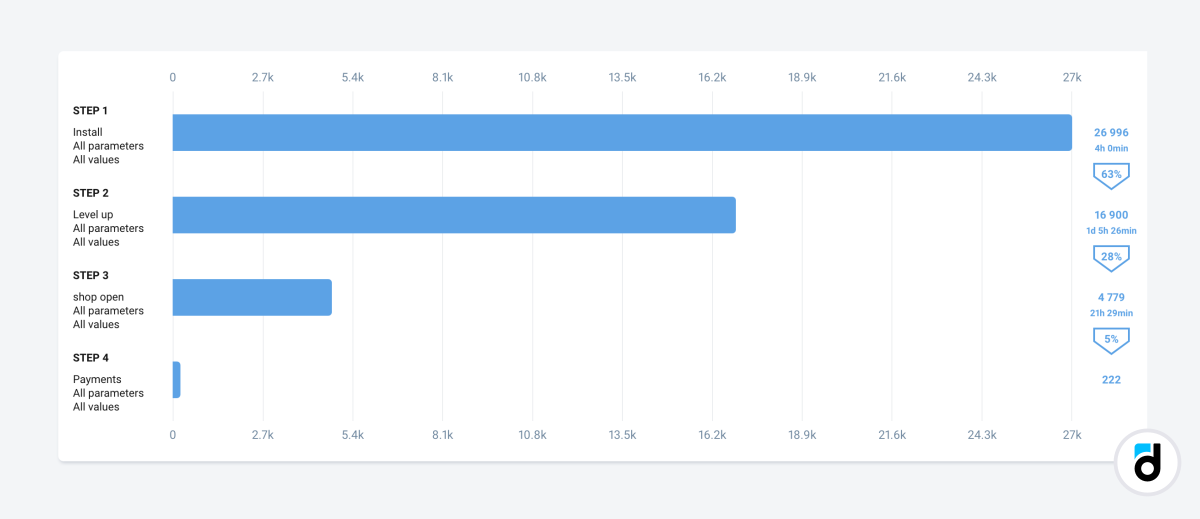
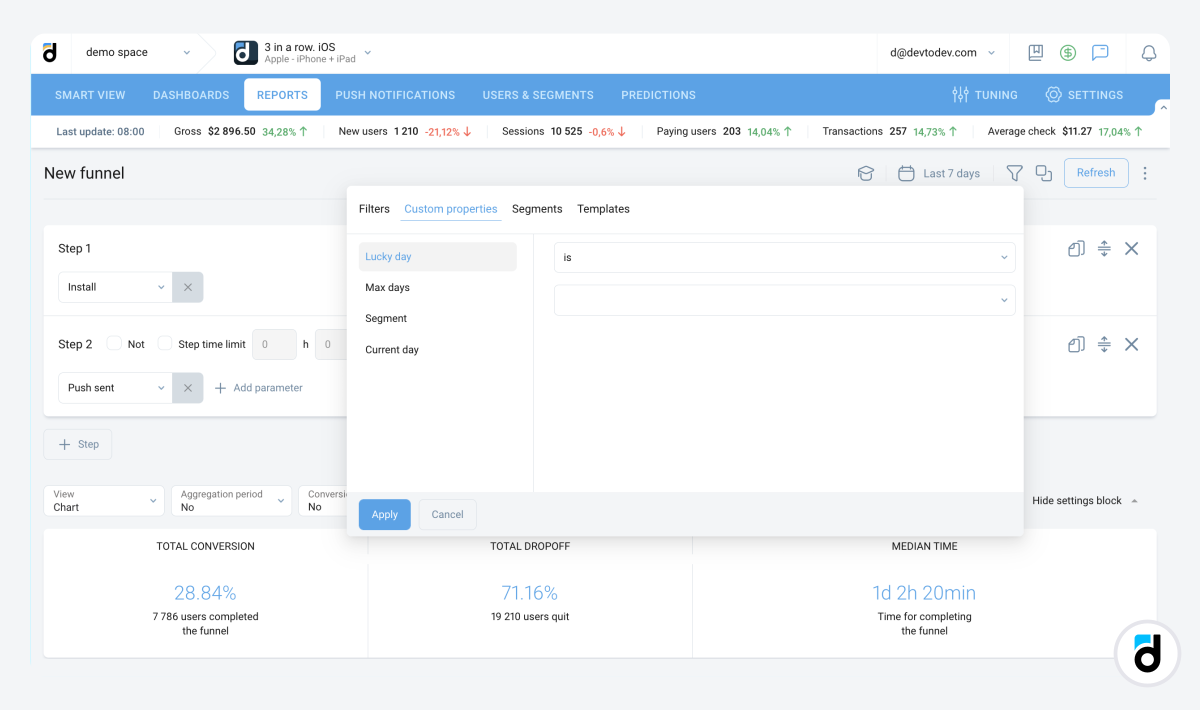
The developer needs to break the first session into a number of steps or stages (in games we use onboarding and a number of the very first levels) then the analytics platform creates a funnel and after that the developer or the analyst can find problematic stages. If you want to improve the process, you can divide all users into small groups by a common trait and build separate funnels for them.
If we have no problem with the D1 retention rate but we see that users abandon the app some days later, we also have to find out the reason. Do they get tired? Are our mechanics plain and boring? Do they need more content? Do they want more interaction?
To help us answer these questions, the ideal analytics platform has to have an option for building a retention graph by days, levels, rankings, etc. Probably we will be able to see some kind of anomaly on the graph that will help us understand the issue.
In the meantime, we need to build user experience funnels. If a user abandones the app on day N – what happened right before? Probably, they got stuck at a particular level? Or did they encountered a technical problem? Or something else? And again, the developer has to integrate key events, while the analytics platform has to use these events to build funnels and point out the bottlenecks.
Anyway, at the stage of Lifetime maximization, developers are looking for their own mistakes: the imperfect points that frustrate the user and make them quit forever.
Maximizing ARPDAU
To maximize the lifetime we had to analyze our own mistakes but to maximize ARPDAU (Average Revenue per Daily User) we will have to analyze our achievements. Why did the customer make the purchase? Did they see a good bargain and bought a bulk starter pack? Did they purchase slot machine chips because they ran out of them? Did they buy an extra turn in a match-3 game because they failed many times and stubbornly wants to pass the level?
We need to get a good grasp of why this or that user made the purchase and whether or not we can artificially create the same environment for other players so that they will have to pay too.
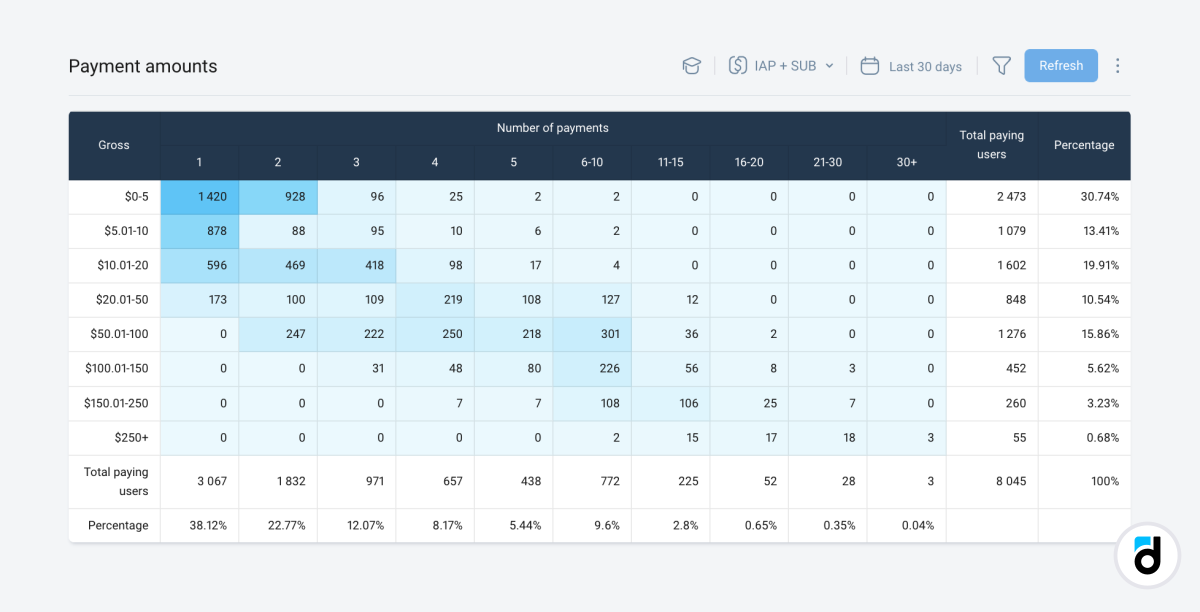
Metrics and statistics can help us here: payment data, paying conversion data, average check, recurring payments, the most sought-after items, etc. Do all gamers buy a small package of chips for $0.99? Let’s do some exchange - place a package for $4.99 here and move the small one at its place. Or discount all other packages so that they look like a good value for money.
Is our percentage of payers less than 0.5%? Let’s add a great starter pack that gives the player $100 of goods for a couple of cents.
We need to take into account the situation the player character is in at the time of the purchase: their level, in-game currency amount, completed tasks, etc. Are gamers ready to spend money if they have one game piece but don’t have any moves left? Let’s balance the game so that this situation happens more often.
Part 2. The Analytics Platform We Can Dream Of
All of this was very down-to-earth, practical and money-oriented. And now let’s take a little break and dream of what we would like to see in the near future.
Imagine that you have a game with a D2 retention rate of 17%. Is it good or bad? This is a perfect moment for our dream analytics system to break in and say that the D2 retention rate of 17% is too low for match-3 games and online casinos but might be great for some other app.
More examples. Do you analyze the funnel of the first session and see a big gap? The ideal platform can send you a note: “Check the fourth step of your tutorial – you have a problem there”. Do your users drop off while downloading your game? The platform may say that it has a conflict with Safari browser, while it works fine with other browsers.
The best advantage of an analytics provider is that it can compare metrics of all the projects connected to it and give a generalized overview to the developers who don’t know the current situation on the market and need some reference points or milestones to match against.
The platform can assess the app based on the information about all products of this genre. It would be enough if it informs the developer that “You have a good ARPDAU but your retention rate is not as high as it could be”. This is a valid call to action that will help you improve your product and boost your income.
Auto-notifications
Sooner or later we understand that we can’t pay much attention to the game and we want to move on and create more games. The first project performs quite well, it has no big issues and it makes us some profit every month. We can spend resources on updating content and technical support.
Or another situation – we don’t not have enough resources for hiring an automation engineer or an analyst but we still need to track all the vital metrics without spending much time.
In both cases we need a sophisticated (and simple!) analytics platform that allows for building dashbords and sending automated notifications.
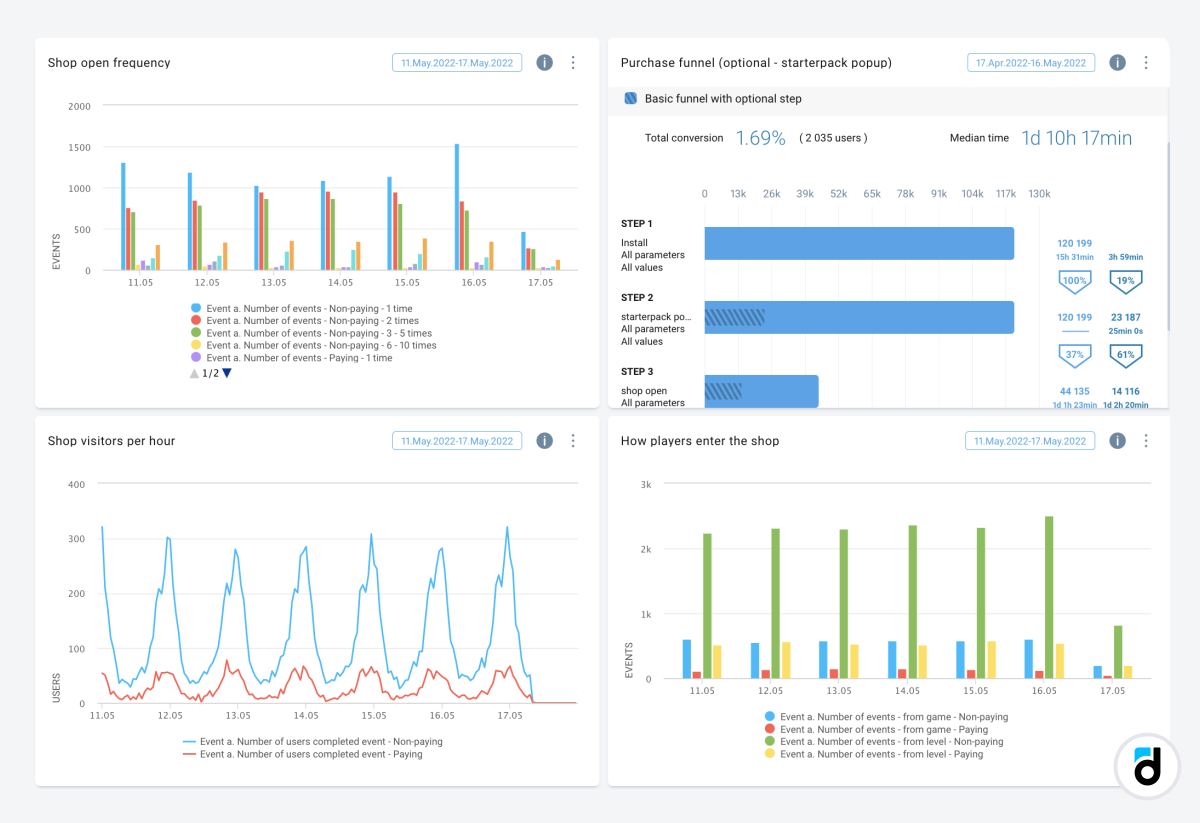
For example, it can inform you of:
-
The number of new users for a certain period of time
-
How well they spend money and how much you’ve earned for the past week
-
Week on week comparison for current week vs previous week, for current week vs the same week of the last year
Besides the reports, it can inform you of a number of important events:
-
Today we’ve got more than 100 DAU (Daily Average Users) for the first time ever
-
More than 1,000 users have signed up for our product today
-
We’ve got record number of DAU this week
-
Yesterday we earned more than $1,000
-
The number of new sign ups have risen sharply
-
The numbe of successful downloads have plunged – probably one of the servers went down
-
We’ve got a new “whale” – one of the users spent much more than the others. We can analyze the profile and behavior in detail.
Predictive Analytics
If the platform has a large database with information about user actions in the product in question and other products of the same genre and under similar conditions, it can be a very good base for long term forecasting.
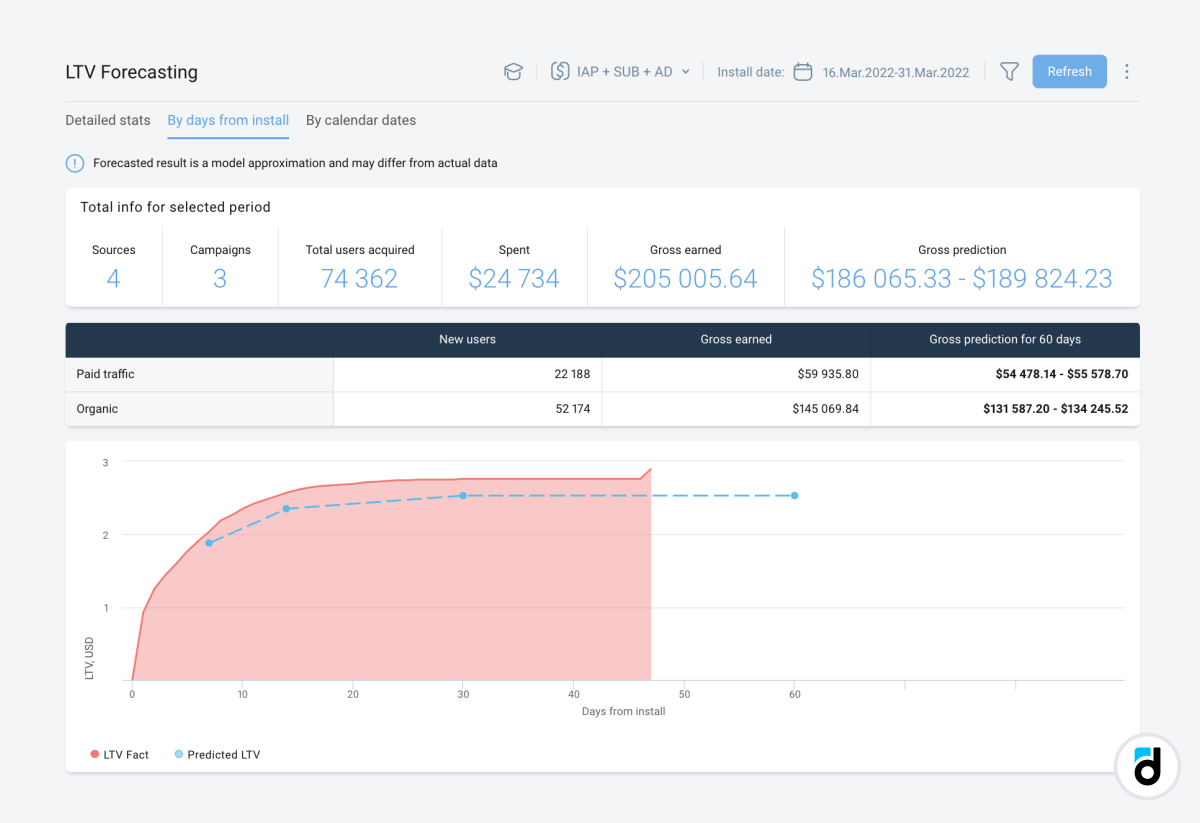
Here are several examples:
-
The platform calculates ARPU for the past 6 months on a daily basis while minding the trend and seasonality (e.g. we have a 5% increase on Fridays) and then builds a forecast for several weeks ahead.
-
The platform analyzes historical data on D1 retention rate and creates a confidence interval. If the metric goes out of the interval, it is labeled as abnormal.
-
If the real metric values deviate from the confidence interval or the forecast, the system displays a warning.
-
If our game has values of retention and ARPU similar to other projects of the same genre and our gamers make us $0.15 on average for the first week, we can take a look at the amount of money those players make us for the first month and take this number as a reference point.
-
Your user doesn’t open the game for three days. We can take data on actions of other users and predict the risk of churn for that user and send them a push notification.
More Tools
Analytics helps us communicate with users. This means that it has to have a toolset to address a group of users and each of them separately, e.g. push notifications and emails.
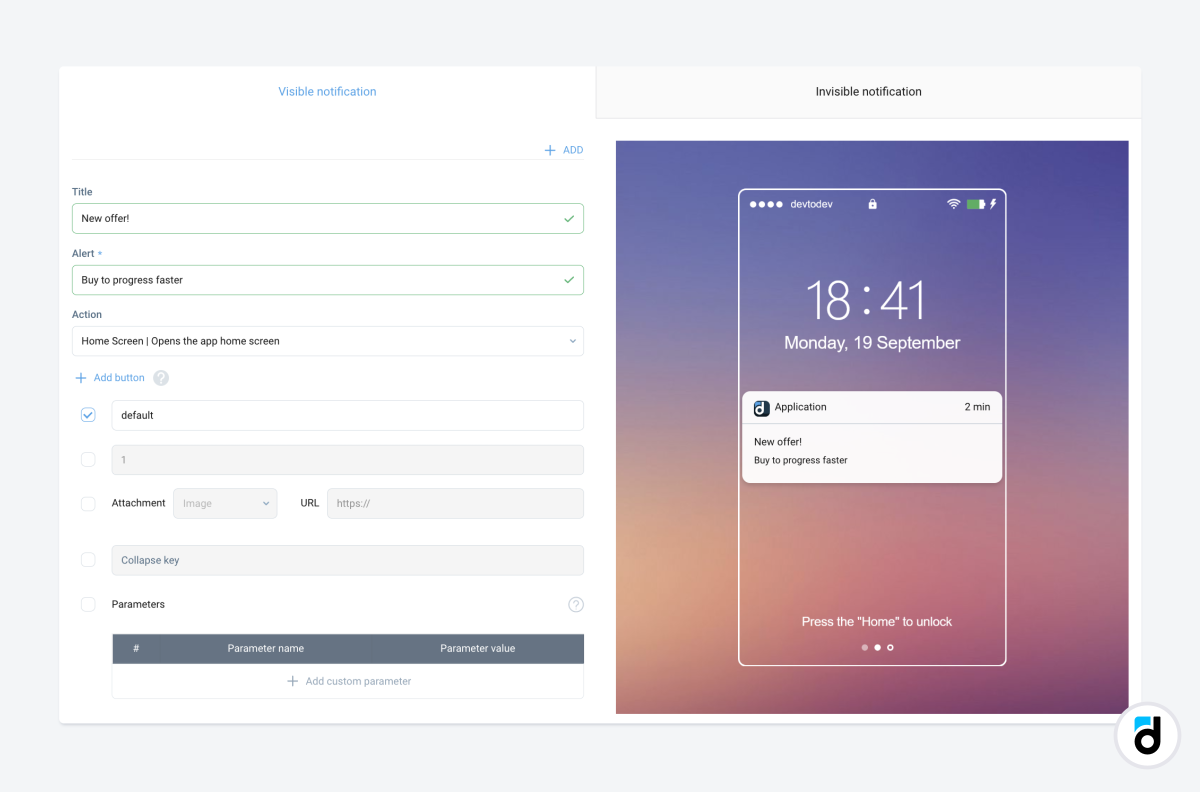
devtodev analytics allows you to quickly create a wide range of push notifications and analyze. Follow a simple algorithm:
-
Create user segments by various parameters (country, traffic source, whether they completed/failed to complete a certain event, etc. )
-
Assess metric values for each segment and compare them, follow them over time.
-
If you don’t like the values you see, you can simply open the ‘Push notification’ section of the devtodev platform, build a notification and send it to all the users in the segment. Later, you can check the results and improve the message.
The perfect analytics platfform has to be mindful of the analyst’s needs. They are basically the same for everyone and therefore the platform has to have a number of out-of-the-box reports that are readily available and meet the needs of the analysts:
-
Do you want to know whether or not the users like your project? Open the ‘Retention’ report.
-
Do you want to know how your metric values changed after the recent update? Open the ‘Cohort analysis’ report.
-
Do you want to know the points of churn? Go to the ‘Conversion Funnel’ section.
-
Do you want to learn behavior patterns? Go to the ‘Users & Segments’ section.
The list goes on. Our point here is that the platform needs to provide the analyst with the entire range of tools so that they will be able to answer any questions asked and spend as little time as possible.
Analysts and developers differ a great deal. Some of them don’t trust any third-party platforms and prefer to draw conclusions only from the data that they collected with their own hands. However, the perfect analytics platform can provide some service for them too: it can give access to raw data and allow for uploading them in the format chosen by the user. The system becomes a data storage device that you can turn to for data that you process by yourself.
Analytics platform also differ a great deal. Some of them analyze incoming traffic only, others – analyze user behavior after sign up. The ideal analytics system works both ways – it can analyze both traffic and user behavior. In a platform like that you can build varios funnels and create user segments while taking a traffic source as one of the parameters. This way you can maximize the number of “whales”, and compare traffic sources in more detail.
Few people have great math skills and the analystics platform should not require them from the developer. Its interface and functionality, its preset reports need to be as accessible and easy as possible. The process of turning data into a solution has to be fast and smooth.
If the developer has some problems with integration of the platform, if they have little experience working with such systems, they need to have access to a support service. The service should be professional enough to give practical advice that can be unique and tailor-made for this case. This is obvious but difficult to achieve in practice.
Last but not least – data precision. In fact, there is not much to say here. If the system provides us with data that are not precise and reliable, then all the advantages we’ve listed before, reduce to nil. The system can not be a mysterious black box and therefore the data it provides have to be trustworthy and precise.
Takeaway points
So, after much discussion, what features indicate a perfect analytics platform? You can use it to:
-
Analyze your own mistakes and boost retention
-
Analyze your successes and boost income
-
Receive automated notifications
-
Receive recommendations
-
Compare your project with a market average
-
Predict some user actions and forecast some metrics
-
Communicate with end users
-
Access raw data
-
Analyze both traffic and user behavior
-
It has to provide good support
-
It has to be easy and have a simple interface
-
Its data must be precise.
All of these looks achievable and devtodev, a full-cycle analytics solution for app and game developers, already has almost all of the features.