
Devtodev is helping you keep in touch with what’s happening in the game market. Every month we publish an overview of reports on the most popular games worldwide, top-grossing games, successful releases, favorite video game types, trends, etc. This overview is prepared by Dmitriy Byshonkov - the author of the GameDev Reports by devtodev Telegram channel. You can read the February and March reports.
Contents
- Game sales Round-up (20.03.2024 - 02.04.2024)
- Newzoo: PC and Console Games in 2024
- AppMagic: Top Mobile Games by Revenue and Downloads in March 2024
- Sensor Tower: Mobile Games in 2024
- Newzoo: Helldivers II became the highest-earning game of February
- Sensor Tower: Analysis of Pinball/Brick Breaker Subgenres
- GSD & GfK: Game sales on PC and consoles in March in the UK grew by 26%
- Sensor Tower: Strategy Games in the South Korean mobile market in 2024
- Ampere Analysis: EA Sports FC 24 dominates by console players engagement
- data.ai: Royal Match became the fastest game in history that went from $2B to $3B in Revenue
- Video Game Insights: F2P Games on Steam in 2024
- ABRA Games: Brazilian Gaming Industry in 2023
- GSD & GfK - European gaming market for PC and consoles grew well in March 2024
- StreamElements & Rainmaker.gg: State of the Streaming market in March 2024
- Game Sales Round-up (03.04.24 - 16.04.24)
- game: The German Gaming Market almost reached €10B in 2023
- Konvoy Ventures: Investments in the Gaming Industry in Q1'24
Game sales round-up (20.03.2024 - 02.04.2024)
-
Neowiz reported that the number of players in Lies of P has exceeded 7 million. The game was released in September 2023 and has been available on Game Pass since day one.
-
Rollerdome has surpassed the milestone of 1 million copies sold. It took the niche game 2 years to achieve this.
-
The Dragonflight expansion for World of Warcraft finally brought the audience back to the game. Before its release, the game had around 4.5 million subscribers; now it's around 7.25 million.
-
Contraband Police from PlayWay sold 800 thousand copies. Revenue net of Steam commission, taxes, and refunds has already exceeded $10 million. The game recouped development budget in 2 days.
-
It Takes Two has sold 16 million copies since its release in 2021. Over 30 million people have played the game. Well deserved.
-
Unicorn Overlord has sold over half a million copies since its release on March 8. The developer's previous game, 13 Sentinels: Aegis Rim, took 3 years to reach a million copies sold. Unicorn Overlord has an 86 Metacritic score.
-
Jim Ryan, in a farewell visit to the PlayStation Podcast, announced that PlayStation 2 sales have exceeded 160 million units. In 2012, Sony reported 155 million units sold; production was discontinued in January 2013.
Newzoo: PC and Console Games in 2024
Market Overview
-
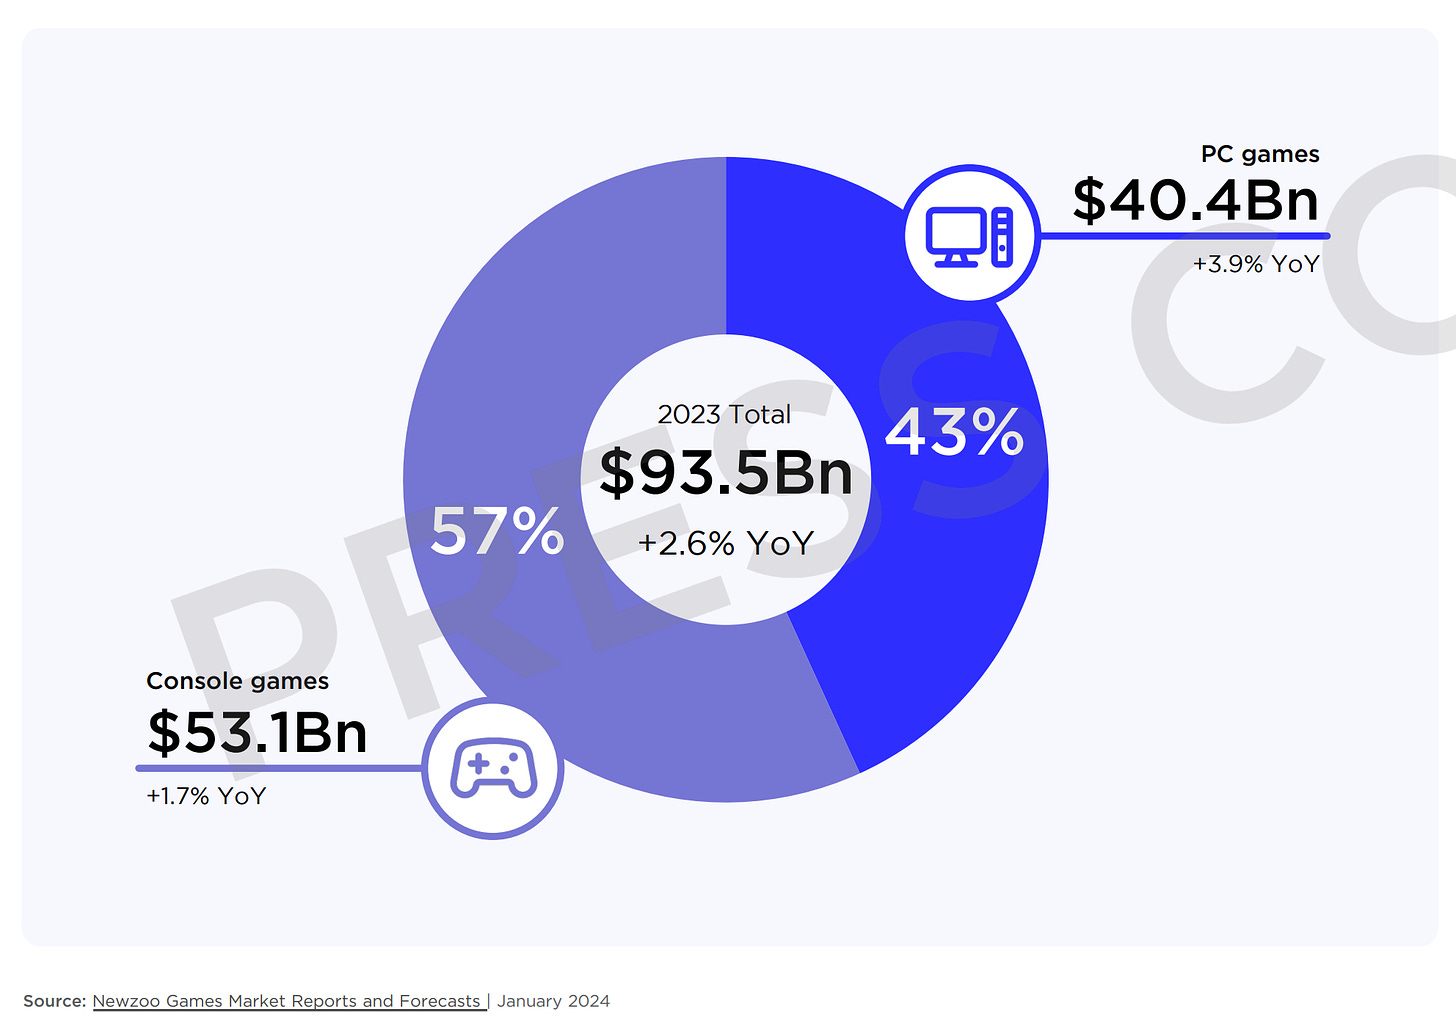
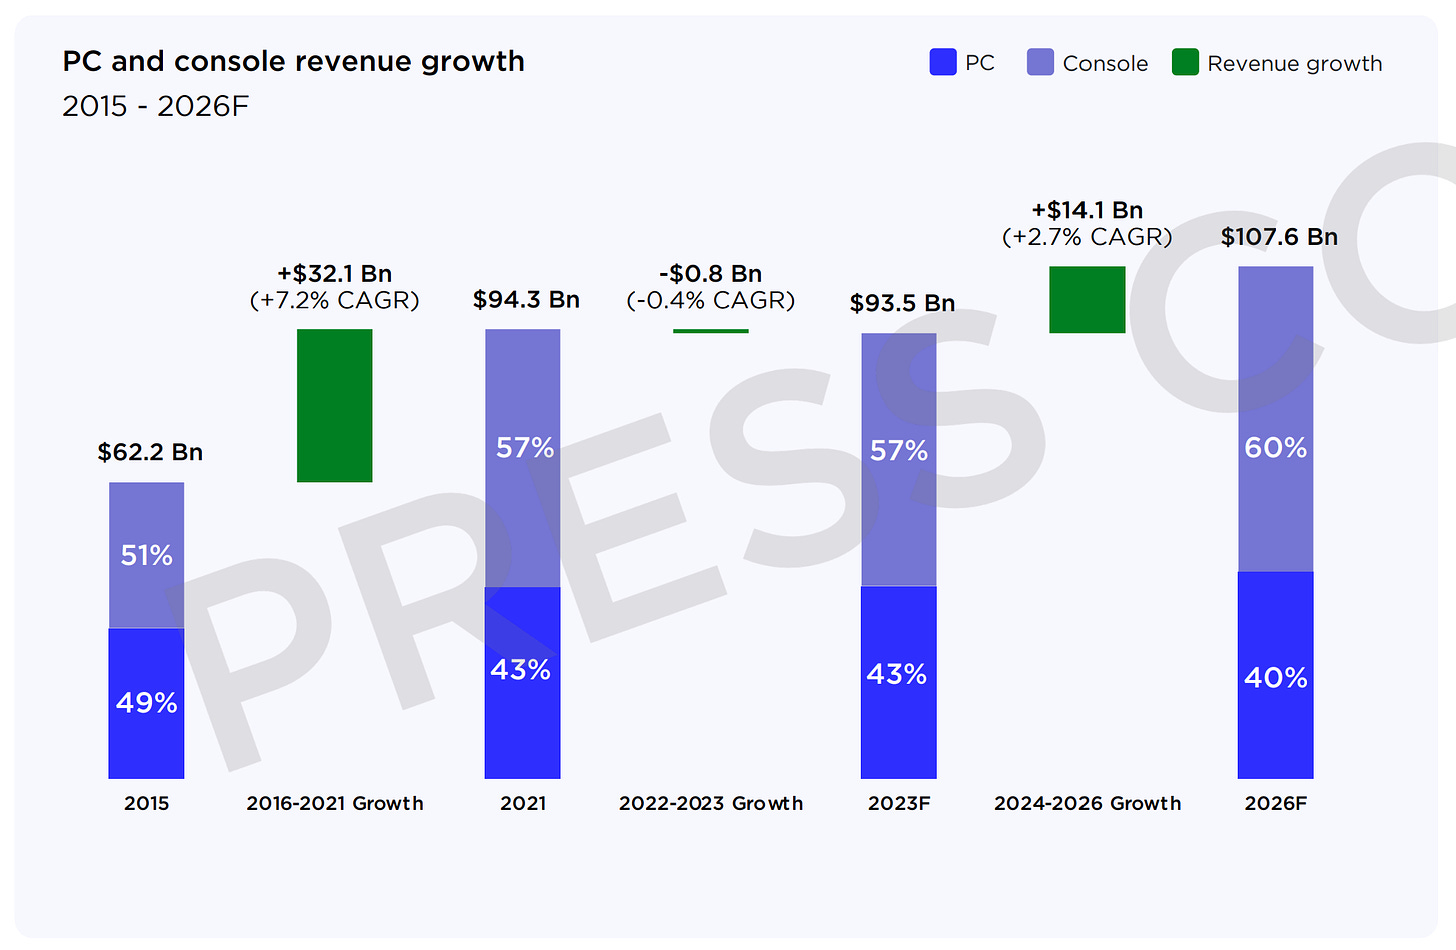
The PC and console market grew by 2.6% in 2023, reaching $93.5 billion.
-
The console market size reached $53.1 billion (+1.7% YoY). The PC market size grew to $40.4 billion (+3.9% YoY).
❗️Newzoo notes that the growth is quite moderate despite the large number of major releases in 2023. This is likely due to limited user time. Major buy-to-play releases diverted the audience and cannibalized GAAS projects.
-
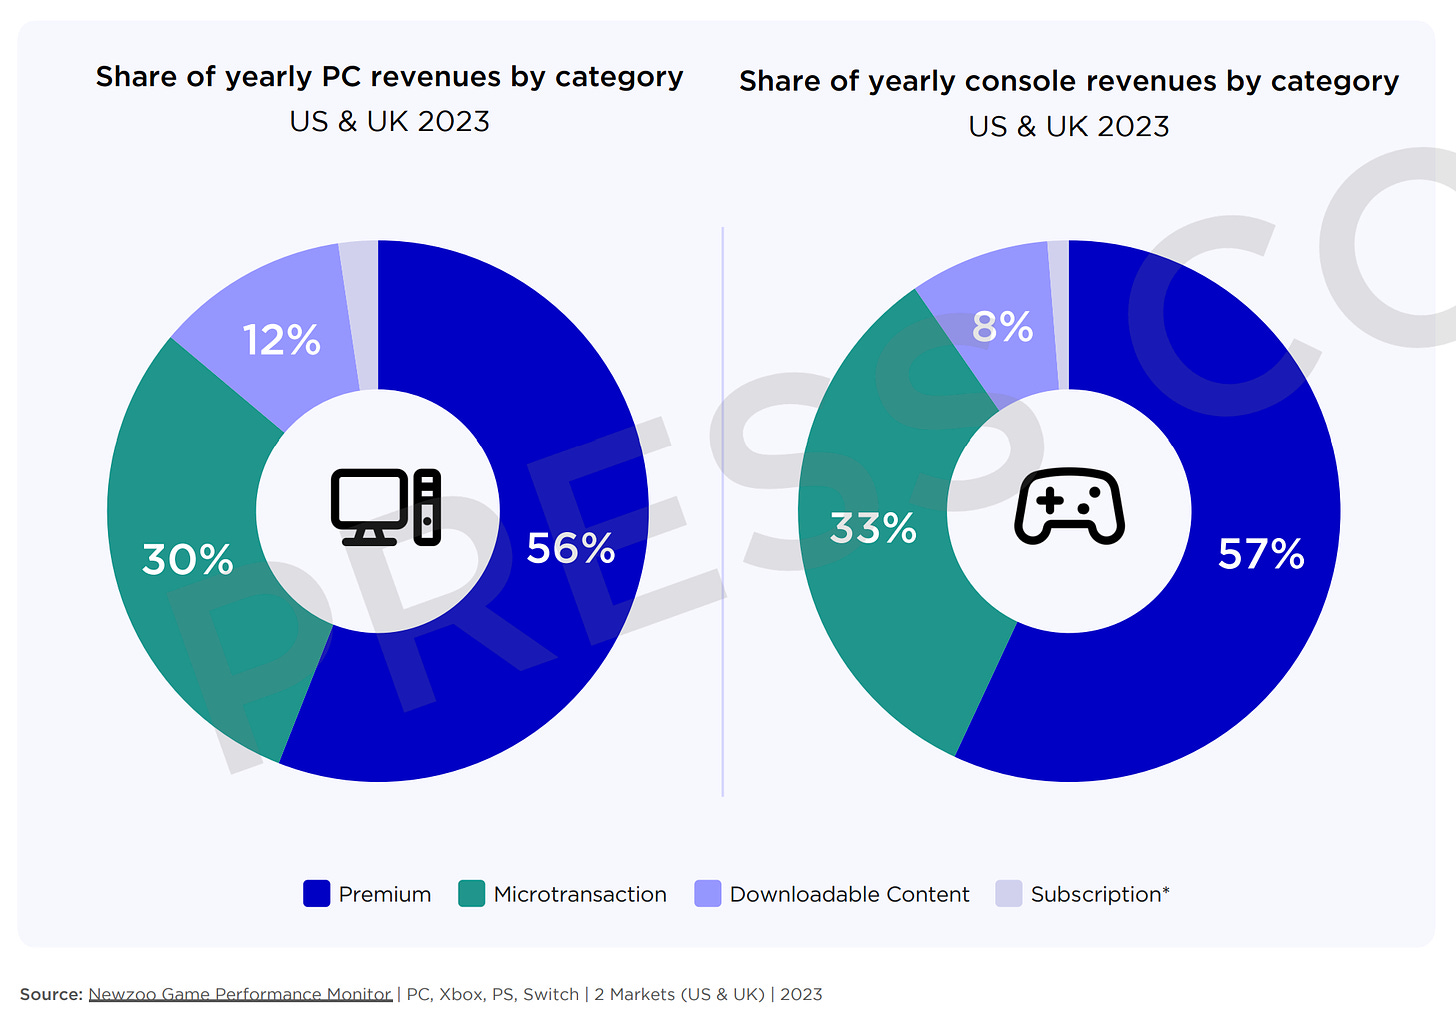
Paid games accounted for 56% of revenue on PC and 57% of revenue on consoles in the US and UK markets. Microtransactions accounted for 30% (PC) and 33% (consoles); paid downloadable content accounted for 12% (PC) and 8% (consoles). The rest was attributed to subscriptions.
-
From 2015 to 2021, PC and console markets grew by 7.2% annually. In 2022-2023, the growth was negative, at -0.4% CAGR. However, Newzoo analysts are quite optimistic and expect the segment to grow by 2.7% annually until 2026, reaching $107.6 billion by the end of 2026.
-
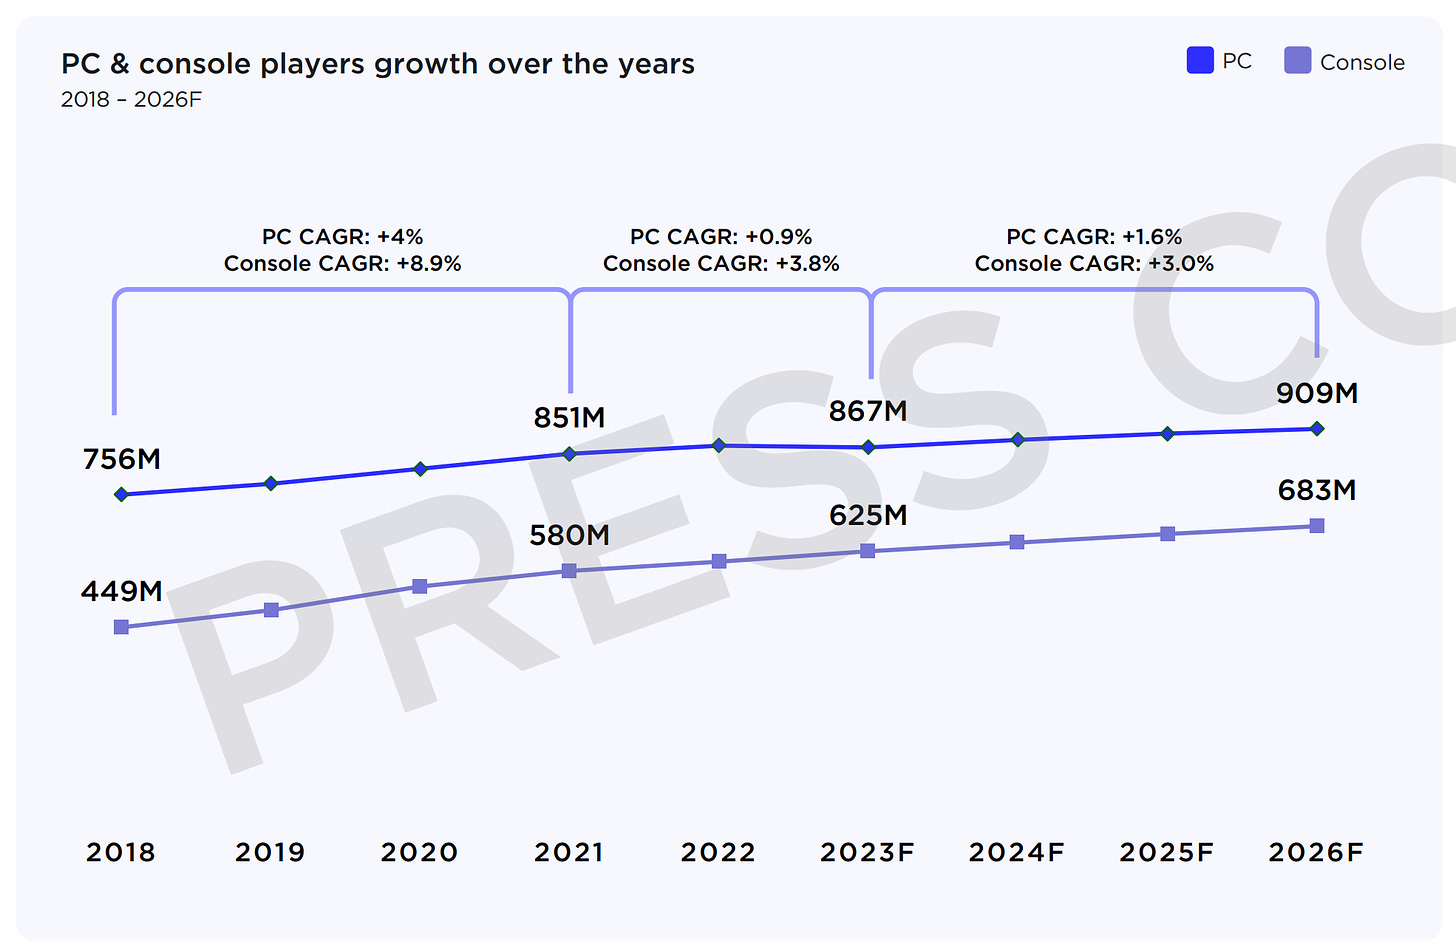
Revenue growth is limited by the slowing growth of the audience base. On PC, the audience grew by 4% annually from 2018 to 2021, by 0.9% annually from 2021 to 2023, and is expected to grow by 1.6% from 2023 to 2026. On consoles, the audience grew by 8.9% annually from 2018 to 2021, by 3.8% from 2021 to 2023, and is expected to grow by 3% from 2023 to 2026.
-
Fortnite; Roblox; Minecraft; GTA V; the Call of Duty series are leaders on PC and consoles in terms of MAU (excluding Nintendo Switch). The most interesting thing here is something else. The average age of projects in the top 10 by MAU is 9.6 years on PC; 7.4 years on PlayStation; 7.2 years on Xbox; and 3.9 years on Nintendo Switch.
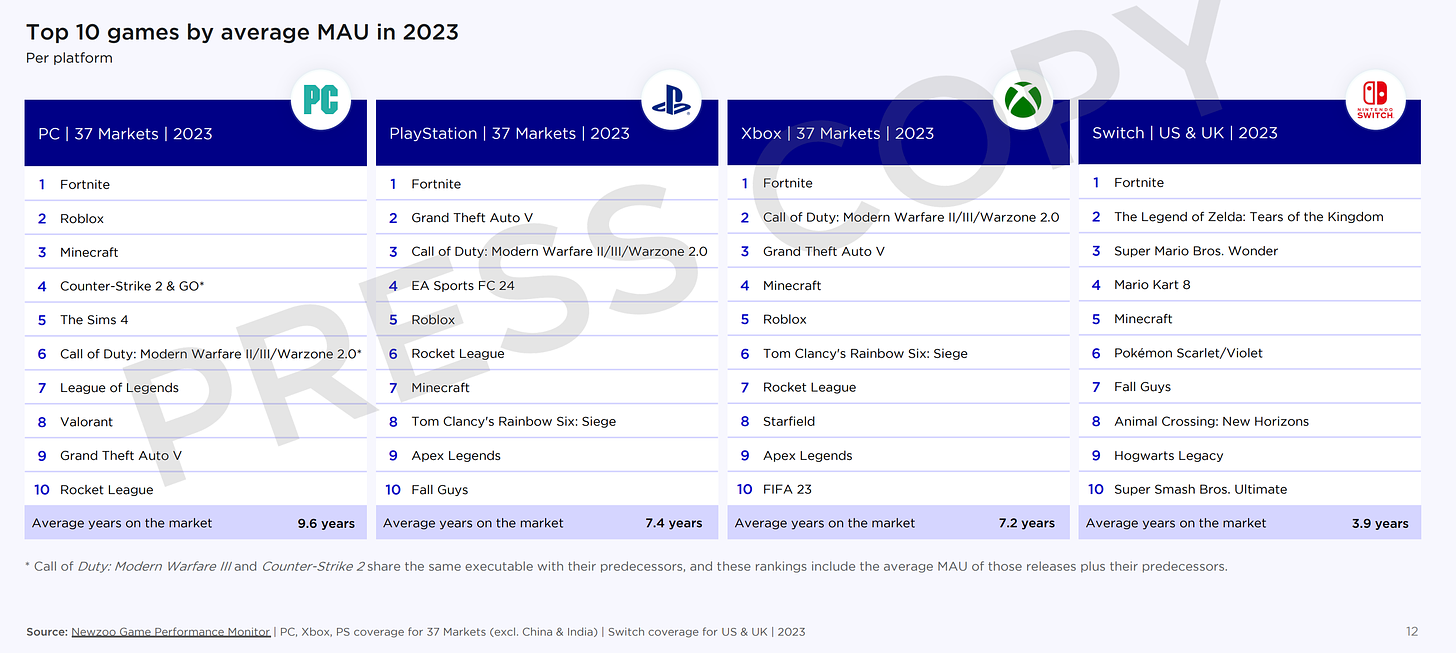
❗️This indicates that it is extremely difficult for new games to displace behemoths that have established themselves in the market. People still return to them.
-
Looking more closely at the top MAU rankings, there are ecosystems (Fortnite; Roblox); sandboxes (Minecraft; The Sims; GTA V); competitive multiplayer games (League of Legends; Counter-Strike; Valorant); annual major franchises (FIFA, Call of Duty); AAA projects (Starfield); and Nintendo exclusives are included.
-
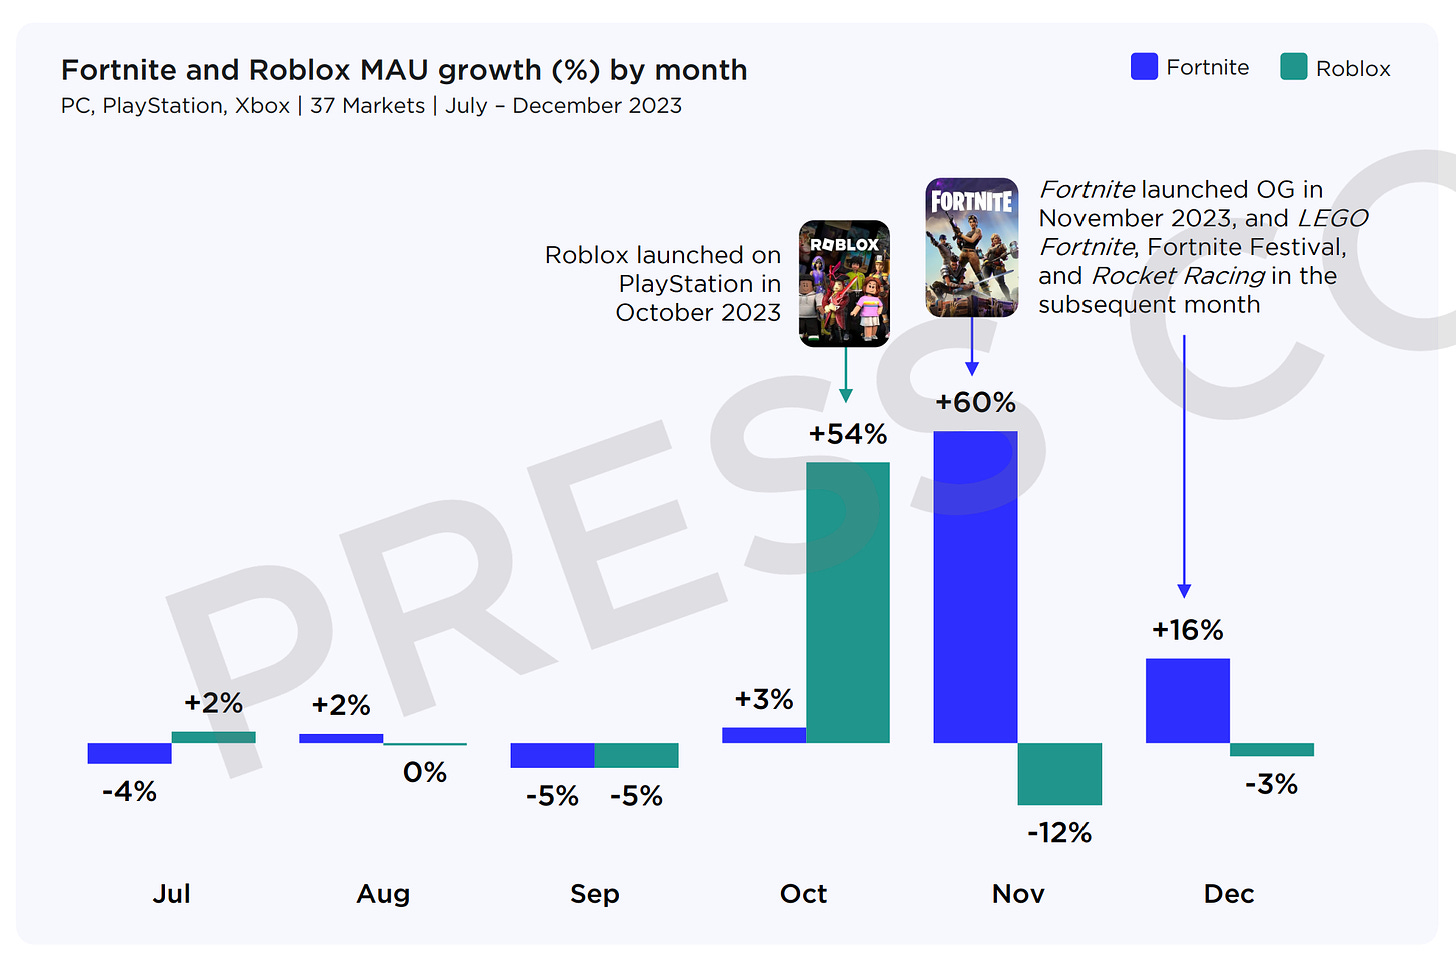
Despite their age, both Roblox and Fortnite are growing in terms of MAU. Roblox is expanding to new platforms (the release on PlayStation in October 2023 led to a +54% MAU increase); Fortnite is releasing new modes and gaming experiences (the releases of Fortnite OG; LEGO Fortnite, etc., led to a 60% MAU increase in November 2023 and a 16% increase in December 2023).
How people play on PC and Consoles
-
Since 2021, people have been playing less on PC and consoles. The total amount of time spent on games in Q4 2023 was 26% less than in Q1 2021.
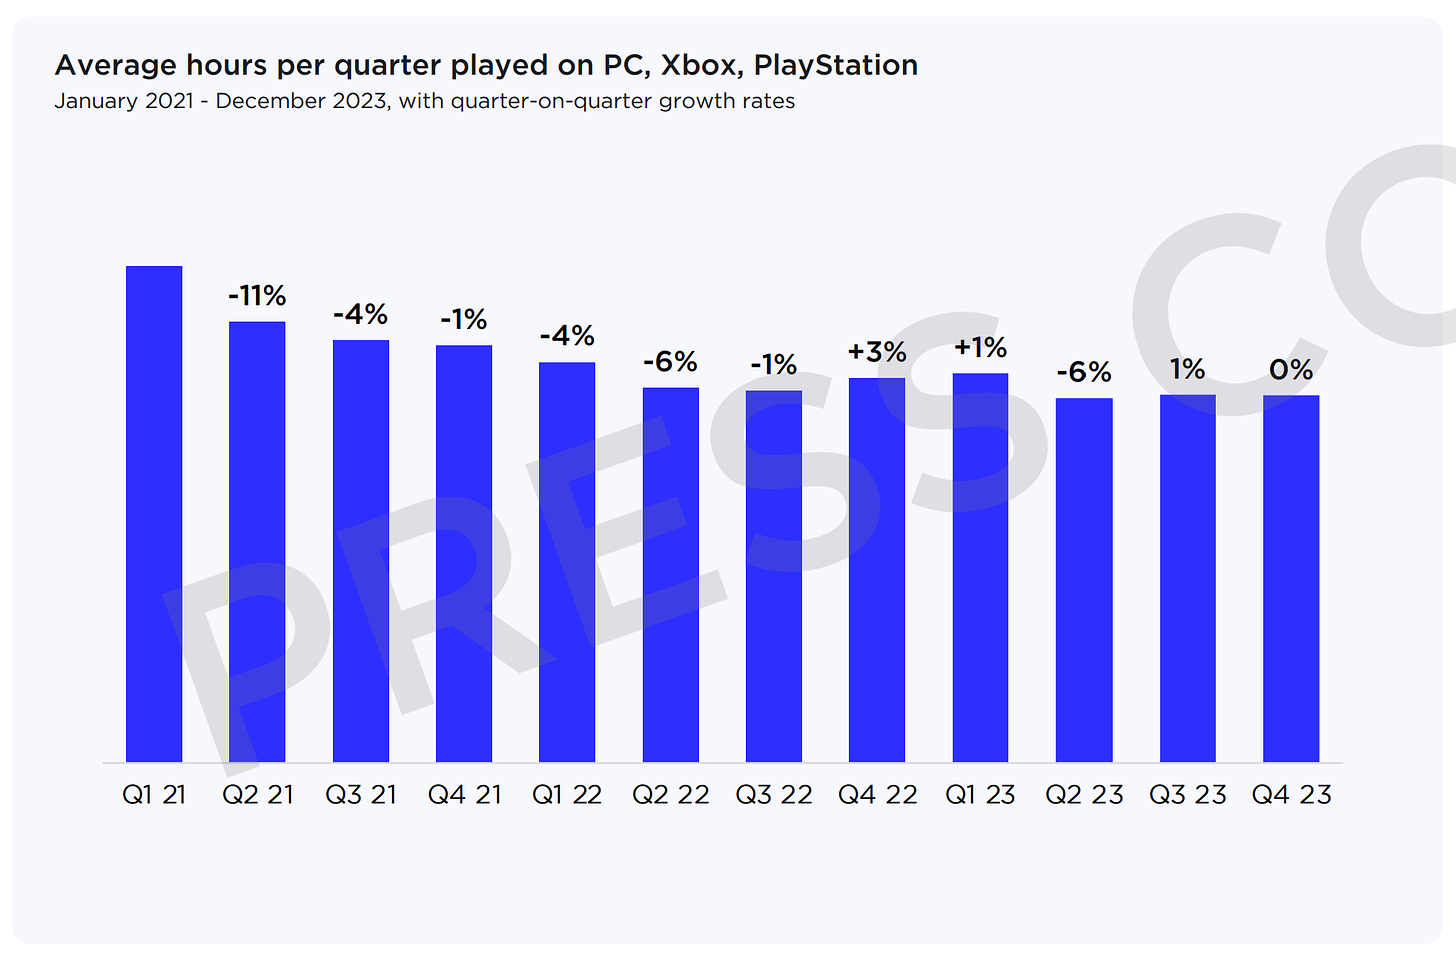
❗️Newzoo compares the figures with the peak of pandemic lockdowns. For clarity, it is better to compare with Q4 2019 figures.
-
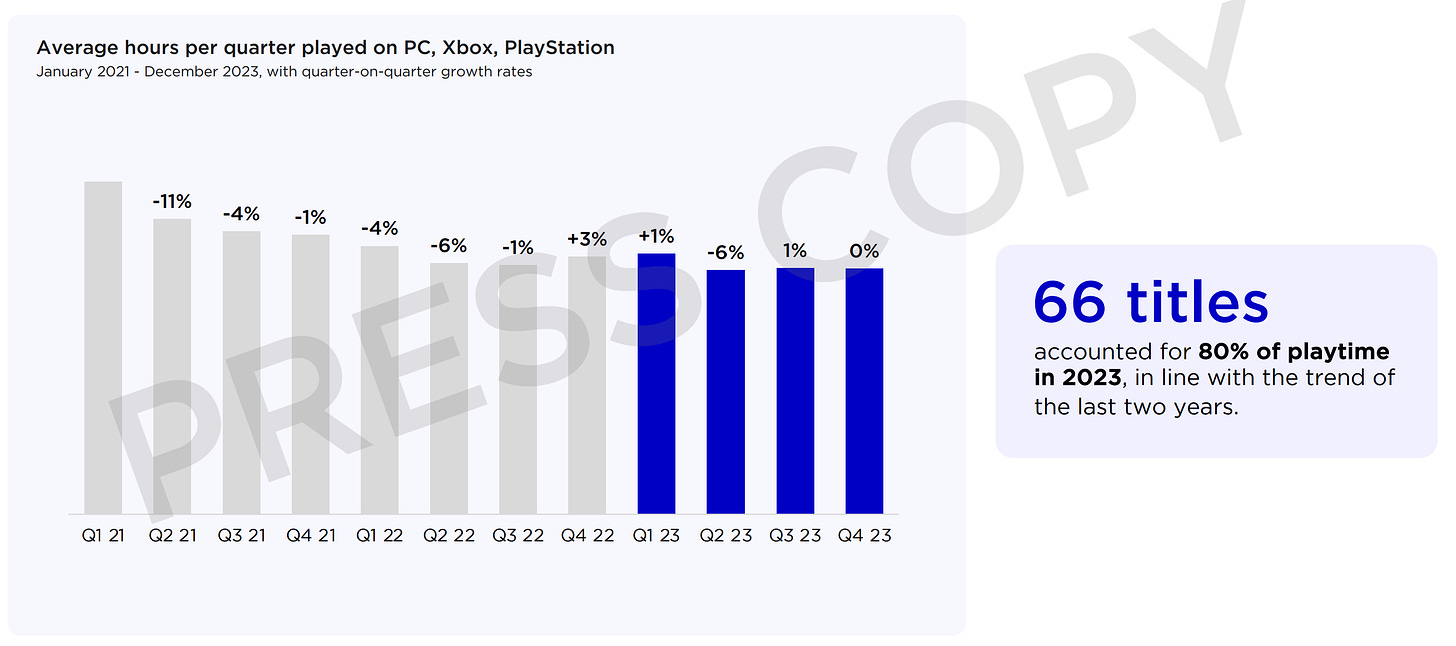
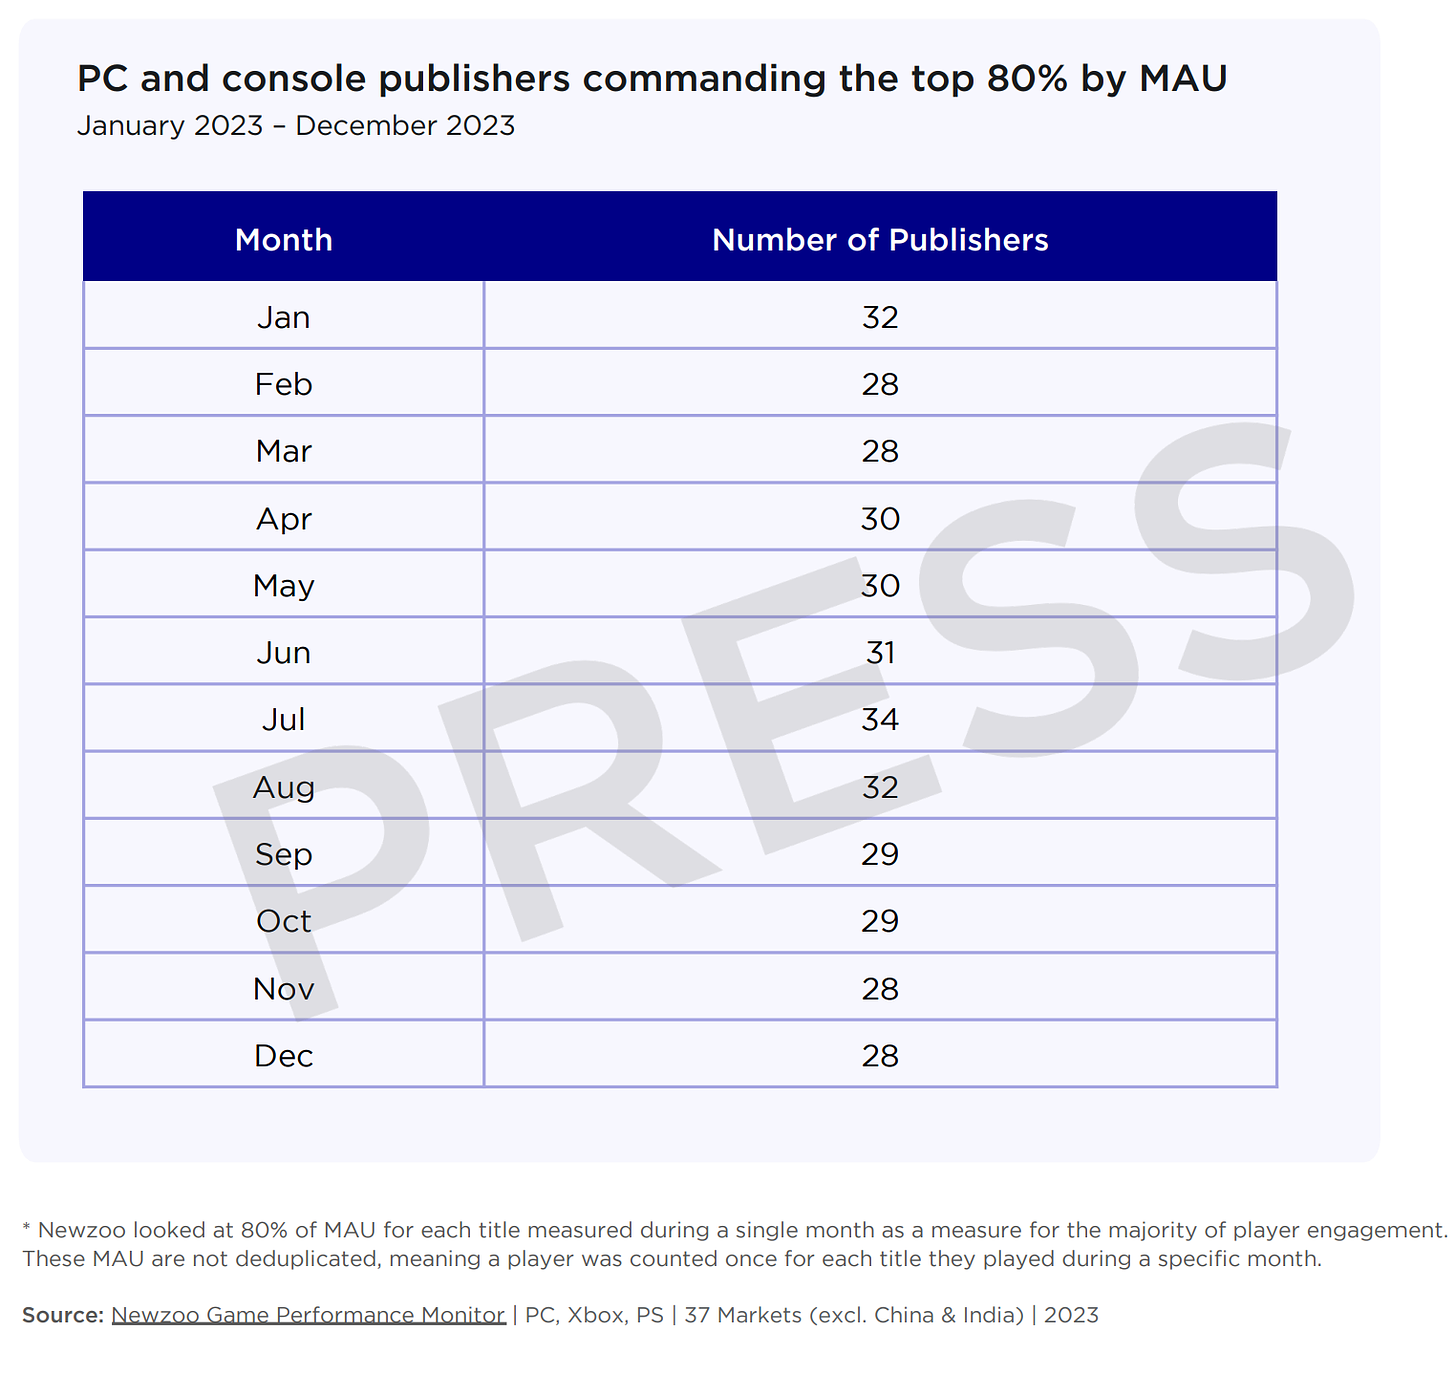
66 games on PC and consoles account for 80% of all gaming time.
-
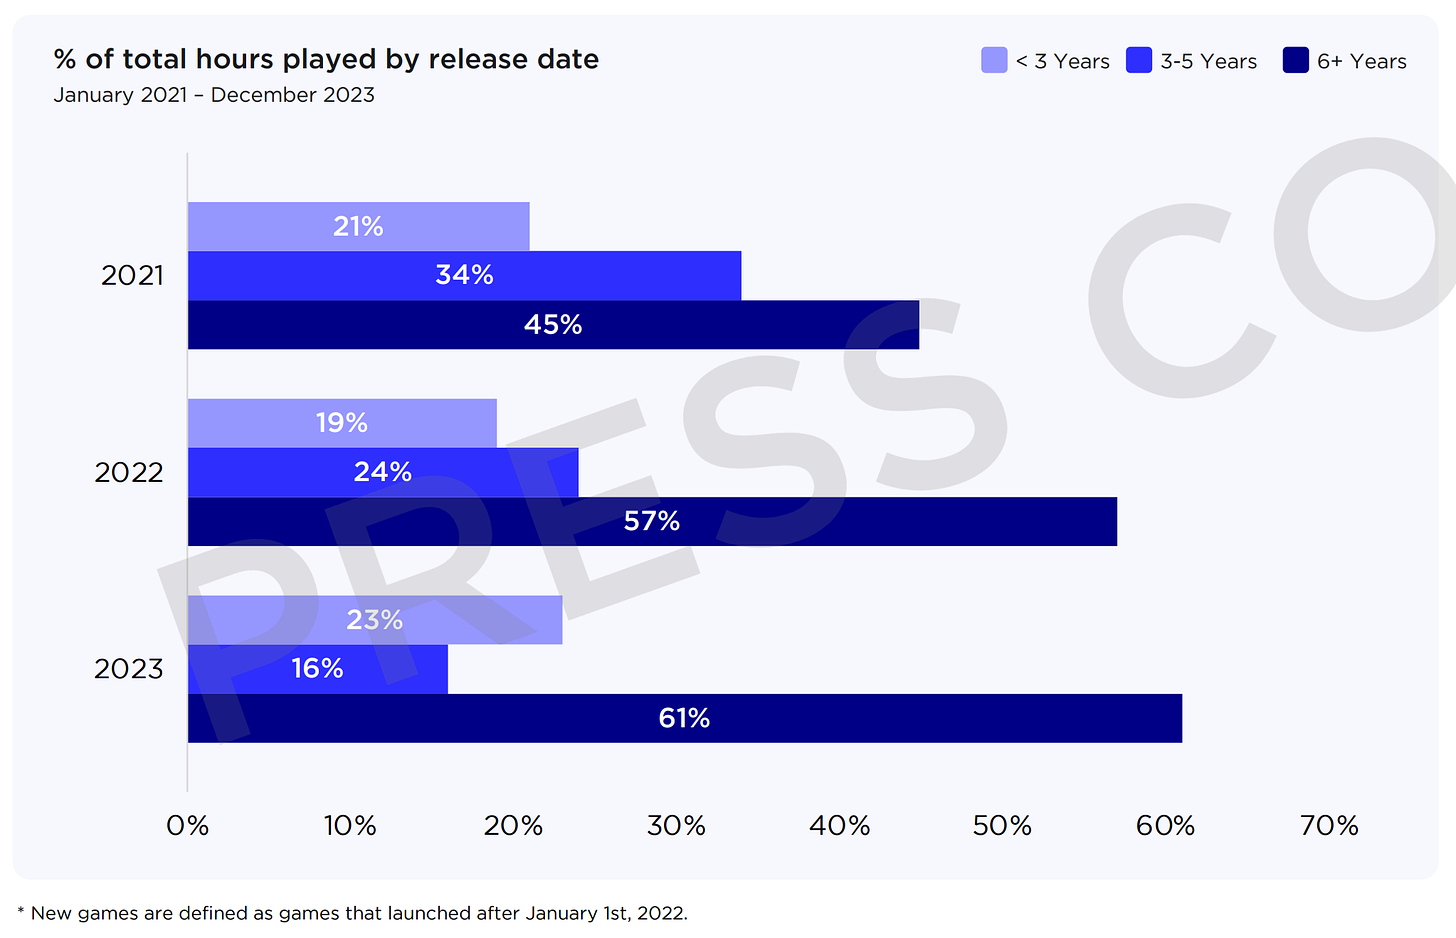
In 2023, games older than 5 years accounted for 61% of all gaming time on PC and consoles. Another 16% of gaming time was spent on games aged 3 to 5 years. The situation was better in 2022 and 2021.
-
However, in 2023, relatively new games (less than 3 years old) were able to increase their share to 23% of gaming time. This is the best result in the last 3 years.
-
In 2023, Fortnite (released in 2017); Roblox (2006); League of Legends (2009); Minecraft (2011); and GTA V (2013) accounted for 27% of all gaming time for users.
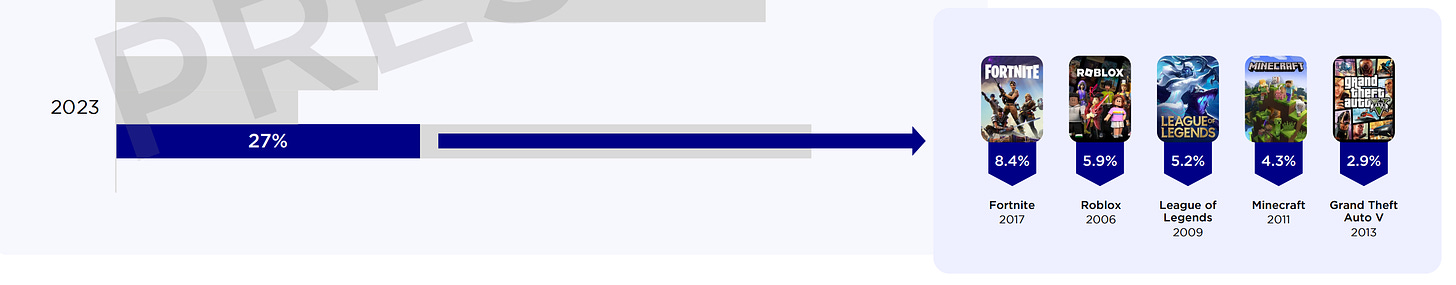
❗️With a high degree of probability, these users are unlikely to go anywhere - they have been living in these games for years. This should be remembered when modelling business strategies.
-
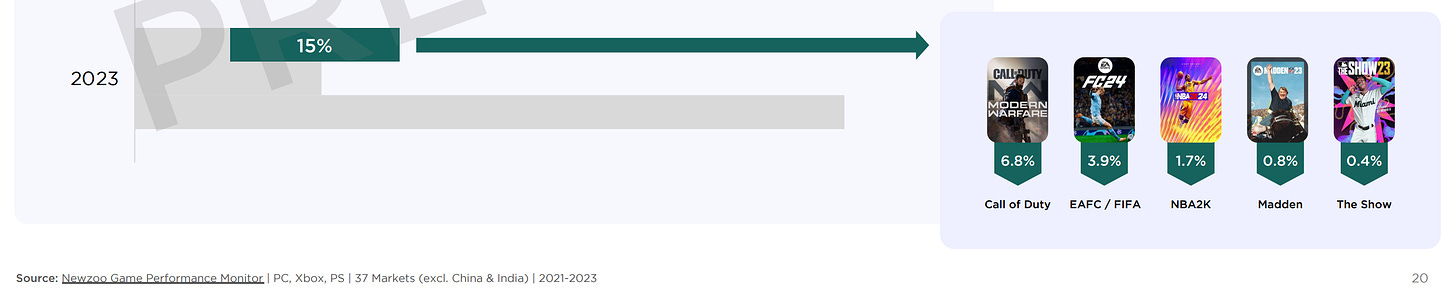
Of the 23% of all gaming time spent on new games in 2023, 60% came from annual franchises - Call of Duty; EA Sports FC; NBA 2K; Madden NFL; MLB: The Show. Thus, in reality, new projects only accounted for 8% of audience time.
-
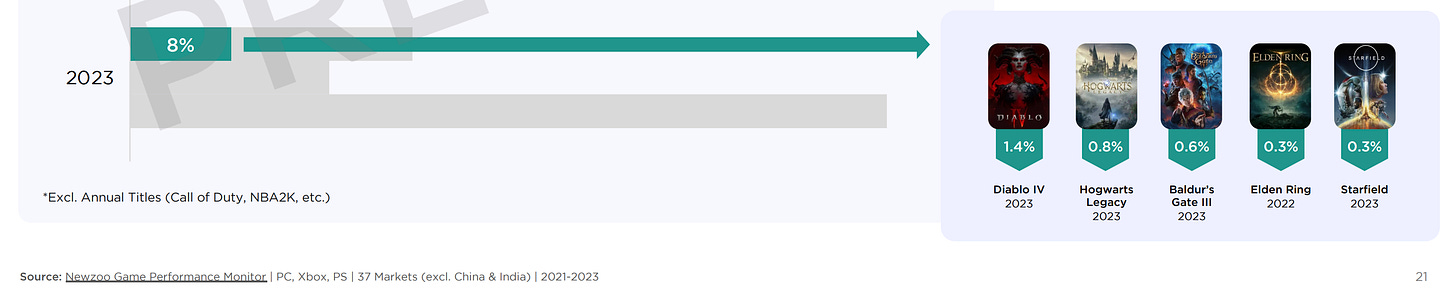
3.5% of players' time from these 8% was spent on Diablo IV; Hogwarts Legacy; Baldur’s Gate III; Elden Ring; and Starfield. Only one of these games is GAAS.
-
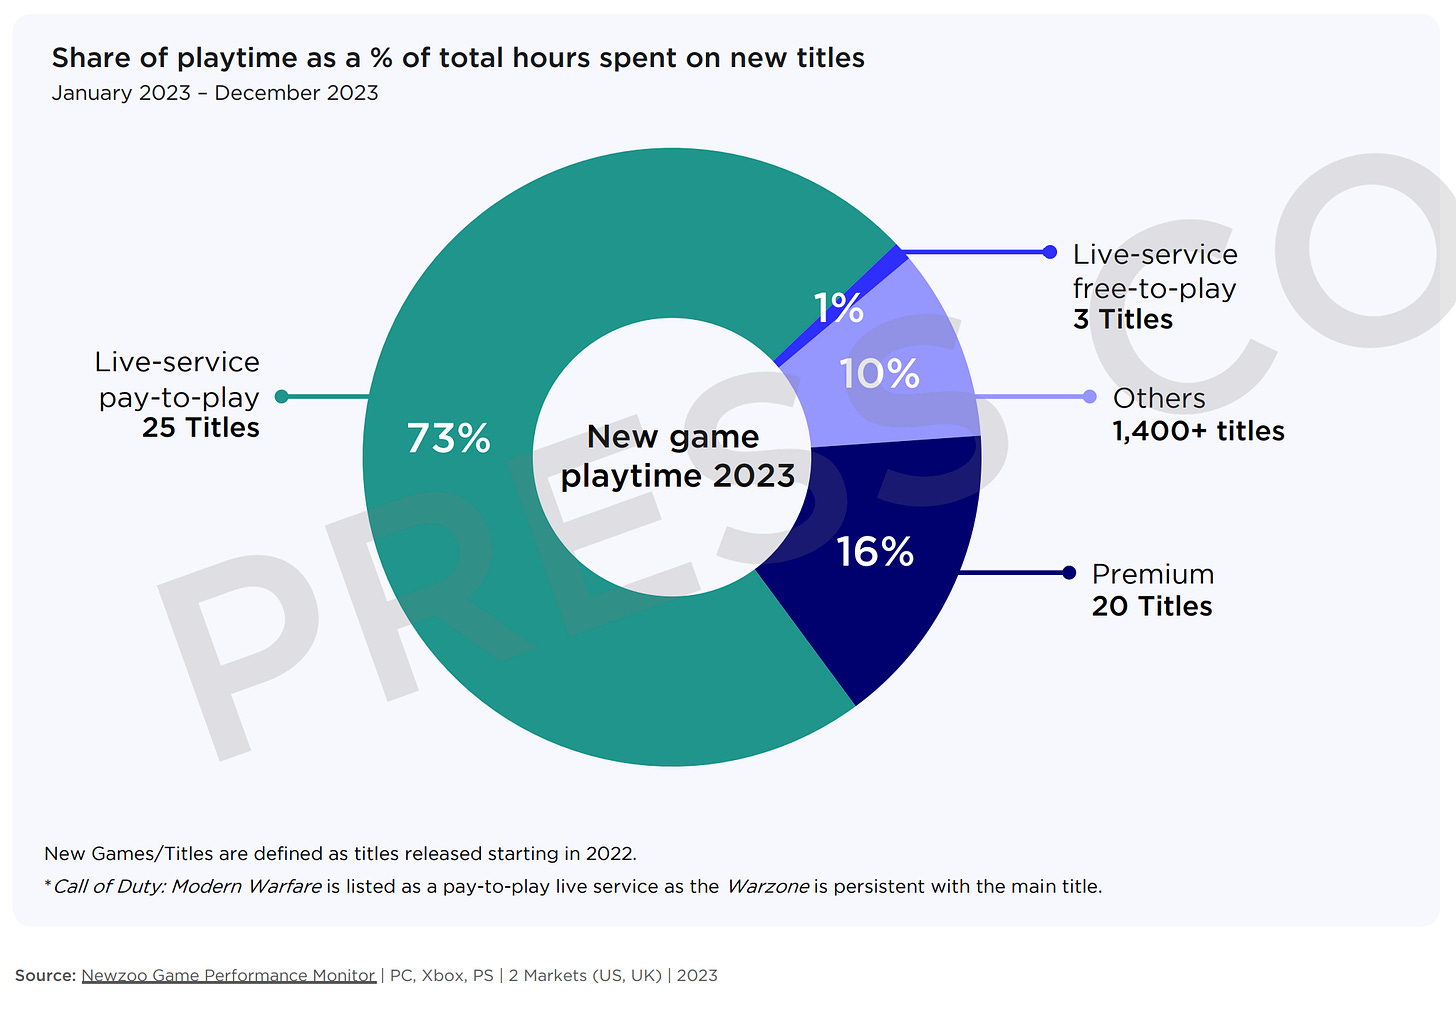
If we consider new games (released in 2022 and earlier, and accounting for 23% of gaming time in 2023) that users spent time on in 2023, the situation is as follows - 90% of the time was spent on 48 projects. The remaining 10% was spent on more than 1400 projects.
-
73% of the time was spent on GAAS Pay-to-play projects (including Call of Duty, with a total of 25 such projects); 16% was spent on Premium projects (20 games); 10% - on 1400 other games; 1% - on free GAAS games (3 projects).
-
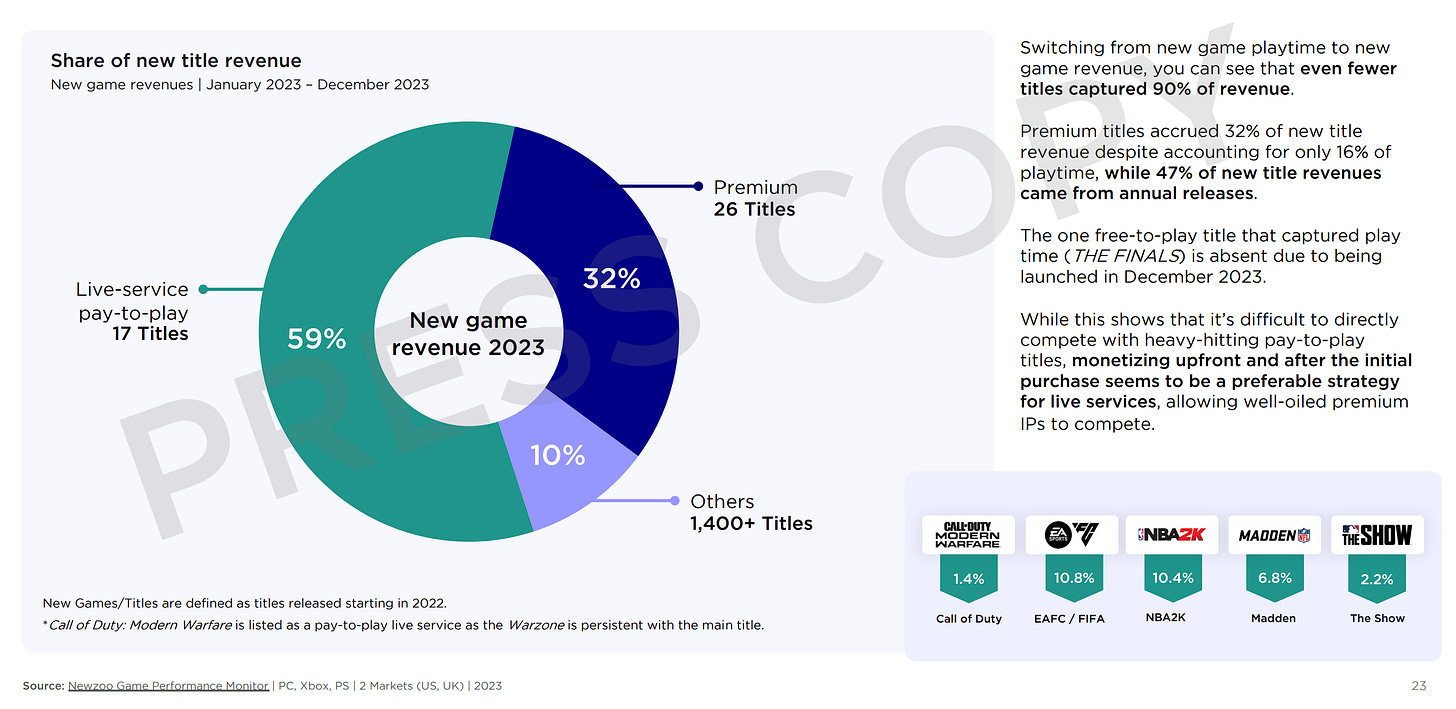
90% of revenue from new projects (released in 2022 and earlier) came from 43 projects. 59% came from paid GAAS projects (almost 80% of this came from annual franchises); 32% - from new paid games.
-
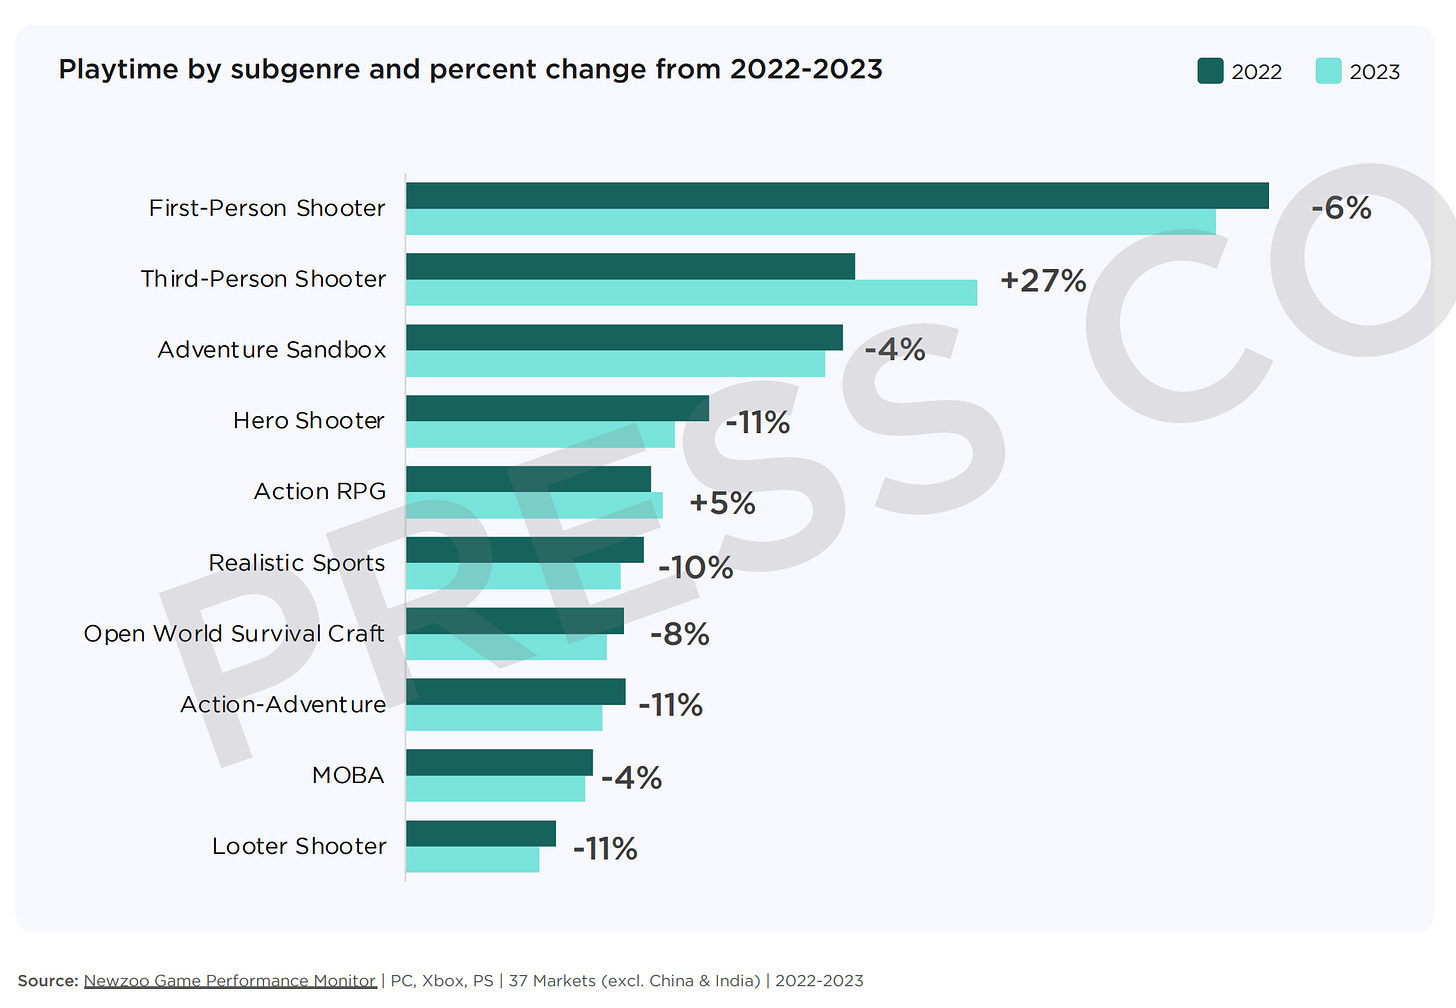
All genres, except third-person shooters (+27% YoY) and Action-RPGs (+5% YoY), lost gaming time in 2023.
Market Situation
-
The number of publishers in the market has been declining since 2021. In 2023, there were constantly 23 publishers in the market (+5 that appeared in ratings), which accounted for over 80% of MAU on PC and consoles.
-
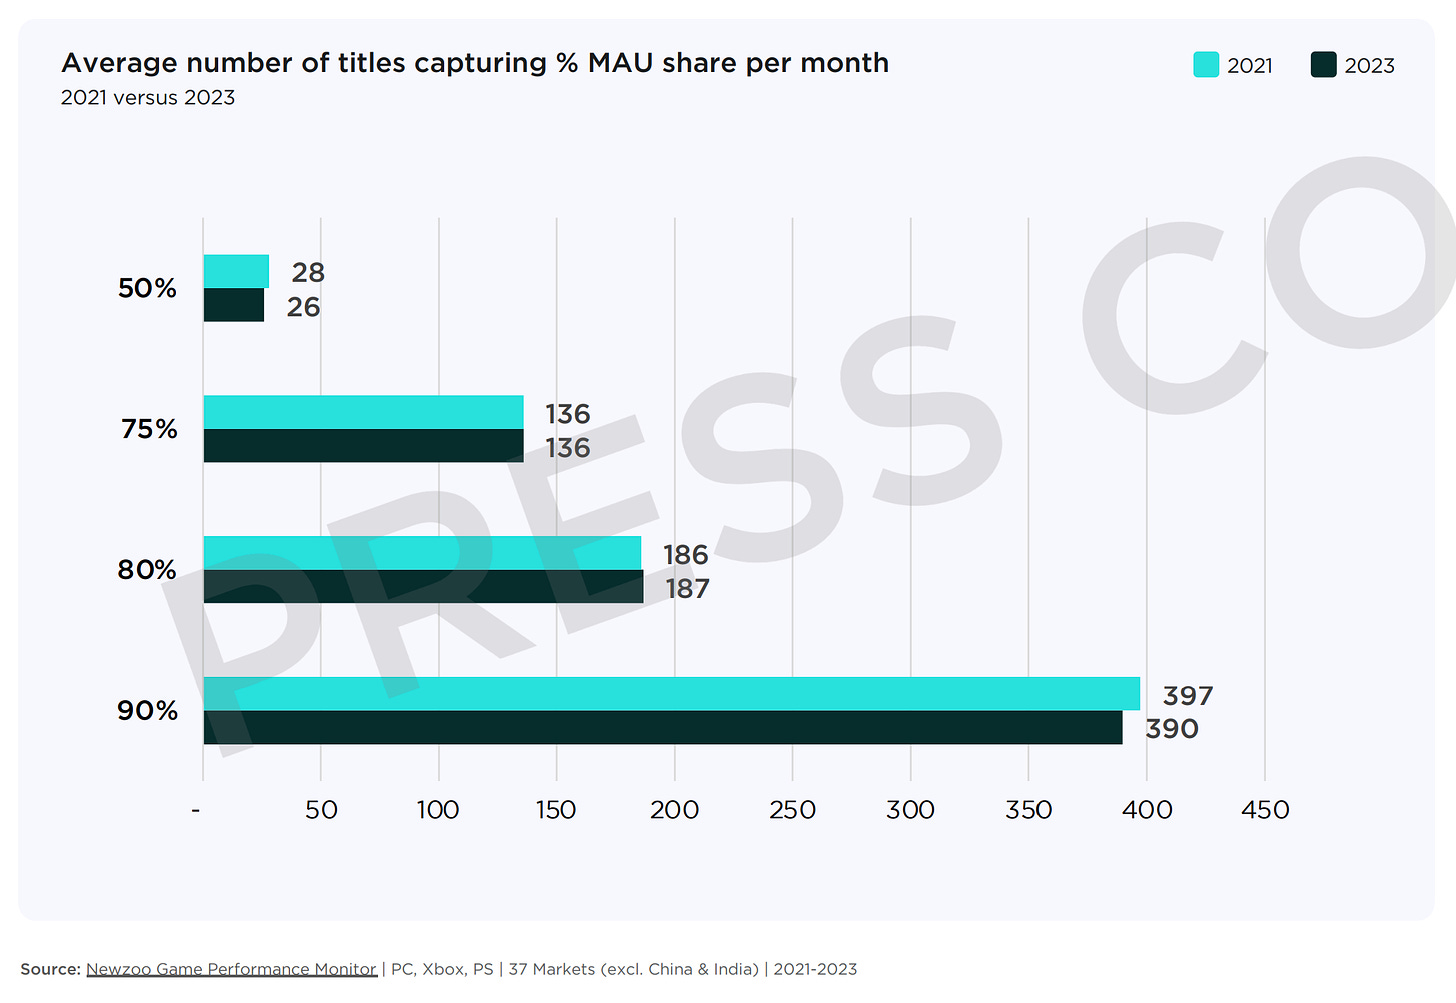
Overall, the number of games played by users has not changed since 2021. Only the time they spend on games has decreased.
-
80% of the top 50 games by MAU in 2023 have franchises; the brightest representatives without franchises are The Finals, BattleBit Remastered, Ready or Not, Starfield, and Party Animals. In the top 250 games, 54% has a franchise.

-
Newzoo notes the success of remasters and remakes. Square Enix sold over 7 million copies of Final Fantasy VII Remake; Capcom successfully released Resident Evil 4 Remake (over 6 million copies); Konami is preparing remakes of MGS 3 and Silent Hill 2.
-
Remakes have a positive impact on the performance of the original game. For example, MAU in Resident Evil 4 increased by 57% after the remake was announced. It grew even more significantly after the release.
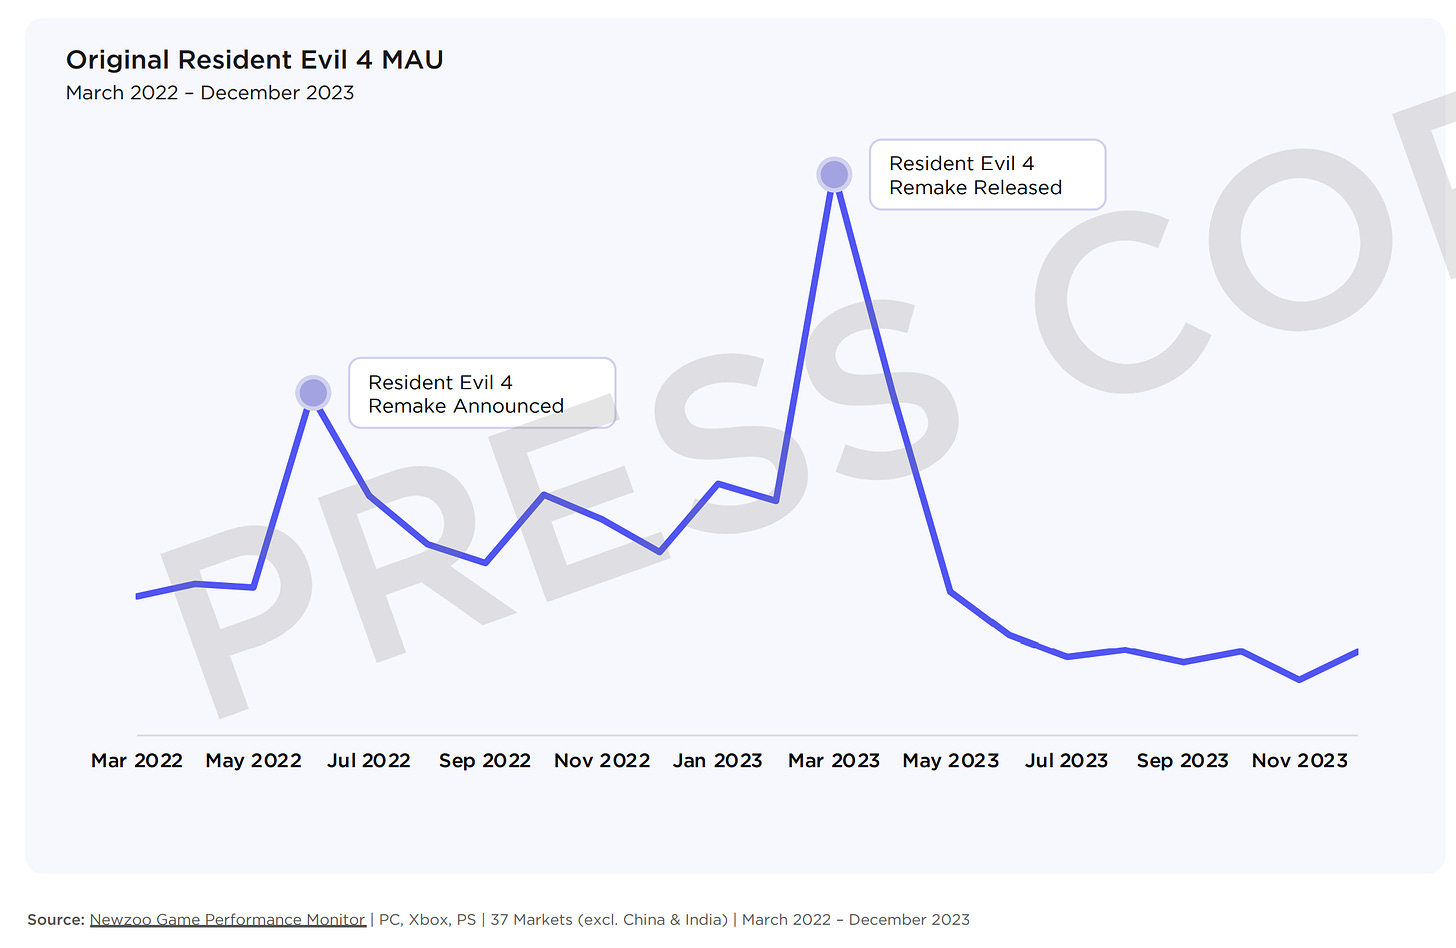
❗️However, it is worth noting that after the release of the remake, MAU of the original game dropped below the values before the remake was announced.
-
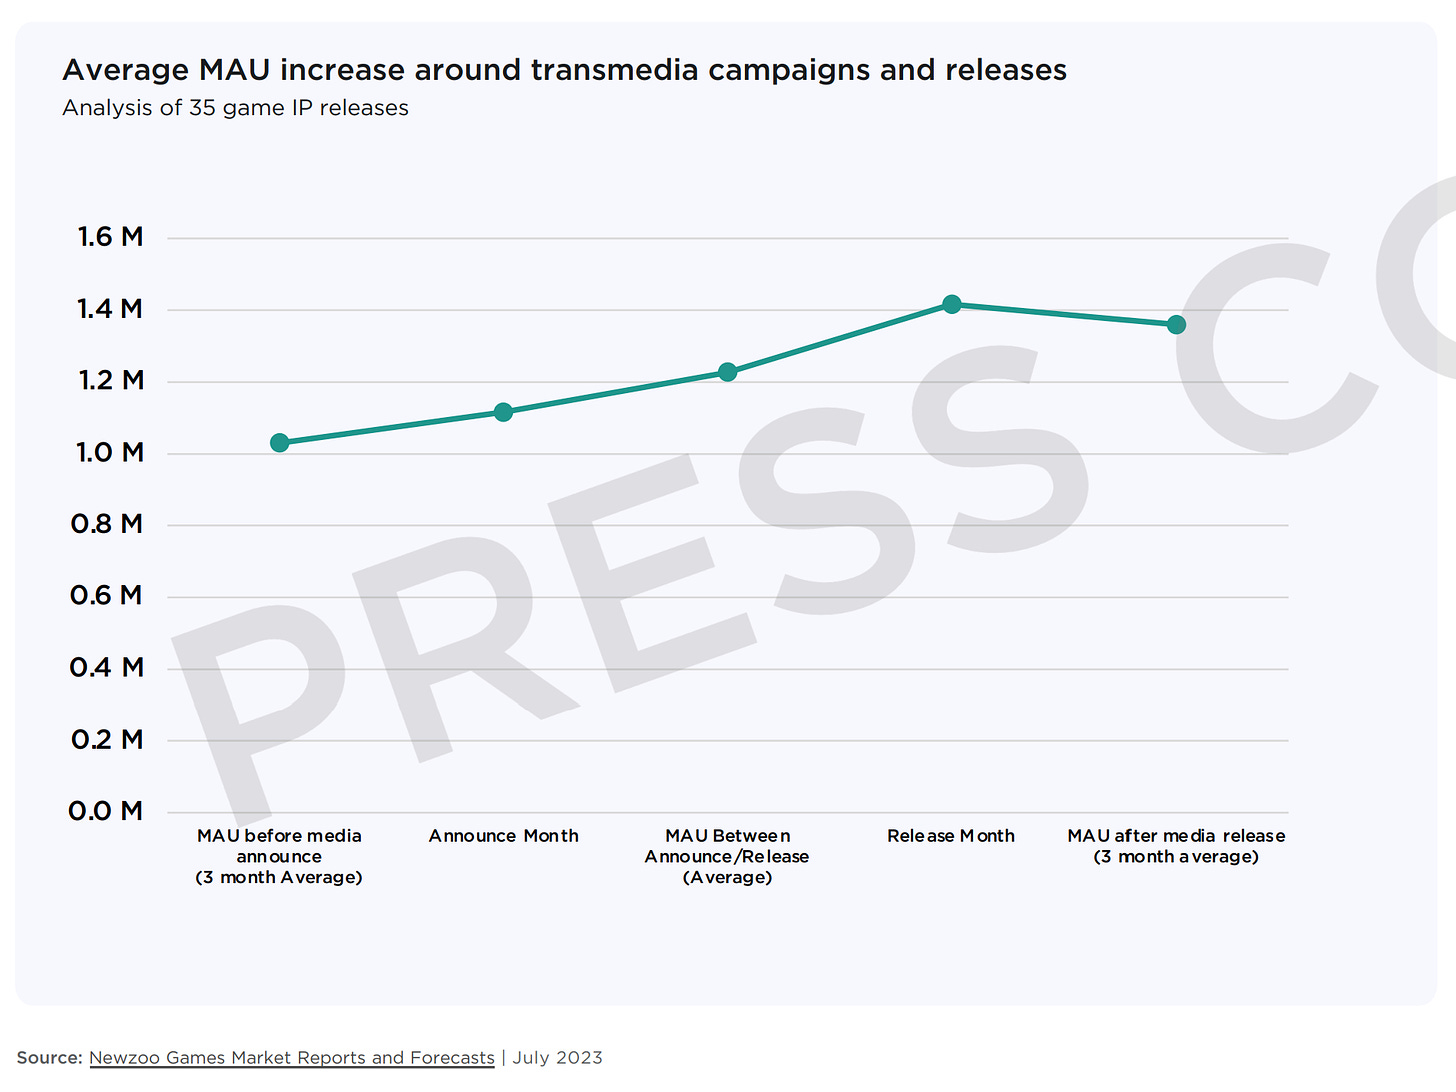
Newzoo analyzed 35 transmedia launches and found a positive impact on games. On average, games see a 35% increase in MAU after releasing content related to the franchise (movies, series, etc.).
-
Launching on mobile devices helps franchises reach new audiences. For example, in Call of Duty Mobile, the percentage of female audience is higher than on PC and consoles. And EA Sports FC Mobile managed to capture a new audience in markets where PC and consoles are not as developed.
Potential Growth Factors
-
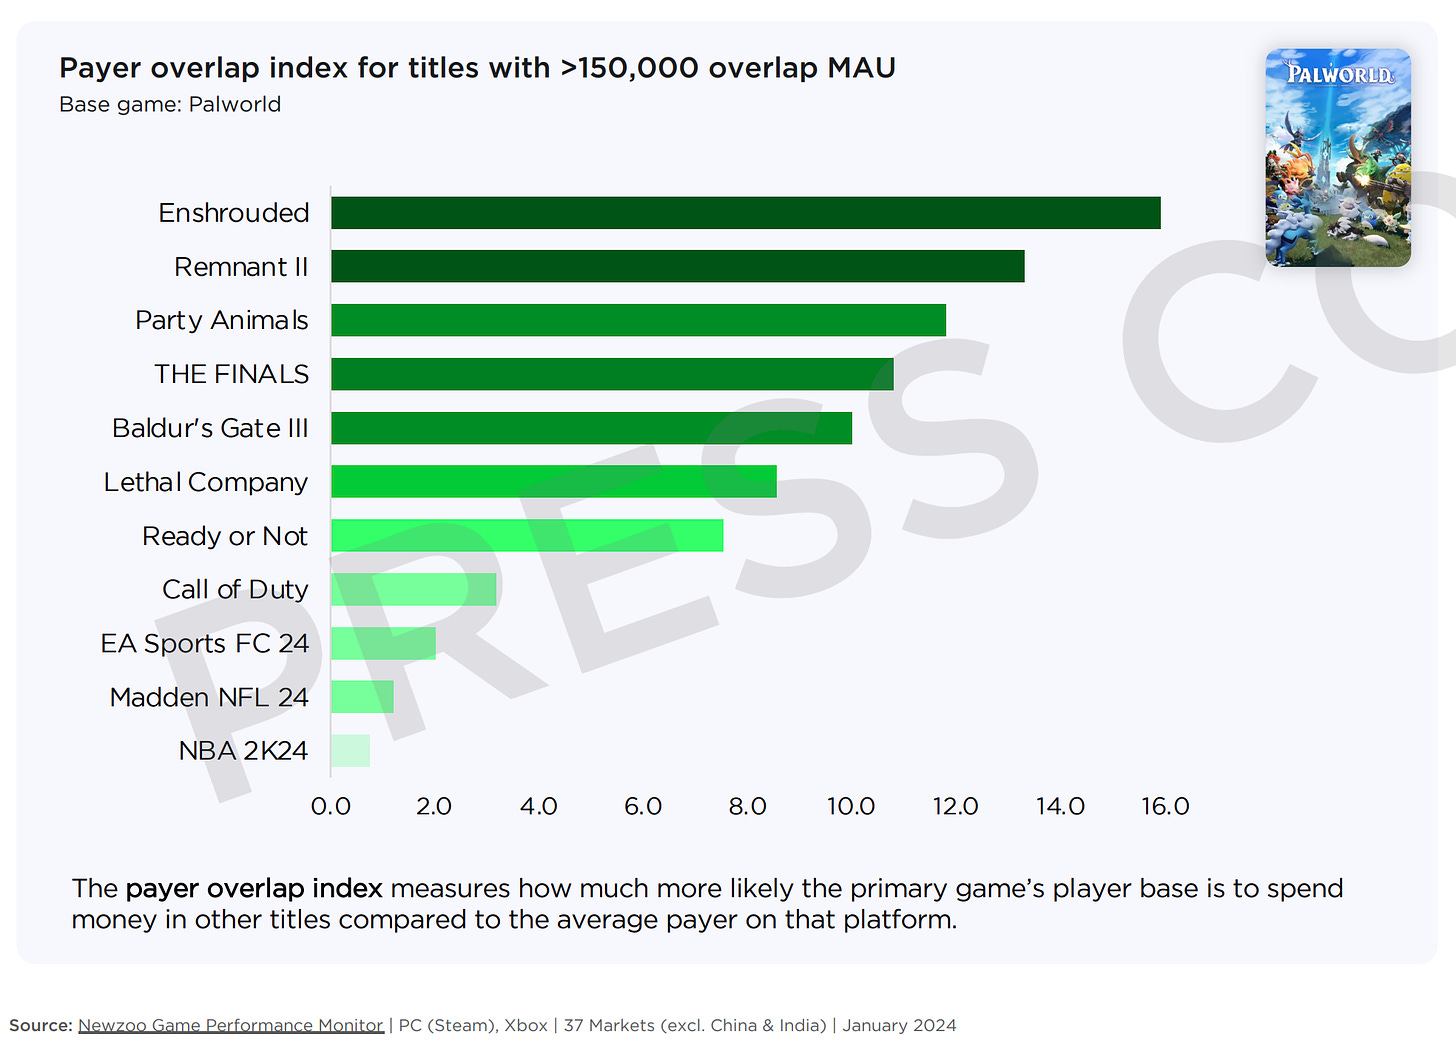
Newzoo analysts note that there is a large category of players transitioning from one multiplayer game to another. The study was conducted based on Palworld; projects with 150,000 or more total MAU were compared. More intersections were found in paying users with Enshrouded, The Remnant II, Party Animals, and The Finals.
-
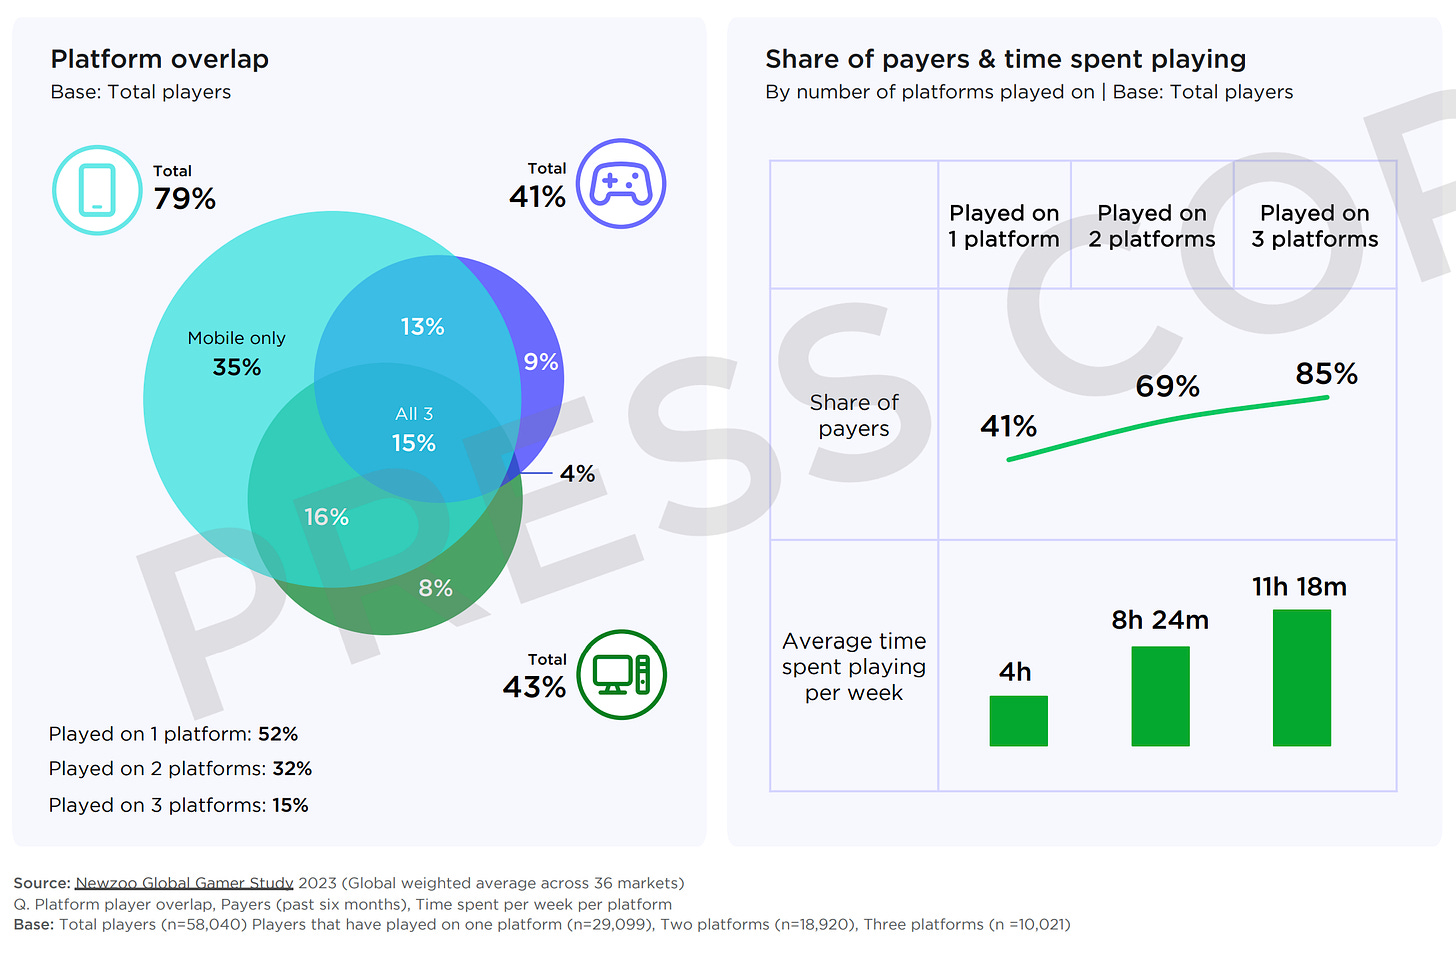
The boundaries between PC, consoles, and mobile devices are blurring. 47% of the audience plays on two systems or more.
-
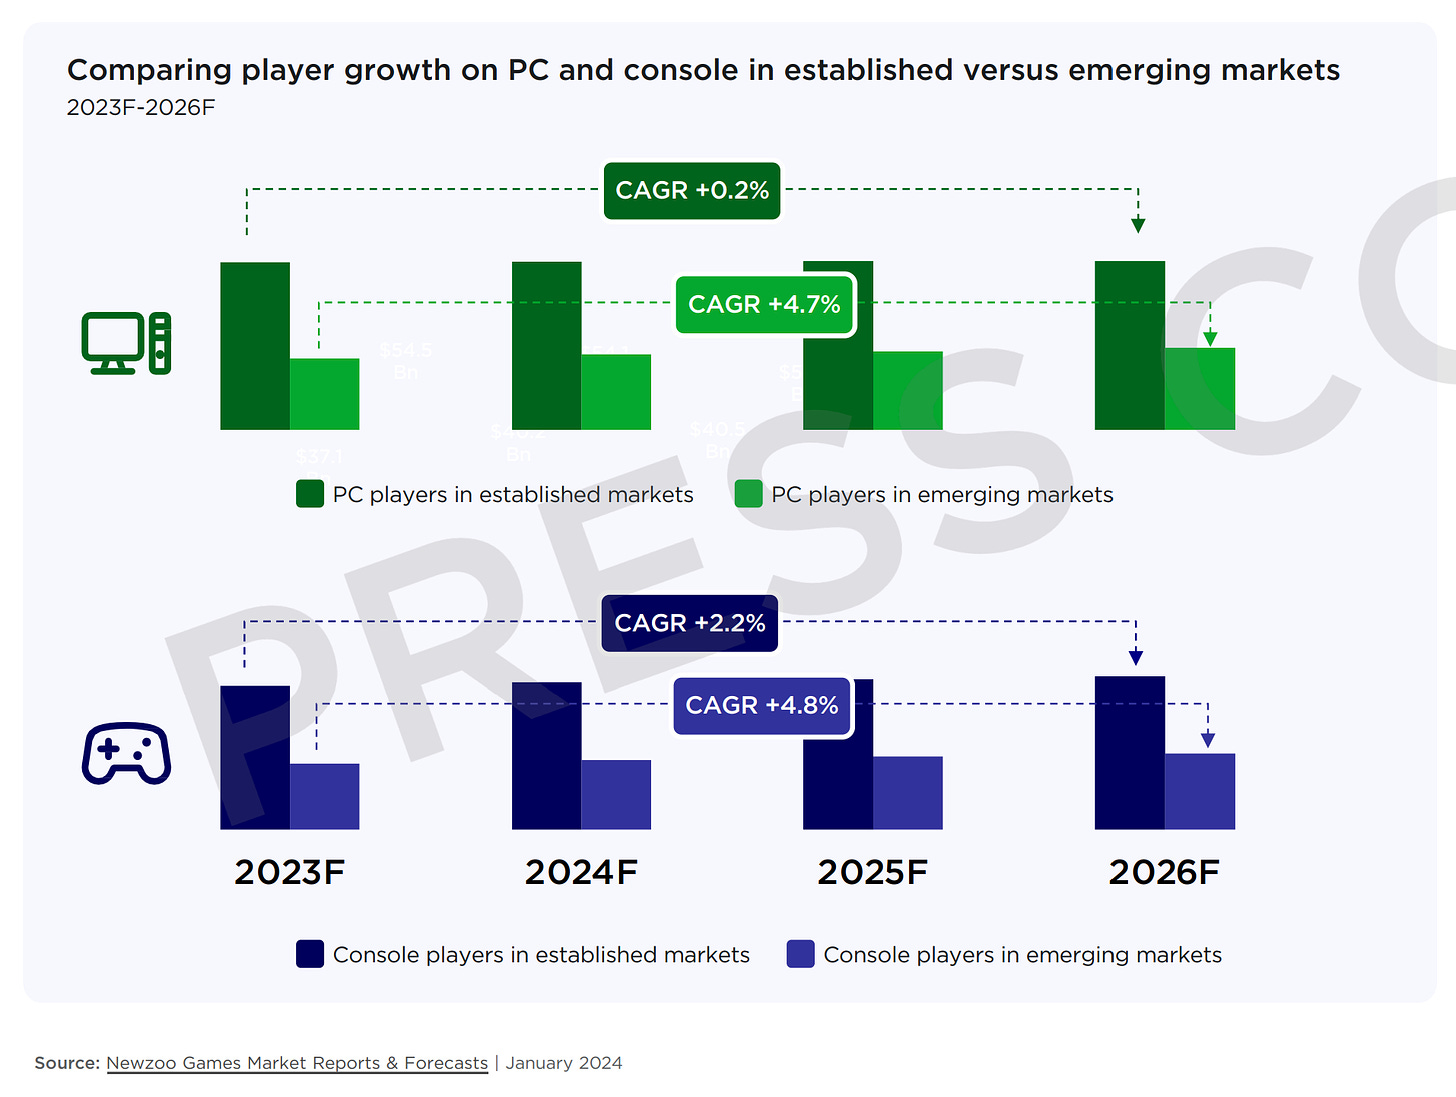
The growth rate of the PC audience in developing markets exceeds the growth rate of the console audience by 23 times. This is likely due to economic reasons.
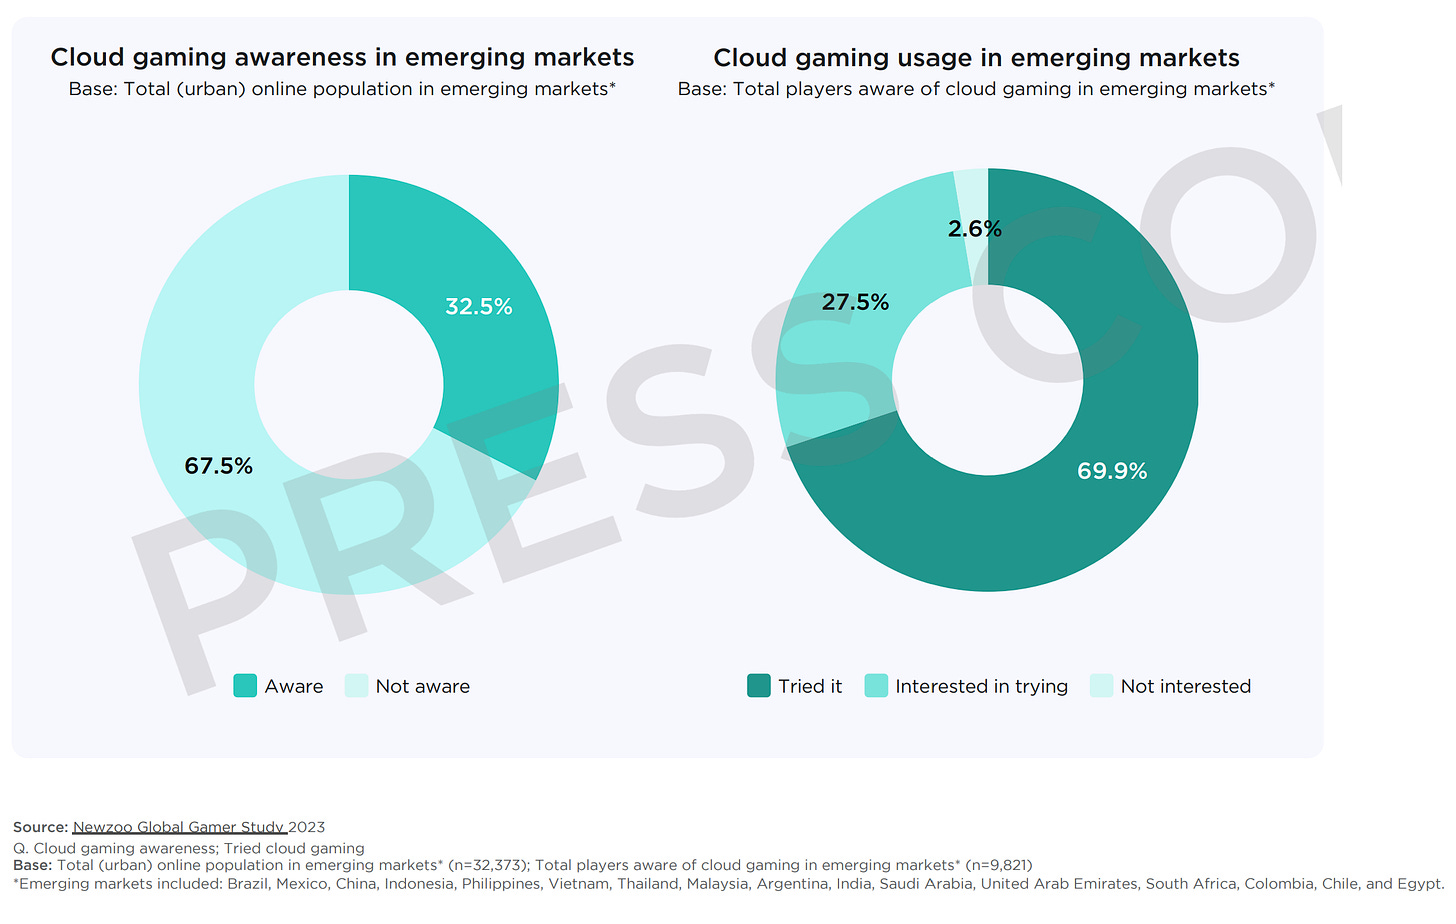
-
Developing markets show more interest in cloud gaming than developed countries. There is interest in Latin America, India, Southeast Asia - markets typically considered mobile-centric.
AppMagic: Top Mobile Games by Revenue and Downloads in March 2024
AppMagic provides revenue data net of store commissions and taxes.
Revenue
-
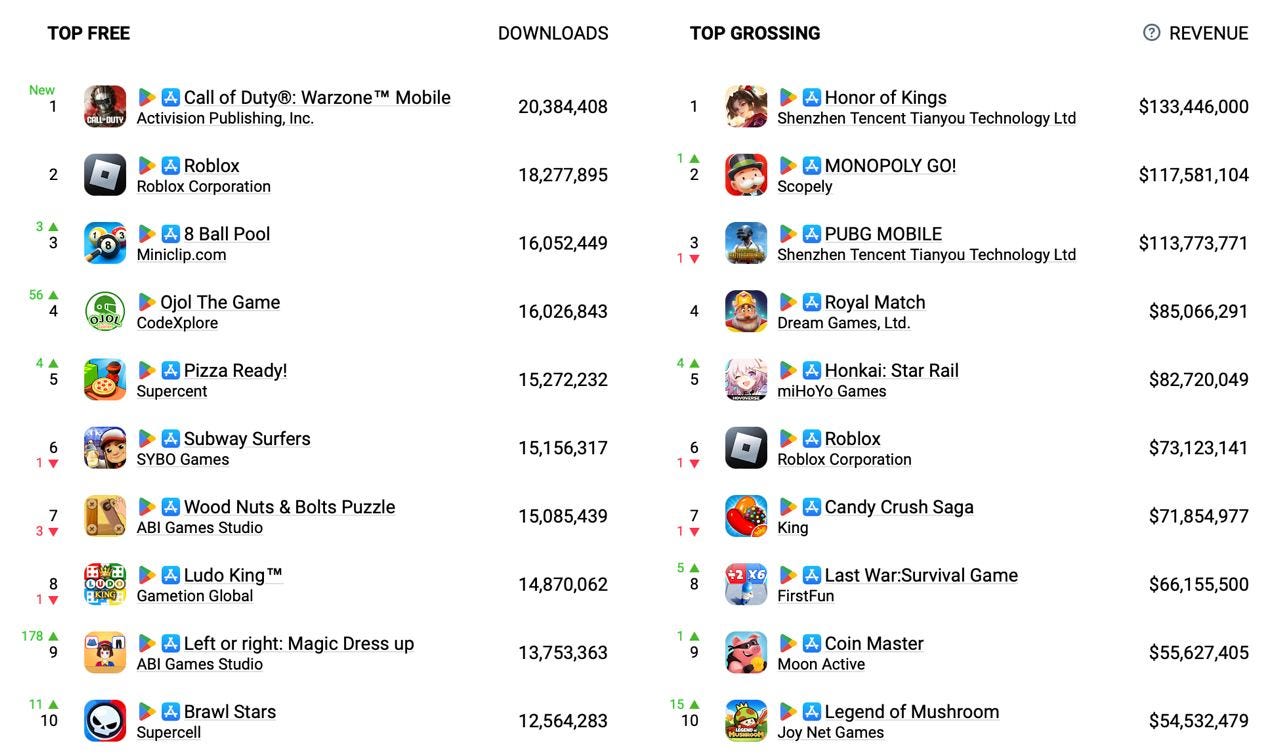
Honor of Kings earned $133.4 million in March.
-
In second place is MONOPOLY GO! with $117.6 million.
-
Significantly increasing its revenue, Honkai: Star Rail rose by 4 positions to claim the 5th spot with $82.7 million. Compared to February, the project grew by more than 50%; compared to January, it had doubled.
-
Last War: Survival Game has entered the top-10 for the first time. The game earned $66.2 million in March. Interestingly, the game's page and creatives mimic a hyper-casual game, although in reality, it is a 4X strategy game. The game was made by the Chinese studio FirstFun, which has no successful games on Google and Apple's accounts. Pitchbook notes that the company has a stake in RiverGame, the developers of Top War.
-
Another newcomer in the top 10 is Legend of Mushroom (ranked 10th). In March, the game earned $54.5 million; it was launched in December 2023. 89% of the revenue comes from Japan and South Korea. The developer is the Chinese Joy Net Games.
❗️This is the first chart in several months where two new games have entered the top 10 by revenue.
Downloads
-
Call of Duty: Warzone Mobile ranked first in downloads in March; the project had 20.4 million installations. However, in terms of revenue, things are much worse - the game earned only $2.1 million in March.
-
In 4th place for downloads is Ojol The Game, which allows players to experience being a courier for the delivery service. The game was downloaded 16 million times, with 89% of downloads from Indonesia.
-
Another newcomer in the download rankings is Left or Right: Magic Dress up from the Vietnamese ABI Games Studio. The game had 13.7 million installations in March.
Sensor Tower: Mobile Games in 2024

Mobile Gaming Market - General Figures
-
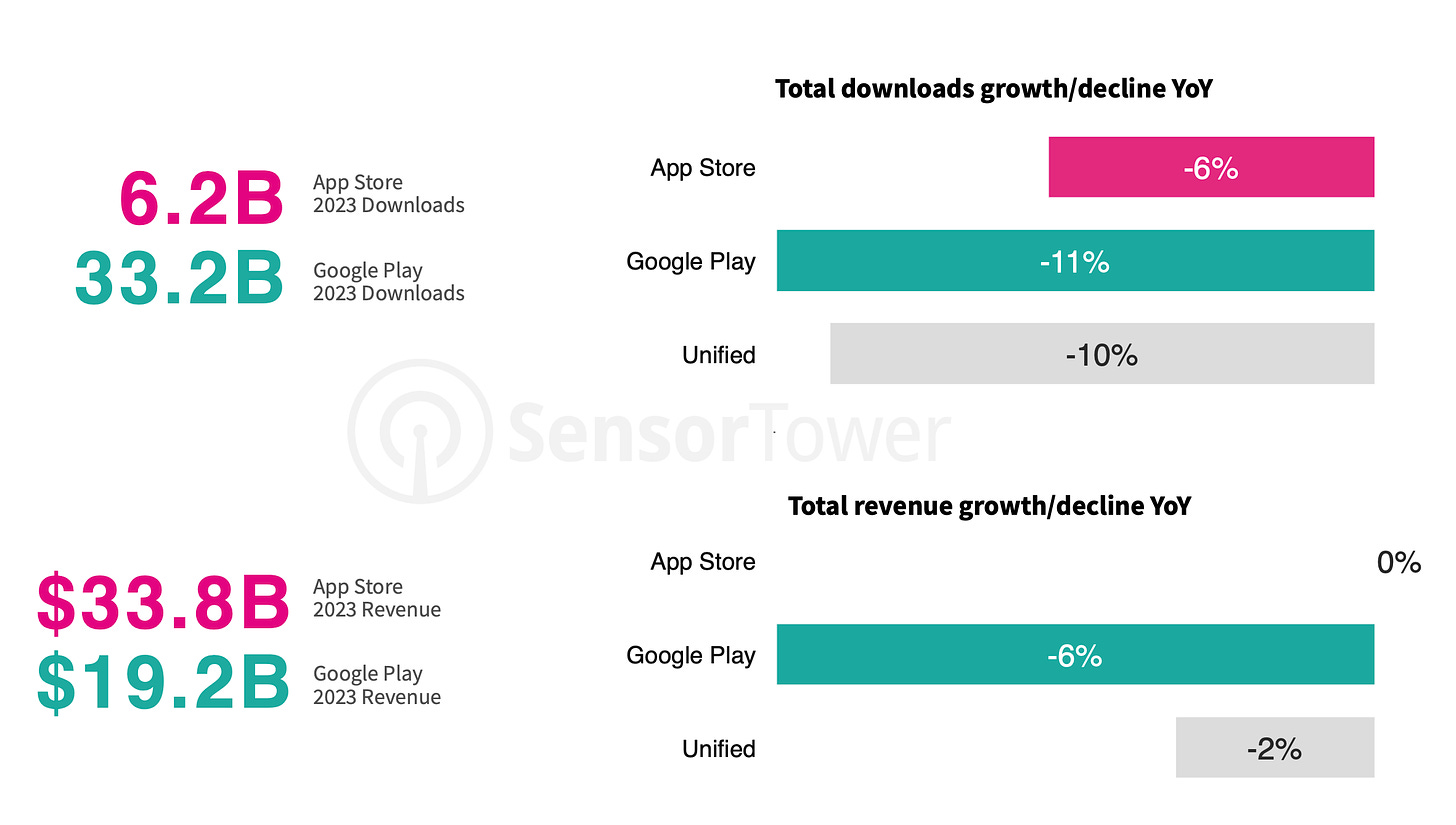
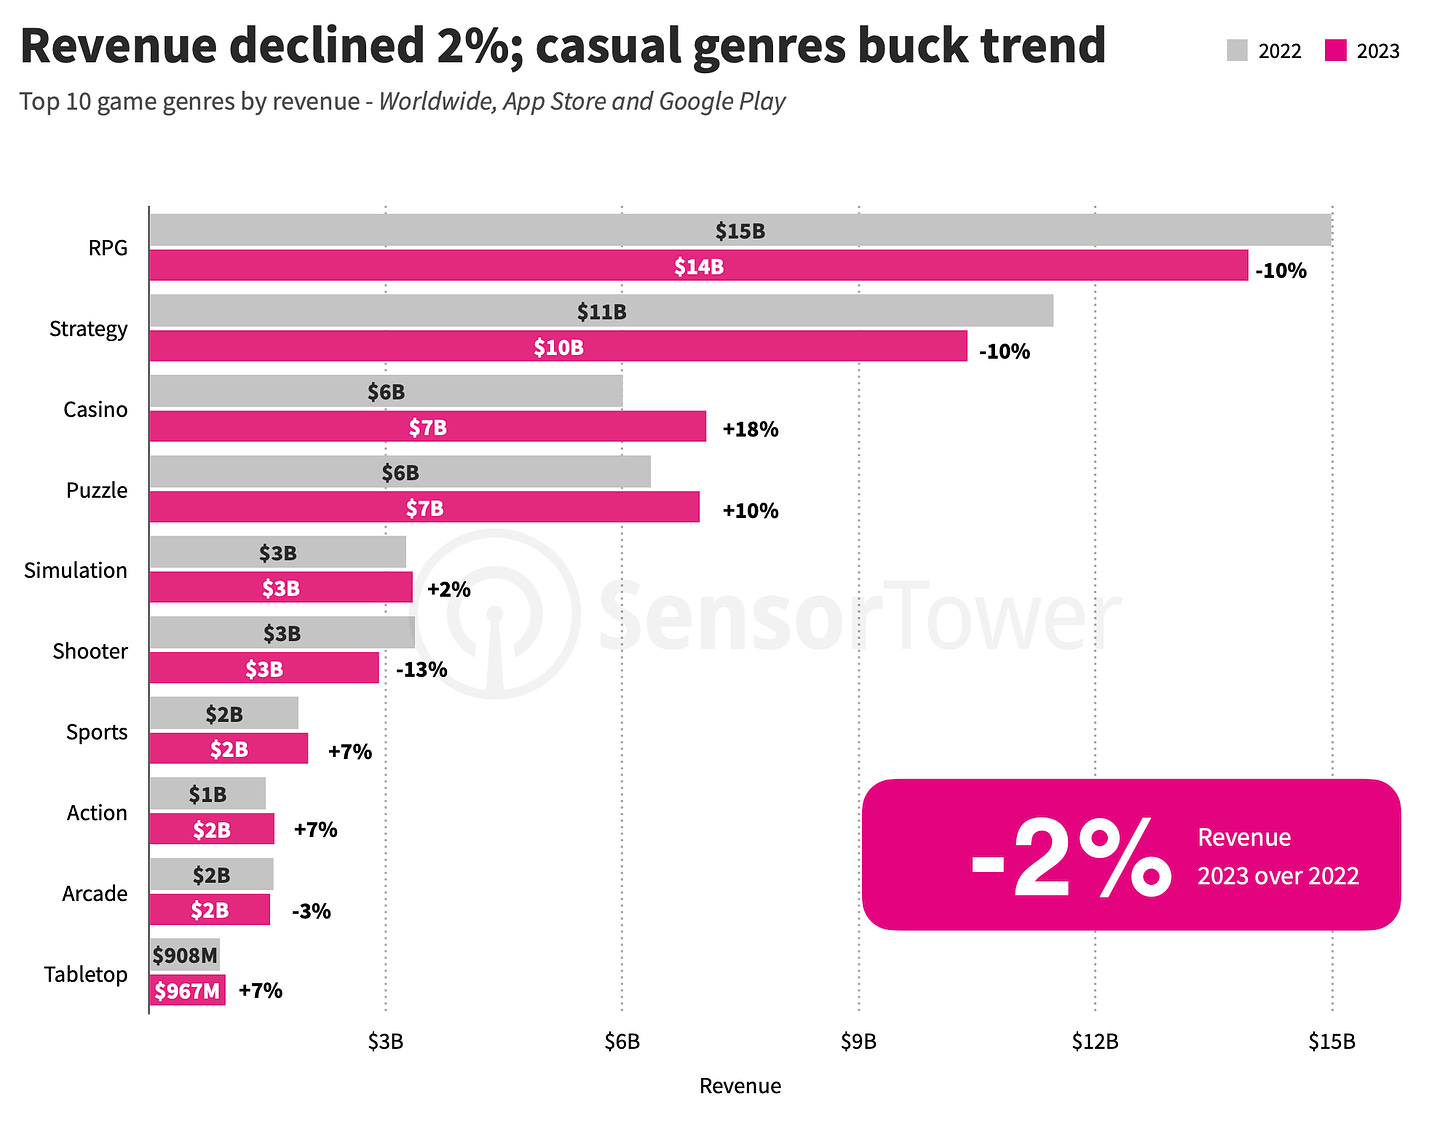
In 2023, the IAP revenue of mobile games on the App Store amounted to $33.8 billion (no change from 2022); revenue on Google Play amounted to $19.2 billion (-6% YoY). Overall, the market revenue declined by 2%.
-
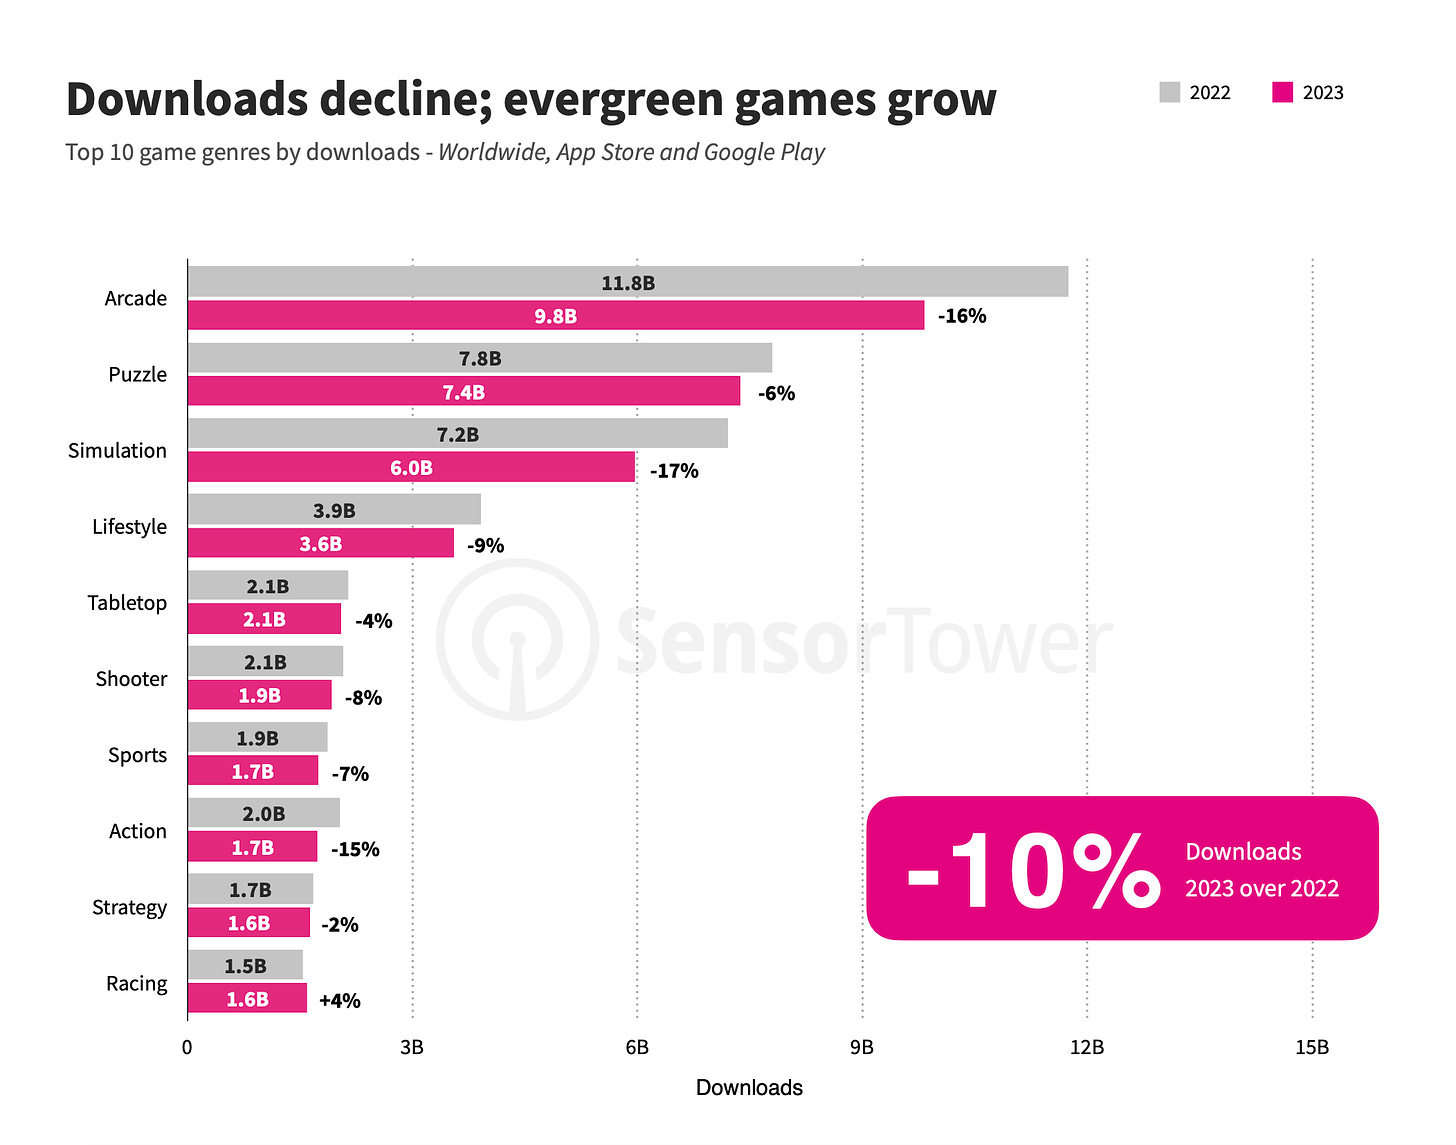
In 2023, 6.2 billion games were downloaded from the App Store (-6% YoY); on Google Play - 33.2 billion (-11% YoY). Overall, the market saw a 10% decline in downloads in 2023.
Details on Downloads and Revenue
-
In terms of downloads in 2023, only the racing genre saw growth (+4% YoY). The genres that experienced the least decline were strategy (-2% YoY), board games (-4% YoY), and puzzles (-6% YoY). The most significant declines were seen in Simulation games (-17% YoY), arcade games (-16% YoY), and action games (-15% YoY).
-
The hybrid casual segment saw the smallest decline in downloads at 2%. Hyper-casual games saw the most significant decline at 14%. Sensor Tower notes that downloads have returned to pre-pandemic levels.
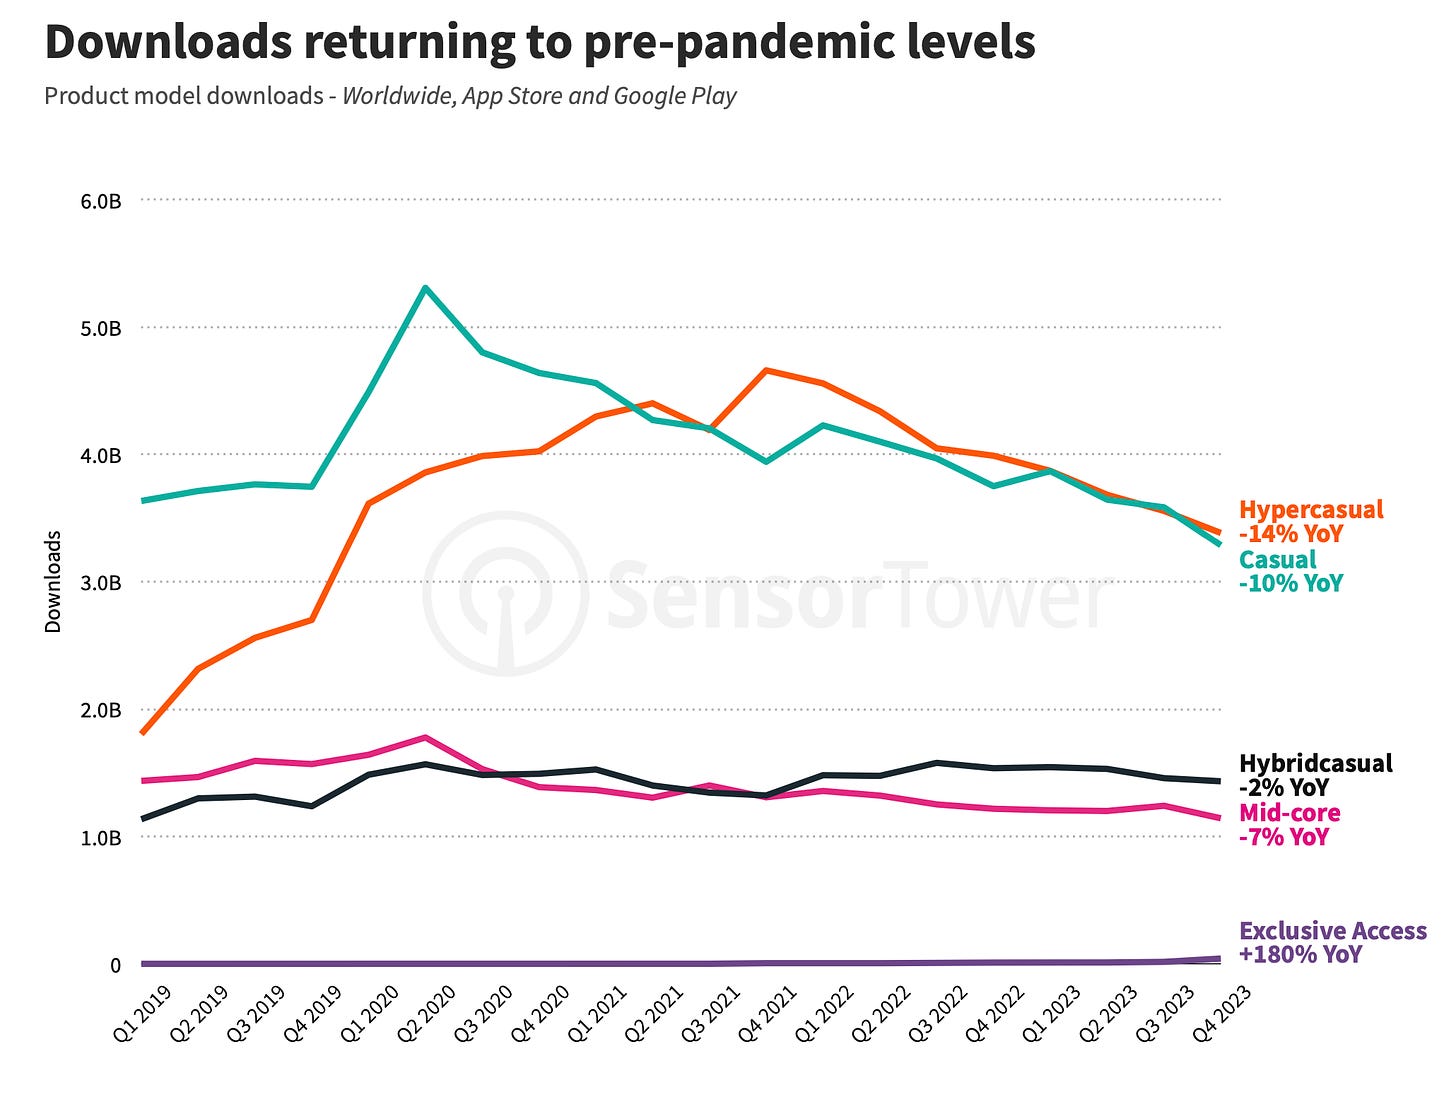
❗️For casual and mid-core projects, downloads fell below 2019 levels.
-
The revenue situation in 2023 was slightly better. Casino games saw growth (+18% YoY - due to Monopoly GO!); puzzles (+10% YoY); sports games, action games, and board projects (all up 7% annually) grew too. The leaders of decline were shooters (-13% YoY); RPGs and strategies (-10% YoY).
- The hybrid casual segment saw a 30% revenue increase in 2023; casual games saw an 8% increase. However, revenue from mid-core games dropped by 9%.
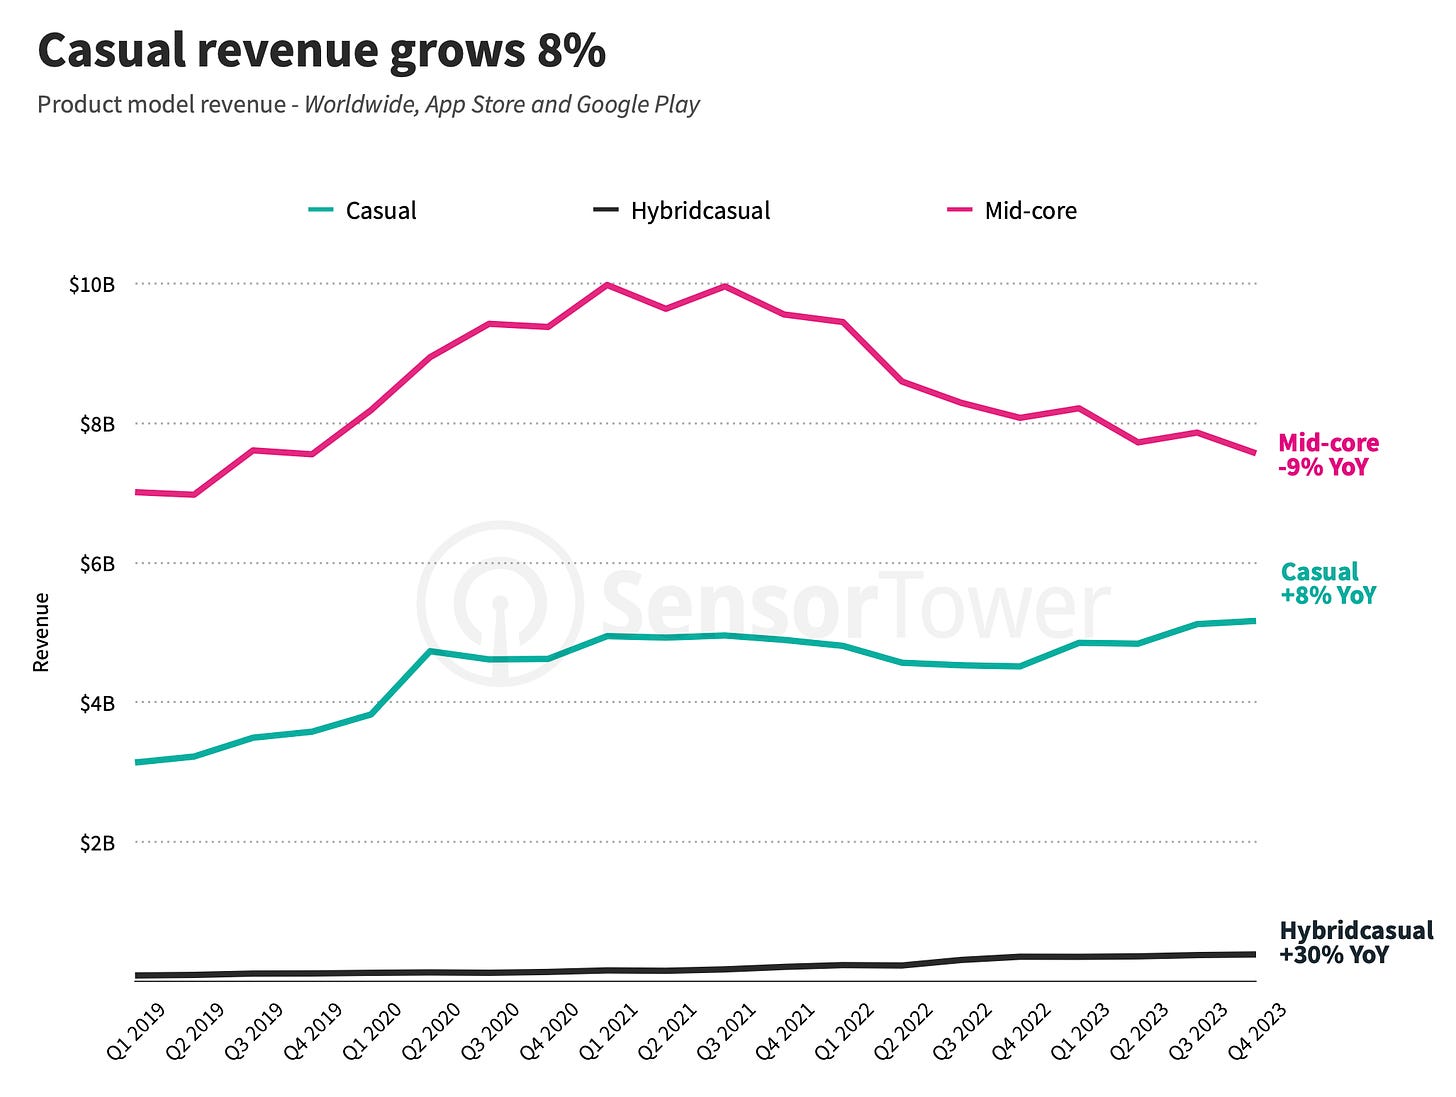
❗️I think that two factors contributed to the decline in revenue from mid-core games on mobile devices. The first is related to the large number of major releases on PC and consoles in 2023. Some of this segment audience plays on multiple platforms; time and money are limited, which leads to underspend on mobile. The second factor is the flow of money from mobile stores to payments outside the platforms. Sensor Tower simply does not see these figures. The impact of the second factor on revenue is greater.
-
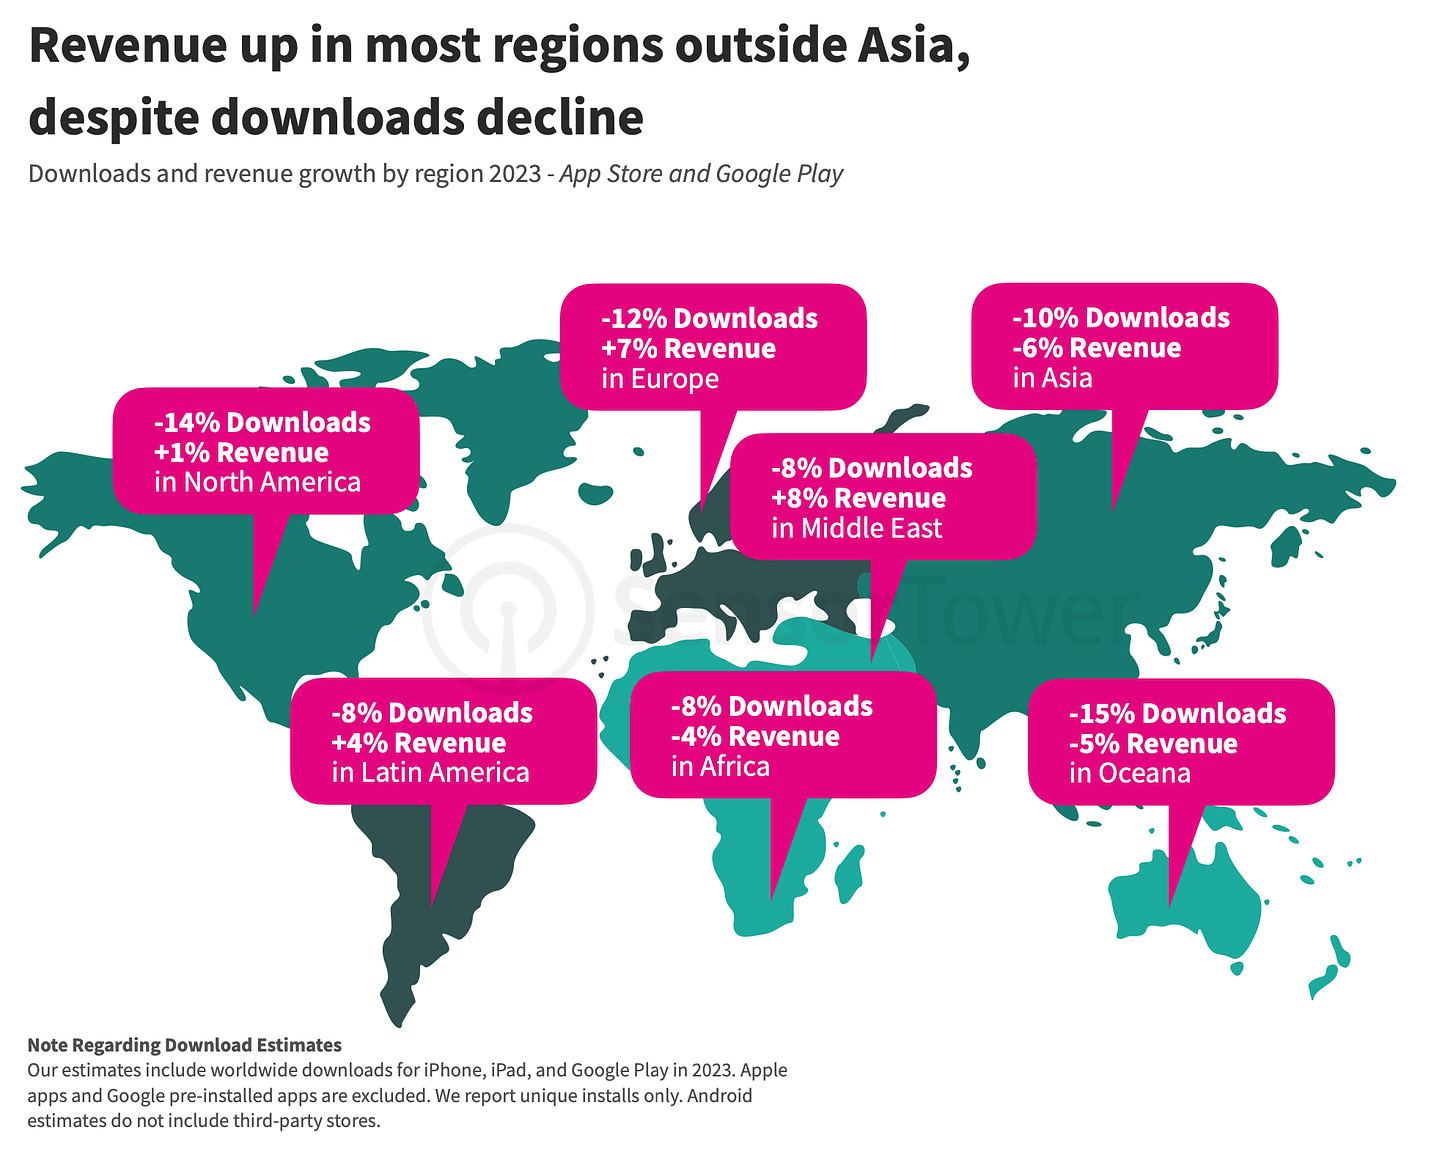
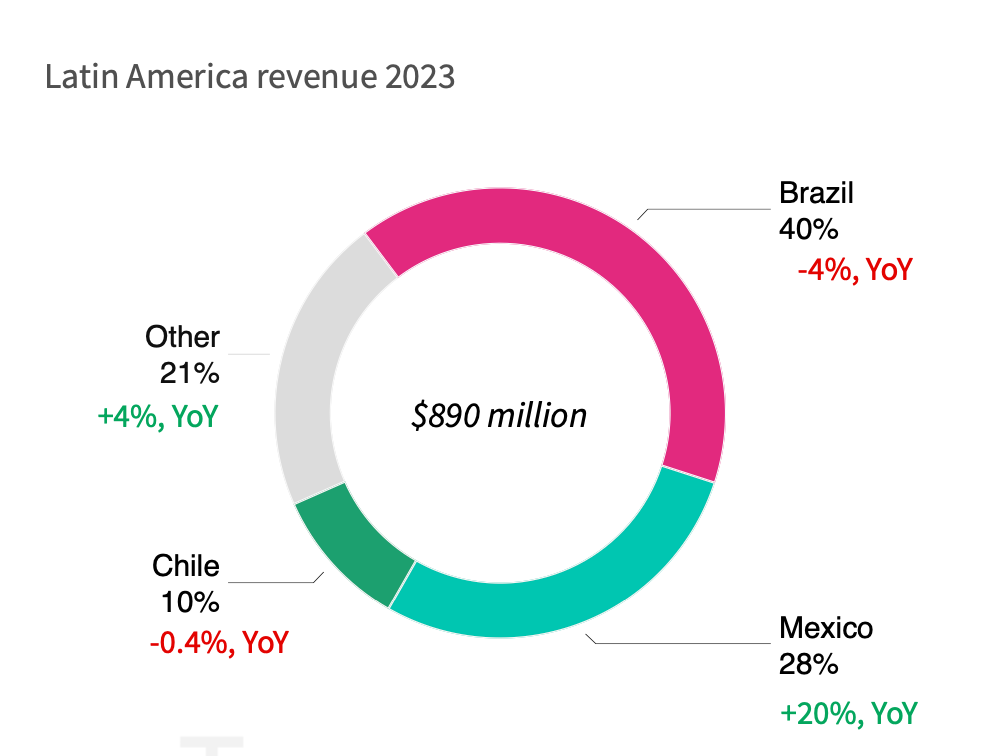
Revenue from mobile games increased in the Middle East region (+8%); in Europe (+7%); in Latin America (+4%); and in the USA (+1%) despite declining downloads. However, revenue fell by 6% in Asia; 5% in Oceania; and 4% in Africa.
-
In 2023, the main markets in Latin America were Brazil (40% of the volume; -4% YoY); Mexico (28%; +20% YoY); and Chile (10%; -0.4% YoY).
-
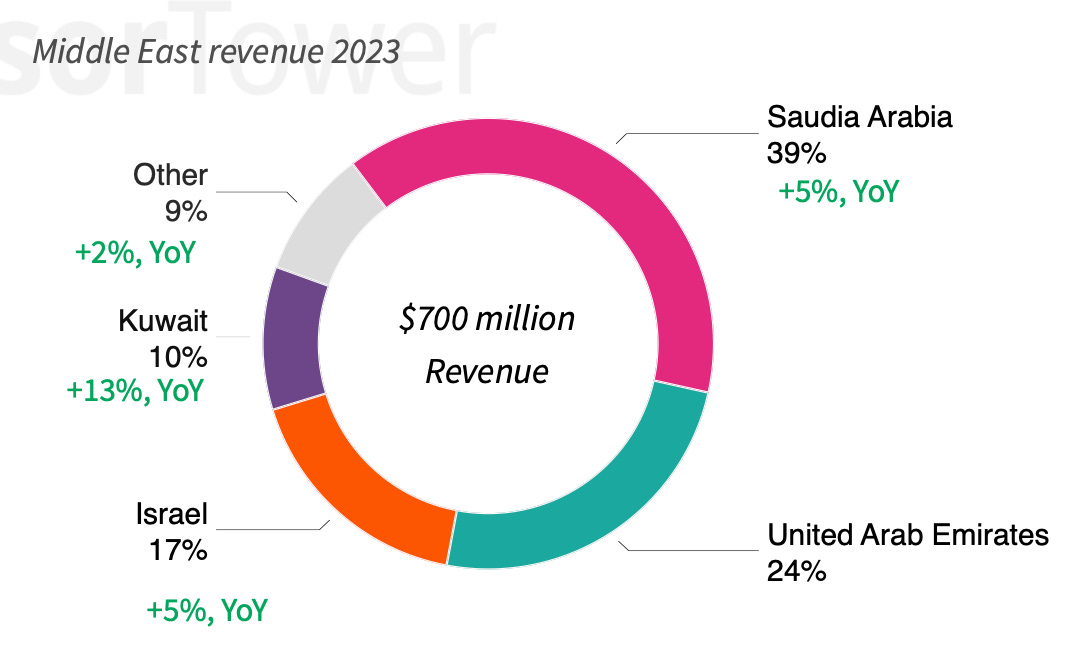
In the Middle East, the main markets were Saudi Arabia (39% of the total volume; +5% YoY); UAE (24%; revenue unchanged in 2023); Israel (17%; +5% YoY); Kuwait (10%; +13% YoY).
-
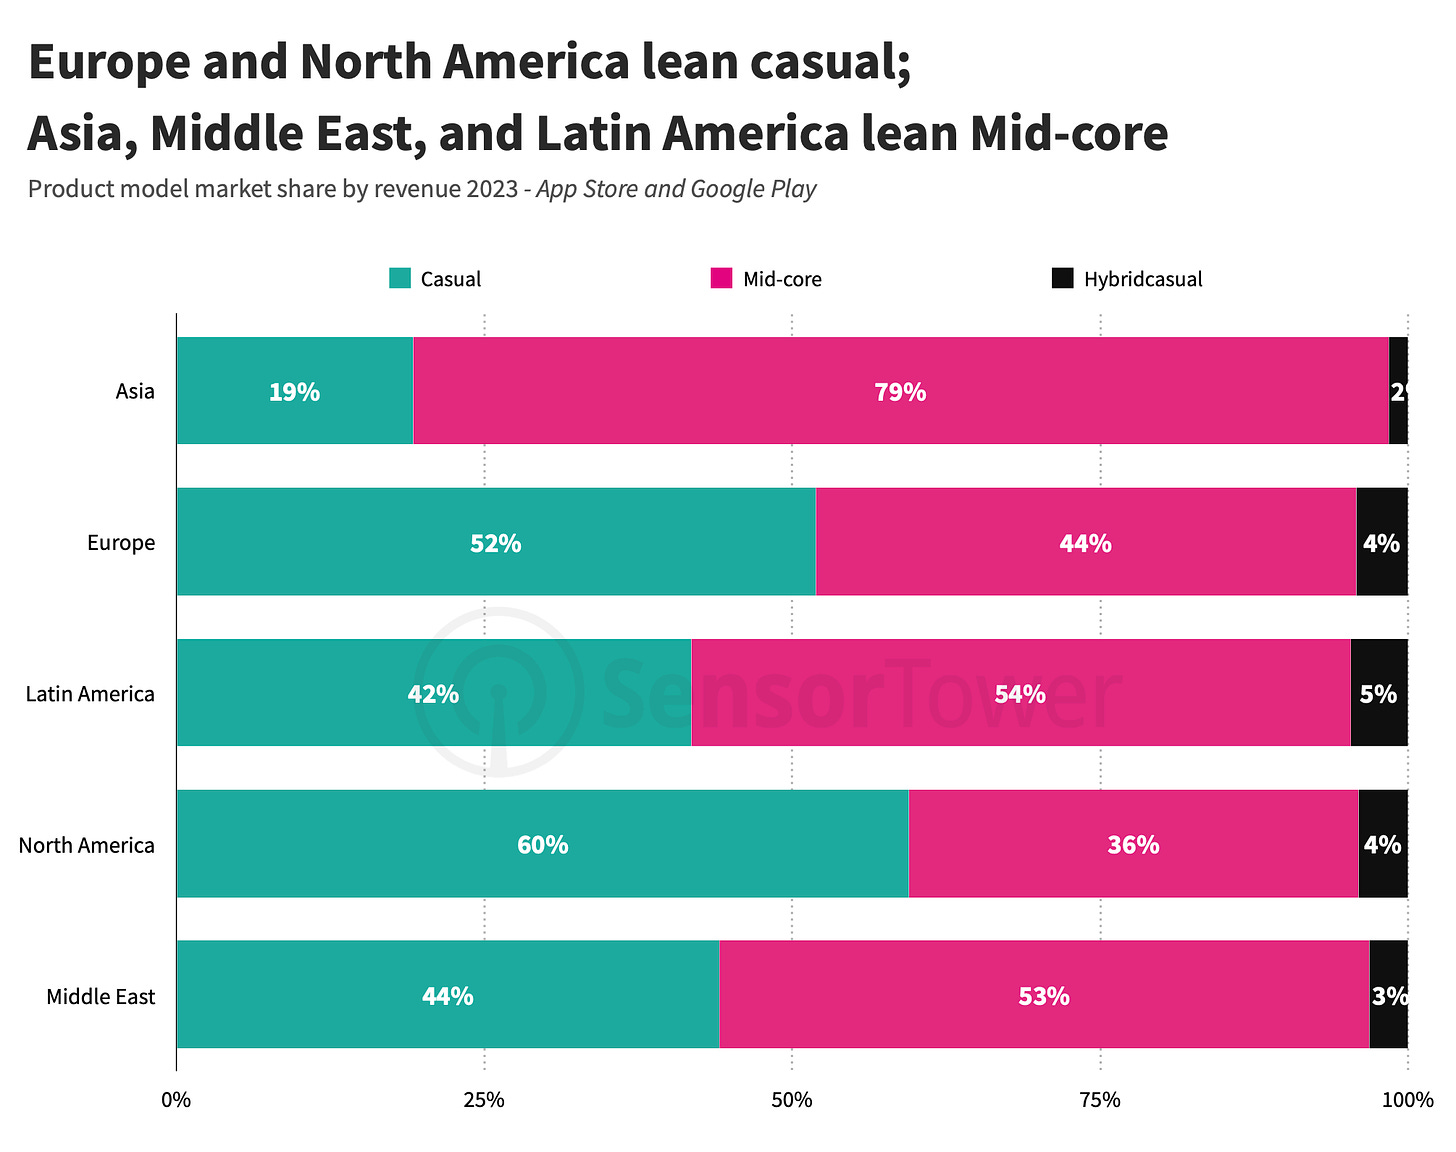
In North America (60%) and Europe (52%), casual games dominate revenue volume. In Latin America (54%); the Middle East (53%); and Asia (79%), mid-core projects account for the majority of revenue.
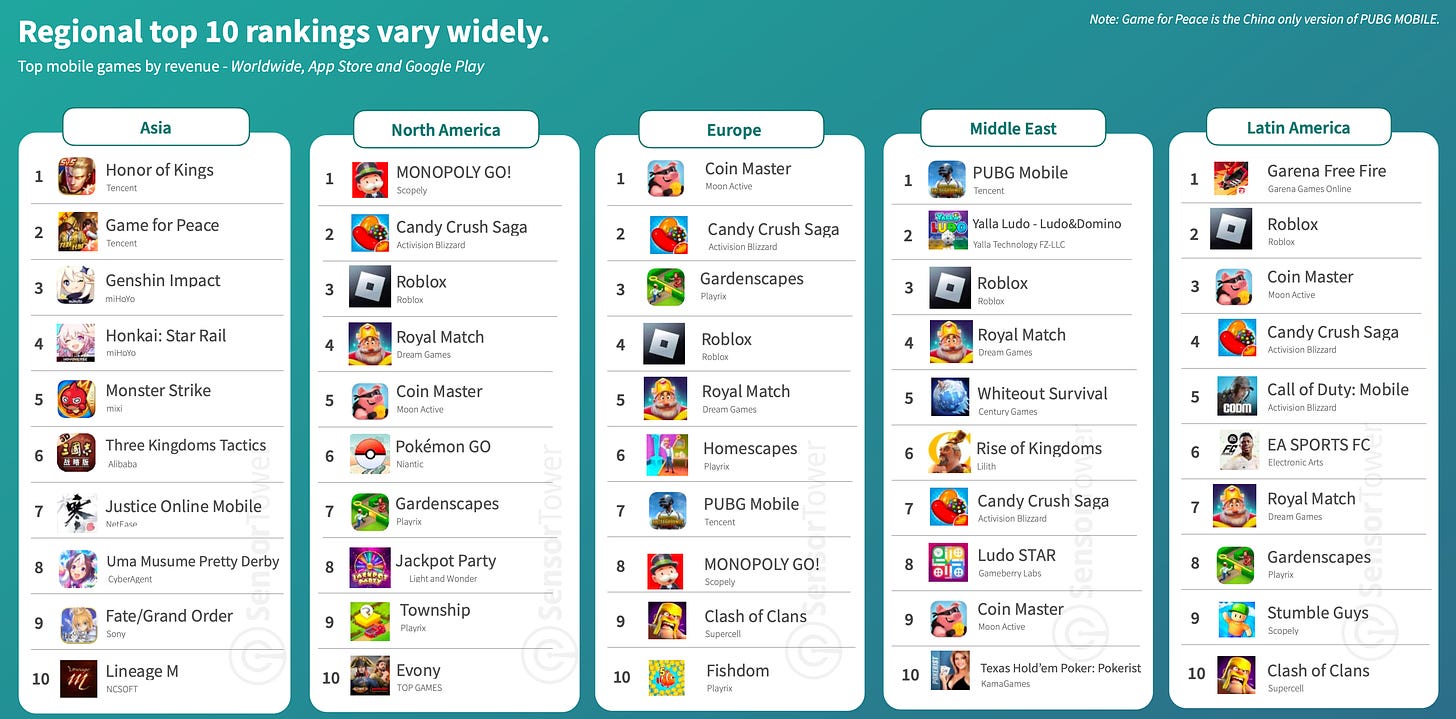
- Regional revenue tops differ significantly from each other. Honor of Kings was the top game in Asia; MONOPOLY GO! in the USA; Coin Master in Europe; PUBG Mobile in the Middle East; and Garena Free Fire in Latin America.
-
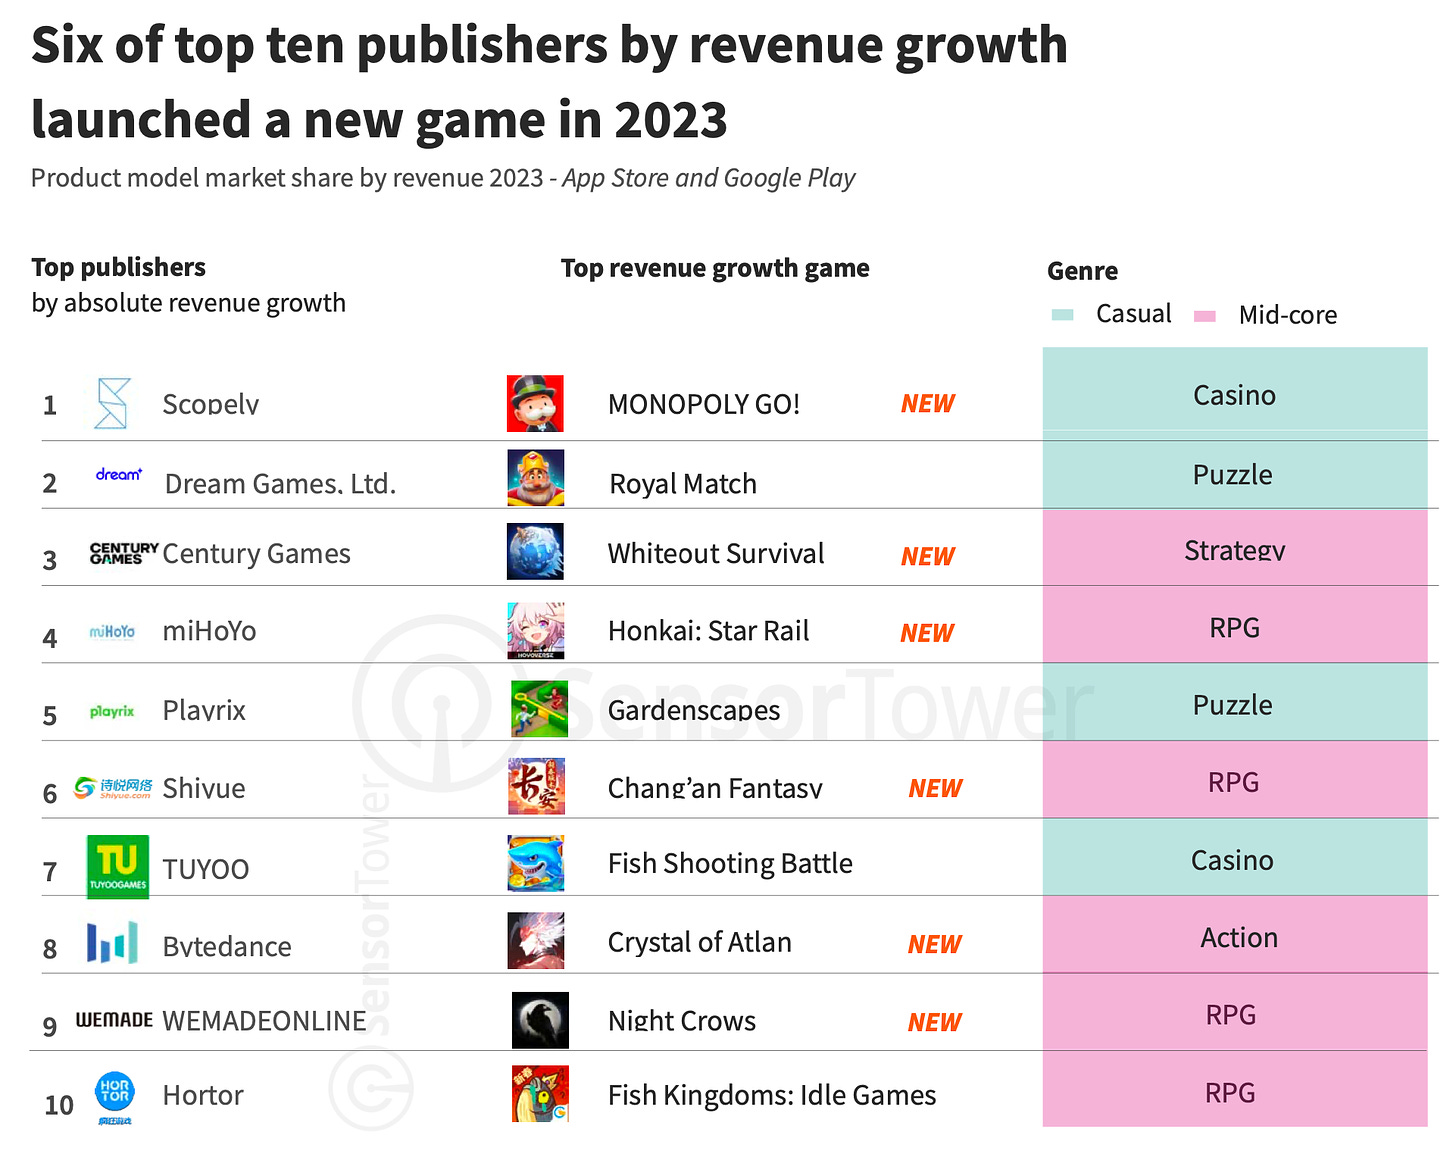
6 out of the top 10 publishers of 2023 in terms of revenue growth launched new projects. These are Scopely (MONOPOLY GO!); Century Games (Whiteout Survival); miHoYo (Honkai: Star Rail); Shivue (Chang’an Fantasy); Bytedance (Crystal of Atlan); WEMADE (Night Crows).
The most notable games of 2023
-
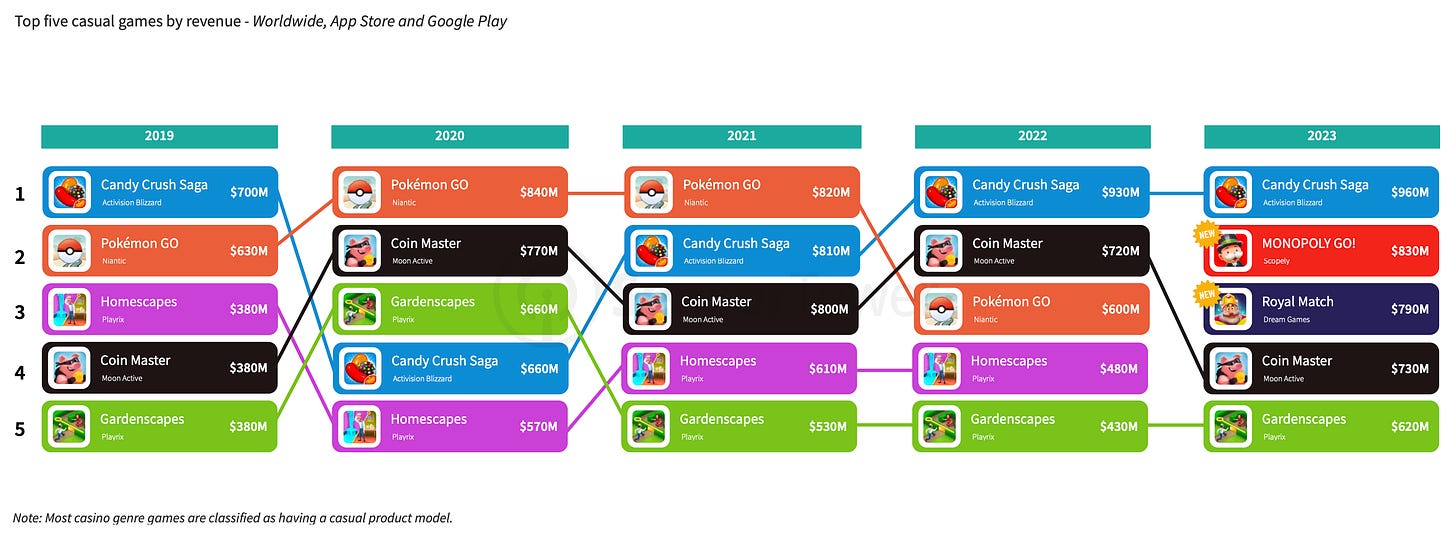
Candy Crush Saga ($960 million); MONOPOLY GO! ($830 million); Royal Match ($790 million); Coin Master ($730 million); Gardenscapes ($620 million) - the highest-earning casual games of 2023. Two new games appeared on the chart this year.
-
Honor of Kings ($1.9 billion); Genshin Impact ($950 million); Roblox ($880 million); Game for Peace ($800 million); and Honkai: Star Rail ($670 million) - the most notable mid-core games in terms of revenue in 2023.
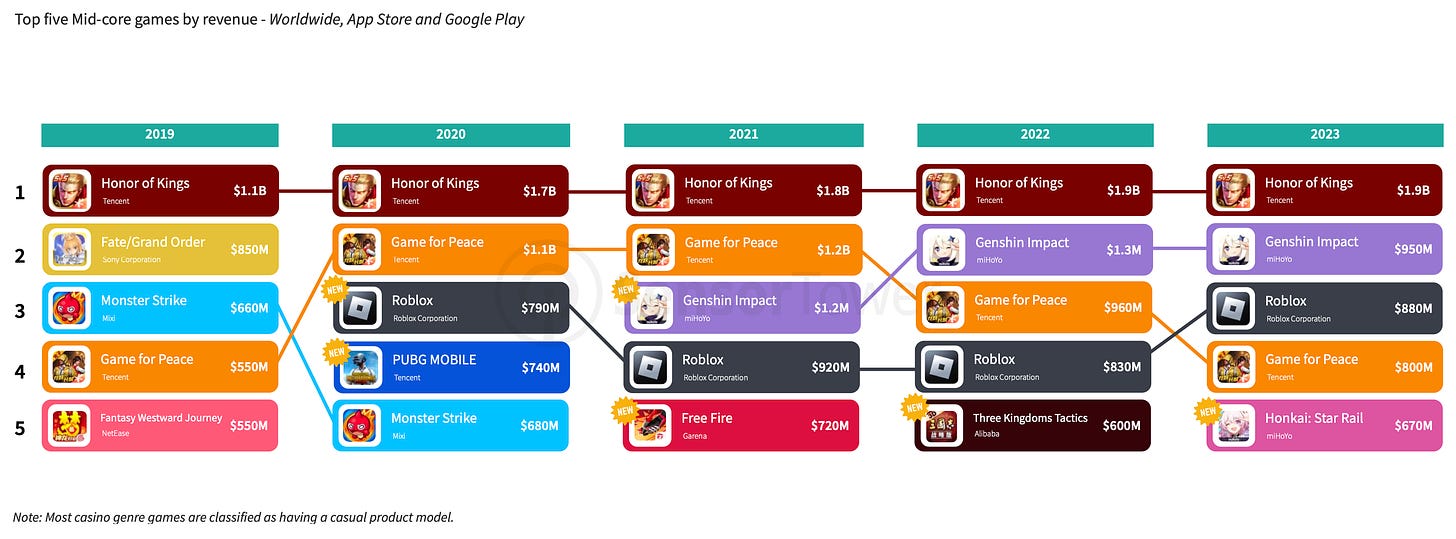
❗️Not sure that Roblox should be classified as mid-core games.
-
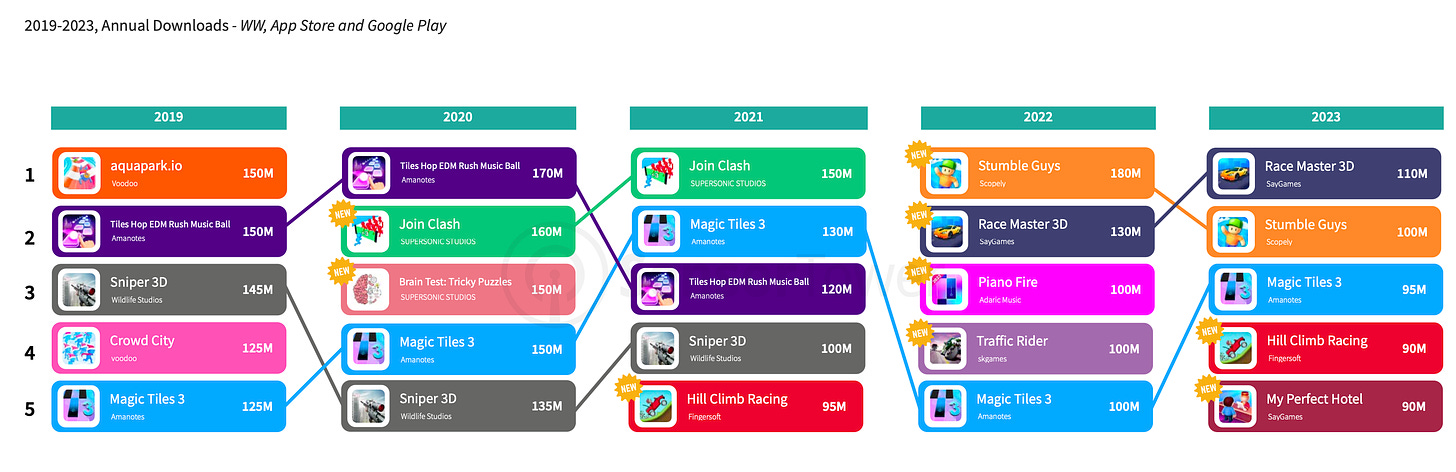
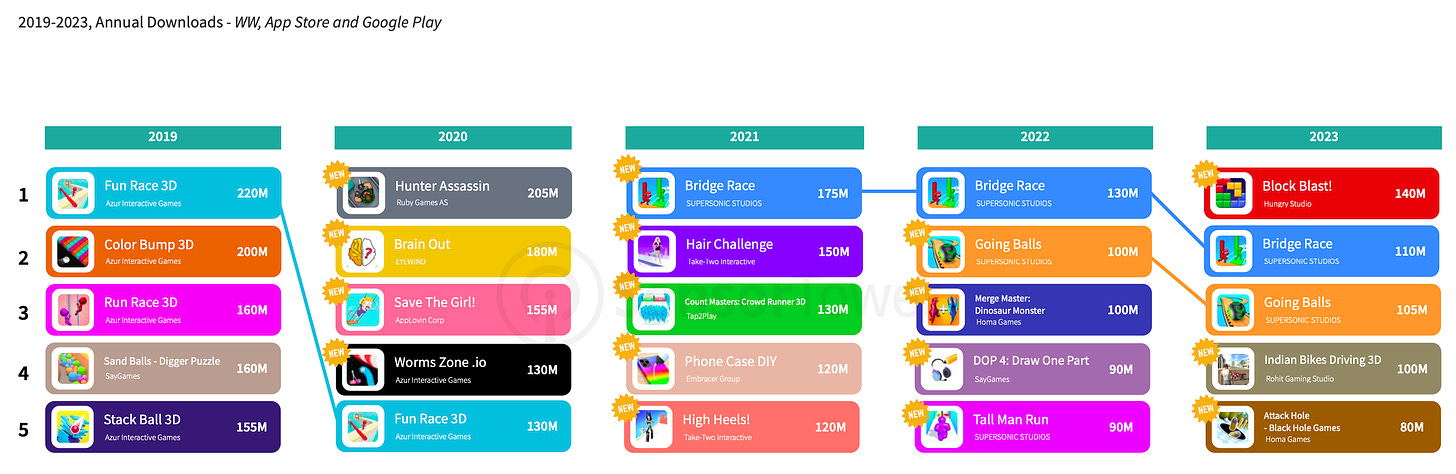
The leaders of the hybrid casual direction in 2023 were Race Master 3D (110 million downloads); Stumble Guys (100 million); Magic Tiles 3 (95 million); Hill Climb Racing (90 million); and My Perfect Hotel (90 million). Two new projects made it into the top 5.
-
The main hyper-casual project of the year was Block Blast! (140 million downloads); Bridge Race (110 million); Going Balls (105 million); Indian Bikes Driving 3D (100 million); and Attack Hole - Black Hole Games (80 million). Three new projects entered the chart.
-
Marketing Trends
-
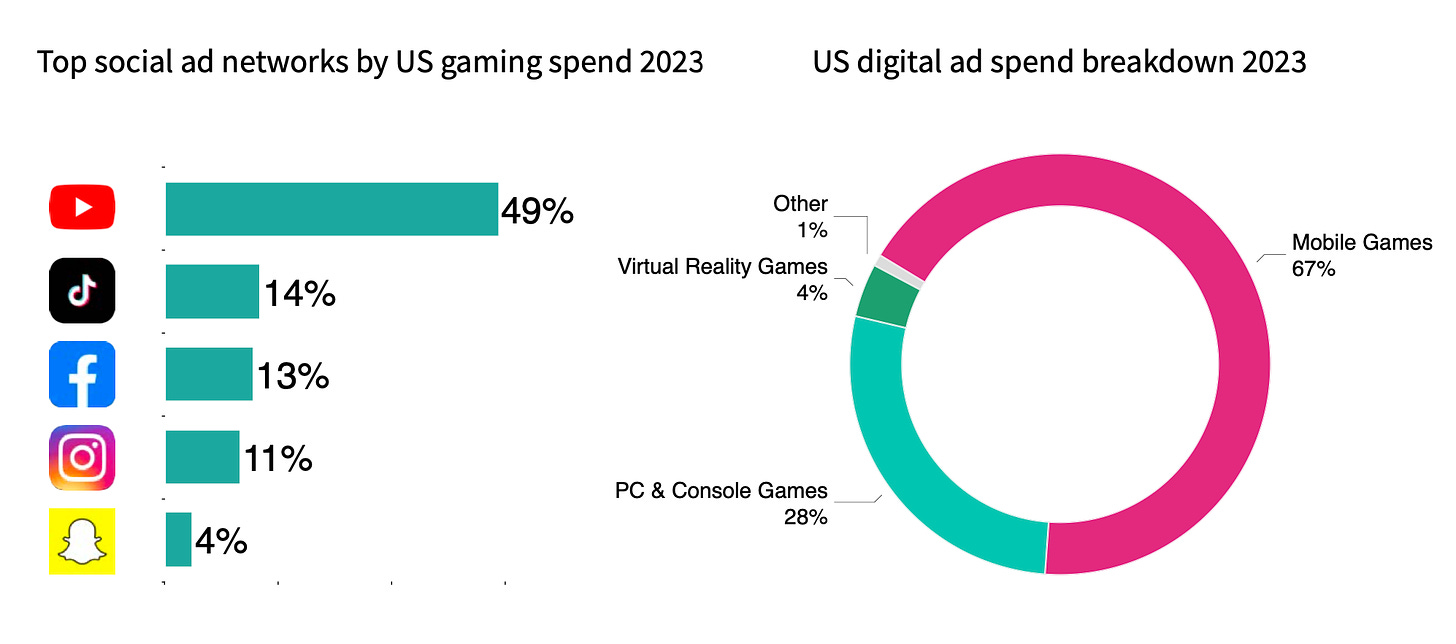
67% of digital advertising spending in the USA was allocated to mobile games. 28% went to PC and consoles. 4% was spent on VR projects. 1% went to other titles.
-
YouTube (49%), TikTok (14%), Facebook (13%), Instagram (11%), Snapchat (4%) were the main advertising channels in the USA in 2023.
-
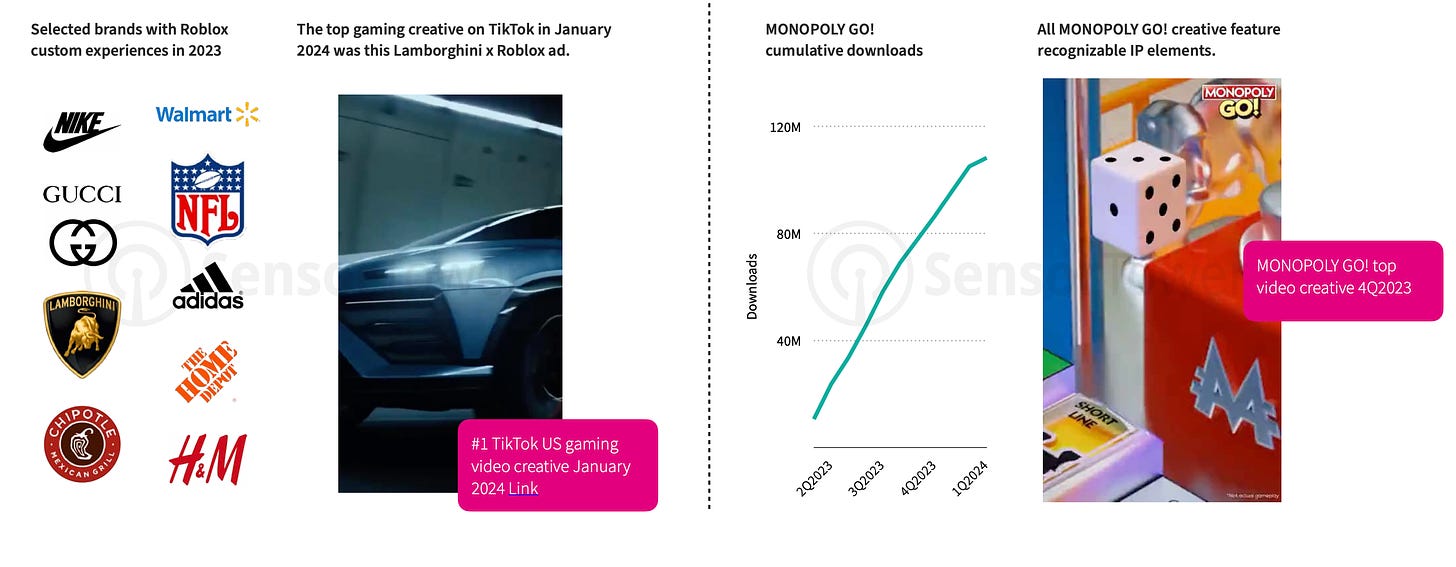
Sensor Tower notes that some of the most successful creatives utilize recognizable IPs (Roblox - Lamborghini; MONOPOLY GO! - Monopoly). Influencers and user-generated content (UGC) creatives are also popular.
-
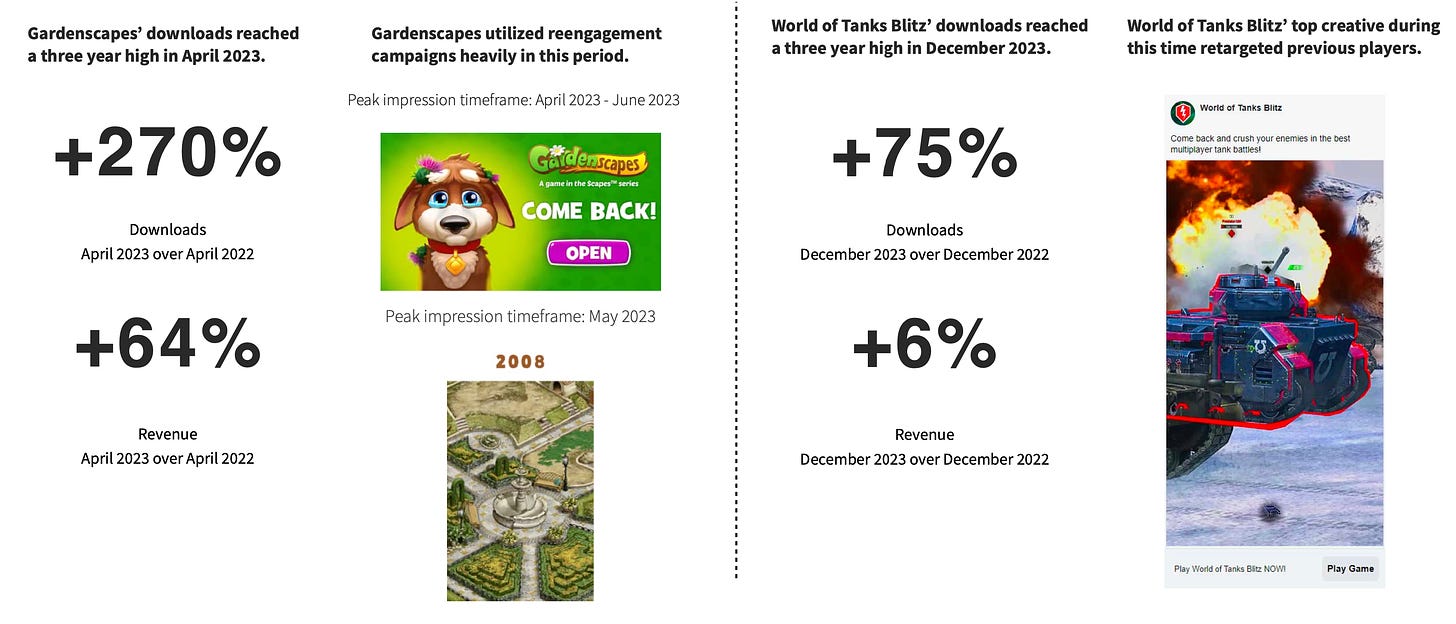
Retargeting campaigns were actively used by developers (Playrix, Wargaming) in 2023. In Gardenscapes, downloads in April increased by 270% YoY; revenue increased by 64%. In WoT Blitz, downloads in December 2023 increased by 75%; revenue increased by 6%.
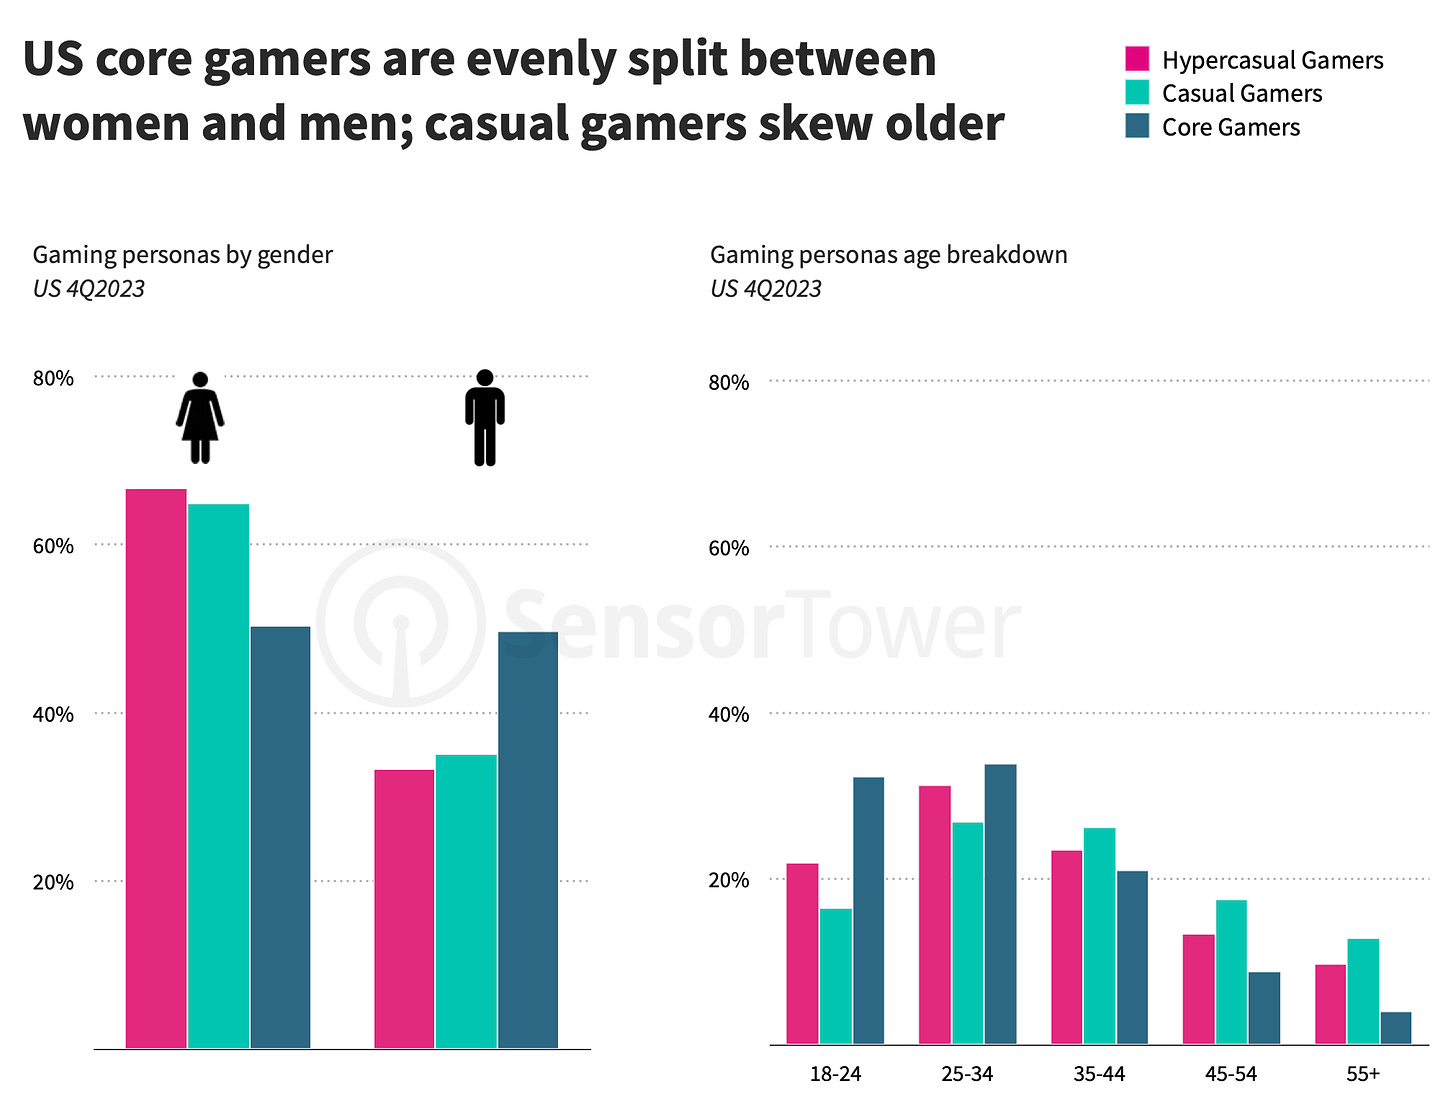
- In the USA, the majority of casual and hyper-casual gamers are women (about 60%). In mid-core projects, the split is 50/50. The main audience for mobile games is aged between 25 and 34; younger people play mid-core projects, while older individuals play casual ones.
-
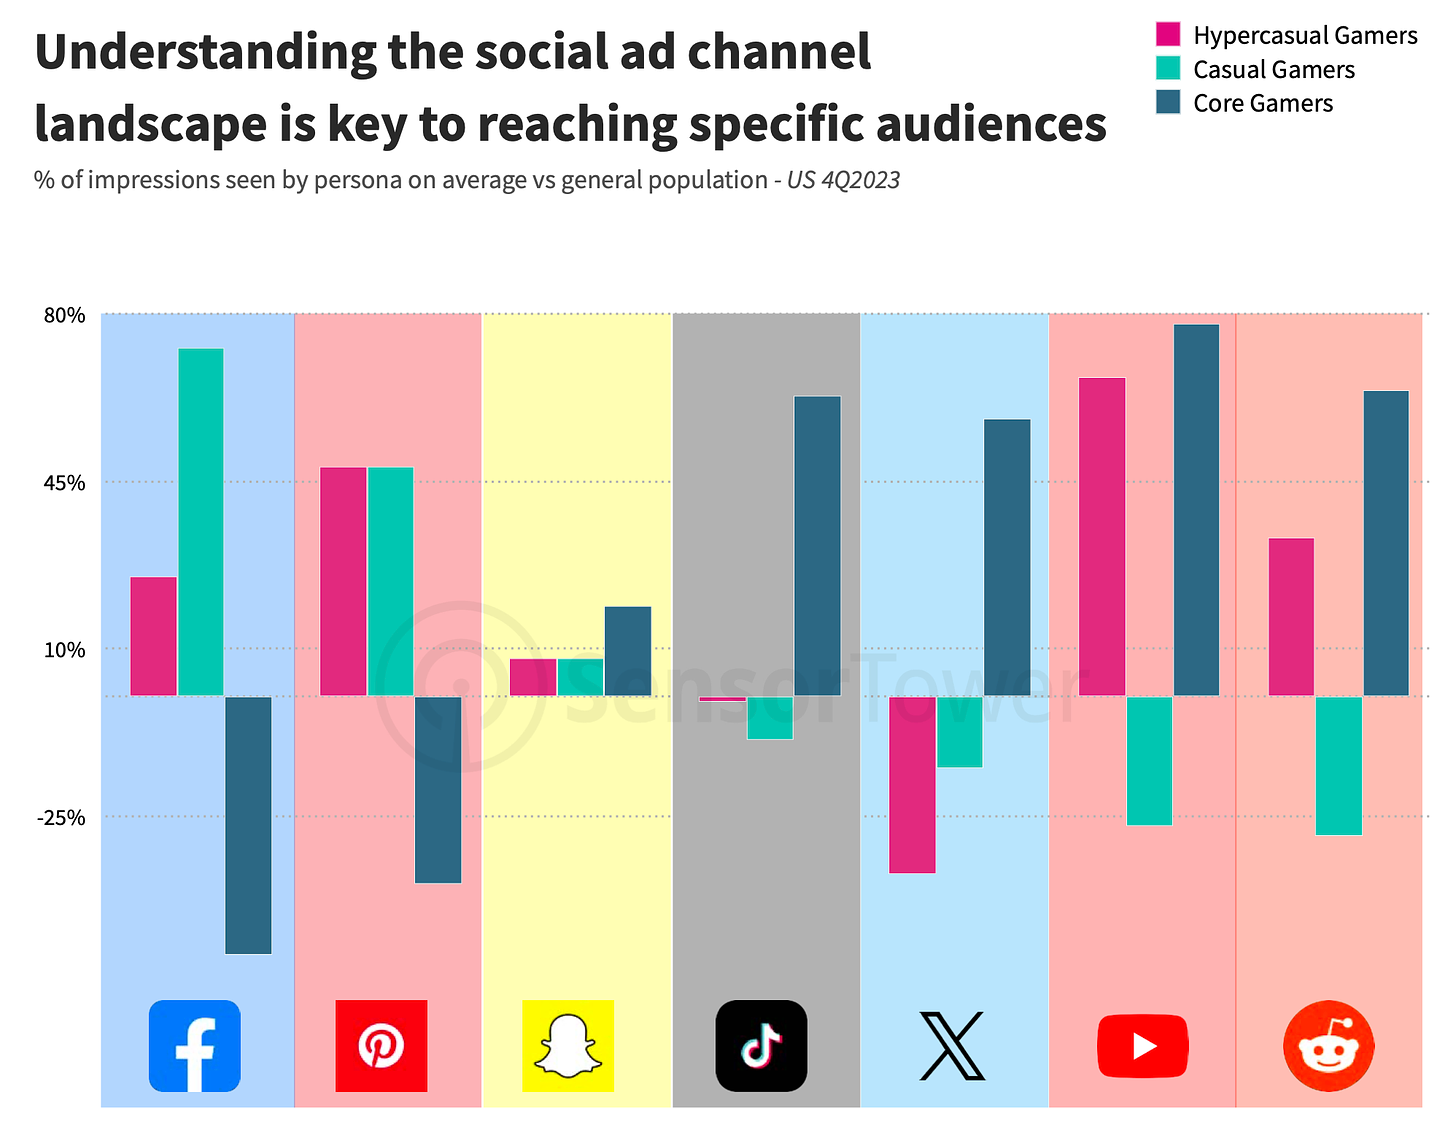
The largest number of casual gamers in the USA is on Facebook and Pinterest; mid-core gamers are primarily on TikTok, Twitter, YouTube, and Reddit.
Key Events of 2023
-
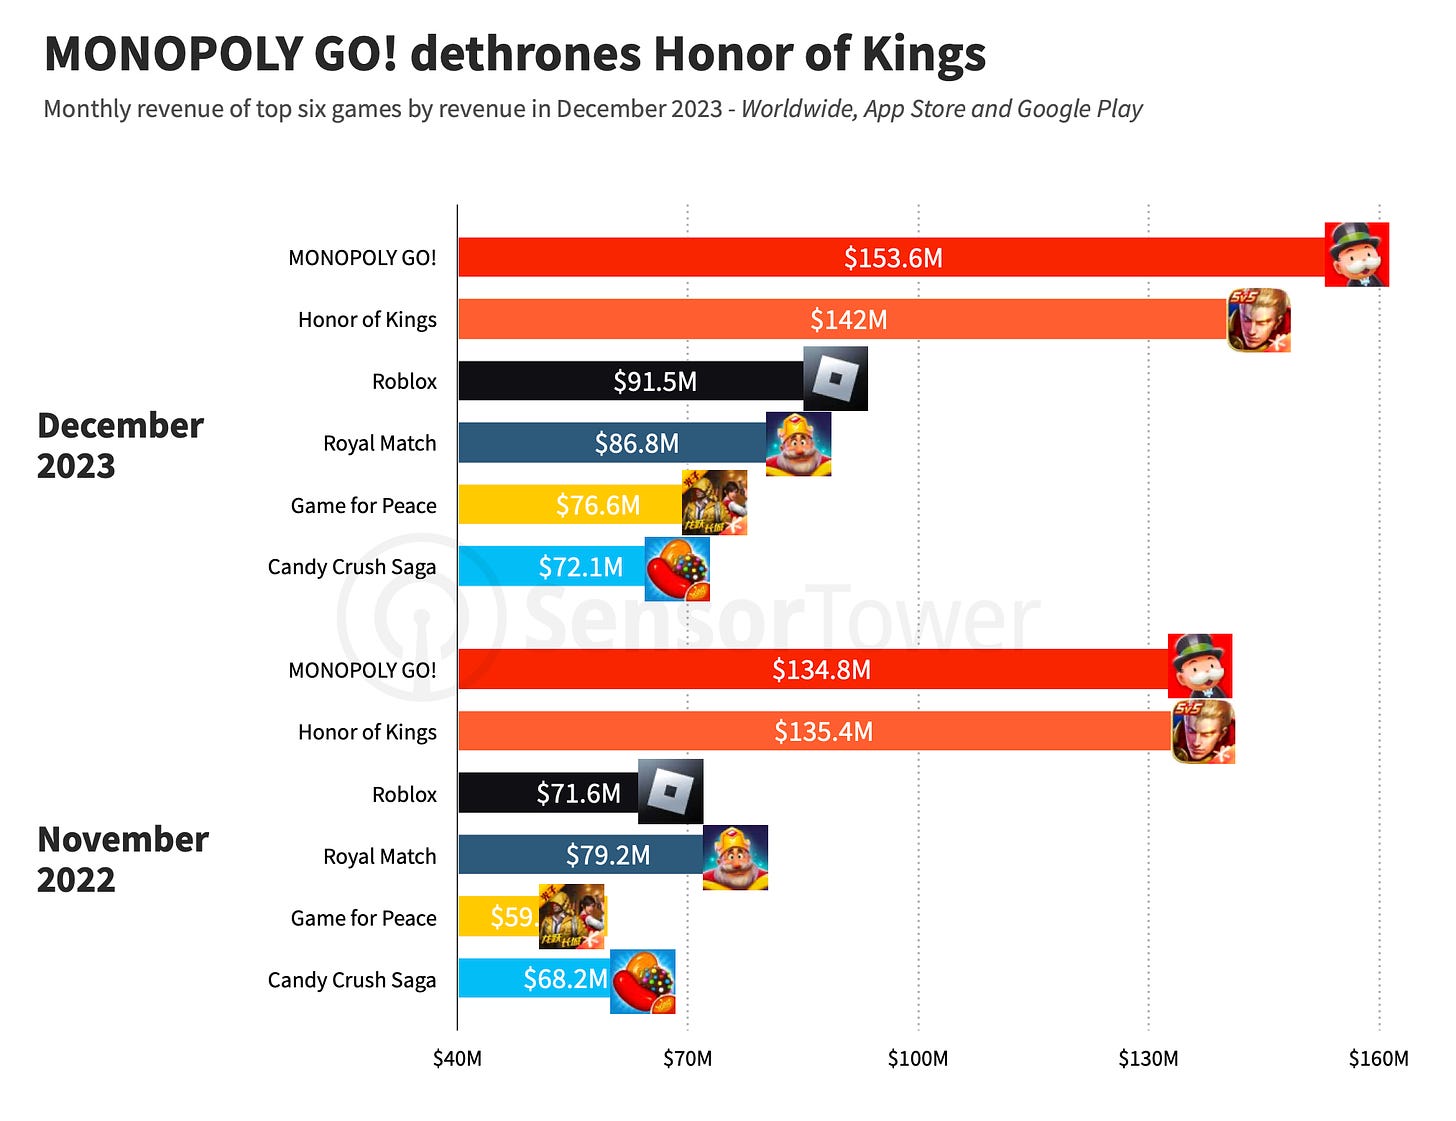
MONOPOLY GO! ($153.6 million in December 2023) surpassed Honor of Kings in monthly revenue ($142 million in December 2023).
❗️There is likely a typo in the Sensor Tower chart. It probably meant November 2023.
-
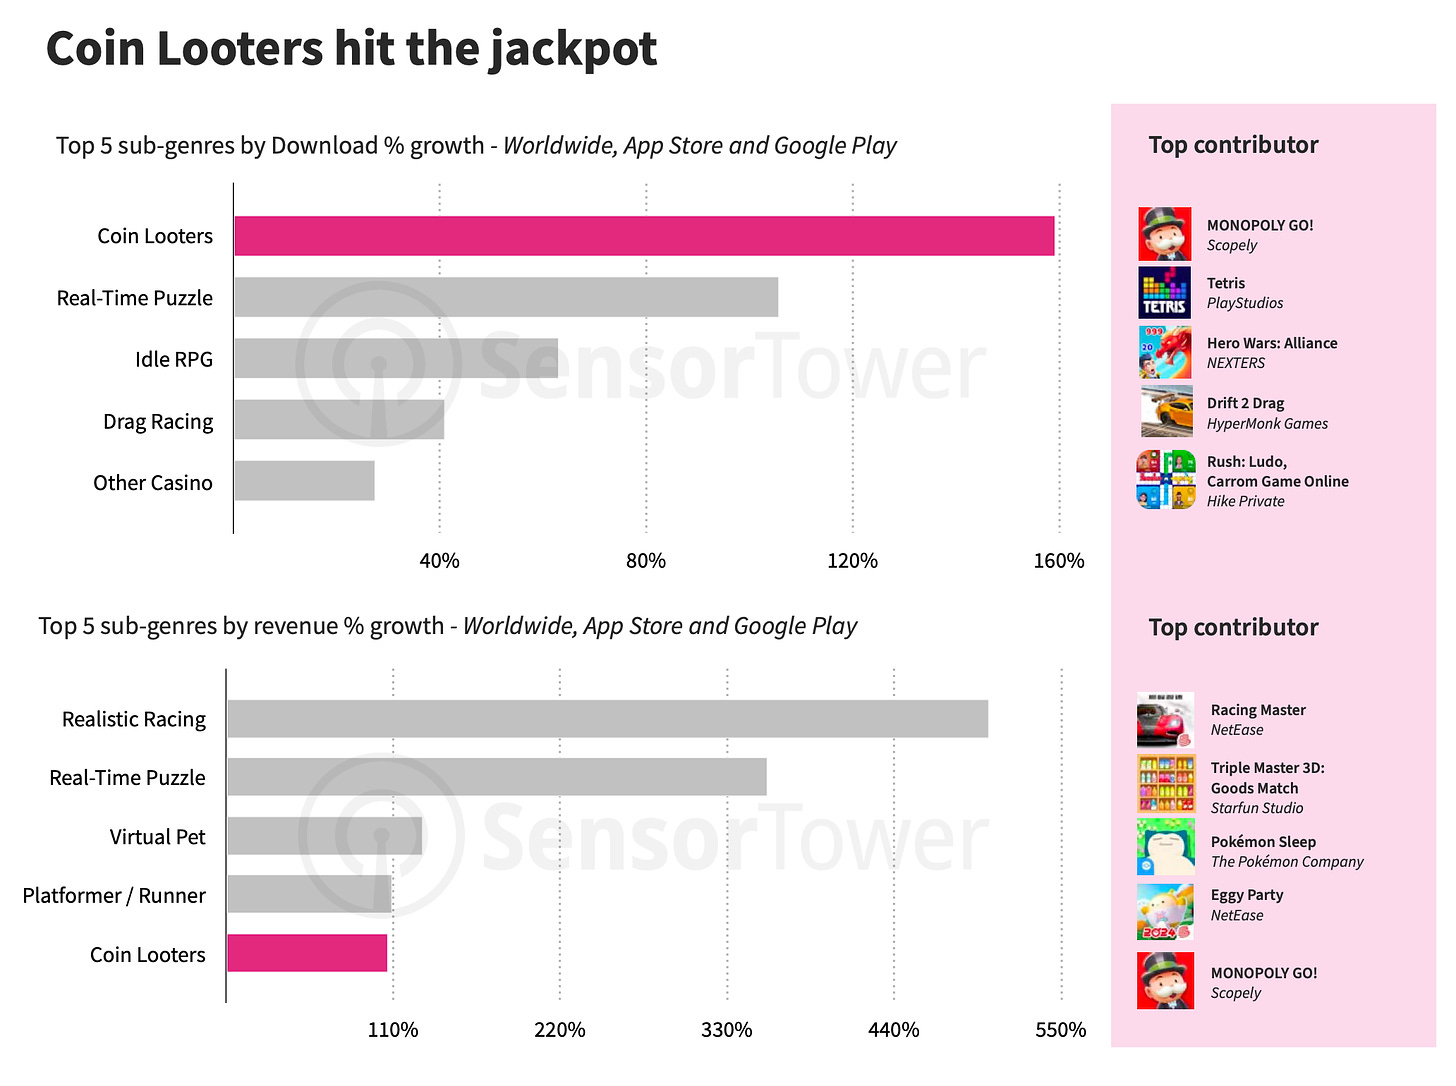
If we shift away from MONOPOLY GO!, real-time puzzles saw growth in 2023 (a 100% increase in downloads; a 350% increase in revenue); Idle RPGs saw a 60% increase in downloads.
-
In 2023, major transmedia releases based on gaming IPs occurred - Super Mario Bros. Movie, The Last of Us, and Twisted Metal.
-
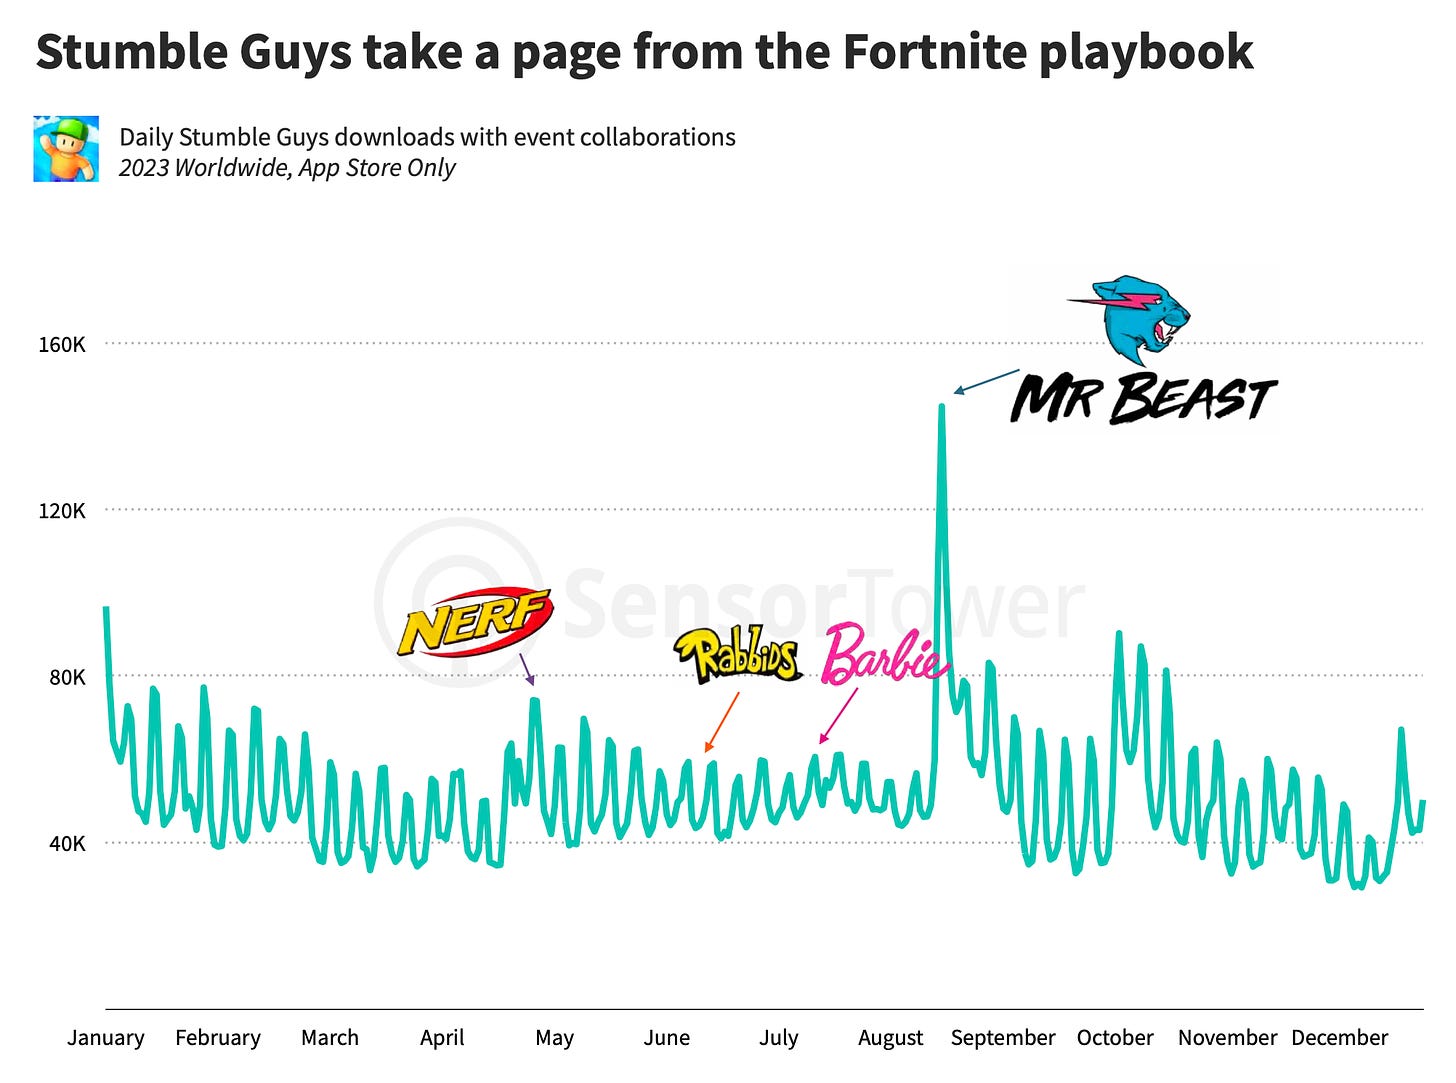
Stumble Guys actively collaborates with brands. The most successful collaboration was with Mr. Beast - daily downloads of the project tripled.
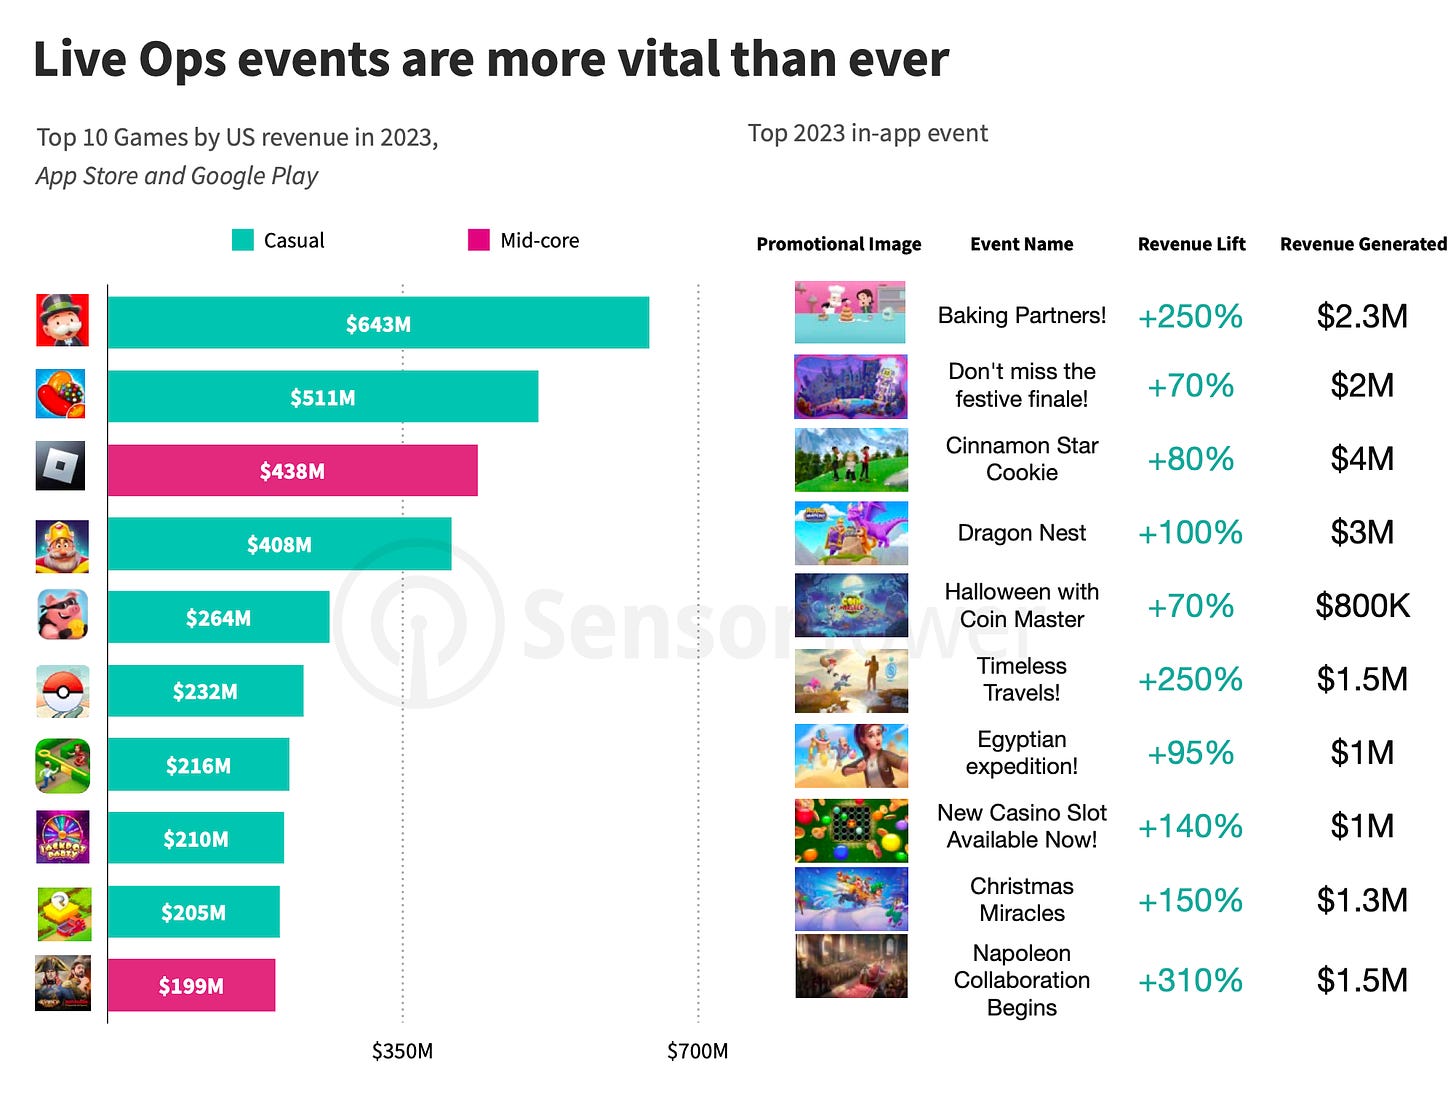
- The role of Live-Ops in games is critically important. In the top-grossing projects of 2023 in the US, in the most successful cases, they increased revenue from 70% ($800 thousand - Halloween in Coin Master) to 310% ($1.5 million generated revenue - collaboration with the film Napoleon in Evony).
-
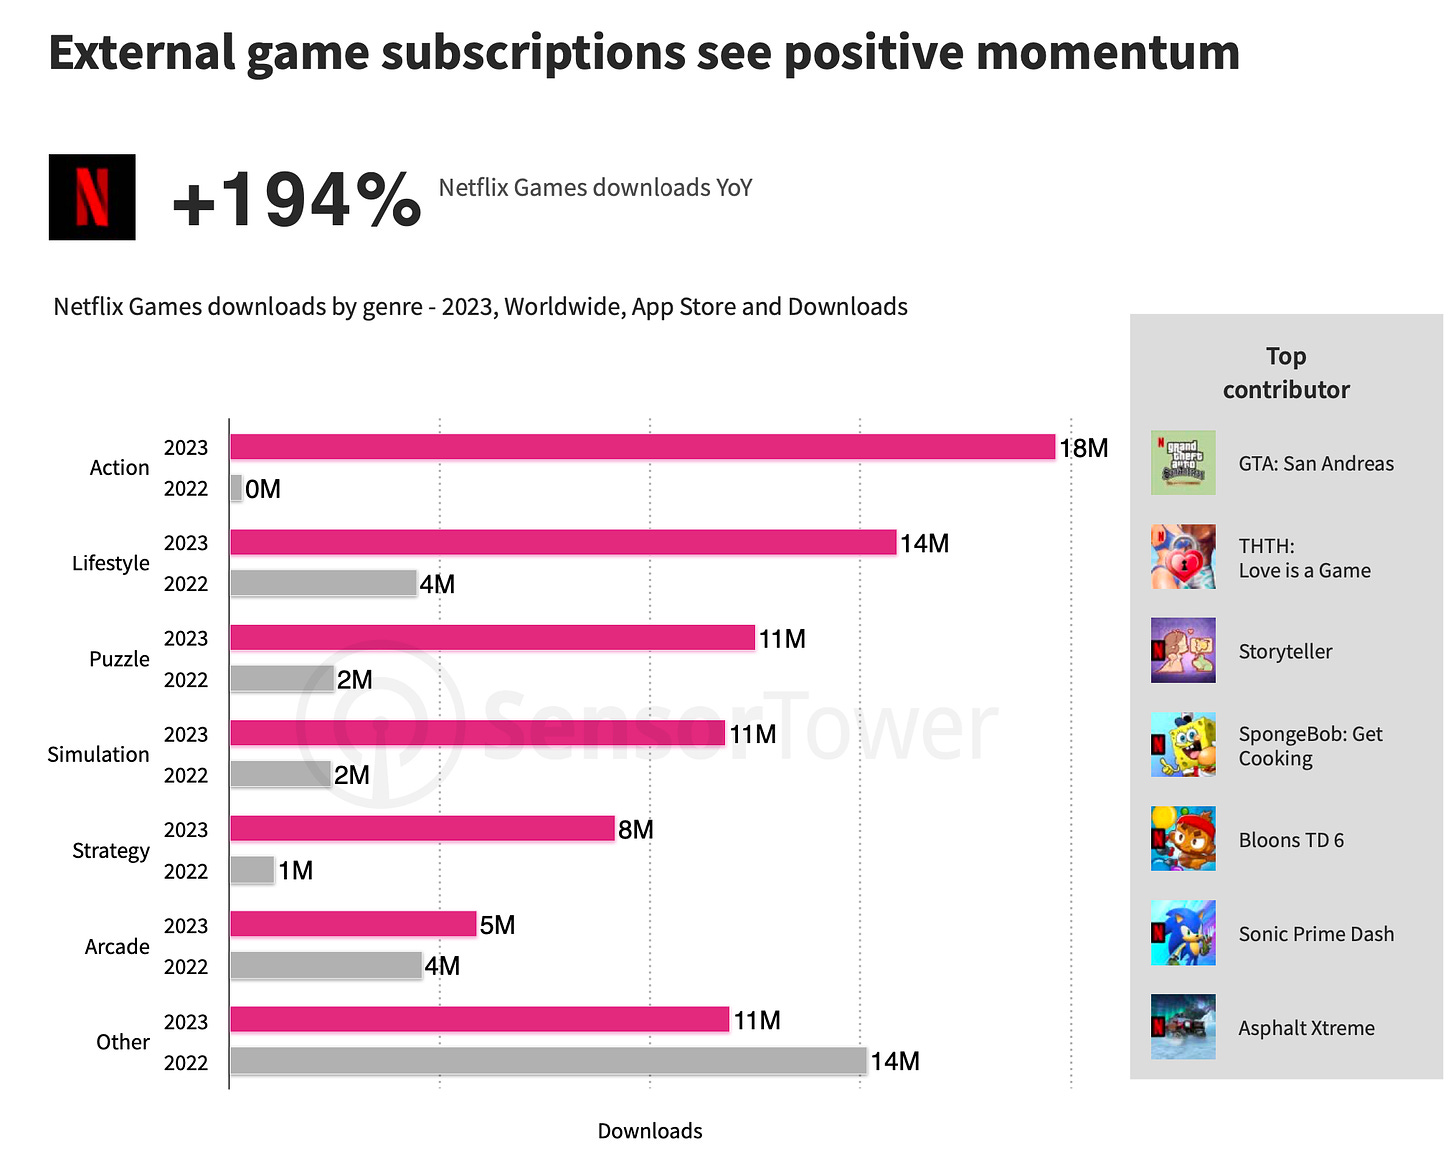
Netflix managed to find growth points - games from Netflix Games saw a 194% increase in downloads in 2023. The most successful release was Grand Theft Auto: San Andreas.
Genres by Competition Level
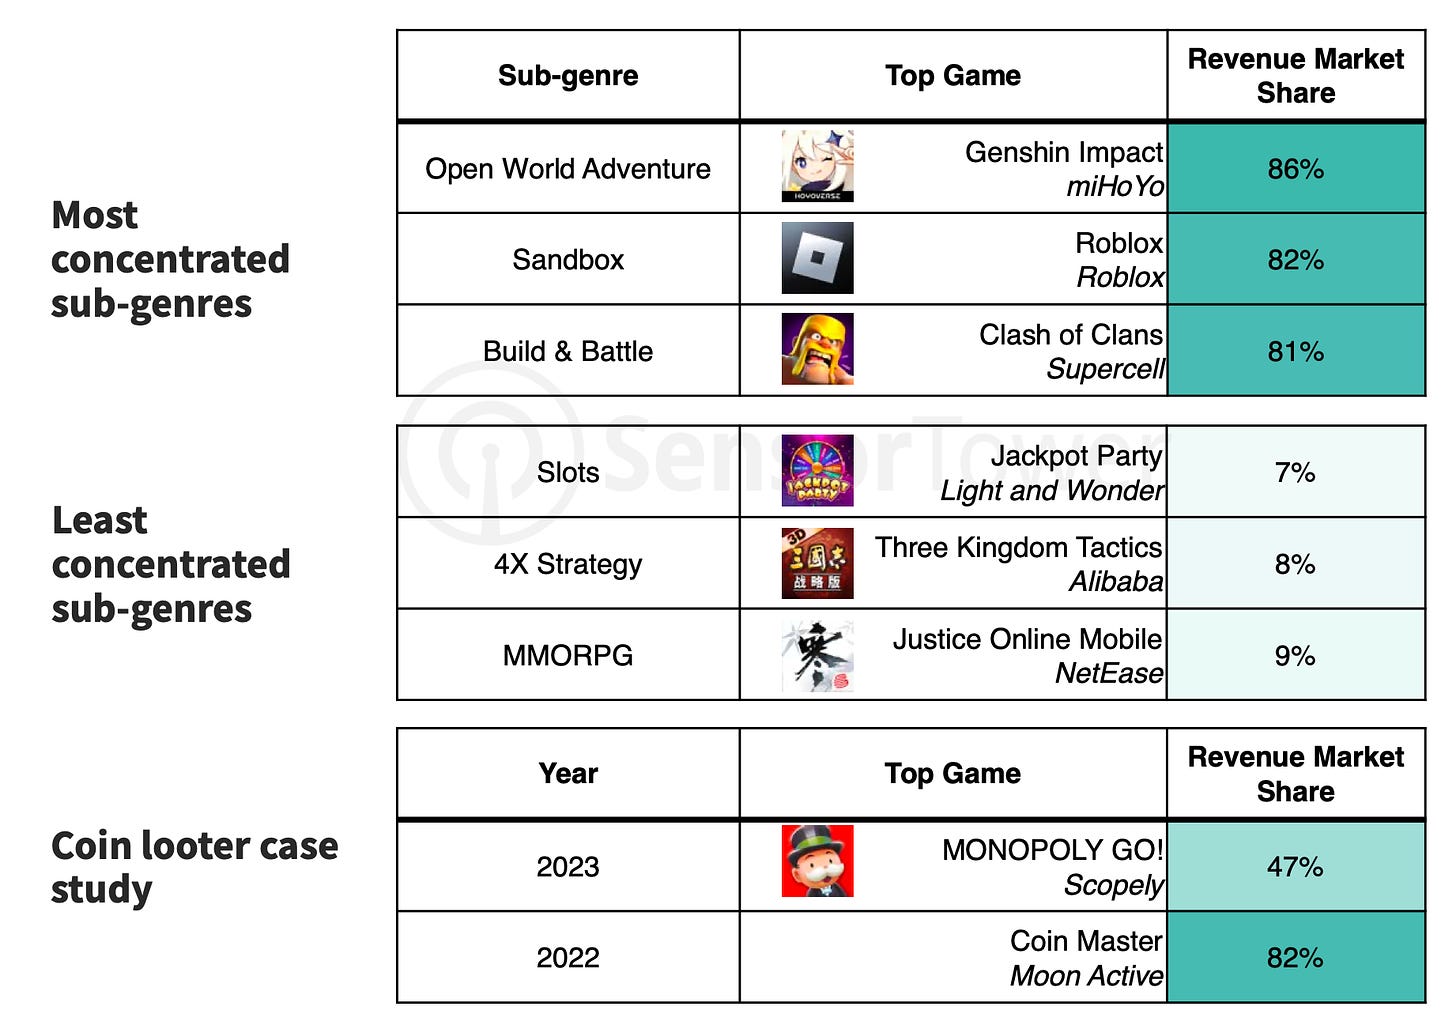
- Open-world RPGs are the most concentrated subgenre. Genshin Impact accounts for 86% of the entire market share in this subgenre. Sandbox games follow with Roblox holding 82%. Finally, in the Build & Battle subgenre, Clash of Clans dominates with 81% of all revenue.
-
The least concentrated subgenres are MMORPGs (the largest share belongs to Justice Online - 9%); 4X-strategies (Three Kingdom Tactics leads with 8% revenue); and slots (Jackpot Party leads with 7% revenue).
-
However, genre concentration does not mean that successful projects cannot be developed within it. In 2022, in the Coin Looter subgenres, Coin Master had 82% of the entire market. In 2023, after the release of MONOPOLY GO!, Scopely's game took over the dominant position (47% of the subgenre's revenue).
Asian Market in 2023
-
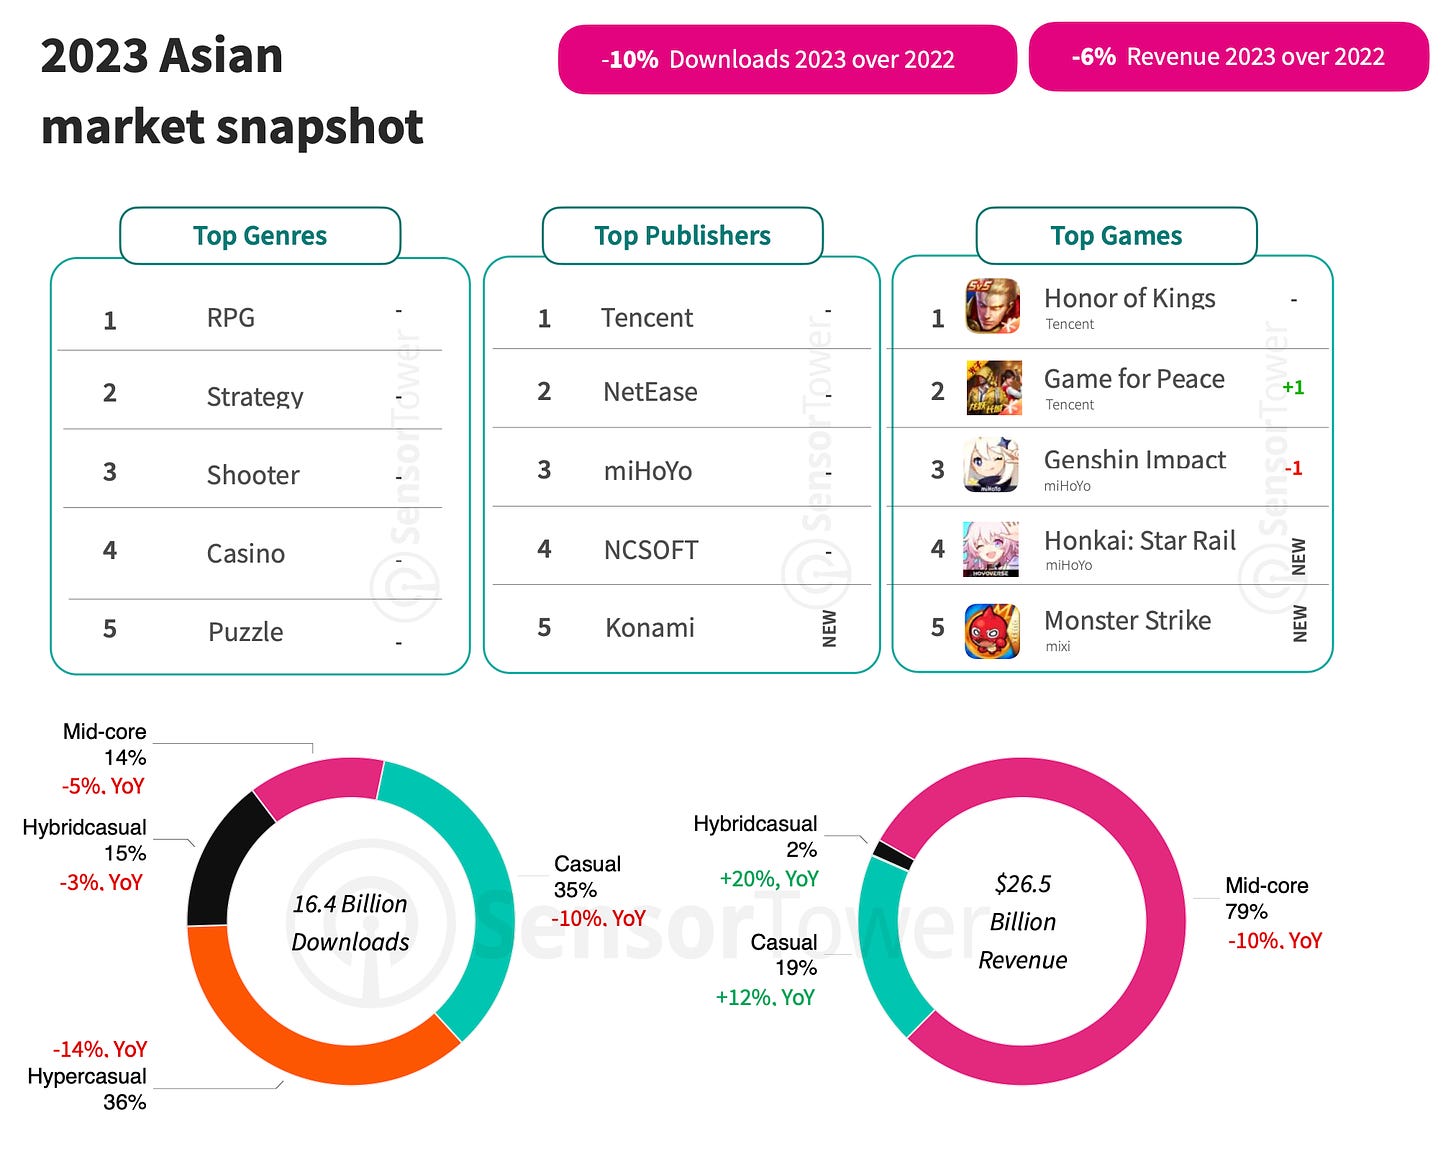
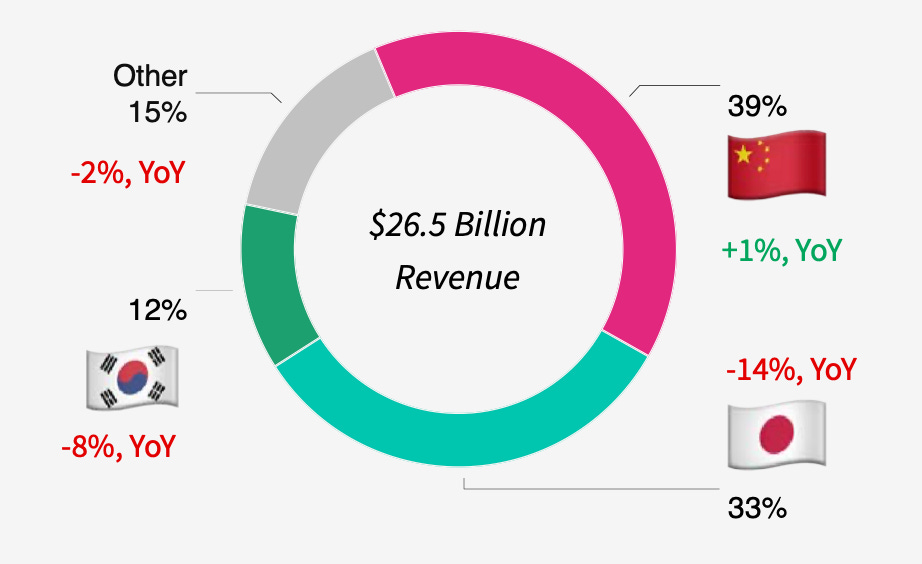
Revenue fell by 6% to $26.5 billion; downloads declined by 10% to 16.4 billion.
-
The Chinese market grew by 1% (39% of the Asian region); Japan fell by 14% (33% of the Asian region); South Korea fell by 8% (12% of the Asian region). Other countries declined by 2% in revenue.
- Mid-core projects saw a 10% revenue drop in the region (they account for 79% of all revenue). However, casual games grew by 12% (19% of all revenue); hybrid casual games increased by 20% (2% of all revenue).
-
In terms of downloads, hyper-casual projects declined by 14% (36% of all downloads); casual games dropped by 10% (35% of the market); hybrid casual games dropped by 3% (15% of all downloads); mid-core projects fell by 5% (14% of all downloads).
-
Revenue leaders were Honor of Kings, Game for Peace, Genshin Impact.
-
The main genres were RPGs, strategies, and shooters.
European Market in 2023
-
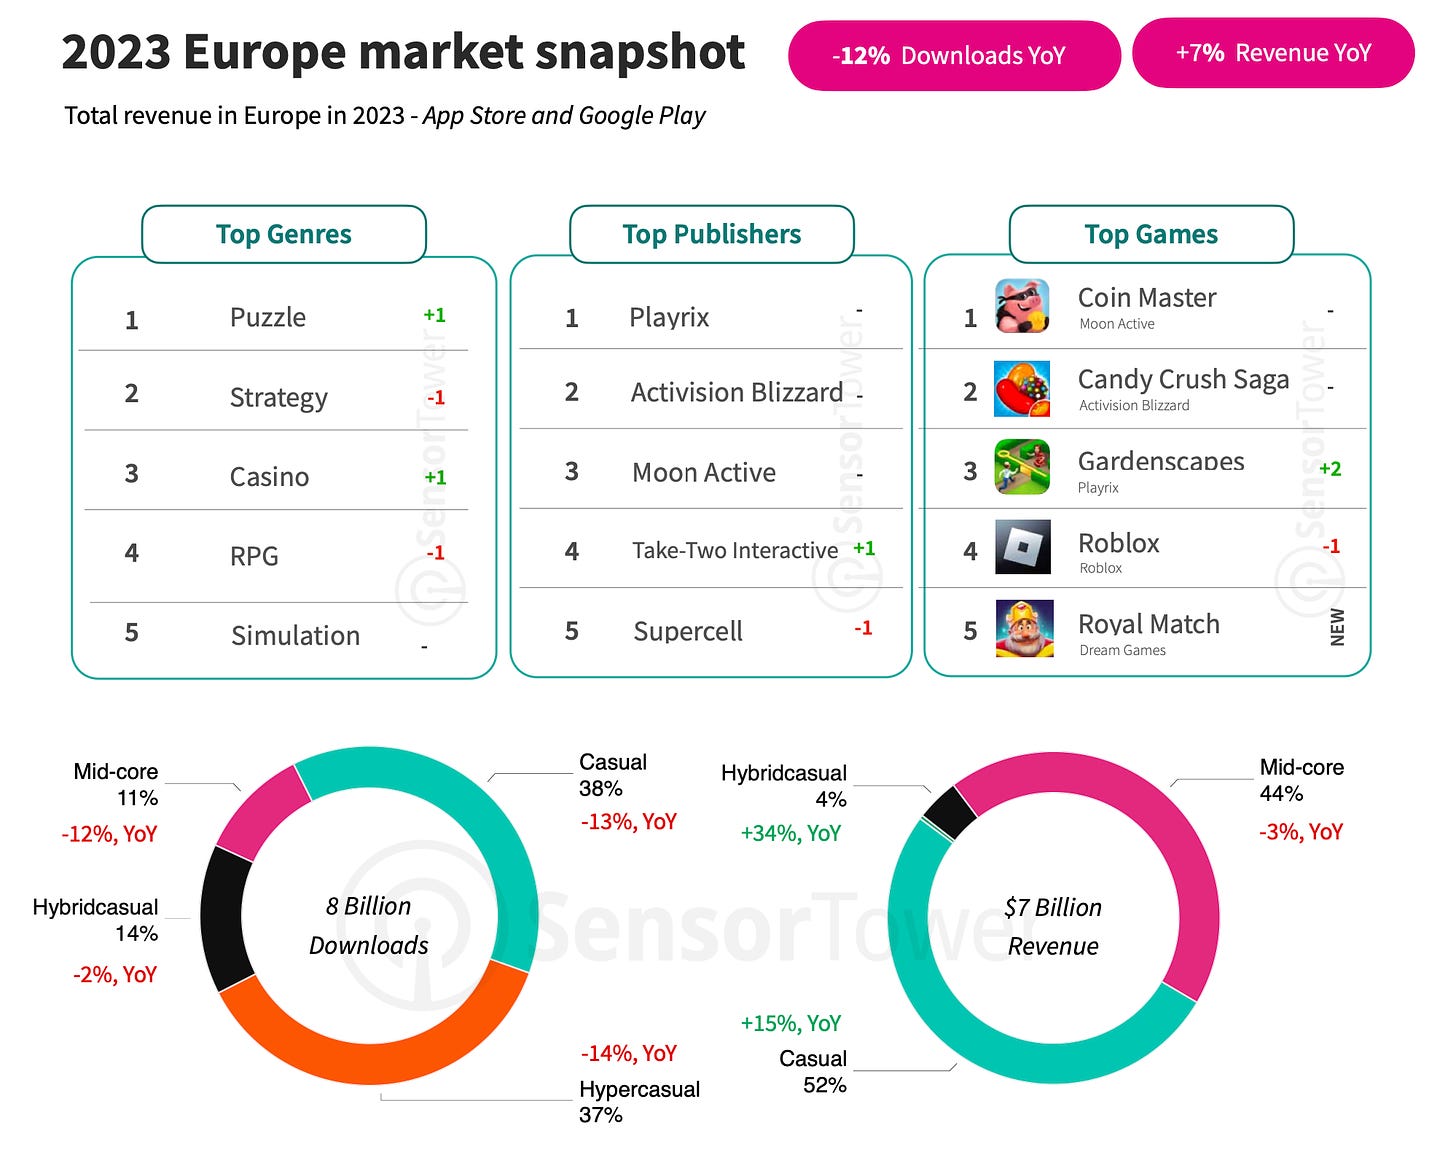
Revenue increased by 7% compared to 2022 ($7 billion); downloads declined by 12% (8 billion).
-
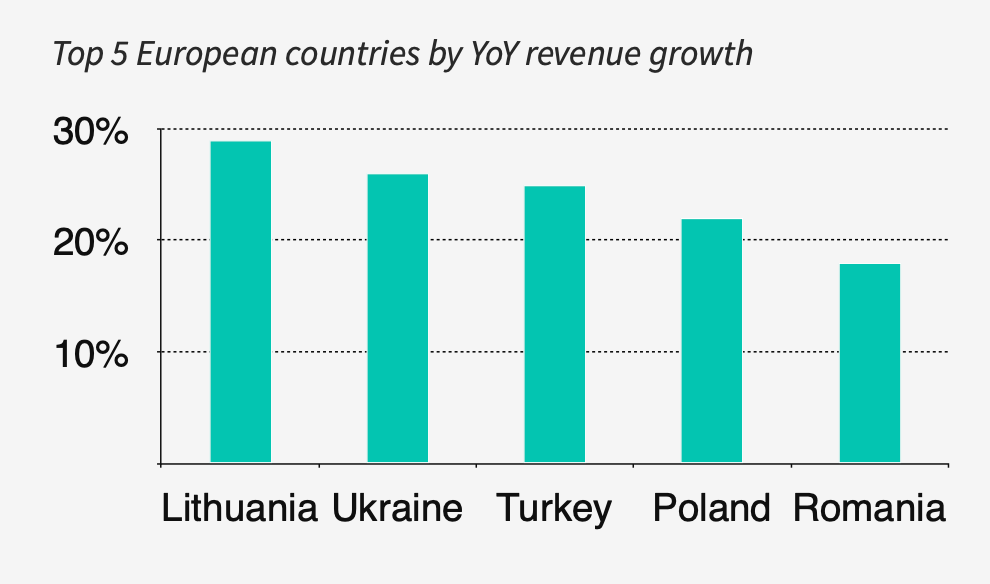
The leaders in revenue growth in 2023 were Lithuania (29%); Ukraine (27%); Turkey (25%); Poland (21%); Romania (18%).
- Mid-core projects saw a 3% YoY decline in revenue (they account for 44% of all revenue). Casual projects grew by 15% YoY (52% of all revenue); hybrid casual games grew by 34% (4% of all revenue).
-
Hyper-casual games saw a 14% YoY decline in downloads (37% of the total volume); casual games dropped by 13% (38% of the market); mid-core games dropped by 12% (11% of all downloads); hybrid casual games dropped by 2% (14% of all downloads). Coin Master, Candy Crush Saga, Gardenscapes - the highest-earning games in Europe. Puzzles, strategies, and casinos - the highest-earning genres.
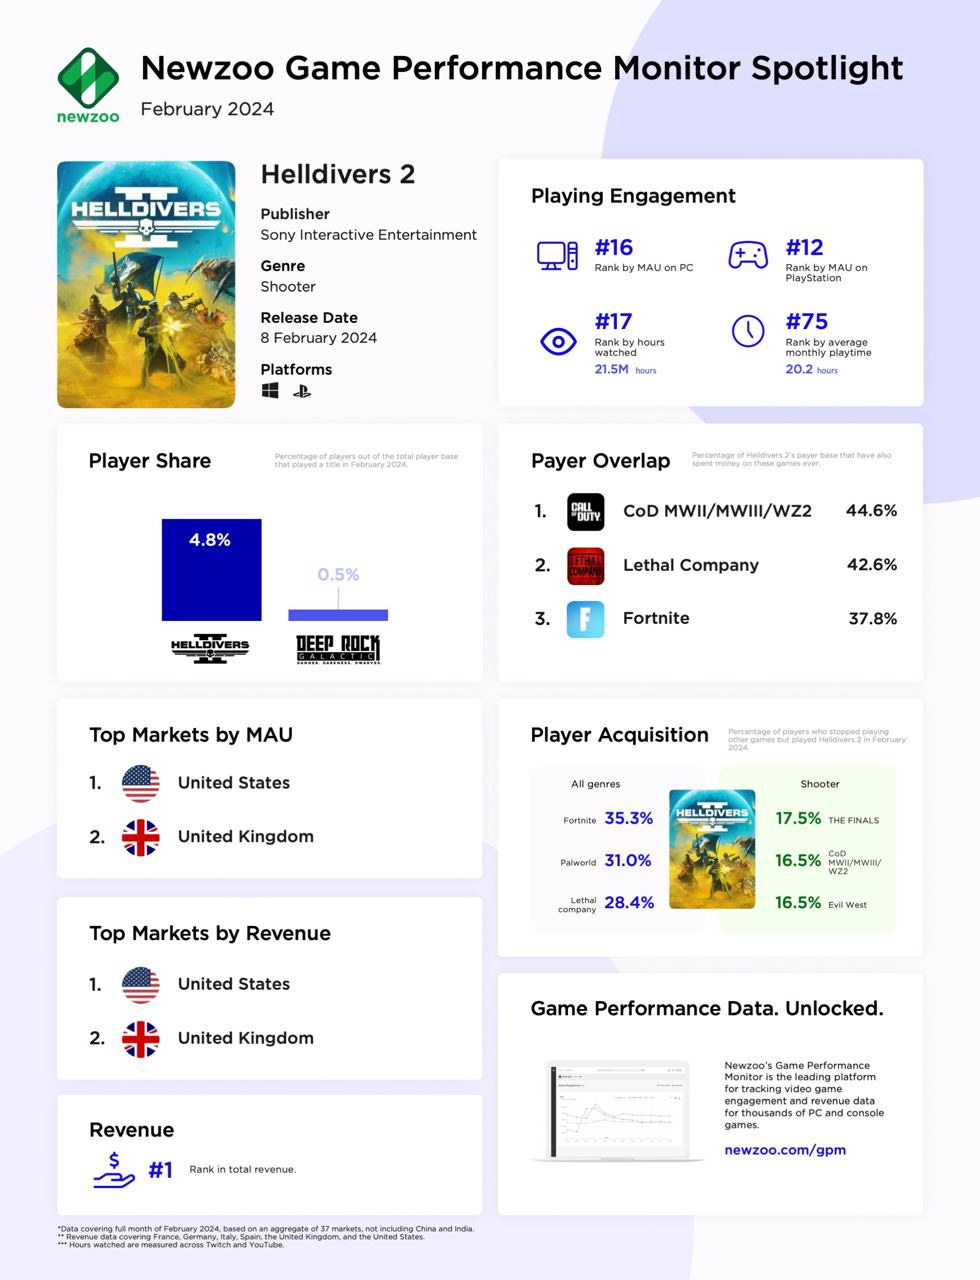
Newzoo: Helldivers II became the highest-earning game of February

Newzoo takes into account 37 markets, excluding China and India. Revenue is collected from the USA, UK, France, Germany, Italy, and Spain.
-
In February, Helldivers II earned more than any other game on PC and consoles. The main markets in terms of revenue are the USA and the UK.
-
The game ranked 15th in terms of MAU. Within its genre, the game ranked sixth across all platforms.
-
Considering only shooters, Helldivers II holds the third position on PS and sixth on PC in terms of MAU.
-
4.8% of the entire PC and PlayStation audience played Helldivers II in February.
-
The average player spent 20.2 hours per month battling for the future of Super Earth in the game. This ranks 75th among all games and 7th among shooters.
-
35.3% of Helldivers II owners also play Fortnite; 31% play Palworld, and 28.4% play Lethal Company.
-
In terms of shooters, the biggest overlaps are with The Finals (17.5%), the Call of Duty series (16.5%), and Evil West (16.5%).
-
The largest overlap among paying players is with the Call of Duty series (44.6%), Lethal Company (42.6%), and Fortnite (37.8%).
-
In February, the game accumulated 21 million hours of views. It ranks 17th in terms of views for the month and 7th among shooters.
Sensor Tower: Analysis of Pinball/Brick Breaker Subgenres

Overall Figures
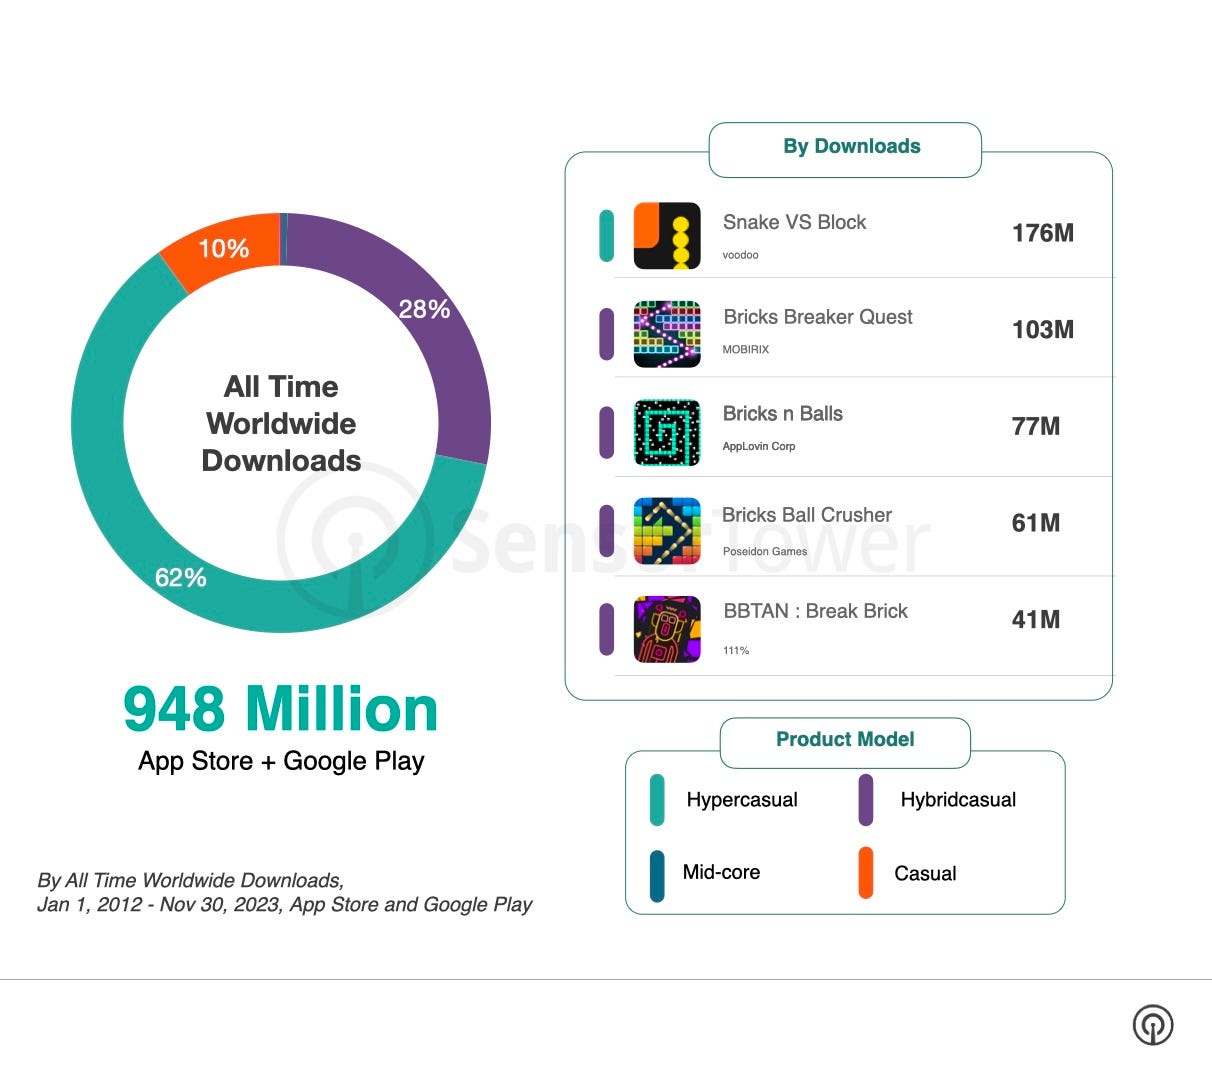
- From January 2012 to the end of November 2023, games of these subgenres were downloaded 948 million times.
-
62% of all downloads were hyper-casual projects (monetization only through ads); 28% were hybrid-casual projects; and 10% were casual.
❗️There is at least one mid-core game - World Flipper. More about it below.
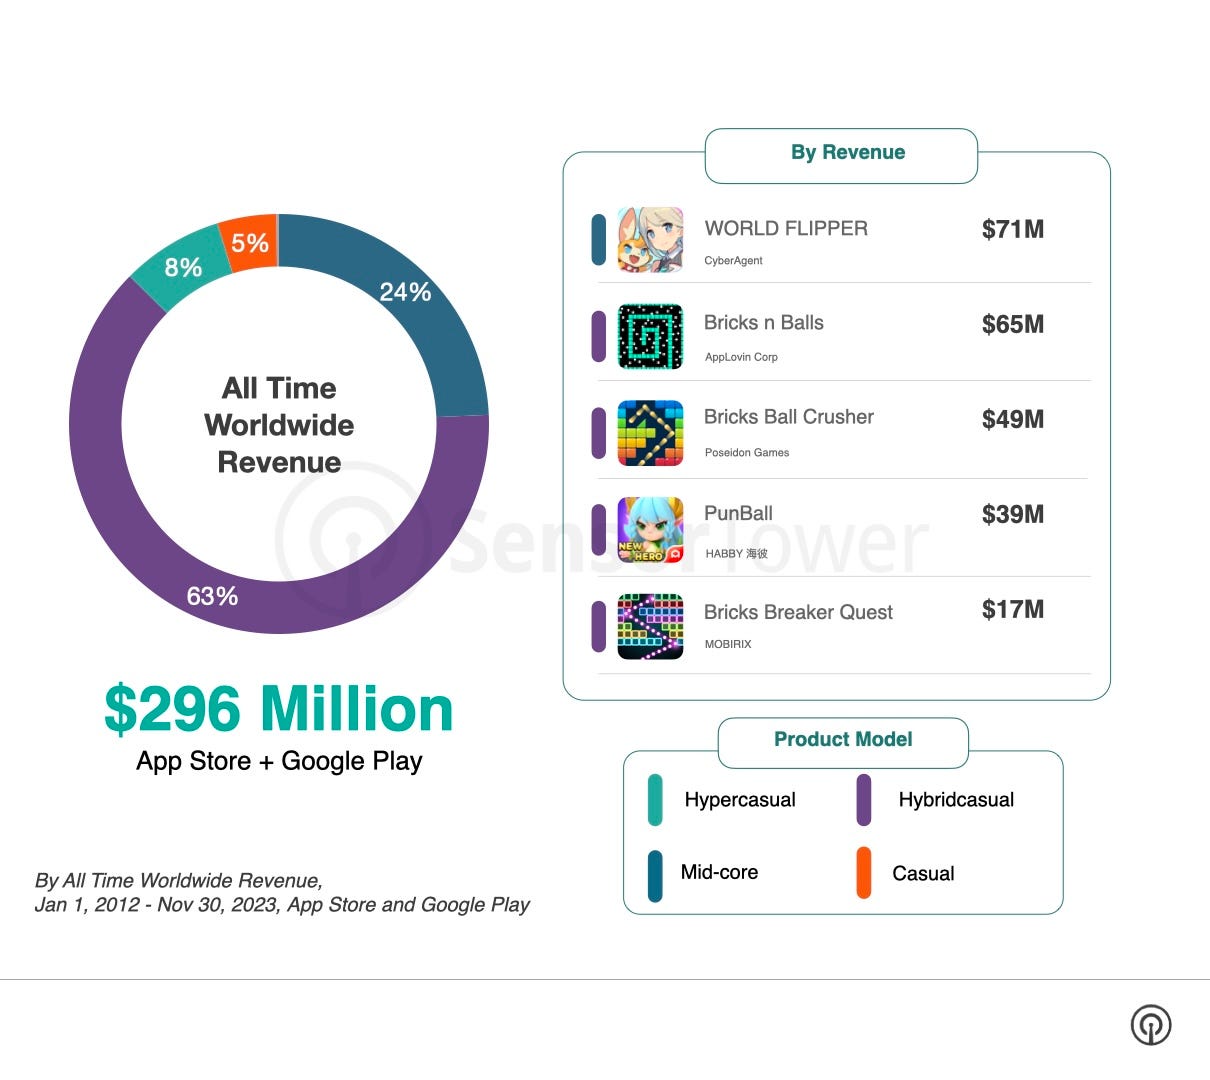
- During the same period, Pinball/Brick Breaker subgenres games earned $296 million.
-
63% of revenue comes from hybrid-casual games; 24% from mid-core; 8% from hyper-casual; 5% from casual.
-
World Flipper by CyberAgent is the highest-earning game. It's a pinball game with RPG elements and gacha. The game has $71 million in lifetime revenue. PunBall by Habby has $39 million and ranks fourth.
❗️Sensor Tower does not specify whether ad revenue is included. Judging by the overall revenue volume and the share of hyper-casual projects in revenue structure - it seems not.
State of Genres by Revenue and Downloads
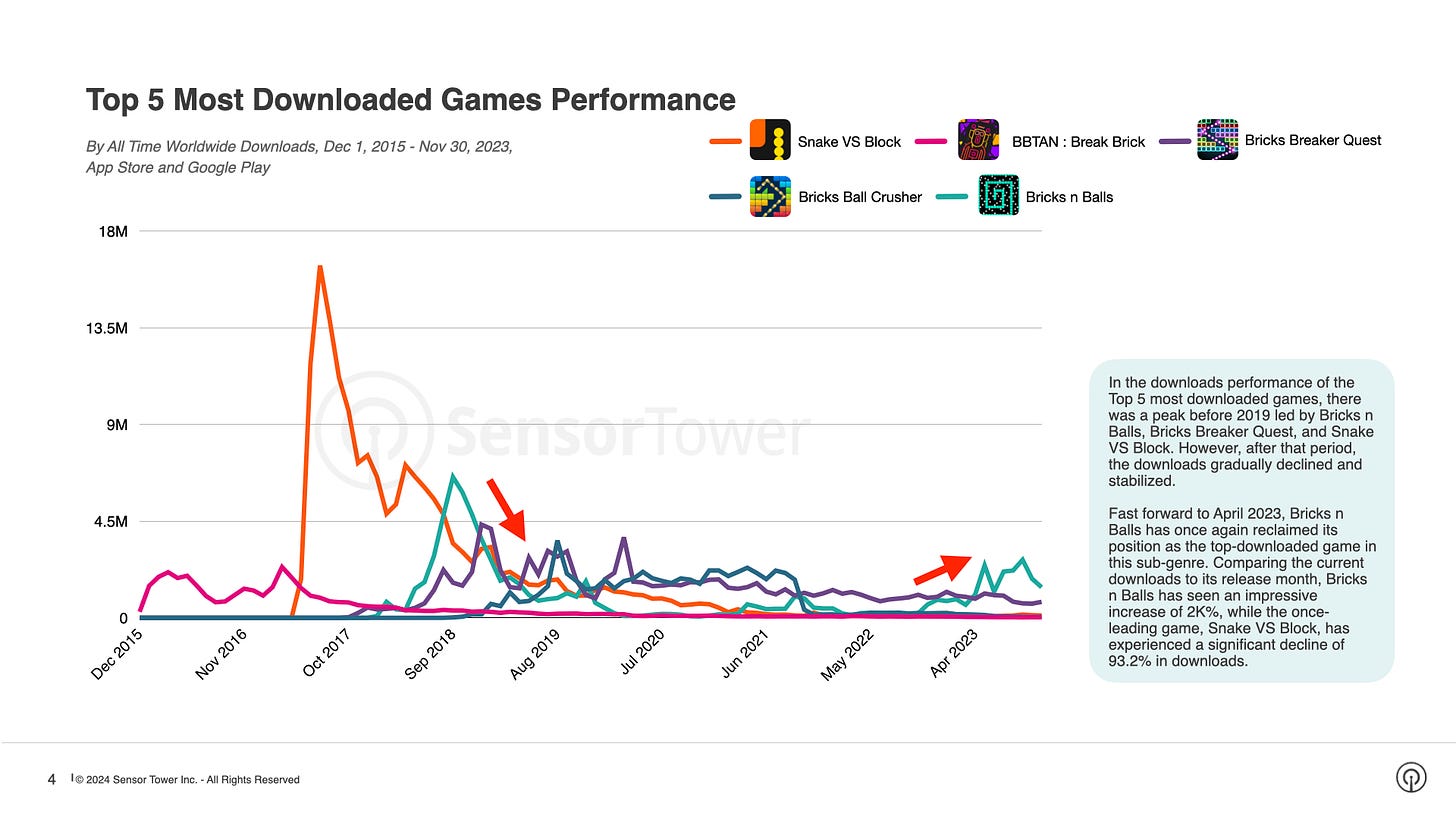
- Snake VS Block - a game that reached peaks in downloads. In October 2017, it was downloaded almost 17 million times.
-
Bricks n Balls - another interesting project. The game hit its record in September 2018 (6.5 million installs), but in April 2023, it surged again (+2000% in downloads).
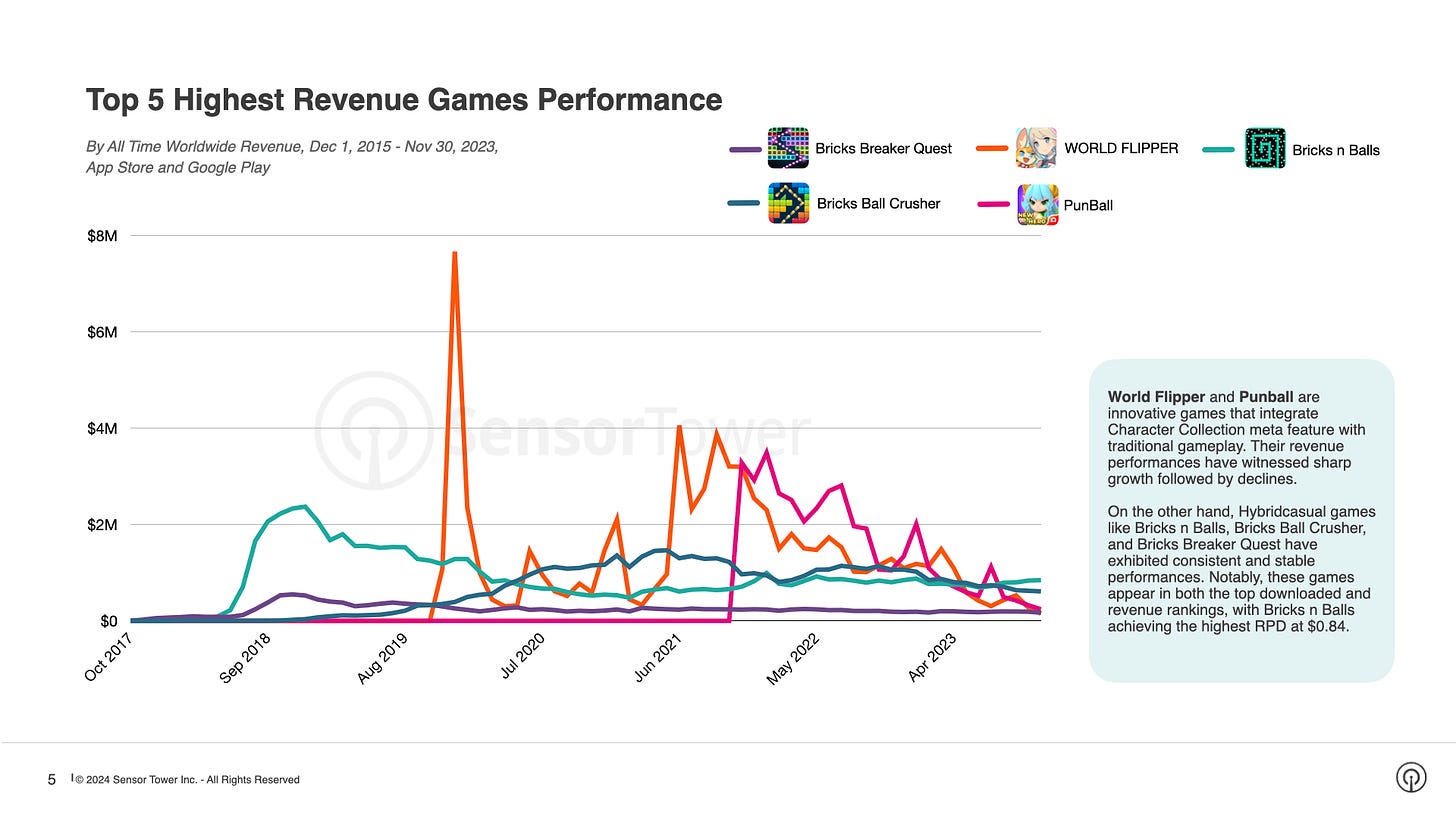
- Neither World Flipper nor Punball managed to stabilize revenue at any level. After each revenue spike, there is a sharp decline. There seems to be an issue either with user monetization or long-term retention of payers.
Retention and UA for the main hybrid-casual representatives of the subgenres
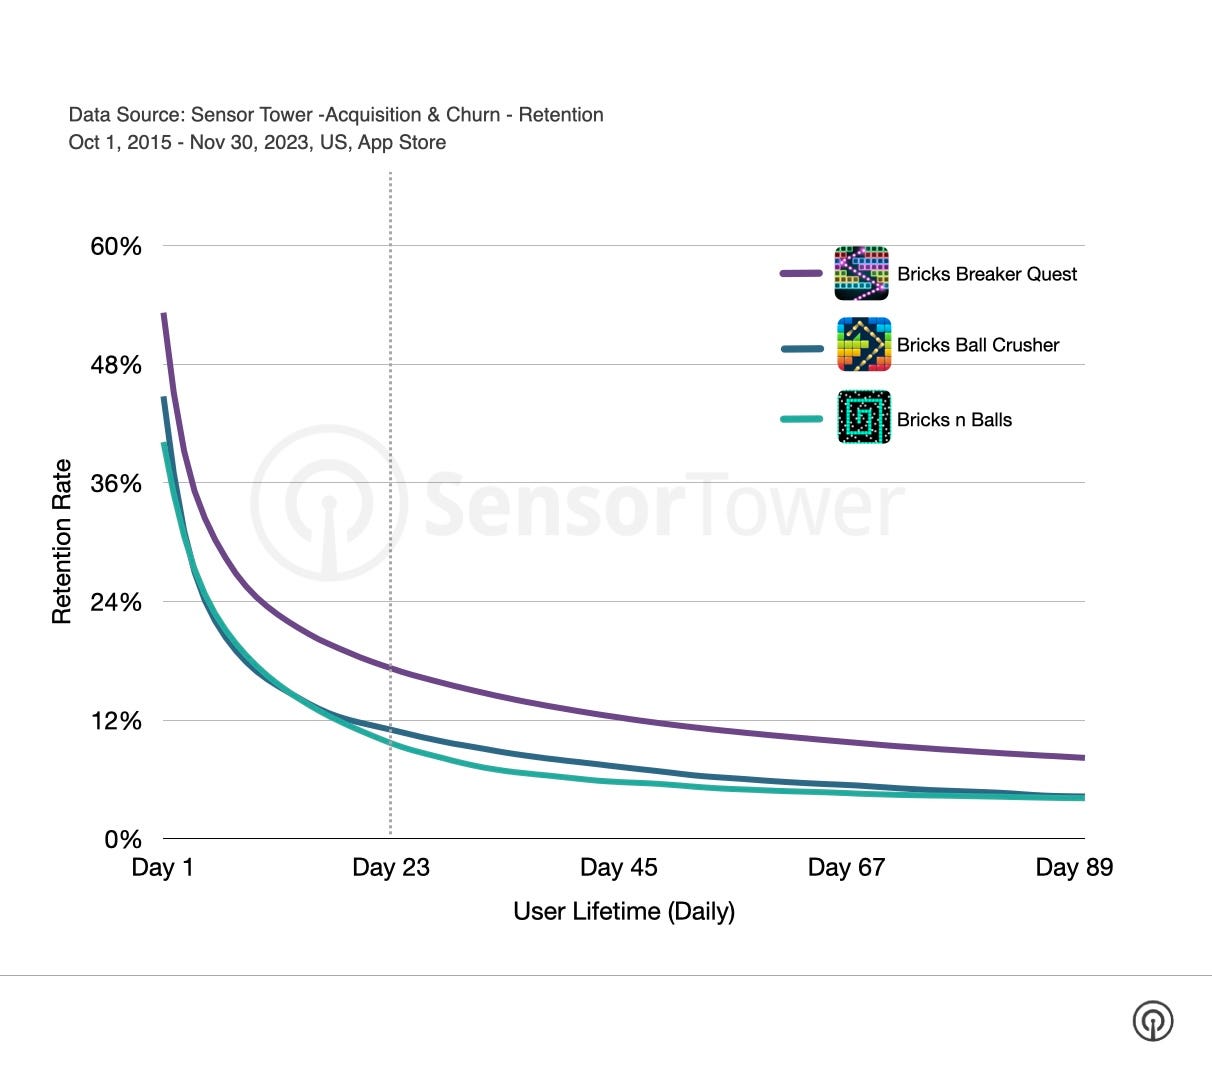
- It can't be said that games of the genre have bad Retention figures. For example, D1 Retention for genre leaders ranges from 38% to 54%. And D60 for Bricks Breaker Quest reaches up to 10%. This is a clear leader; for other projects, this indicator is around 5%.

- Bricks Breaker Quest relies on organic traffic (86.5%). Meanwhile, the share of paid traffic for Bricks Ball Crusher is 74.4%; for Bricks n Balls - 66.2%.

GSD & GfK: Game sales on PC and consoles in March in the UK grew by 26%

Analytical platforms report only the actual sales figures obtained directly from partners. The mobile segment is also not taken into account.
Game sales
-
3.65 million games on PC and consoles were sold in March. Growth compared to last year - 26%.
-
Helldivers II became the best-selling game for the second month in a row. Now its cumulative two months of sales have surpassed Marvel’s Spider-Man II. However, in monetary terms, the superhero game is ahead (it was almost twice as expensive).
-
Dragon’s Dogma II took third place; Final Fantasy VII: Rebirth - fifth place.
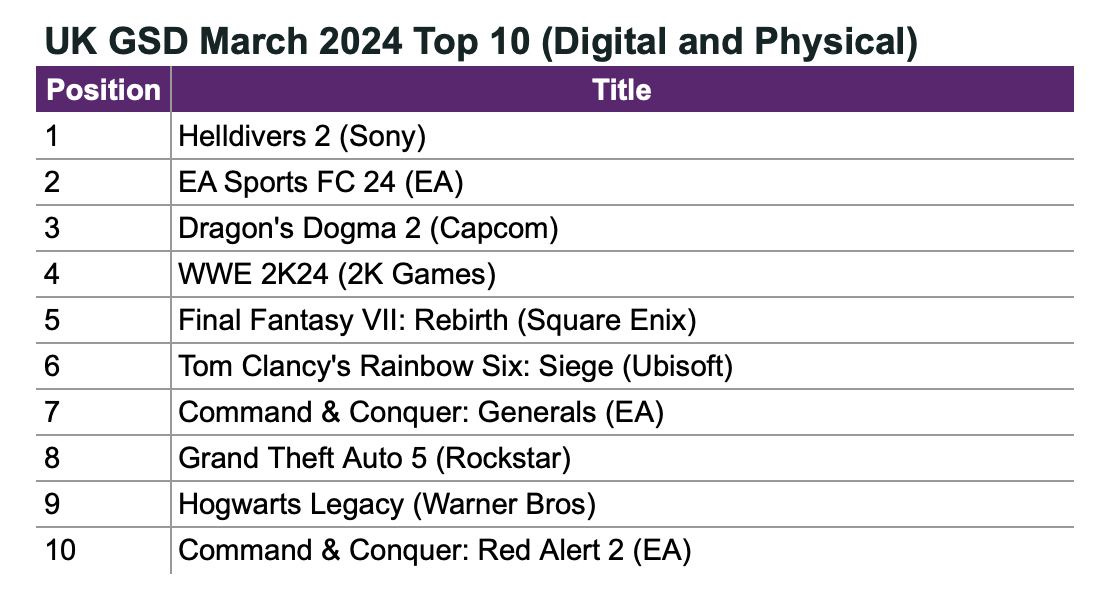
- WWE 2K24 had a decent start - 8% better than the previous installment in the series. The game took the 4th position on the chart.
-
The launch of Rise of the Ronin was not particularly successful - the game took the 21st position on the chart.
Hardware and accessories sales
-
117,000 consoles were sold in the UK in March. This is 22% more than in February, but 15% less than in March last year.
-
PlayStation 5 confidently leads in sales. The console sold 25% better than in February, but 9% worse than in March last year.
-
Nintendo Switch sales fell by 20% YoY; Xbox Series S|X showed an 18% YoY decline. However, both consoles grew by 20% and 19% respectively compared to February.
-
733,000 accessories were sold in the UK in March. Growth of 20% compared to February and 16% compared to March 2023. DualSense Midnight Black is the sales leader. DualSense Edge is in second place.
Sensor Tower: Strategy Games in the South Korean mobile market in 2024

General numbers
-
In January 2024, the strategy genre set a record for monthly revenue in 2.5 years.
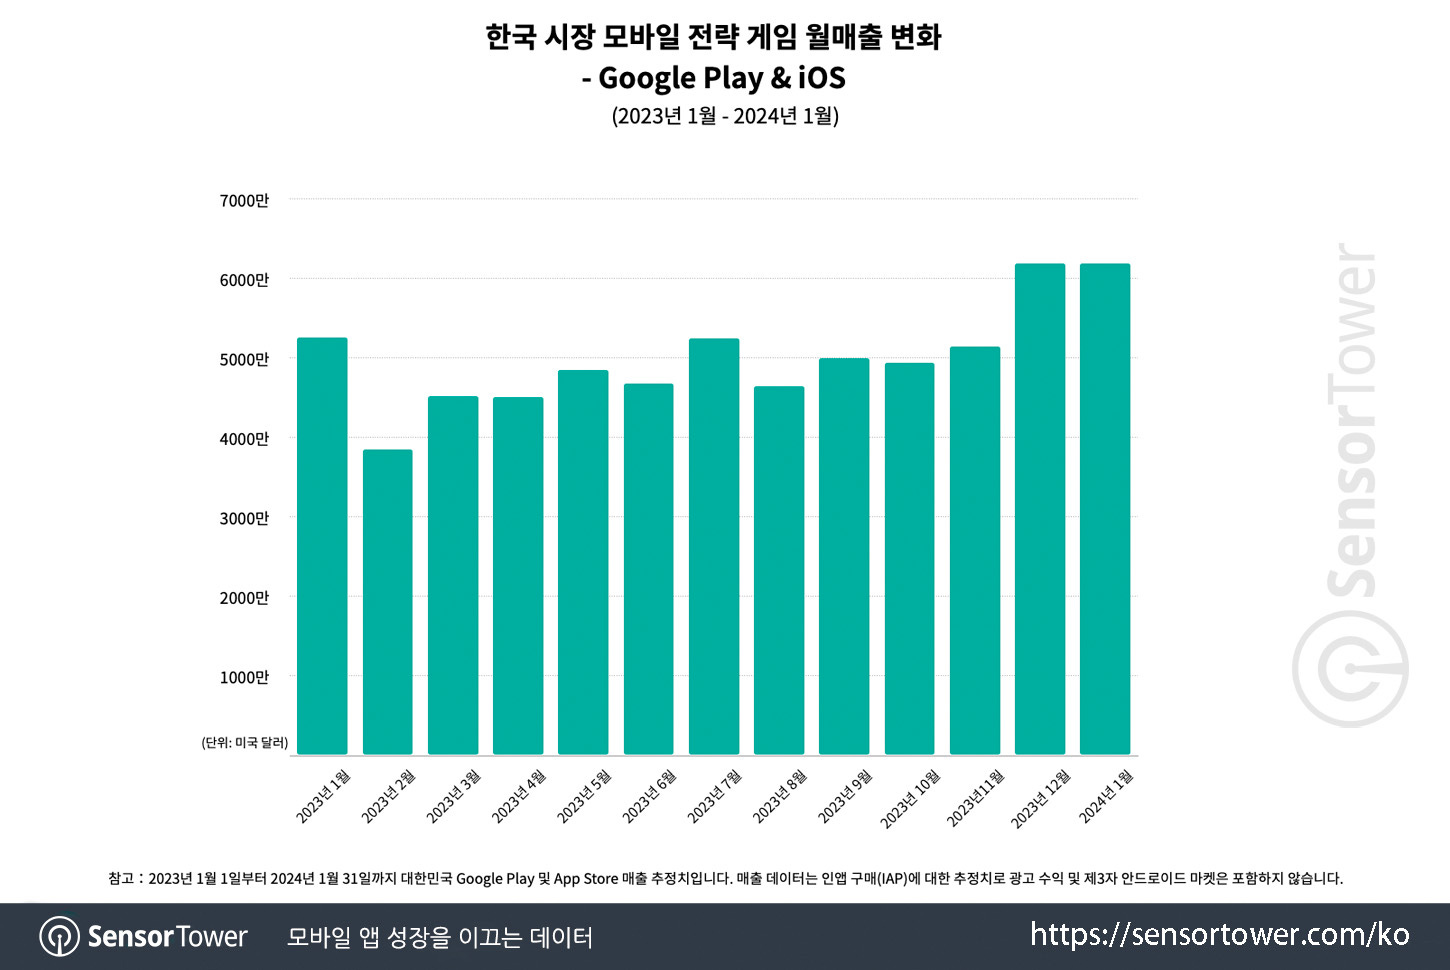
- Strategies accounted for 12.7% of all mobile revenue in 2023. This is the second place, second only to the RPG genre.
- If we consider the whole world, then strategies account for 32.8% of all iOS mobile game revenue in China; in the USA, the share is 16%; in Japan - 12.4%.
Most notable projects
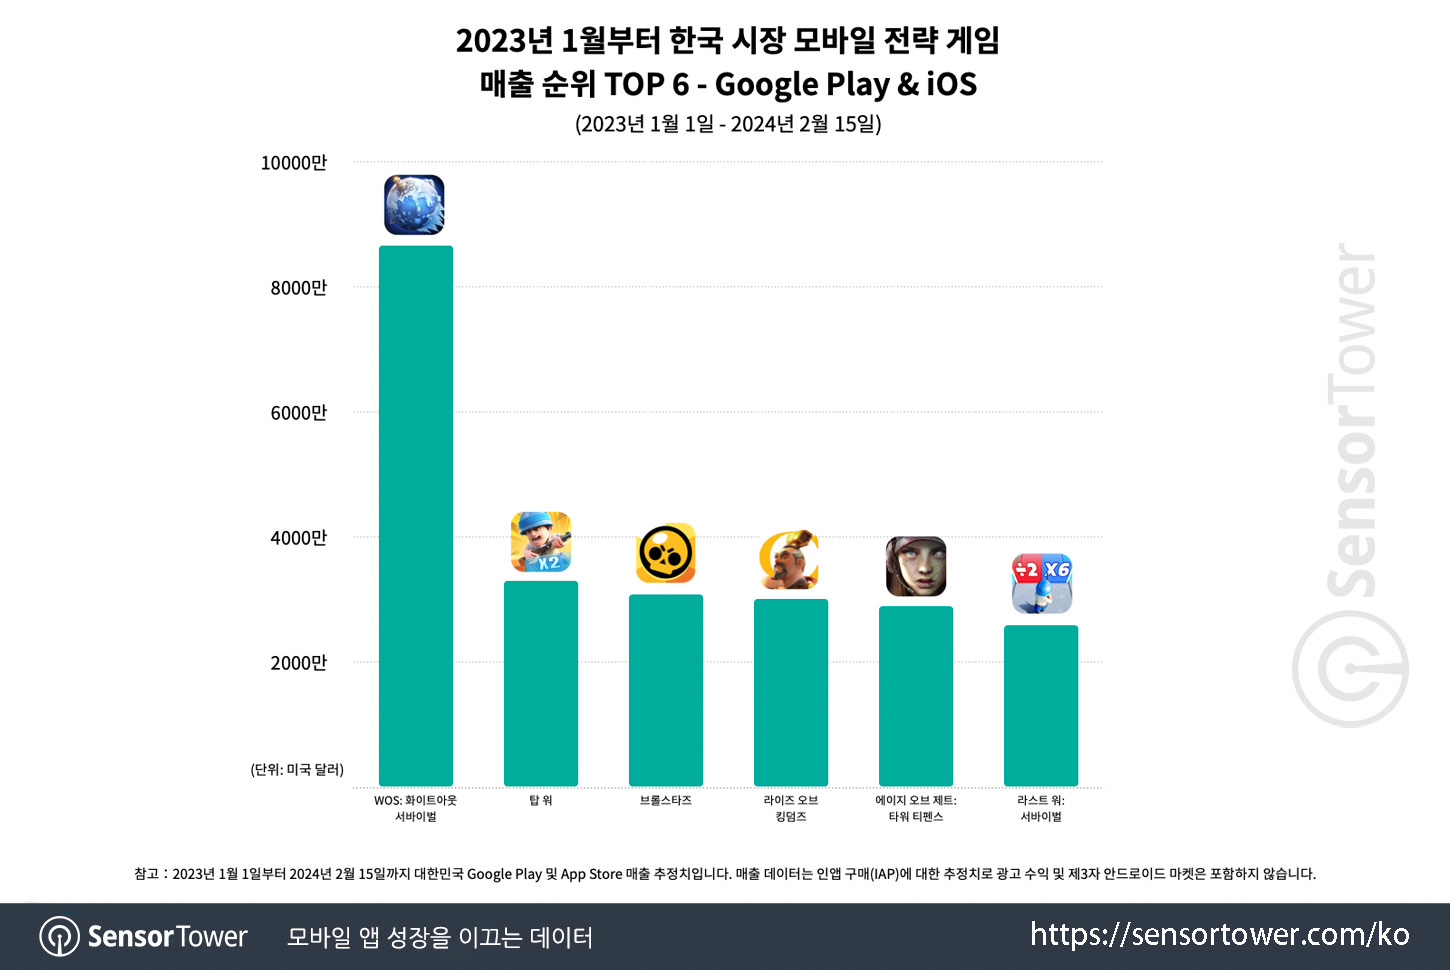
- In the top 6 highest-earning projects, there are no games from Korean developers.
❗️In Sensor Tower's taxonomy, Brawl Stars is classified as a strategy, which slightly deviates from the overall picture - the entire report is about 4X strategies.
-
Whiteout Survival is the top-grossing strategic game in 2023 and the first one and a half months of 2024 in the South Korean market. It surpasses Top War (second place) by about 3 times. The project has earned over $90 million in South Korea since its release.
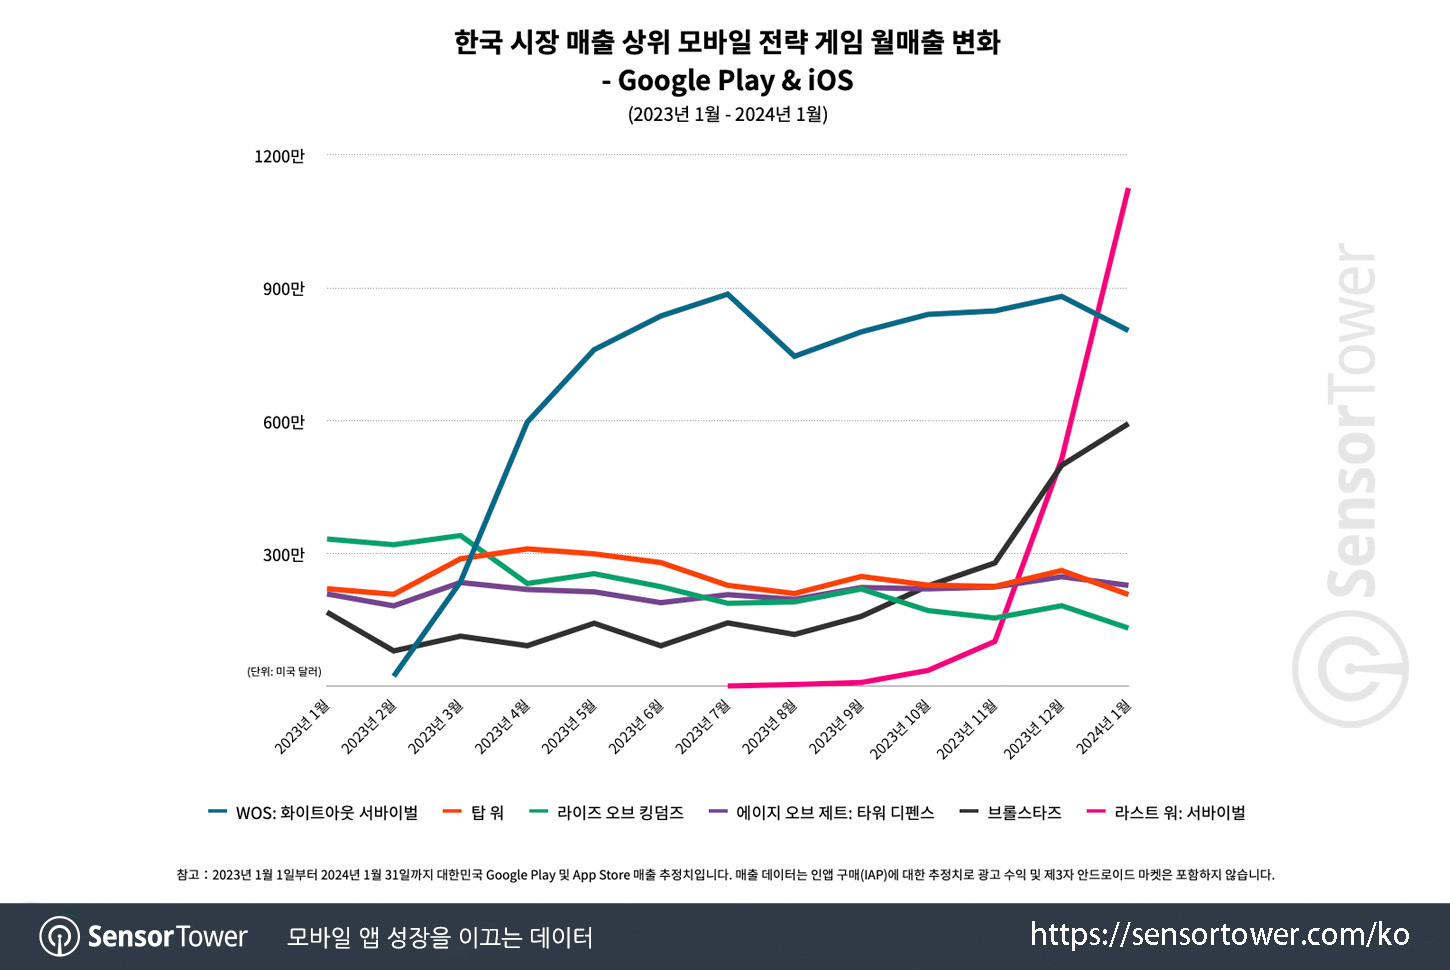
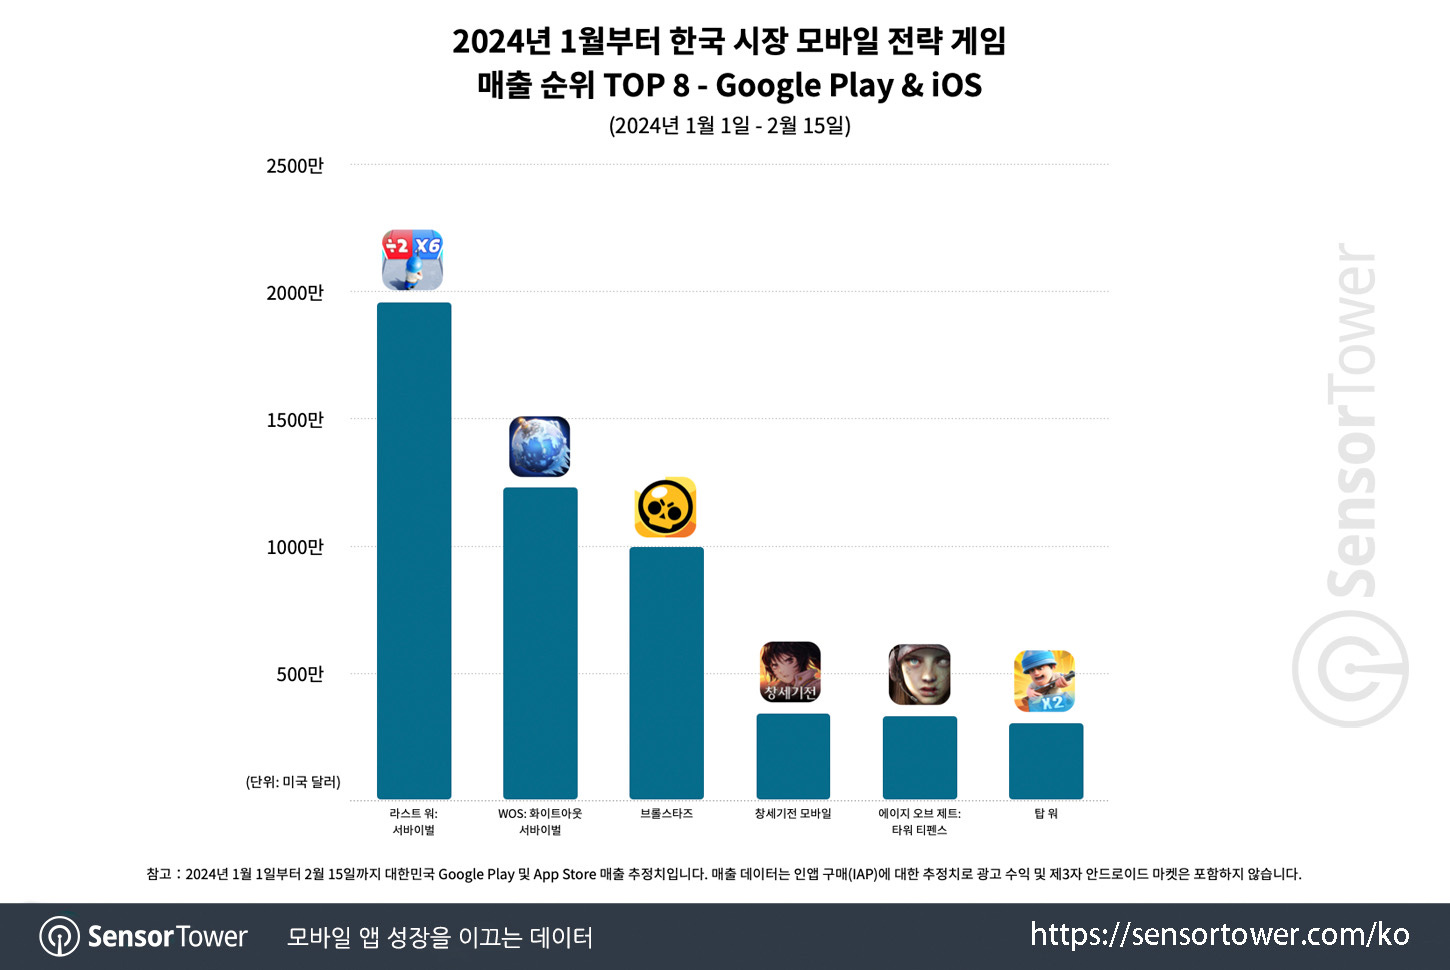
- The Last War: Survival showed the most rapid growth from July 2023 to January 2024. The project grew by 380% in monthly revenue and reached $11 million in January 2024. The game topped the chart in the first one and a half months of 2024.
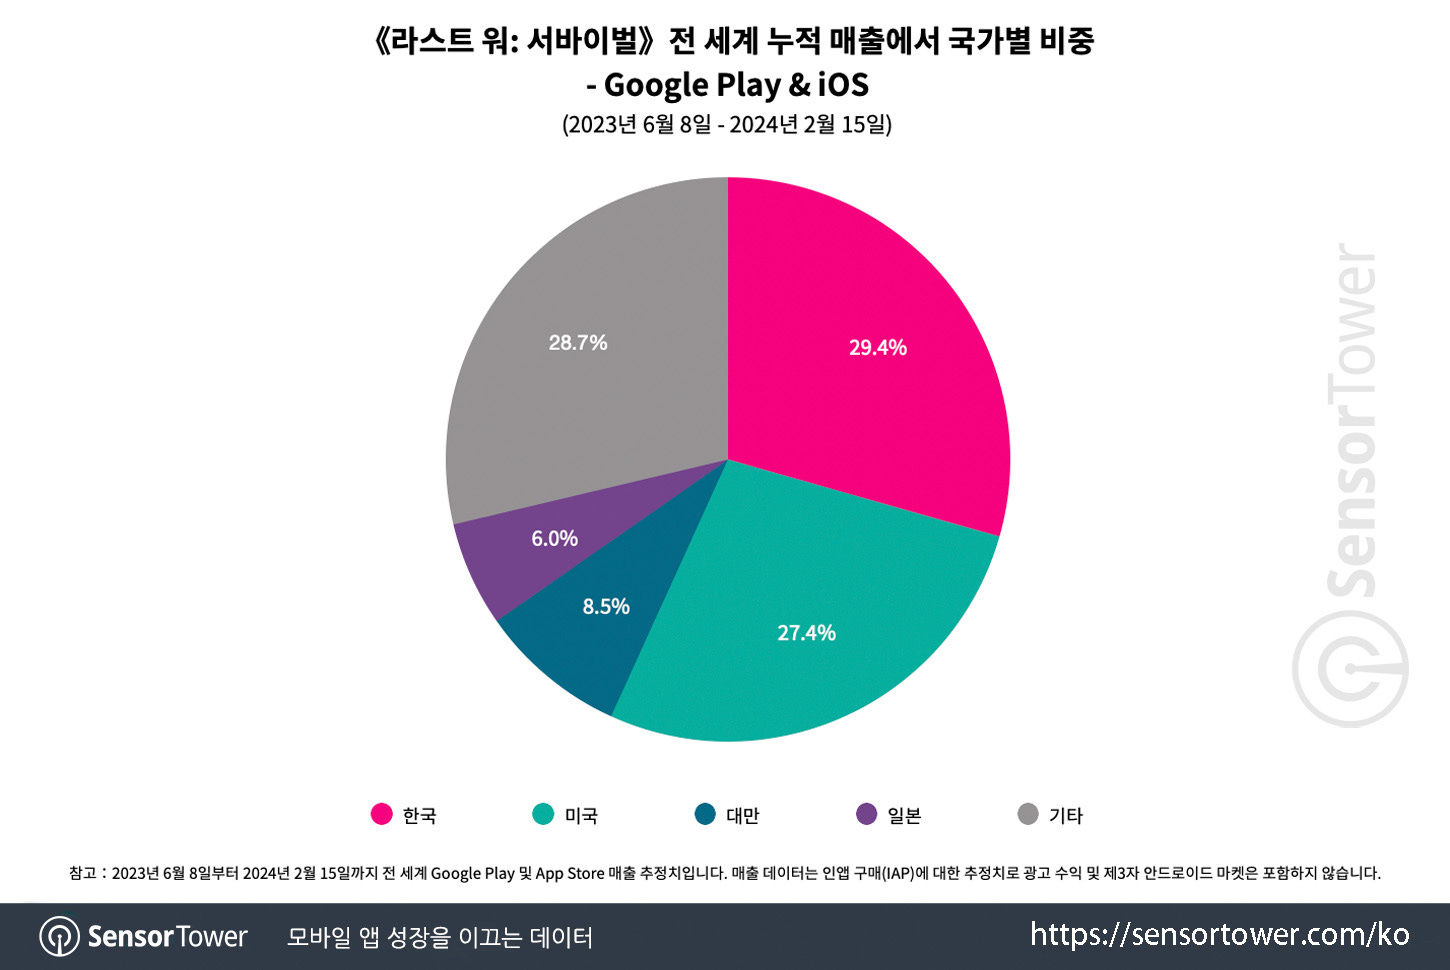
- South Korea accounts for 29.4% of all revenue from Last War: Survival. The second place is the USA (27.4%), the third is Taiwan (8.5%), the fourth is Japan (6%).
- Last War: Survival ranked in the top 3 positions for purchases on AdMob, YouTube, and TikTok in December 2023-January 2024. The project also launched TV advertising and integrated celebrities.

Ampere Analysis: EA Sports FC 24 dominates by console players engagement

The company measured how often console users launched games in January 2024.
-
Xbox owners logged into Palworld an average of 3.5 days per month. Despite the impressive launch, it can't be said that the game showed excellent player retention. However, only half of the month was taken into account (the game was released on January 19).
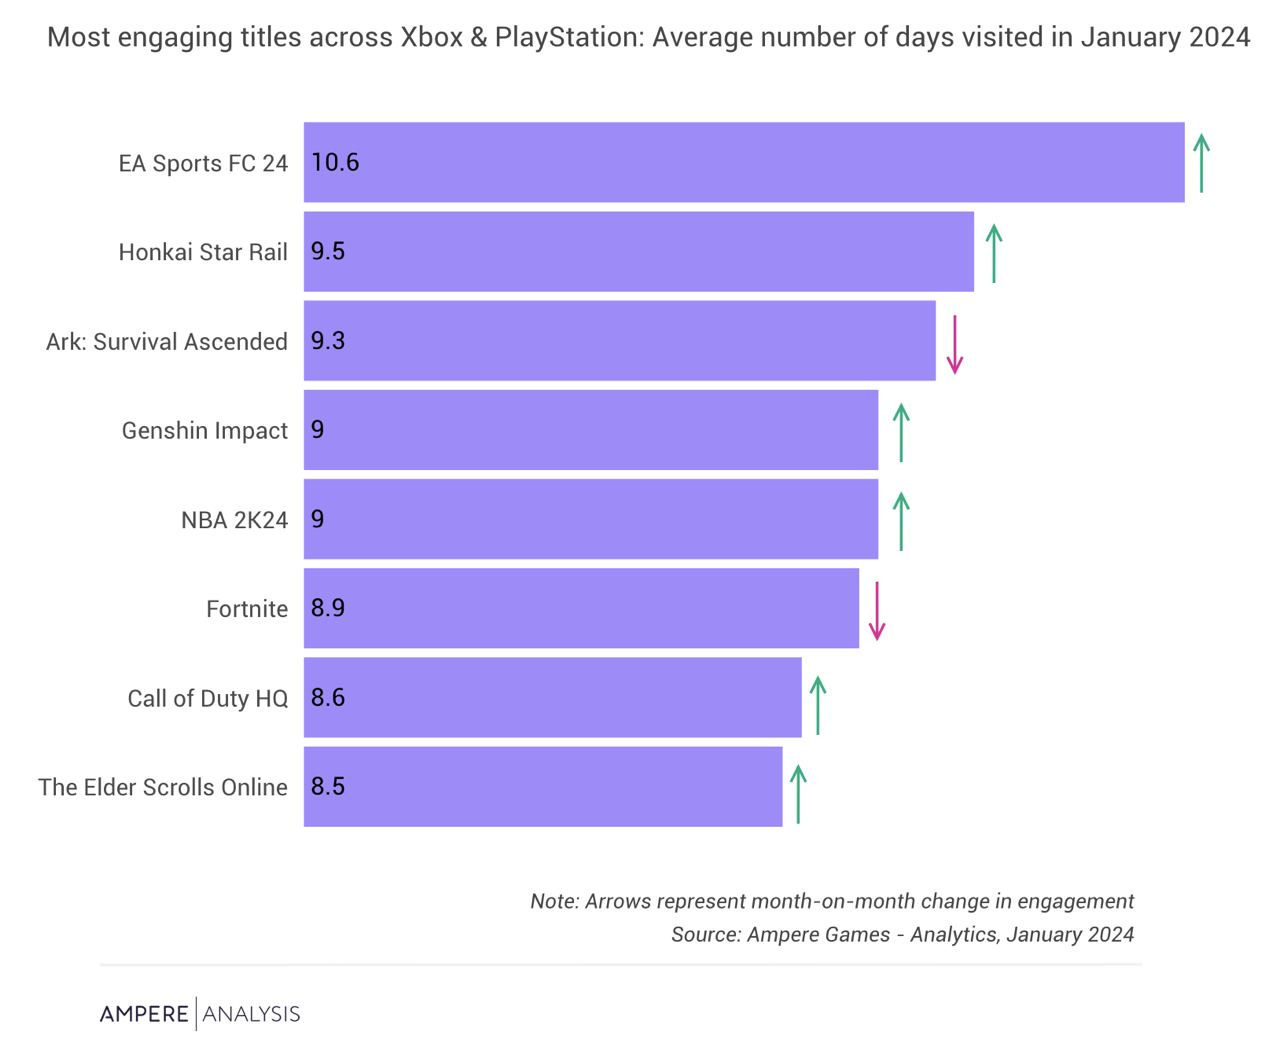
- On the other hand, in EA Sports FC 24, PlayStation and Xbox owners logged in an average of 10.6 days per month. This is the market leader. However, this is not a record - in October 2023, the game had 11.3 days.
-
Interestingly, in January, Tom Clancy’s Rainbow Six Siege showed audience growth - it increased by almost 40% compared to December 2023. At the same time, over a million players joined the game either for the first time or had not played for more than 18 months.
data.ai: Royal Match became the fastest game in history that went from $2B to $3B in Revenue

- It took the game 5 months - from October 2023 to March 2024 - to achieve this.
- The previous record was held by Clash of Clans, which reached $3 billion in revenue from $2B point in 6 months in 2015.
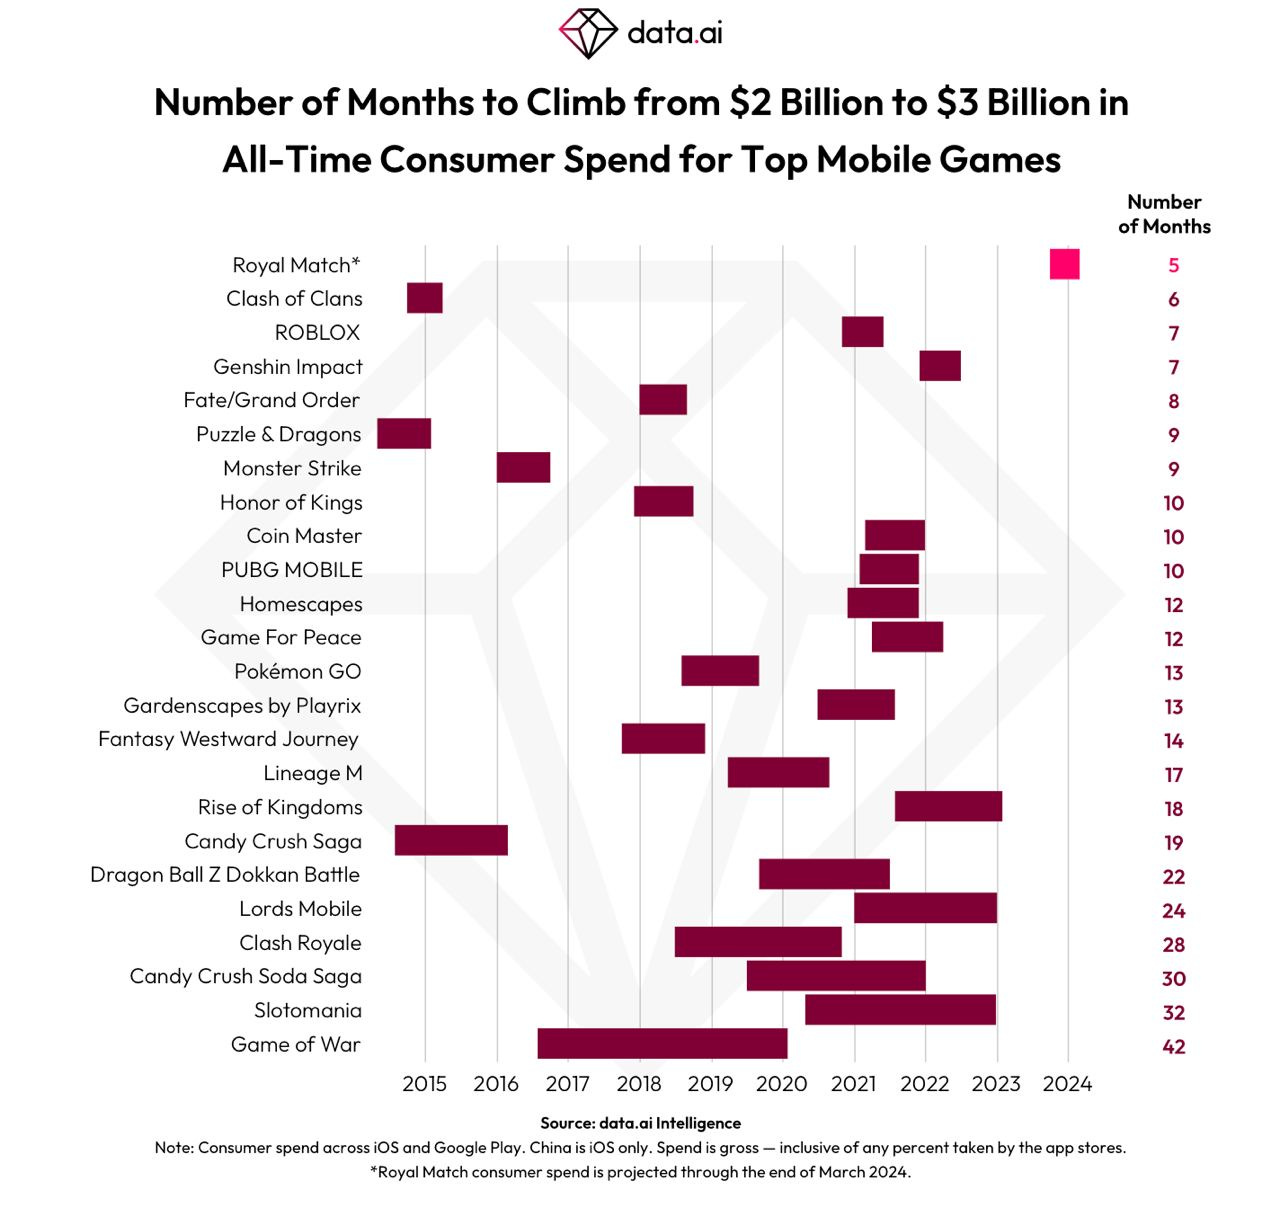
- For ROBLOX and Genshin Impact, a similar journey took 7 months.
Video Game Insights: F2P Games on Steam in 2024
VGI is a Steam analytics service. I myself often use it, and part of the functionality is free.
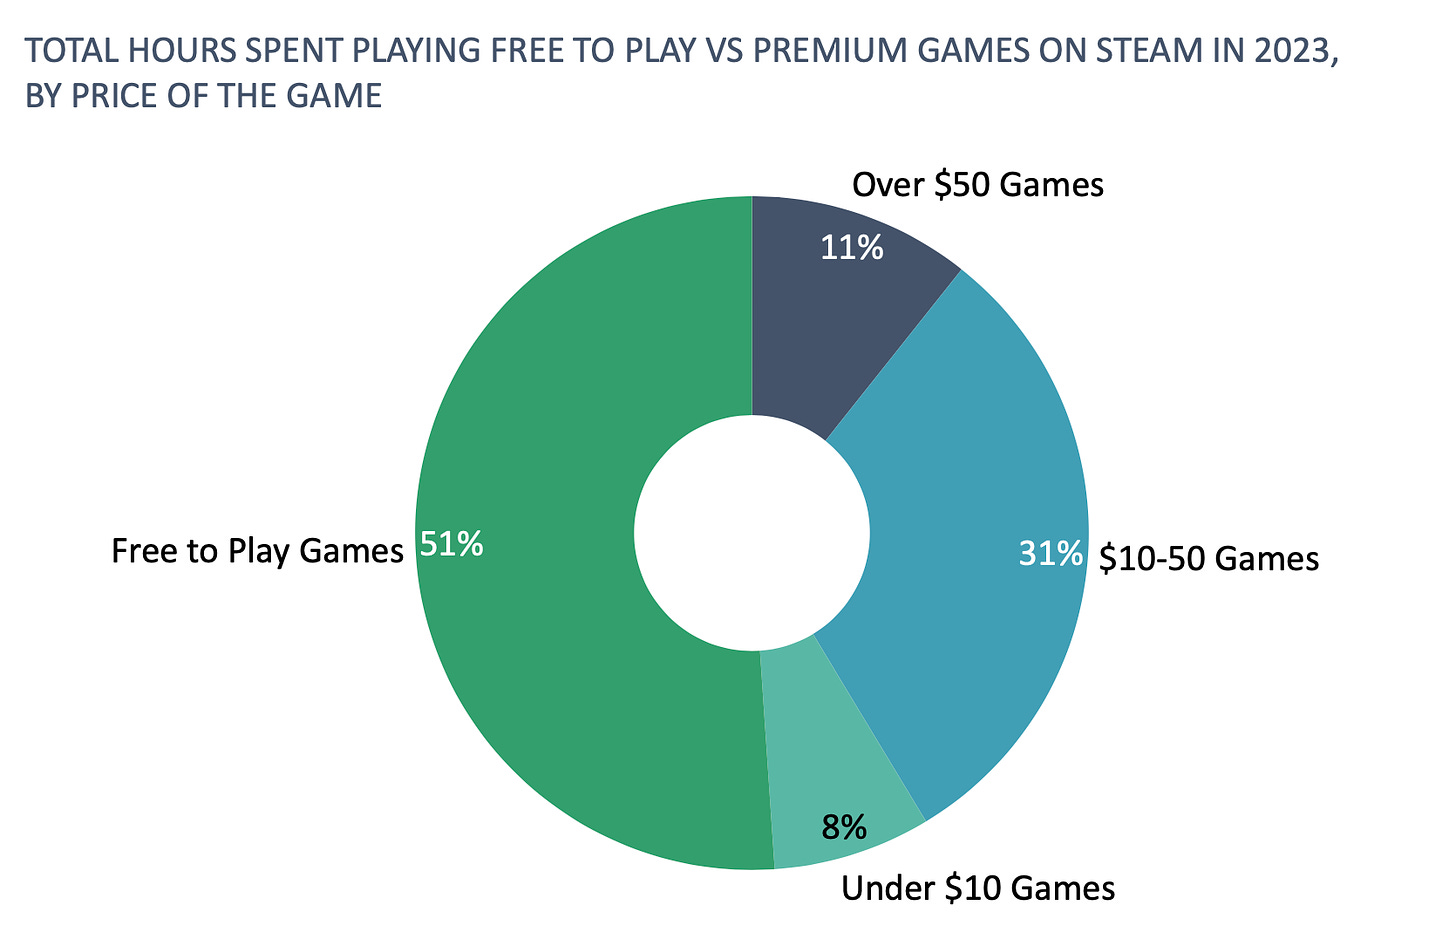
- In 2023, 51% of gamers' time on Steam was spent on F2P games. 31% on games priced from $10 to $50. 11% on games priced above $50. 8% on games priced below $10. The majority of games on Steam are Premium.
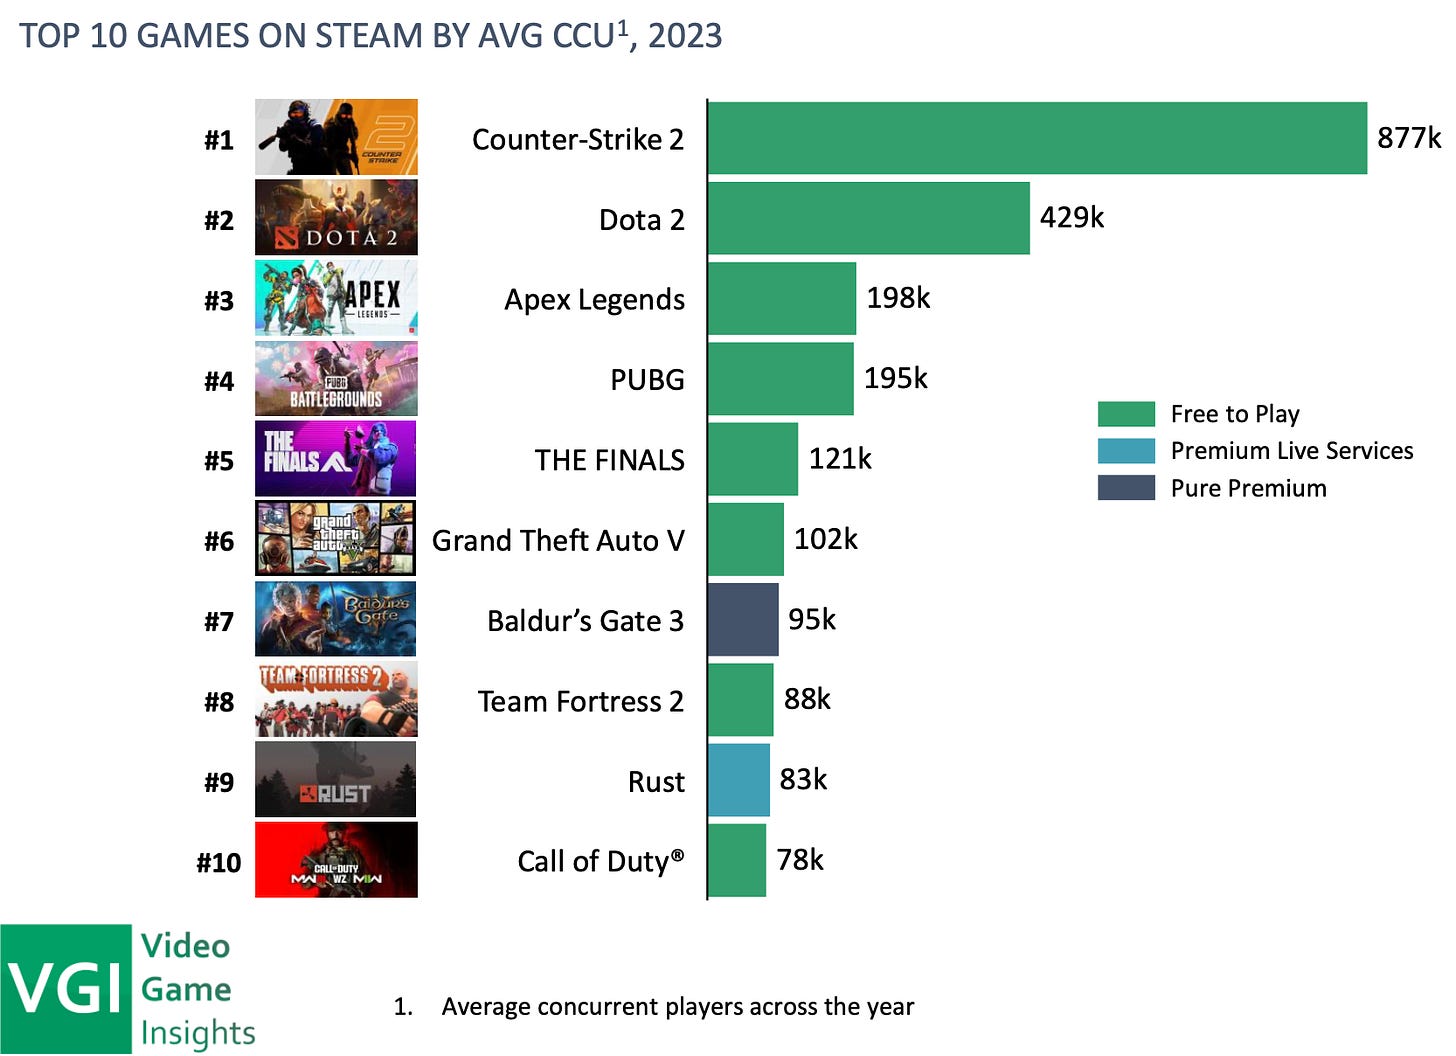
- 8 out of 10 games in 2023 in the top by average CCU were free. Counter-Strike 2 had 877 thousand peak CCU players; DOTA 2 - 429 thousand. Baldur’s Gate III - 95 thousand (the only paid game in the top 10); Rust - 83 thousand (the only paid game with a GAAS approach in the top 10).
❗️Since the data were accounted for a full year, Lethal Company, for example, did not make it into the rating.
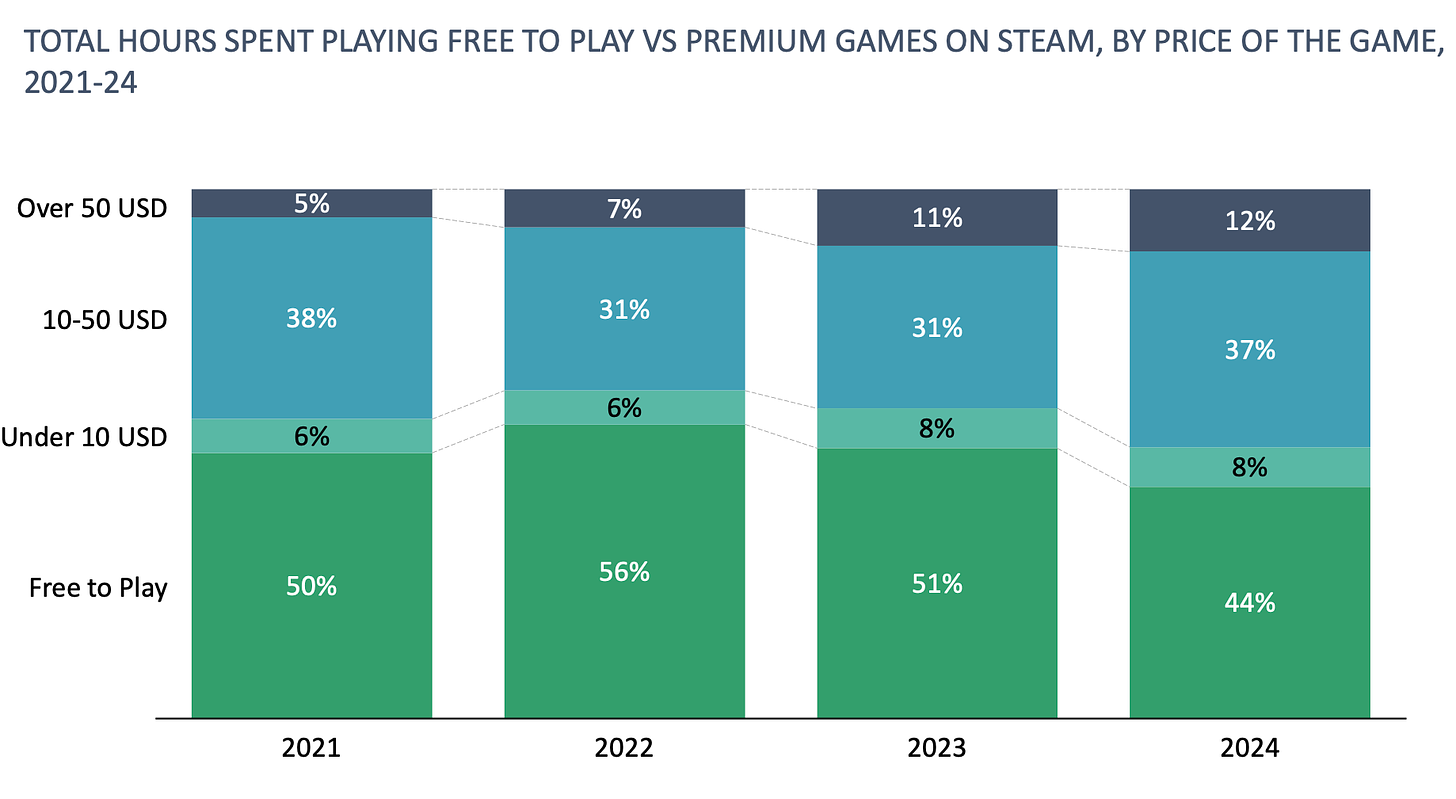
- Since 2022, F2P games have been losing their share. The time spent in free games decreased in 2023 to 51% (from 56% in 2022). And in the first few months of 2024 - to 44%. F2P games are losing to projects priced from $10 to $50 with GAAS approaches - Palworld; Helldivers II; New World. Since 2021, there has also been a significant increase in the share of AAA projects priced above $50 - partly due to the release of projects from Xbox and Sony on Steam.
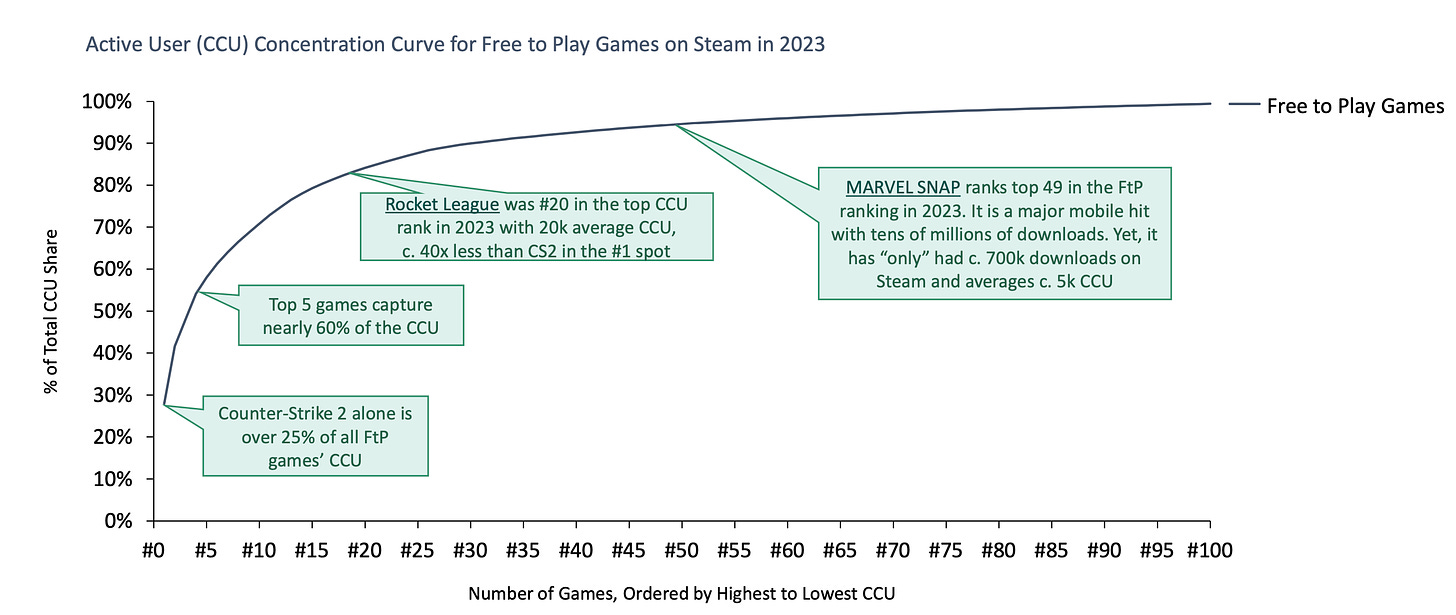
- The top 10 F2P games accumulate over 70% of users' spent time. Counter-Strike 2 accounts for 25% of all time spent by users on F2P games on Steam.
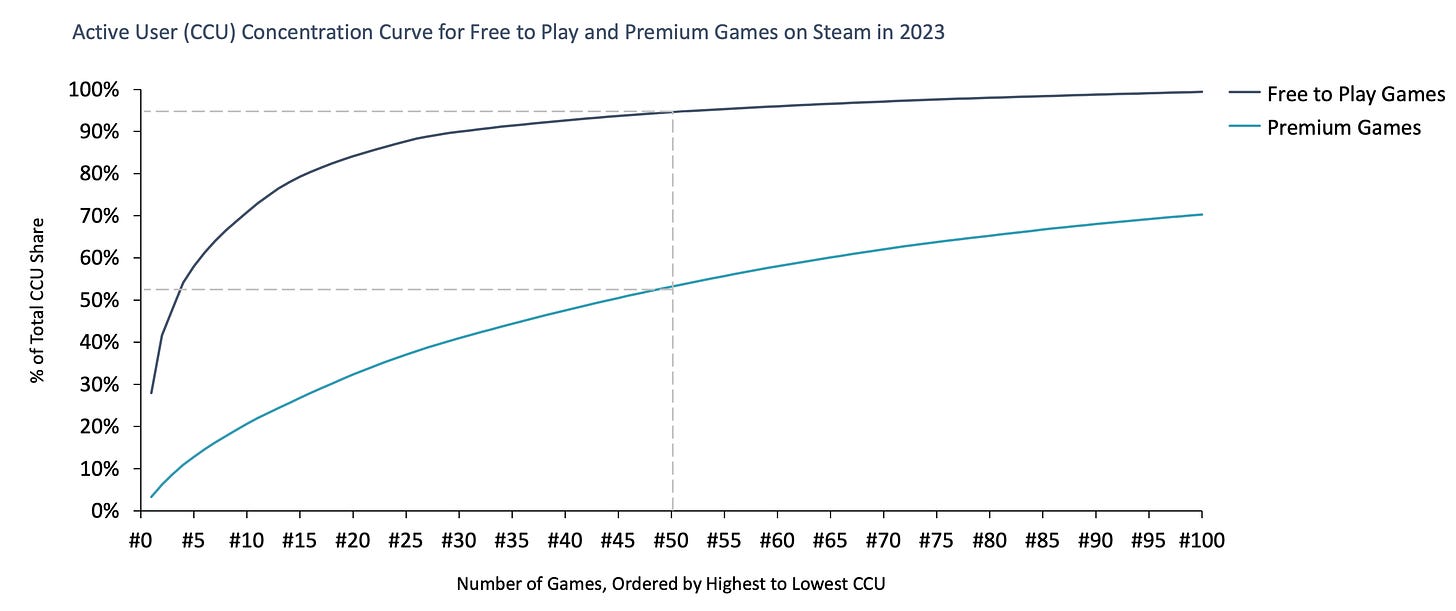
- The top 50 F2P games have 95% user engagement. Top 50 paid games - only 50%.
❗️This once again confirms that releasing an F2P game is an adventure in which the winner gets everything, and the loser is left with nothing.
- The average age of F2P games from the top 10 on Steam is 7 years.
❗️It is worth noting that the chart includes not only oldies - Team Fortress 2; Counter-Strike 2; DOTA 2; Grand Theft Auto V. There are also (relatively) new releases - The Finals (just released); Lost Ark (2 years on Steam); NARAKA: Bladepoint (3 years).
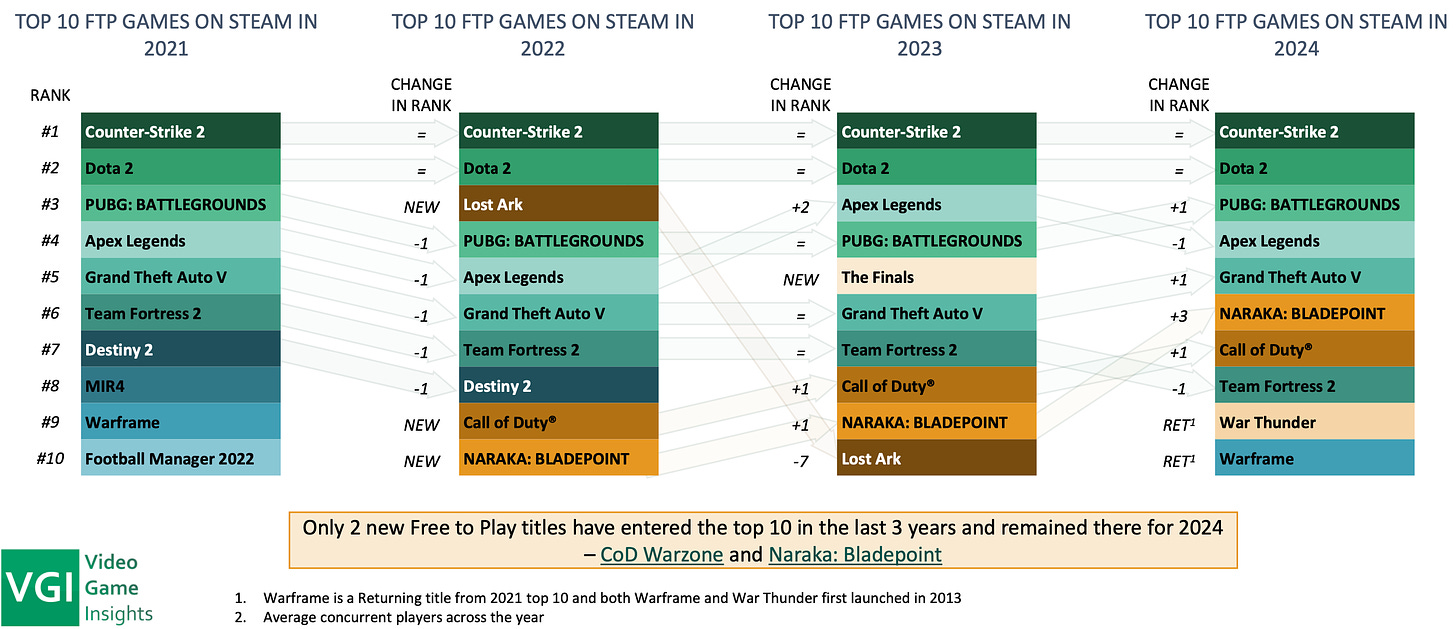
-
However, over the past 3 years, only 2 new F2P games have entered the top charts in Steam by CCU, which remained there in 2024 - Call of Duty: Warzone and NARAKA: Bladepoint.
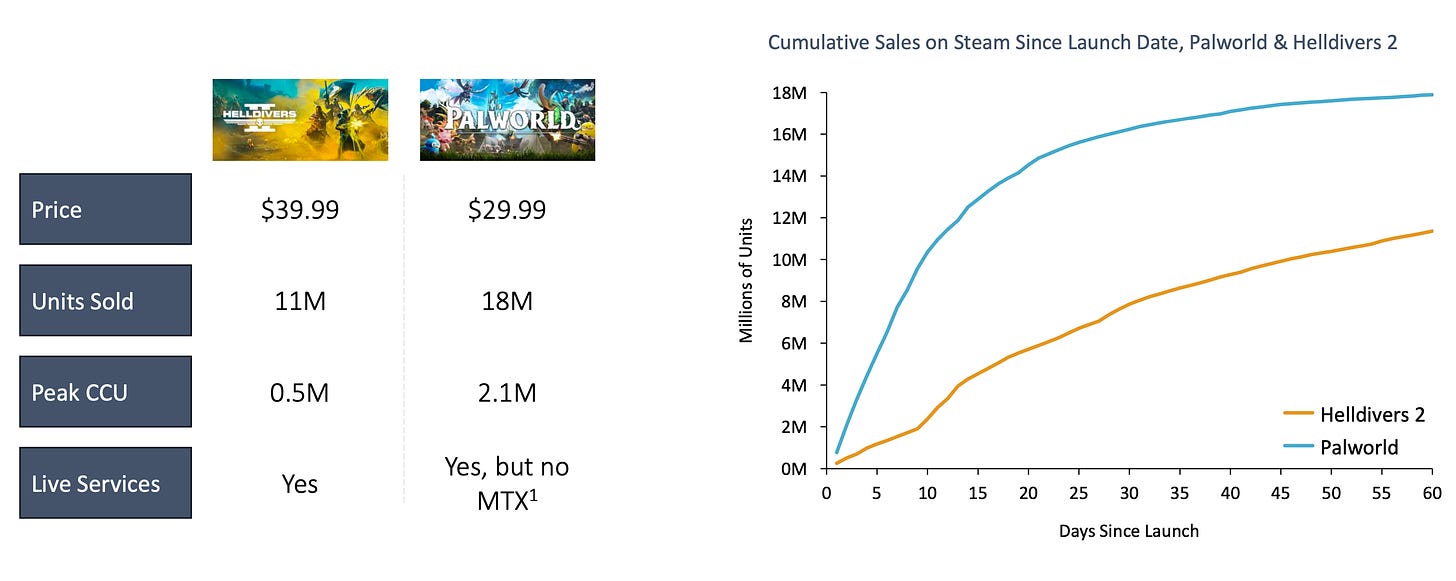
- Examples like Helldivers II and Palworld show that it is not necessary to release a free game to launch a game with a large audience. Helldivers II sales are estimated at 11 million copies; Palworld - at 18 million.
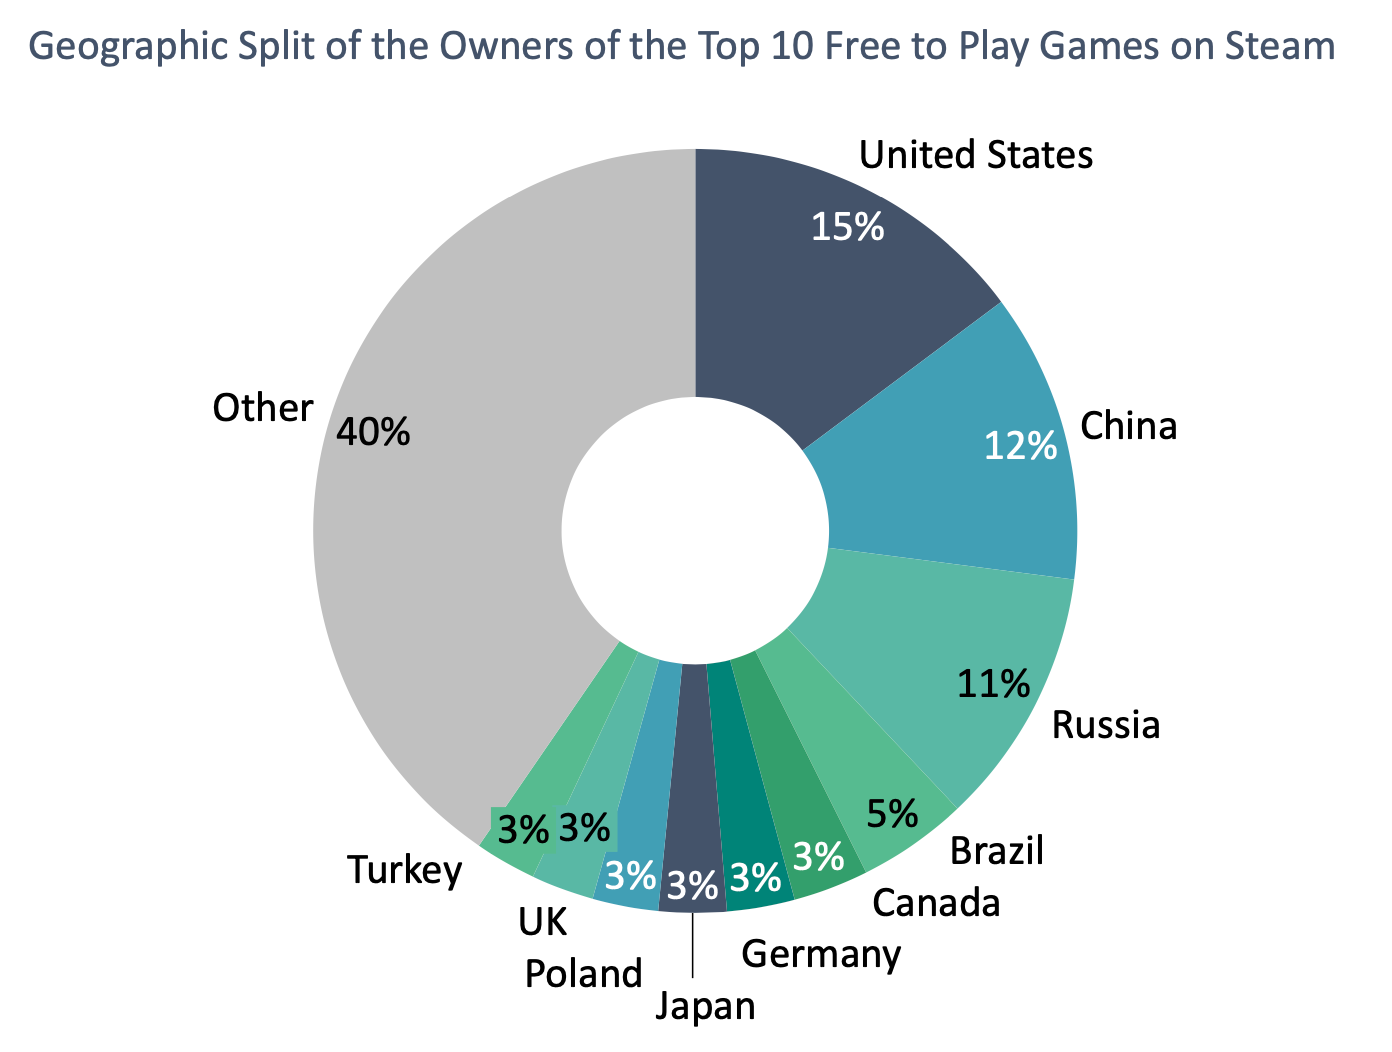
- The United States (15%), China (12%), and Russia (11%) are the main countries for F2P games on Steam.
ABRA Games: Brazilian Gaming Industry in 2023

❗️In the report - besides the classic gaming companies - developers of educational games, "serious” games are also featured. Therefore, the picture becomes a bit blurry. It is worth taking it with a grain of skepticism.
State of the Brazilian gaming market
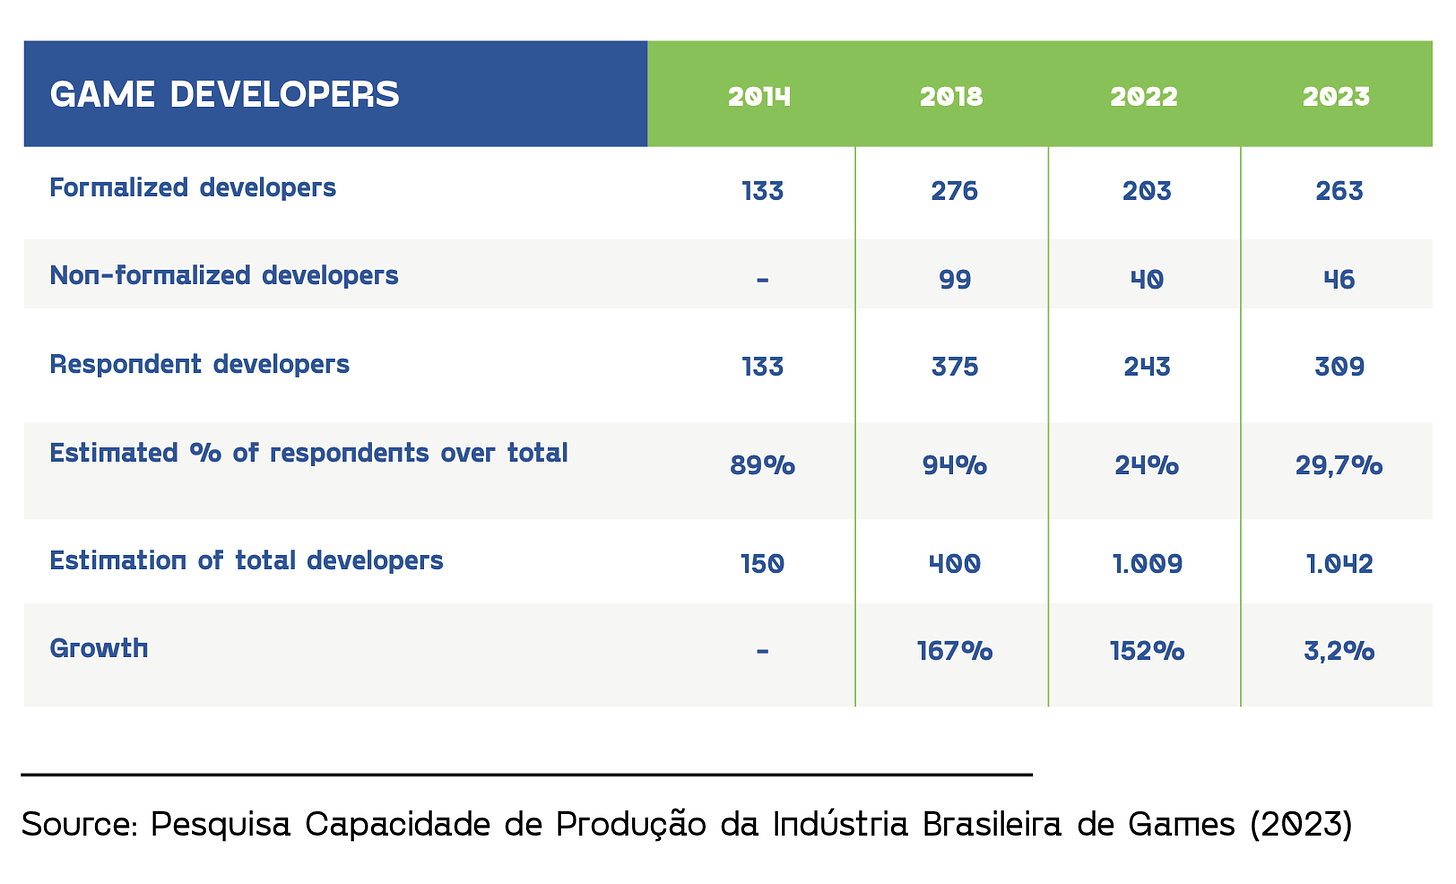
- Industry surveys show that by the end of 2023, 1042 gaming companies were operating in Brazil. This includes all studios showing activity - being part of associations, having games on accounts, having legal entities, and so on.
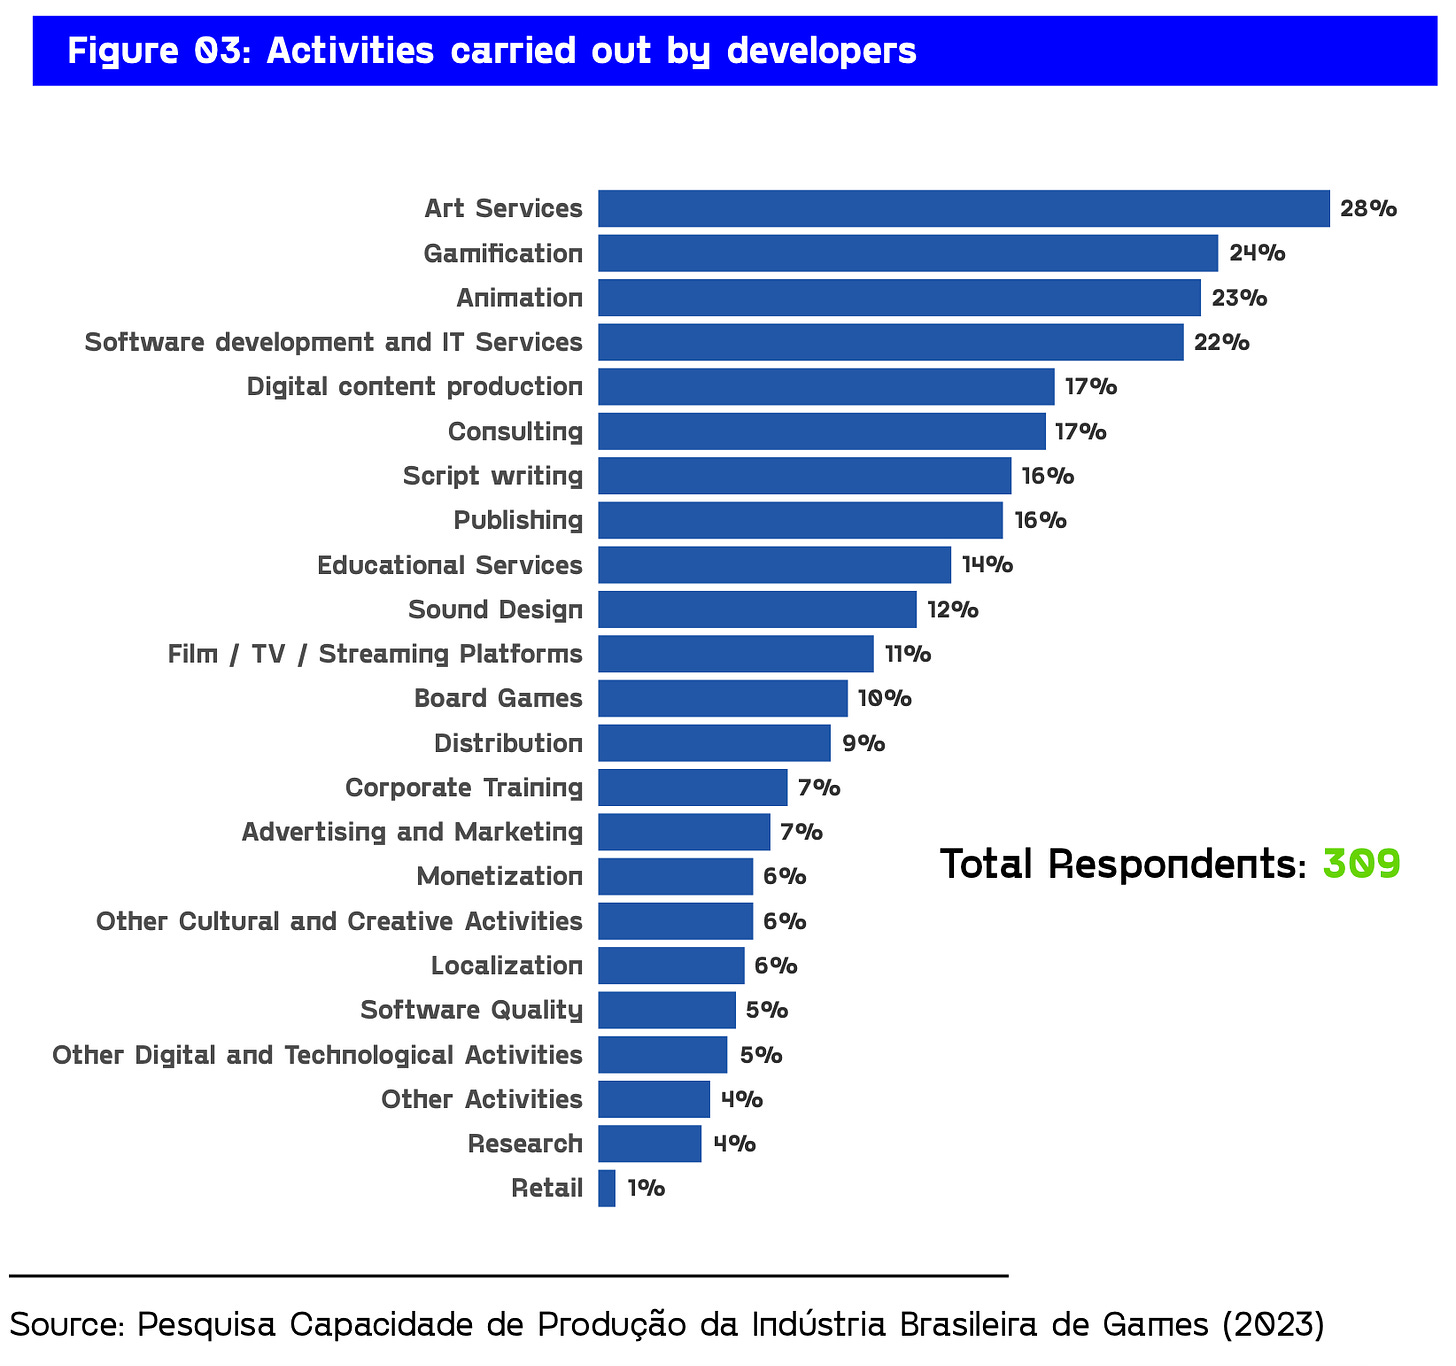
- 309 gaming companies participated in the ABRA Games survey. 98 of them were exclusively involved in game development; 211 were also engaged in other activities. Mainly - art outsourcing (28%); gamification (24%); animations (23%).
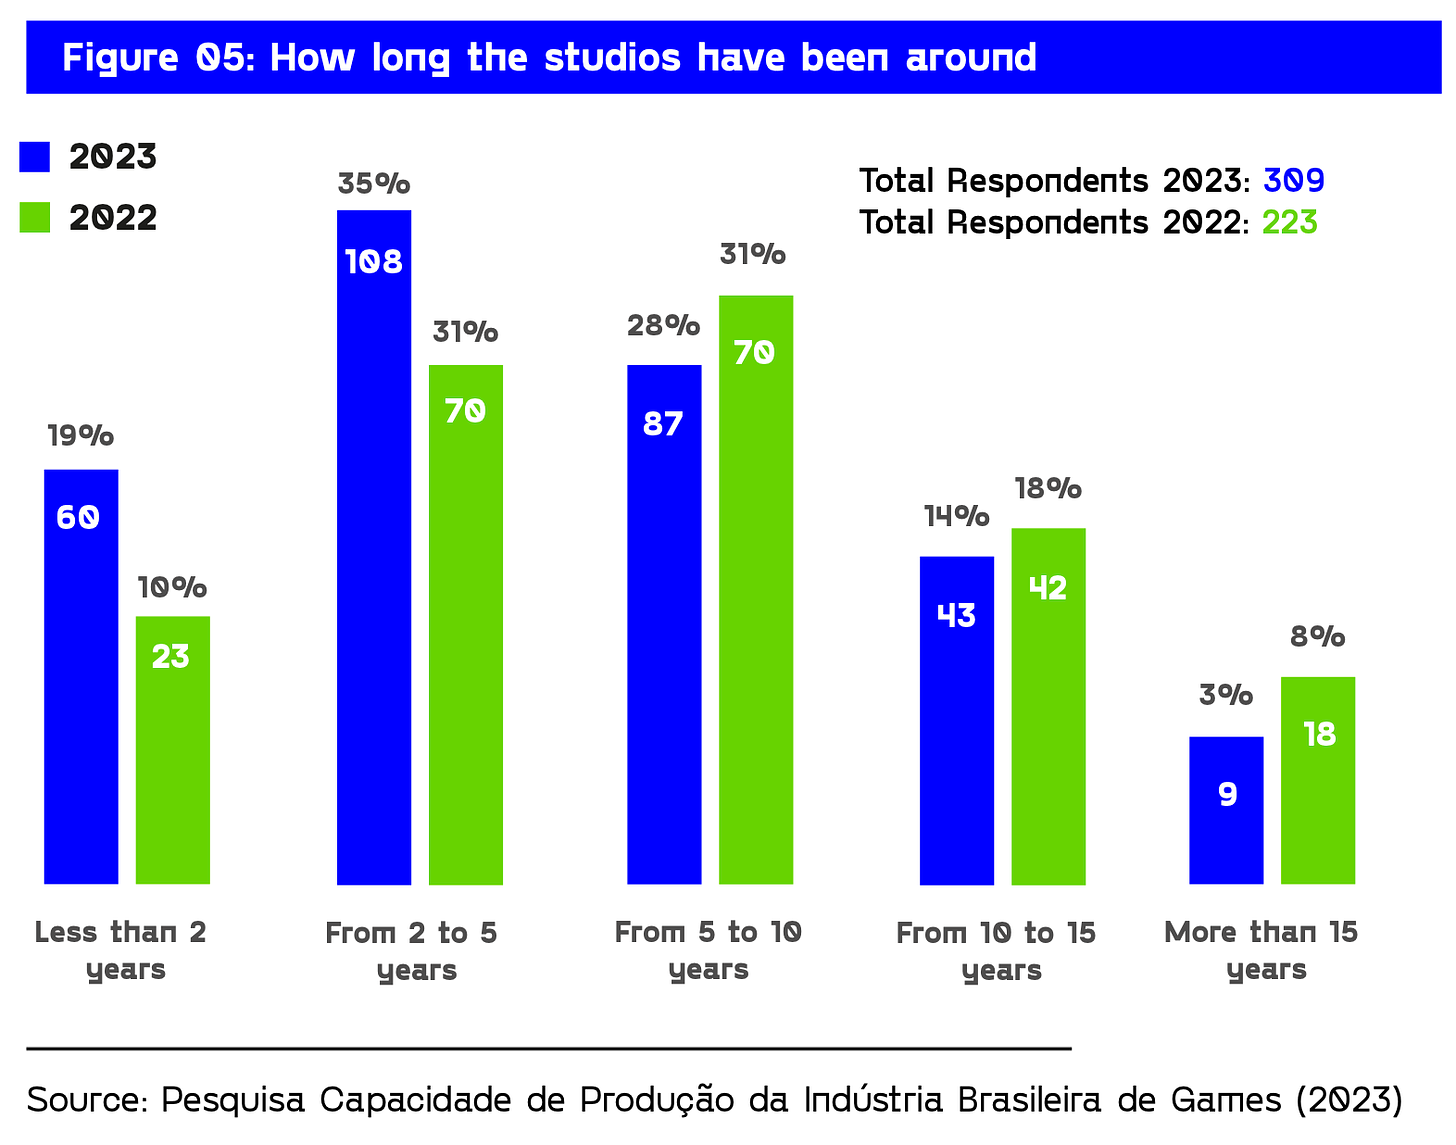
- 3% of companies in the Brazilian market have been in existence for over 15 years; 14% - from 10 to 15 years; 28% - from 5 to 10 years; 35% - from 2 to 5 years; 19% - less than 2 years.
❗️The percentage of mature companies present in the market for more than 5 years decreased in 2023 compared to 2022. ABRA Games notes that this may be due to sample peculiarities - in 2023, some companies did not participate in surveys due to investment deals.
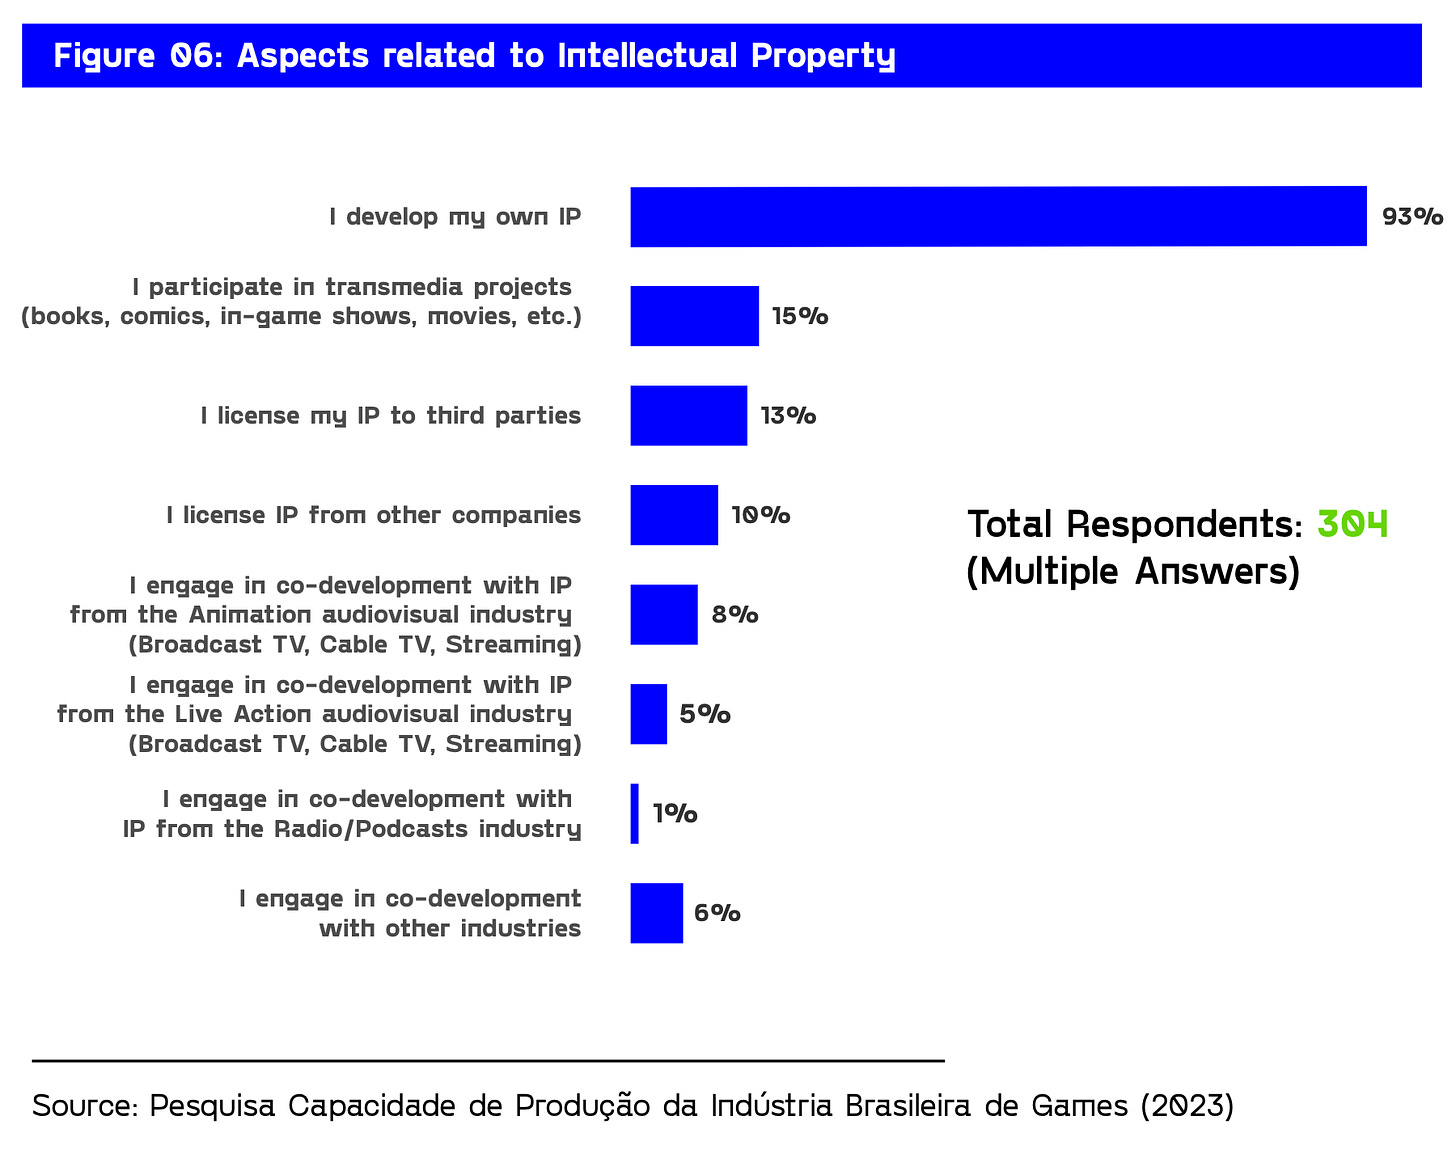
- 93% of Brazilian developers work on their own IP. 15% work on transmedia projects; 13% - on the IP of other companies; 10% - license external IP.
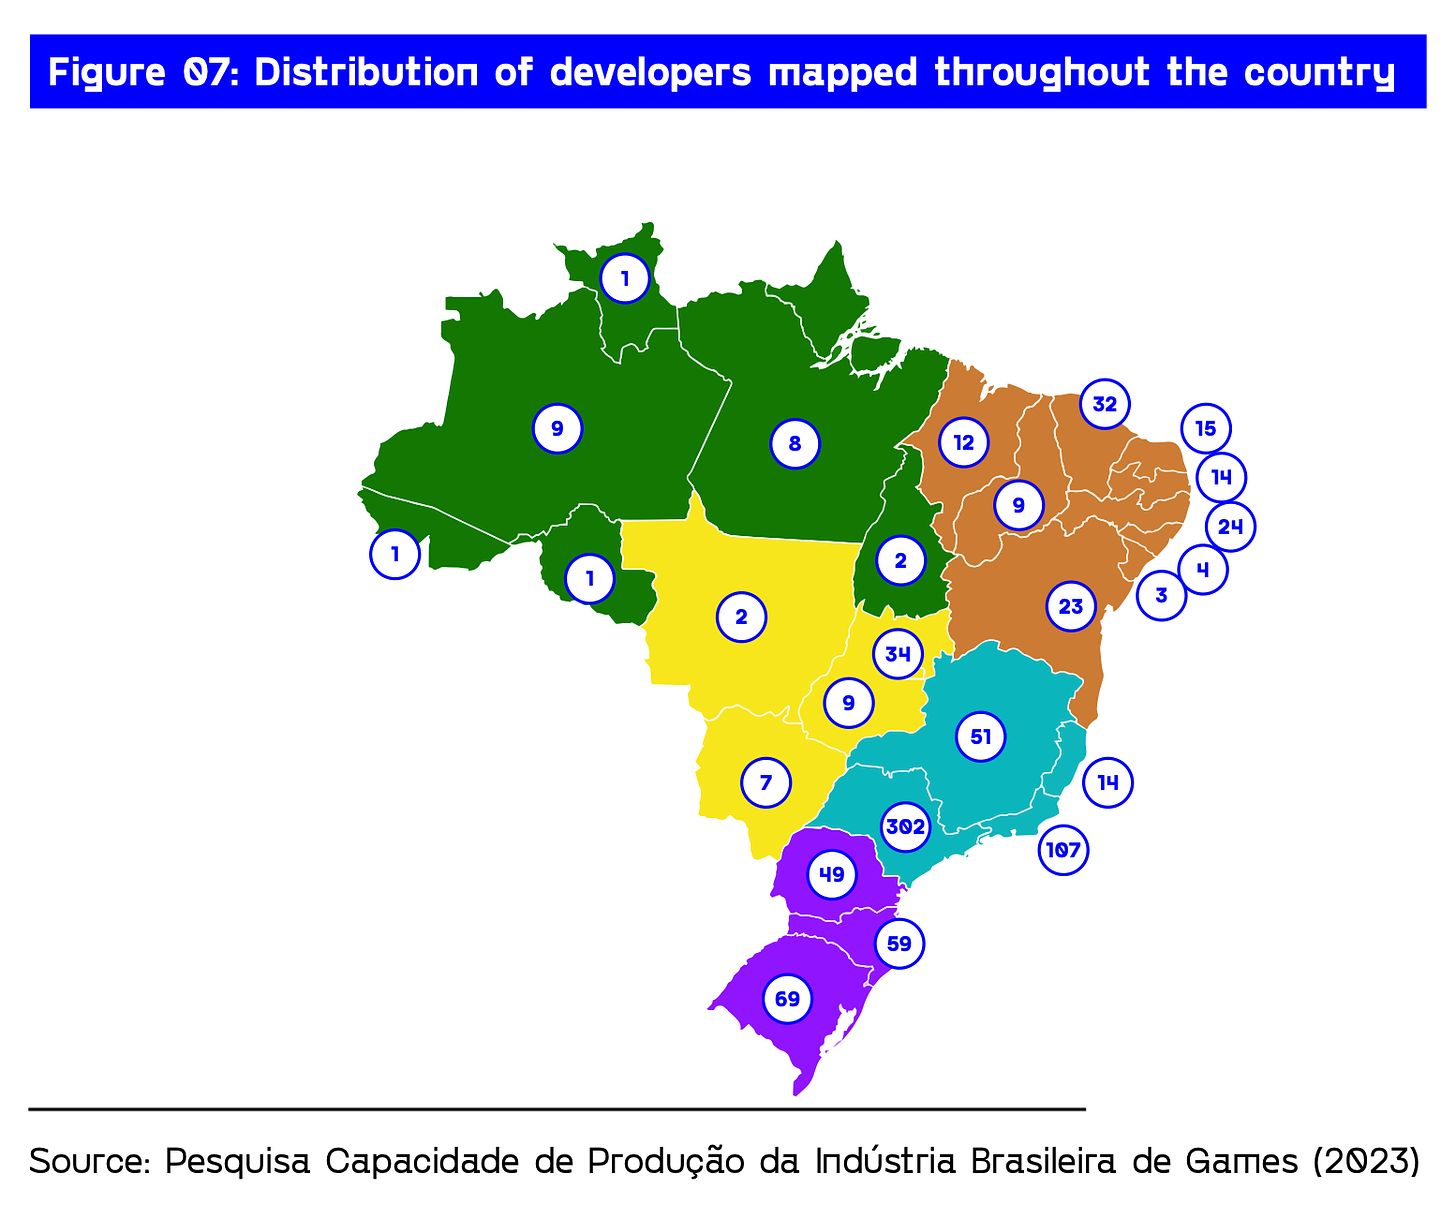
- Most game companies in Brazil are located in São Paulo (302) and Rio de Janeiro (107).
Games from Brazilian developers
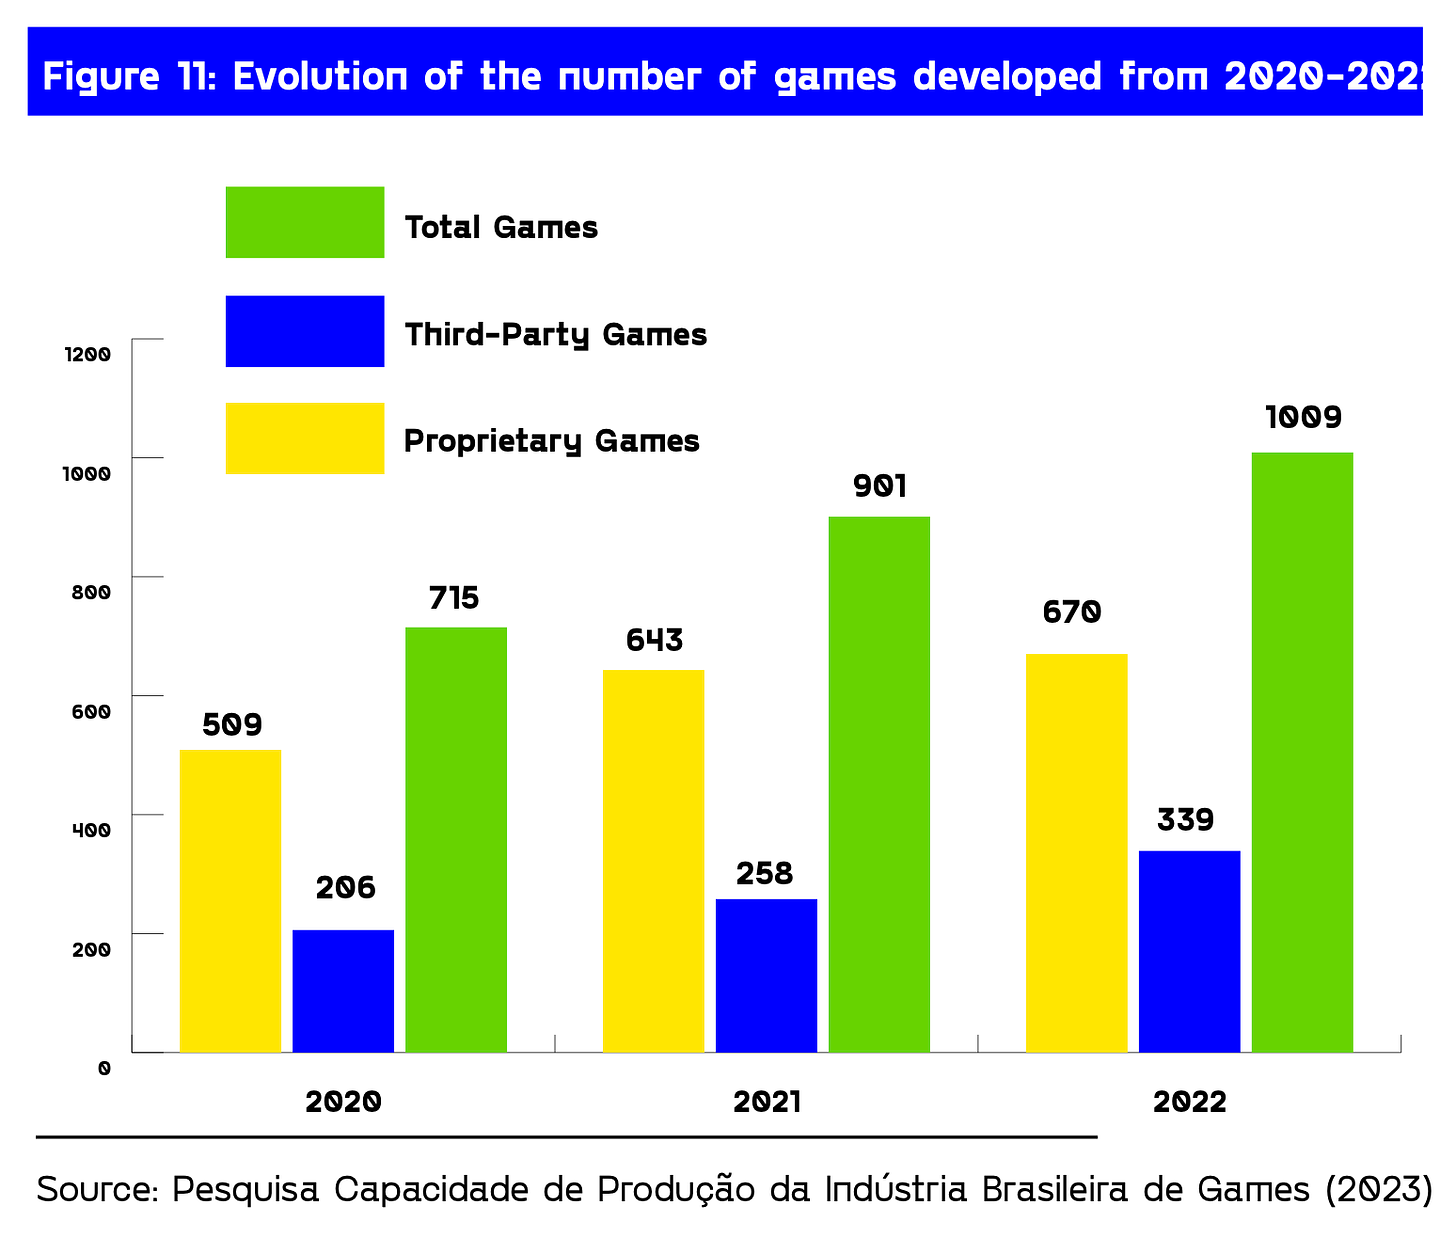
- The number of released games is increasing. In 2022, 1009 projects were released by Brazilian developers. For comparison, in 2020 there were 715.

58% of developed games in 2022 are games in the classical sense. 18% - "branded" games (Advergames); 17.5% - educational games.

❗️A significant share of games for brands and educational projects looks atypical. Perhaps, it's the market's specificity.
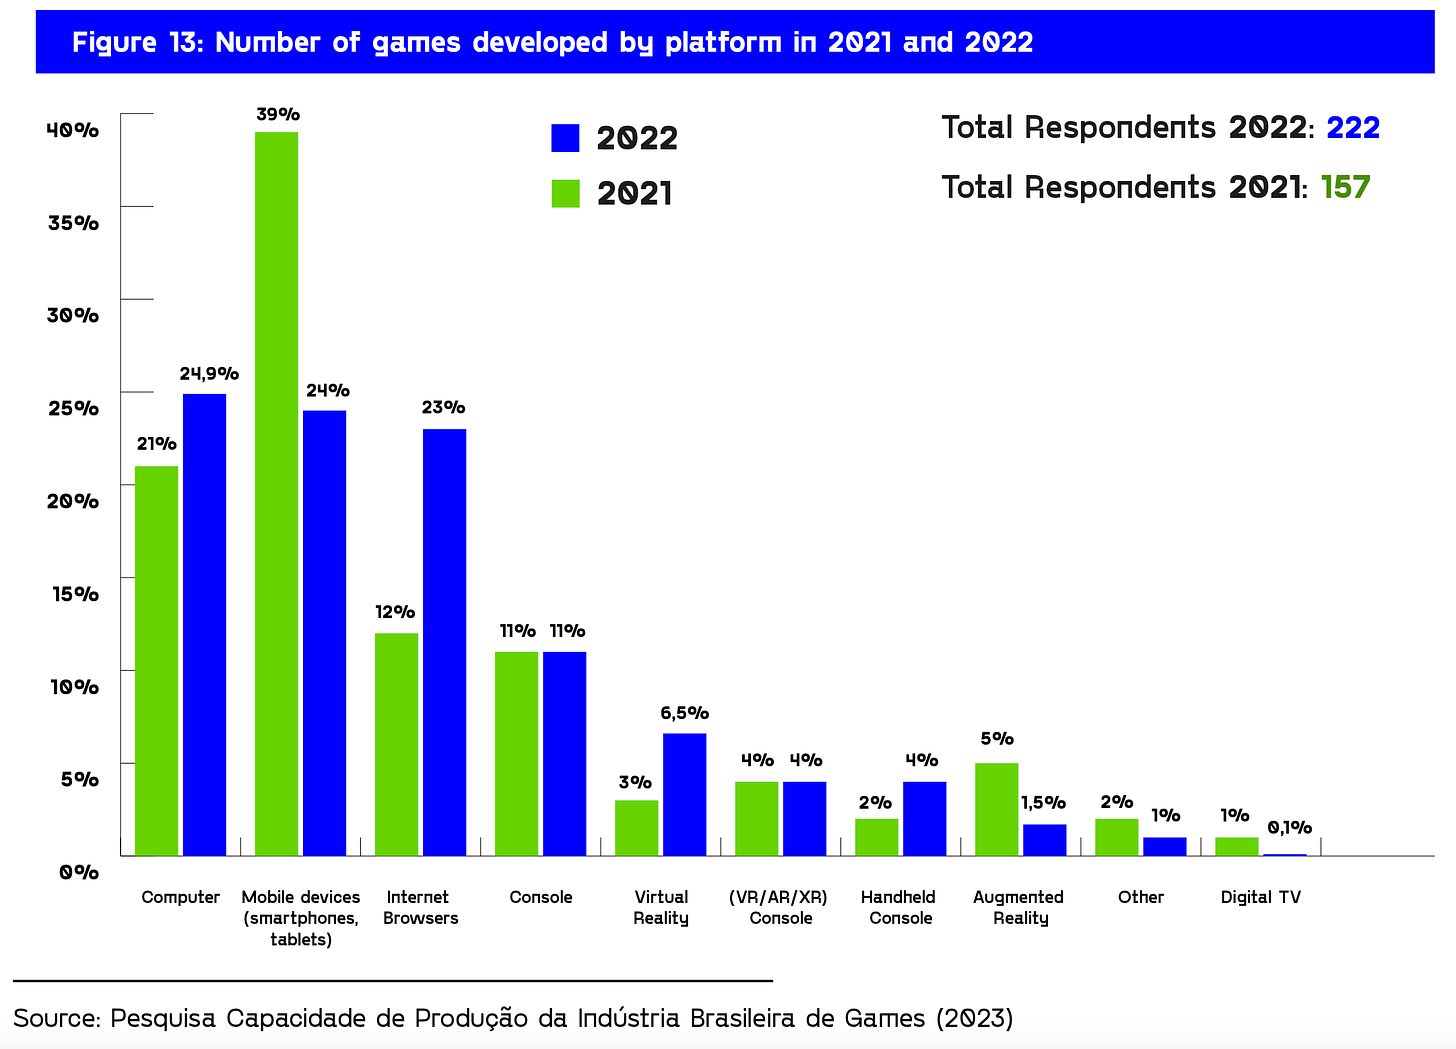
- 25% of projects are developed for PC; 25% - for smartphones; 23% - for the web; 18% - for consoles; 8% - for VR/AR devices.
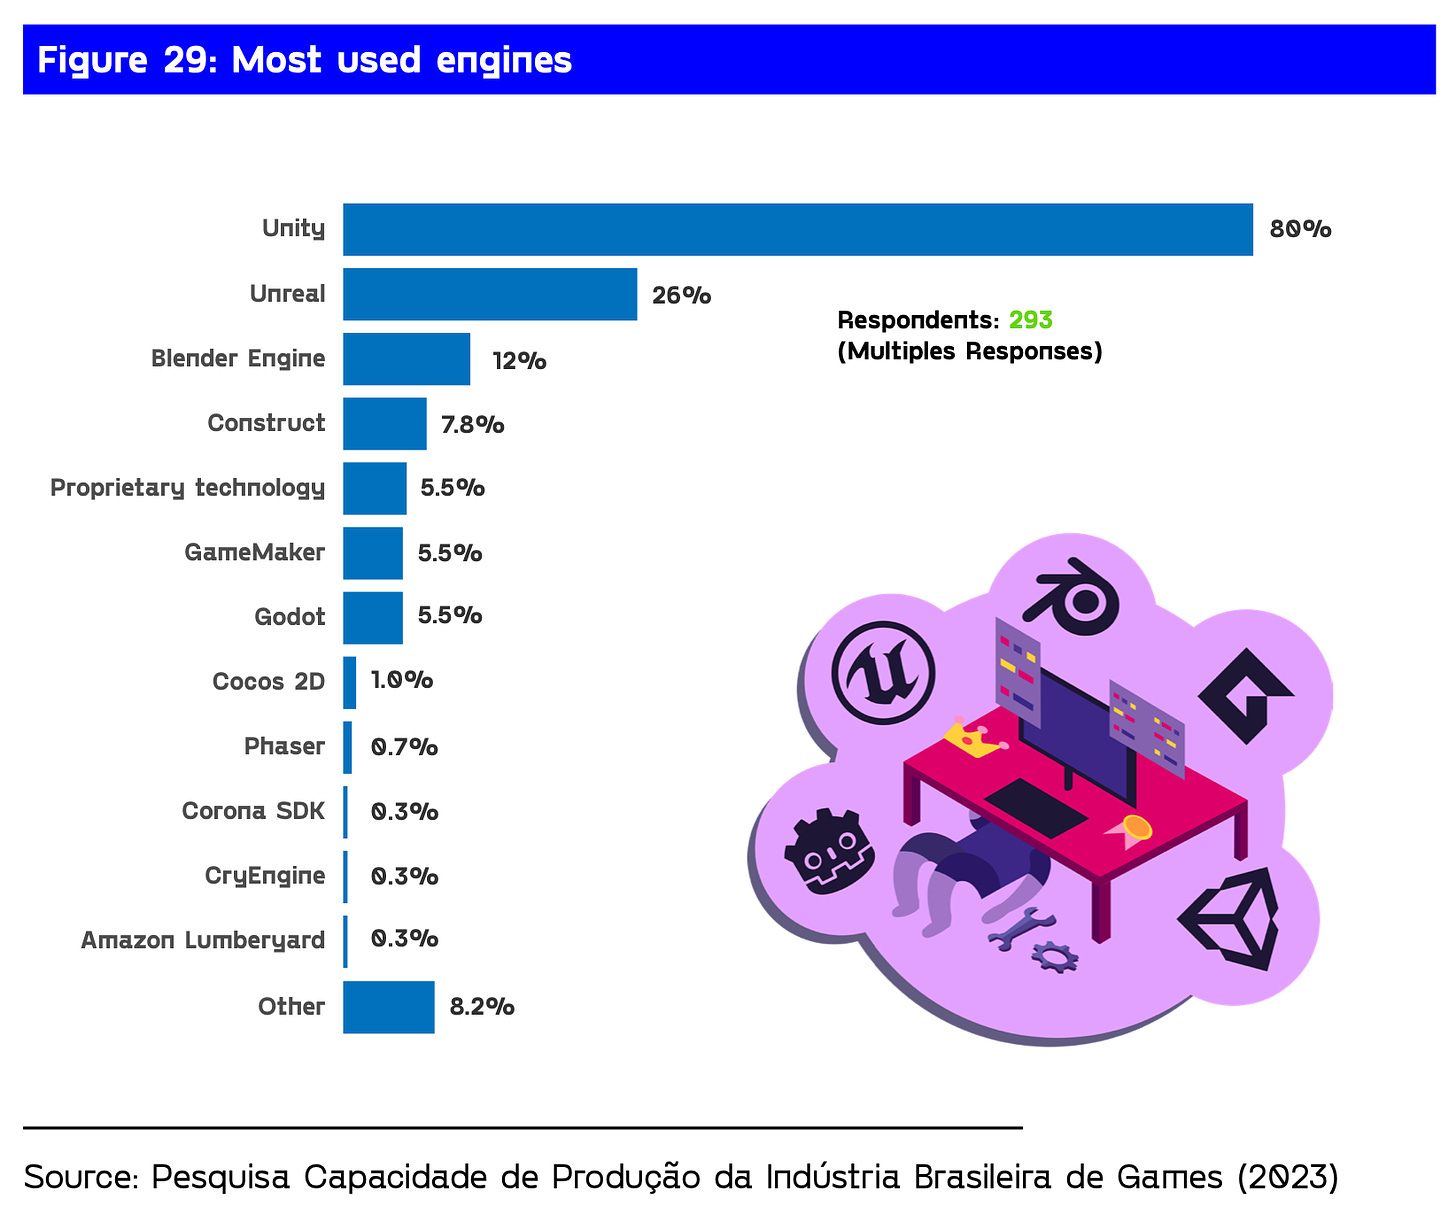
- 80% of studios work on Unity; 26% - on Unreal Engine; 7.8% use Construct; 5.5% - GameMaker; 5.5% - Godot.
People in the Brazilian gaming industry
-
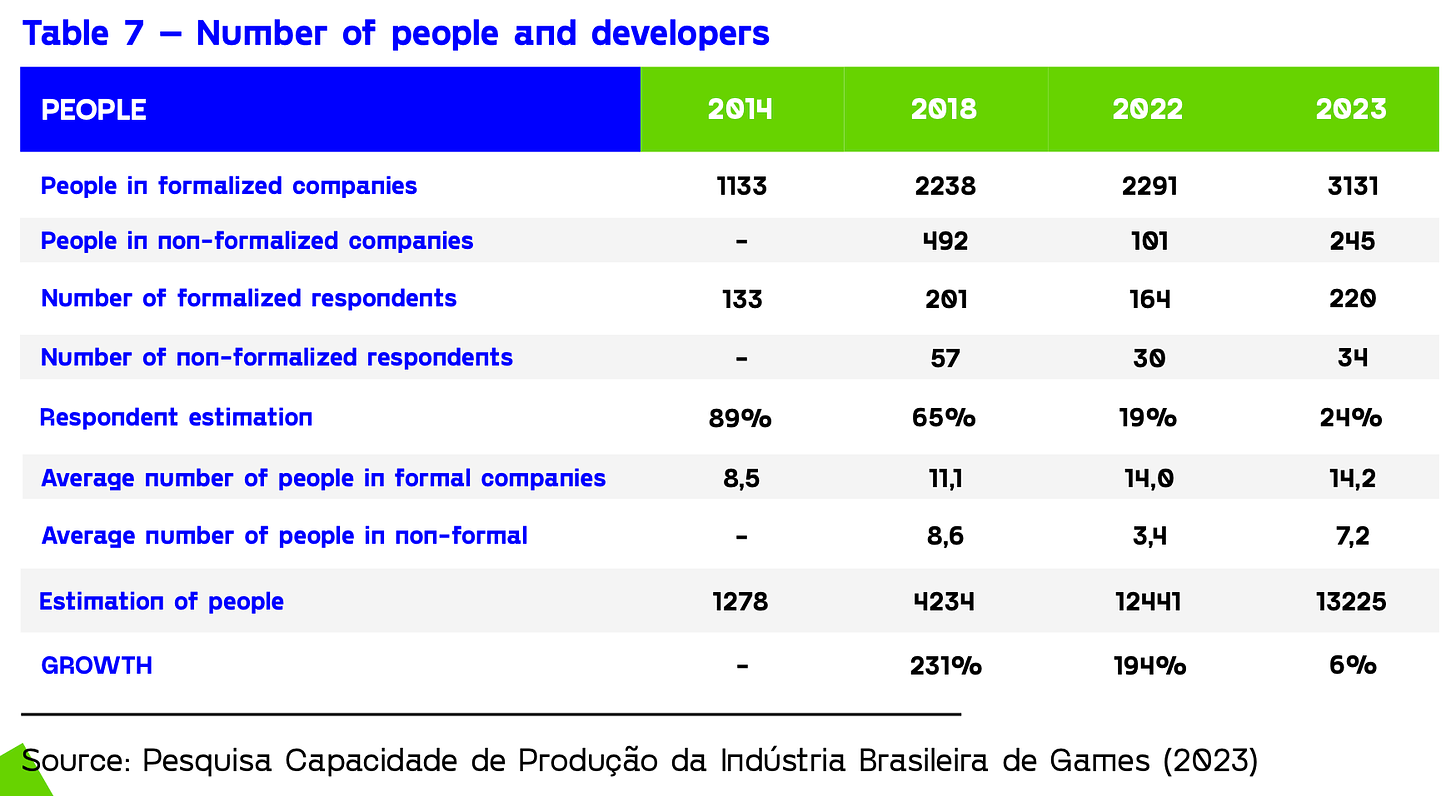
According to ABRA Games estimates, 13,225 people are working in the gaming industry in Brazil. Growth compared to last year is 6%.
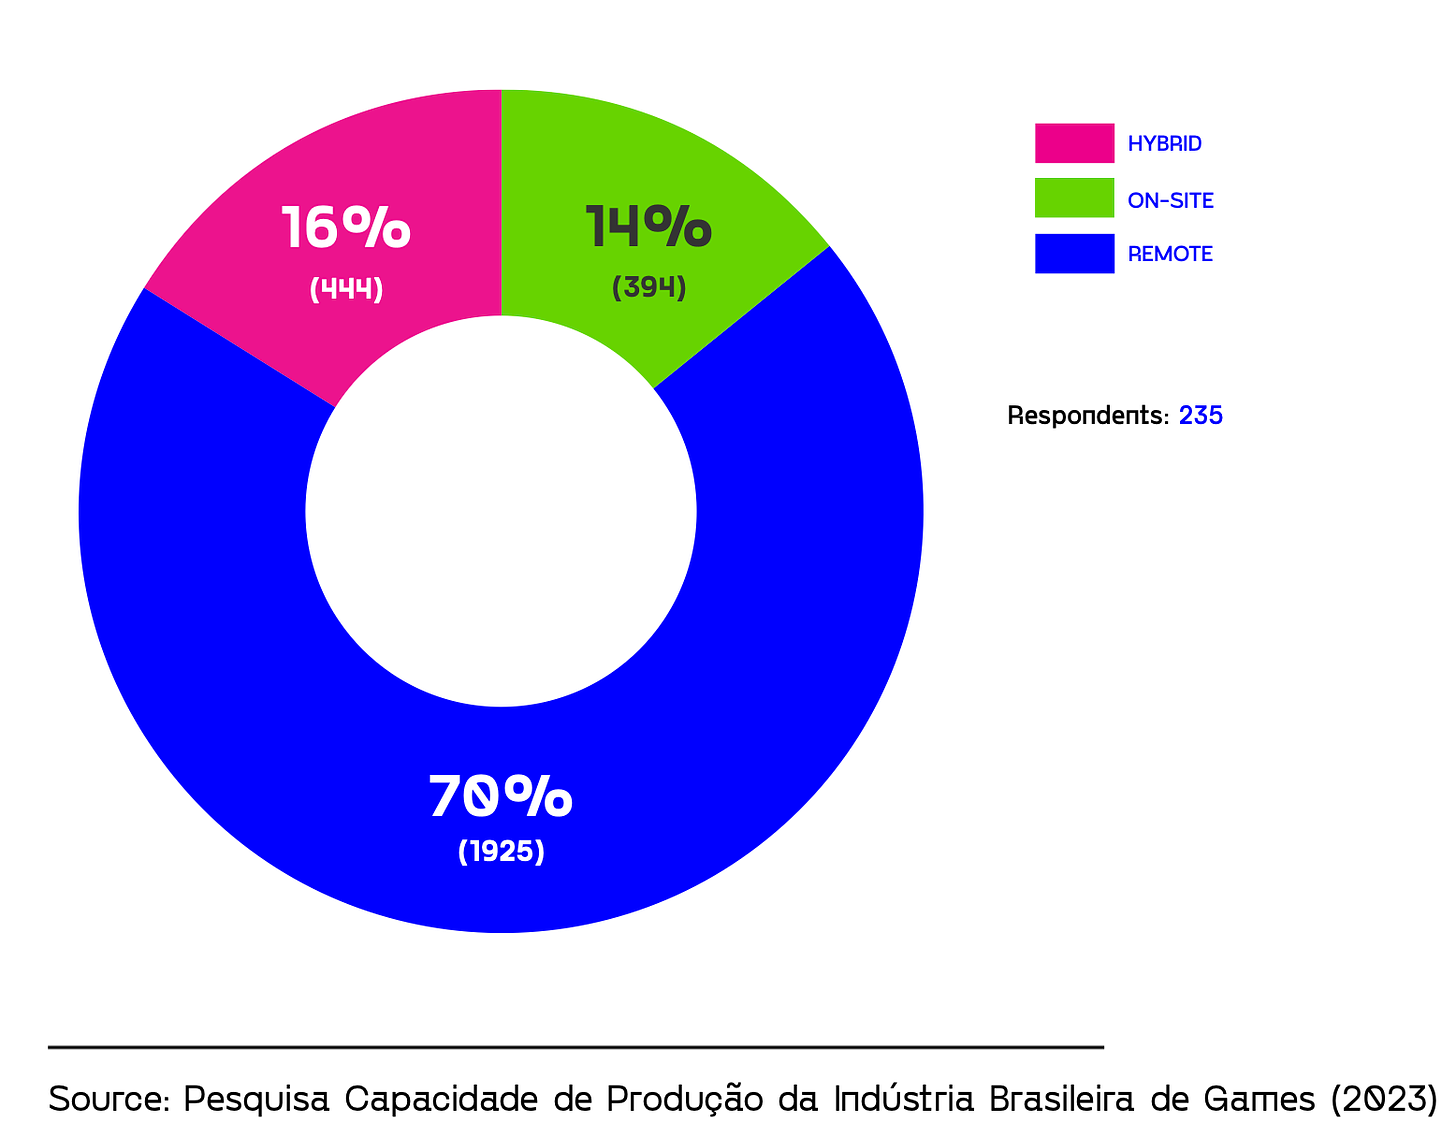
- 70% of employees in Brazil work remotely; 16% - in a hybrid format; 14% - in the office.
-
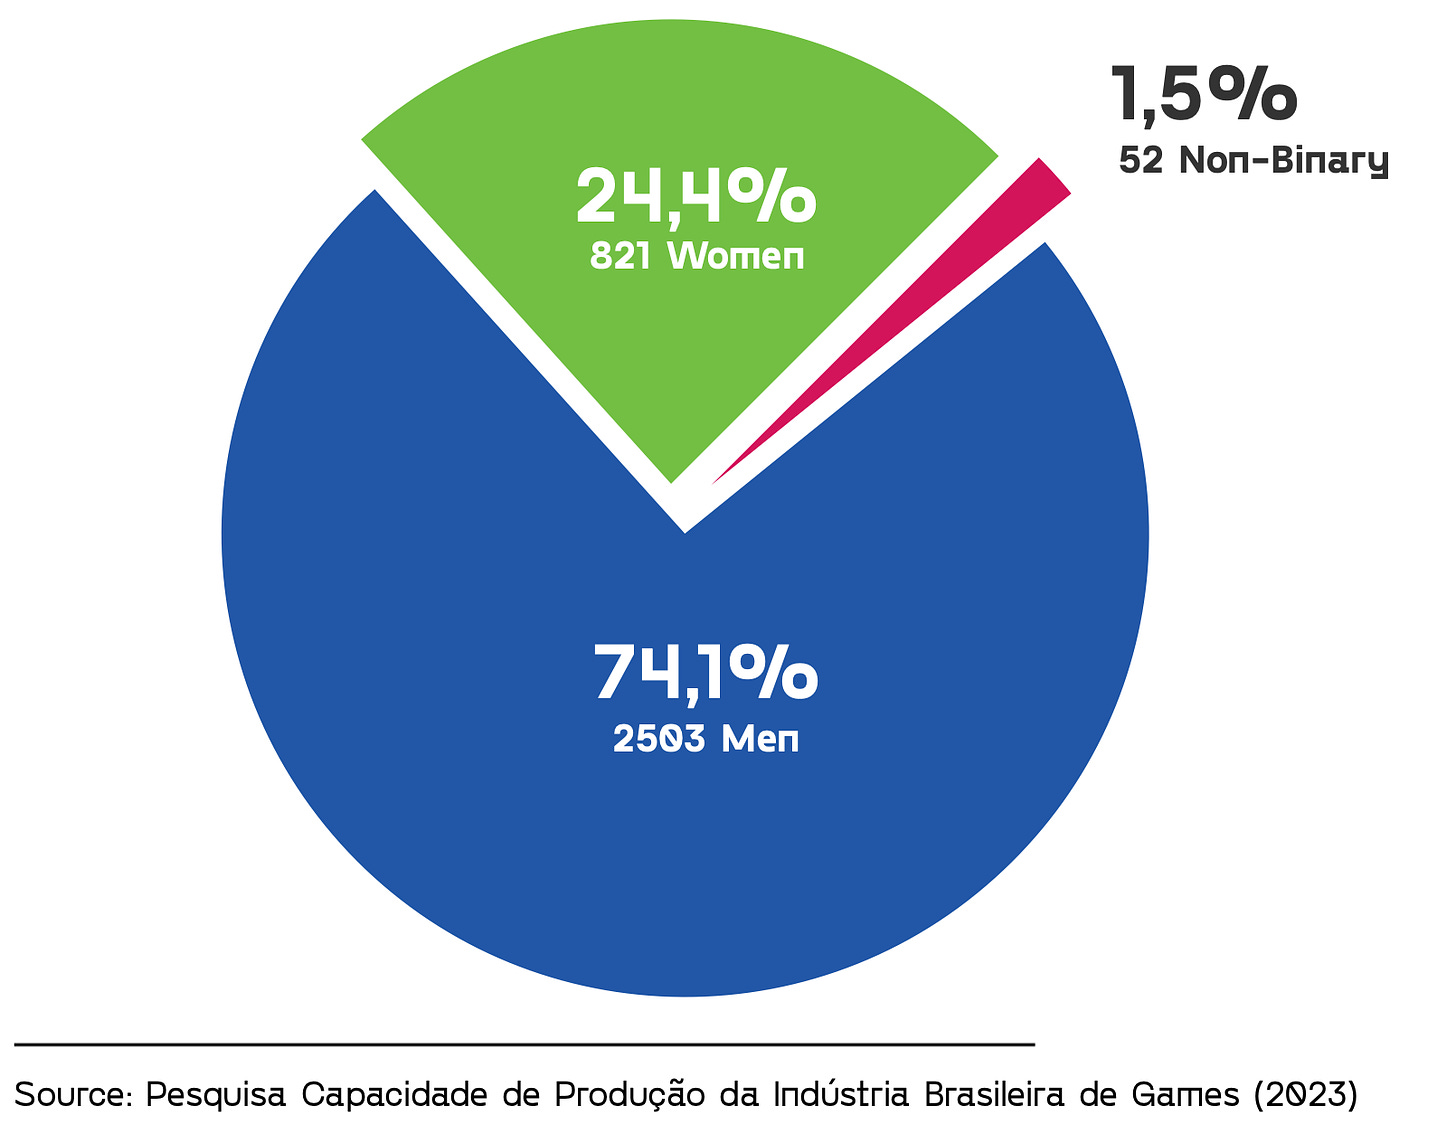
74.1% of employees are men; 24.4% - women, and 1.5% - non-binary individuals.
-
80% of Brazilian studios have multilingual employees.
GSD & GfK - European gaming market for PC and consoles grew well in March 2024

Game sales
-
A total of 15.9 million copies of games were sold in Europe. This is 35% more than in March of last year.
-
Sales for the first quarter are up 9%. This is better than what many analysts predicted.
❗️These figures do not include Palworld sales, so the actual picture is even better.
-
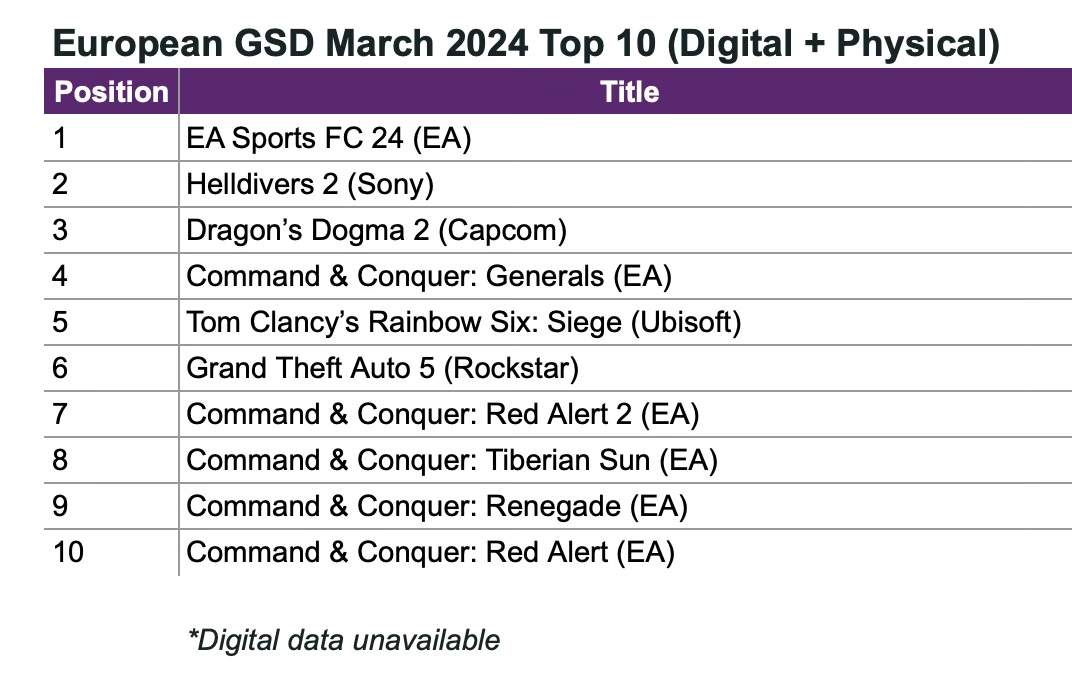
Helldivers II lost its lead to EA Sports FC 24, but the project's sales are still strong.
-
Five parts of the Command & Conquer series appeared on the European chart at once. EA's mass attack on Steam was successful, with C&C: Generals taking the 4th spot in March sales in Europe. The project is 21 years old.
-
Dragon’s Dogma II started from the 3rd spot. Its sales are comparable to Final Fantasy VII: Rebirth after 2 weeks, but the game was released on PC and Xbox.
Hardware sales
-
317 thousand consoles were sold in Europe in March - 27% less than the previous year. This does not include the German market.
-
PS5 sold 31% worse than in March of last year but remained in the first place.
-
1.2 million accessories were sold in Europe in March 2024. This is 0.3% less than the previous year. DualSense is the leader.
StreamElements & Rainmaker.gg: State of the Streaming market in March 2024
-
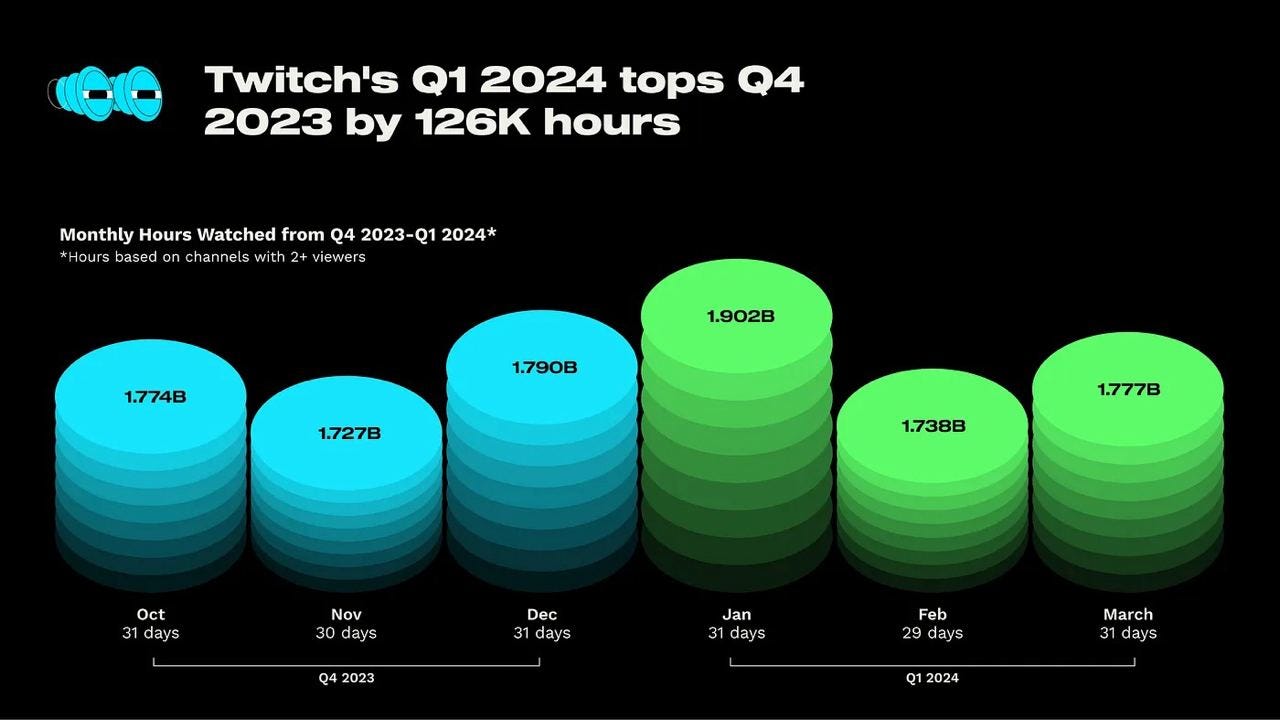
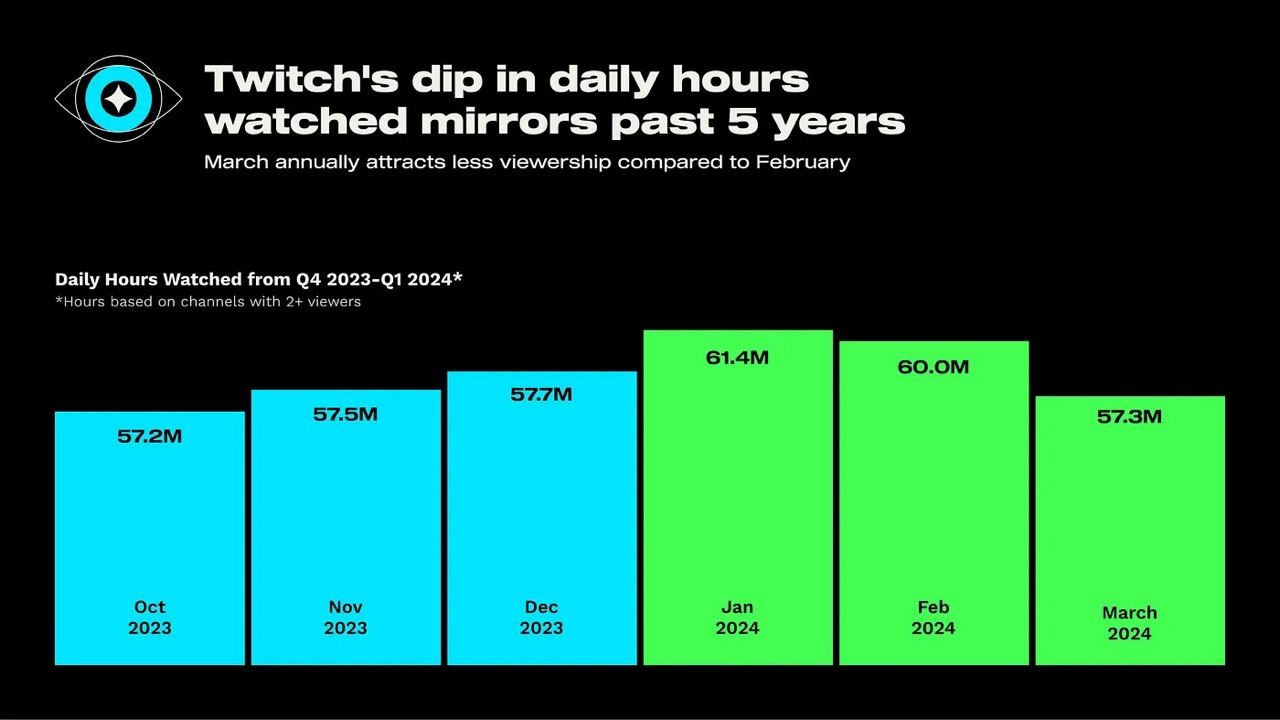
Twitch views in the first quarter of 2024 increased by 2% compared to the fourth quarter of 2023, reaching 5.4 billion hours.
-
However, in March, the number of views dropped. This trend has been observed for 5 years.
-
Counter-Strike views increased by 53% thanks to PGL CS2 Major.
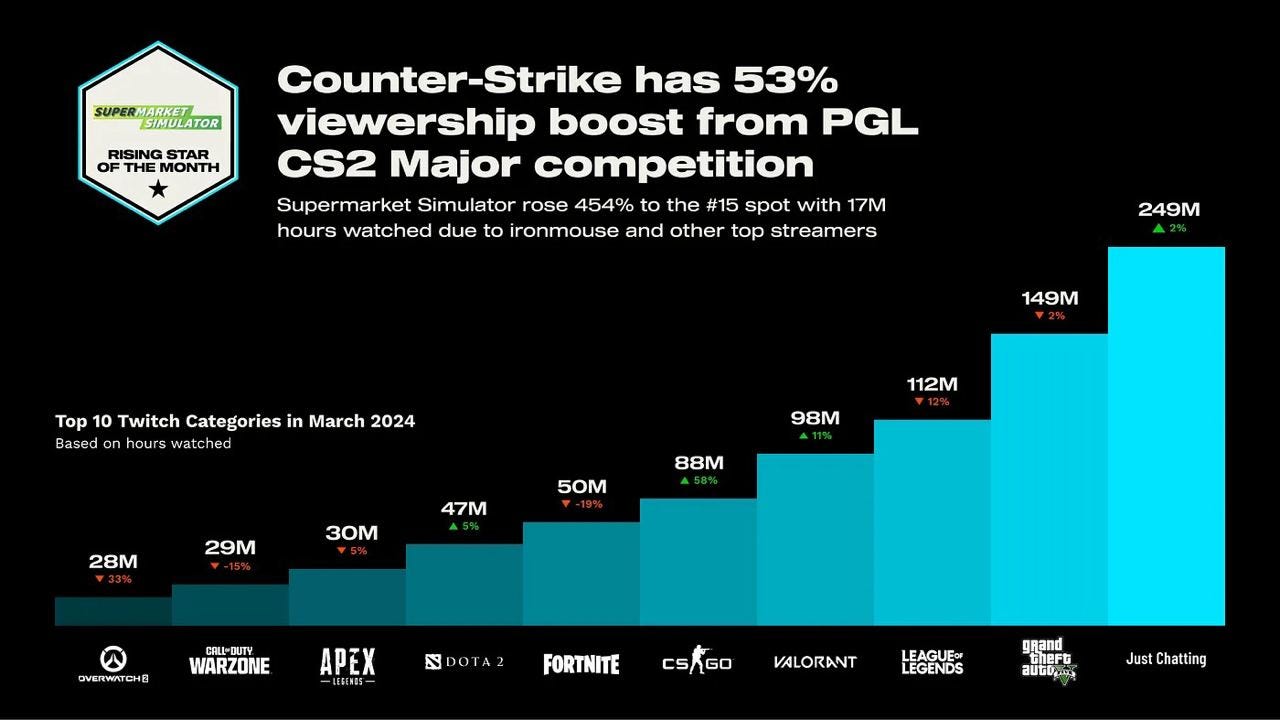
- It is important to note the success of Supermarket Simulator, which received 17 million hours of views in March (15th place). The game was very well received by both streamers and the audience.
-
In terms of hours watched, GTA V (149 million hours - a 2% decrease), League of Legends (112 million hours - a 12% decrease), and Valorant (98 million hours - an 11% increase) continue to lead.
-
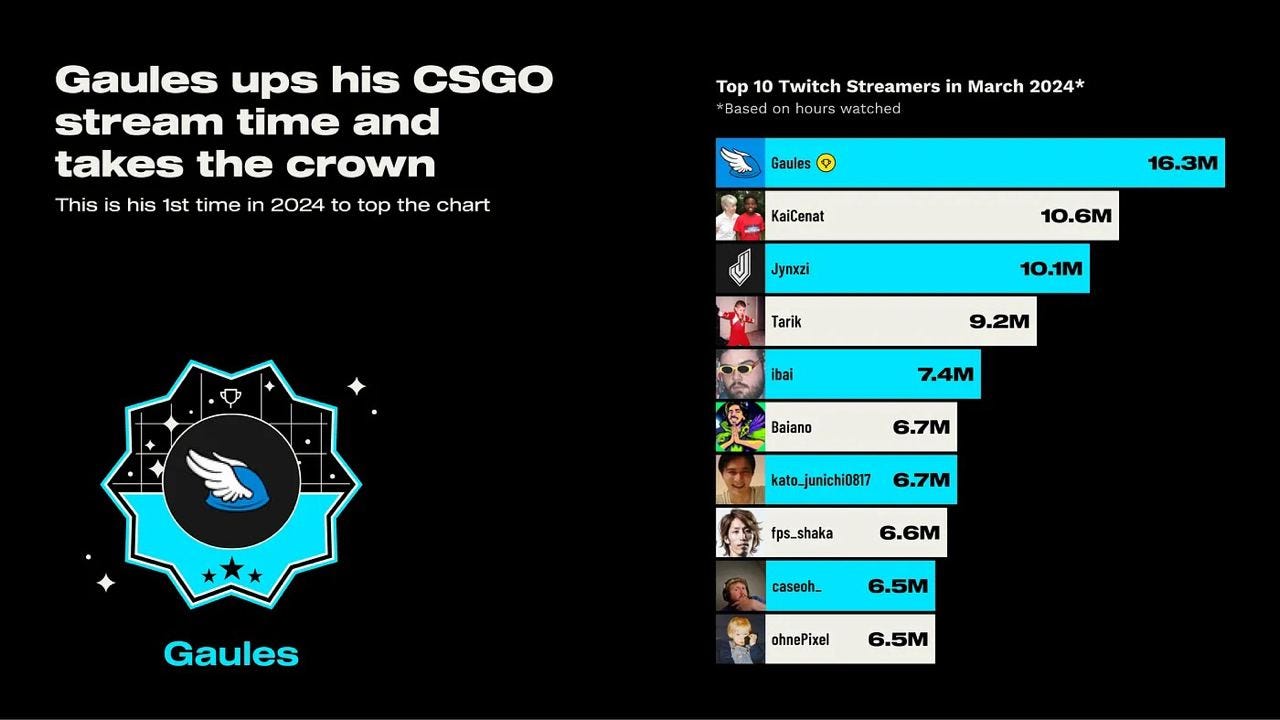
Gaules took the top spot in the streamer ratings in March with 16.3 million hours.
Game Sales Round-up (03.04.24 - 16.04.24)
- Dragon’s Dogma II sold 2.5 million copies in 2 weeks after the release. Total series sales reached 10 million copies.
- Ranch Simulator reached 1 million copies sold on Steam. It's the most successful store simulator on the platform.
- V Rising has been purchased over 4 million times. The game has been in early access since May 17, 2022; in 2024, the project will be released on PlayStation 5. The first million was reached within a week.
- IDG Consulting experts report that Helldivers II started on par with Call of Duty: Modern Warfare II; Warzone and Apex Legends in terms of DAU (Daily Active Users).
- Lo-Fi Games announced 2.3 million copies sold of Kenshi. The game was launched on the Epic Games Store; developers are also working on a prequel - Kenshi 2.
- Sales of Crash 4: It's About Time surpassed 5 million. It took the game 4 years to achieve this.
- The Outlast Trials has already been purchased over 2 million times. The game exited early access last month; and has been on sale since May 2023.
- The launch of the Fallout series had a positive impact on the number of players in Fallout: New Vegas (3x increase in CCU); Fallout 4 (4.5x increase in CCU), and Fallout 76 (the game set a new CCU record). Figures are for Steam only.
- Content Warning by Landfall Games sold 1 million copies, despite 6.6 million people claiming the game for free. The release - following the studio's old tradition - took place on April 1st. The game was initially available for free for some time.
game: The German Gaming Market almost reached €10B in 2023
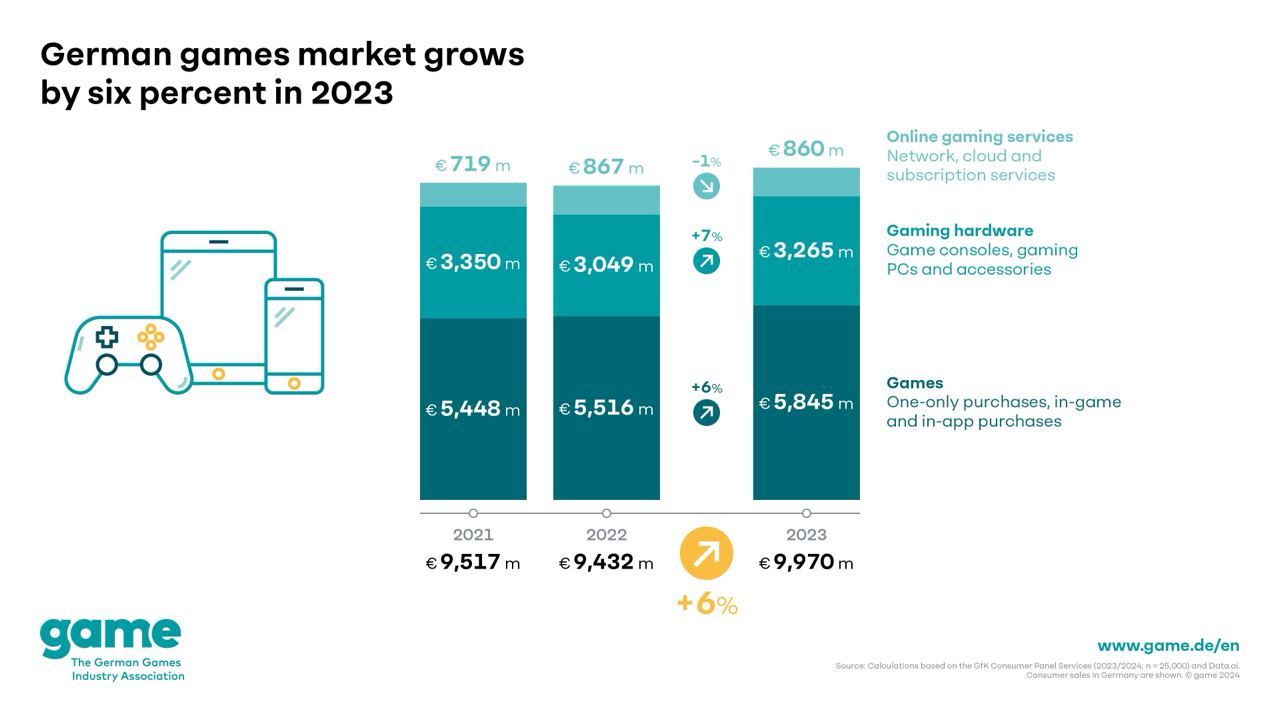
Data provided by GfK and data.ai.
-
Revenue of the gaming industry in the country increased by 6% to €9.97 billion.
-
The sales of gaming hardware saw the strongest growth - by 7% (from €3.049 billion in 2022 to €3.265 billion in 2023); game sales increased by 6% (from €5.516 billion in 2022 to €5.845 billion in 2023).
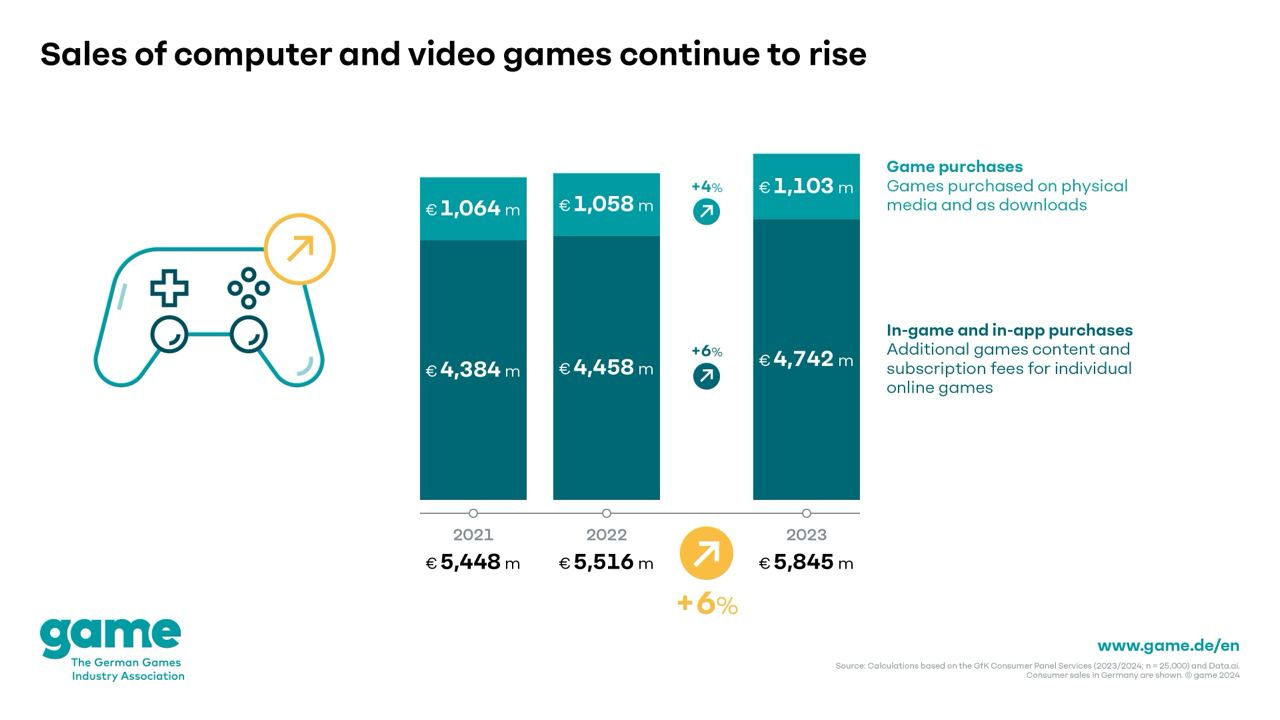
- Despite a large number of releases in 2023, the number of games sold decreased by 8%. However, revenue increased by 4%. Likely, people were more actively purchasing new releases in 2023 at a higher price point. Game sales reached €1.103 billion.
-
In-game purchases increased by 6% - reaching €4.742 billion.
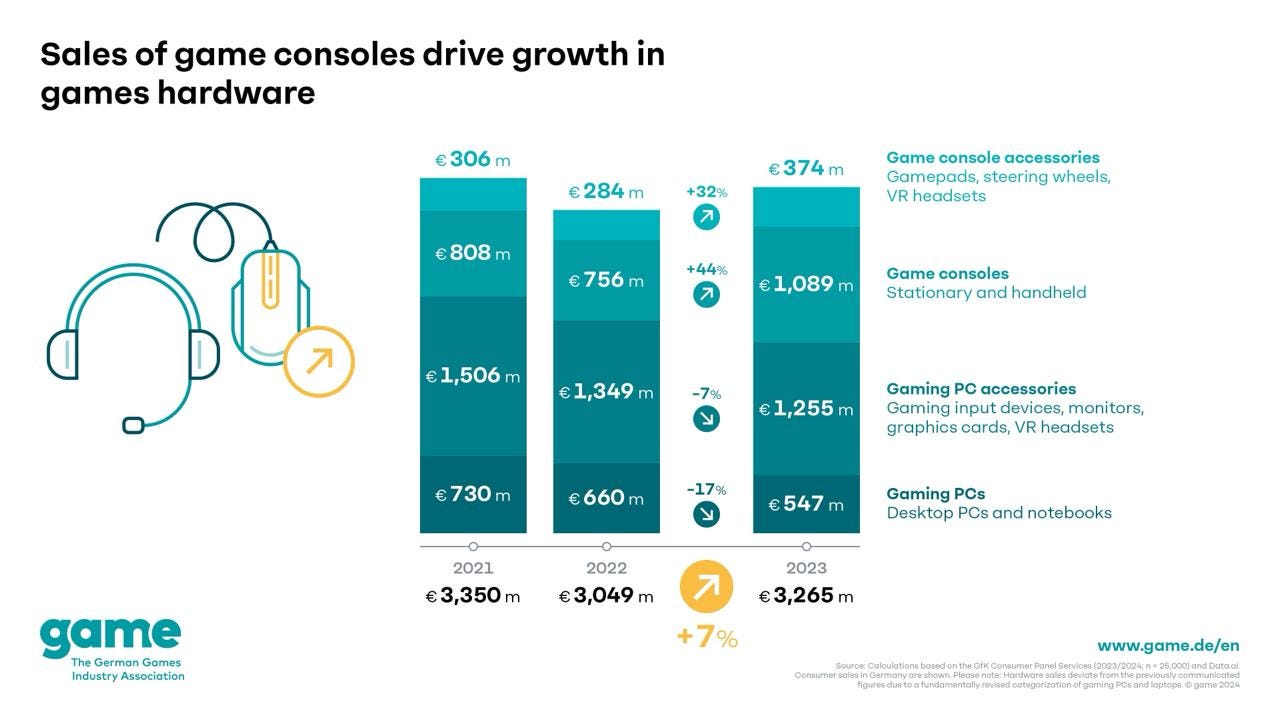
Console sales in Germany skyrocketed by 44% in 2023; accessory sales for them increased by 32%. This is attributed to the availability of PlayStation 5 and (to a lesser extent) Xbox Series S|X. The explosive growth was offset by a decline in demand for gaming PCs (down by 17%) and PC accessories (down by 7%). According to Felix Falk, the managing director of game, people stocked up on these during the pandemic.
-
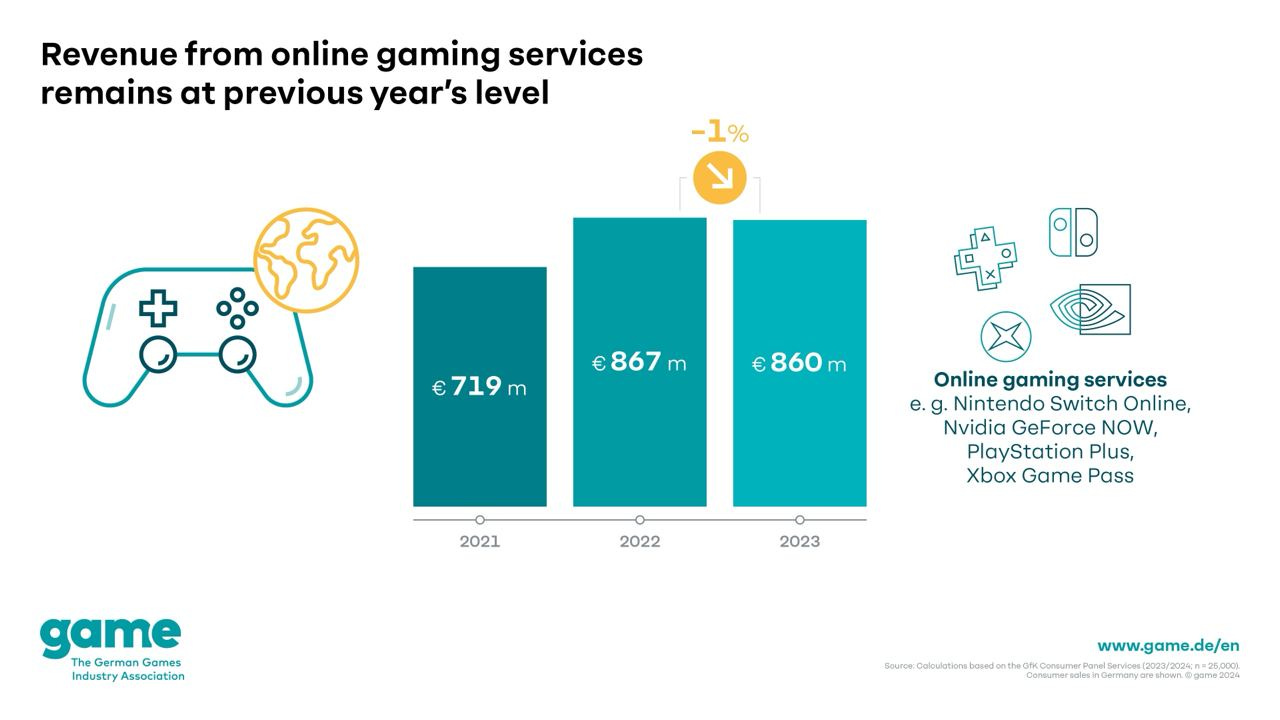
The segment of subscription services slightly decreased by 1% (from €867 million to €860 million).
❗️In 2022, subscription services in Germany grew by 20%. Many speculate that such solutions have reached their ceiling, but in Germany, since 2021, they have had the highest cumulative growth rate. It's better to look at the trend over a longer period. Growth has nearly stalled in the USA.
Konvoy Ventures: Investments in the Gaming Industry in Q1'24
Market Overview
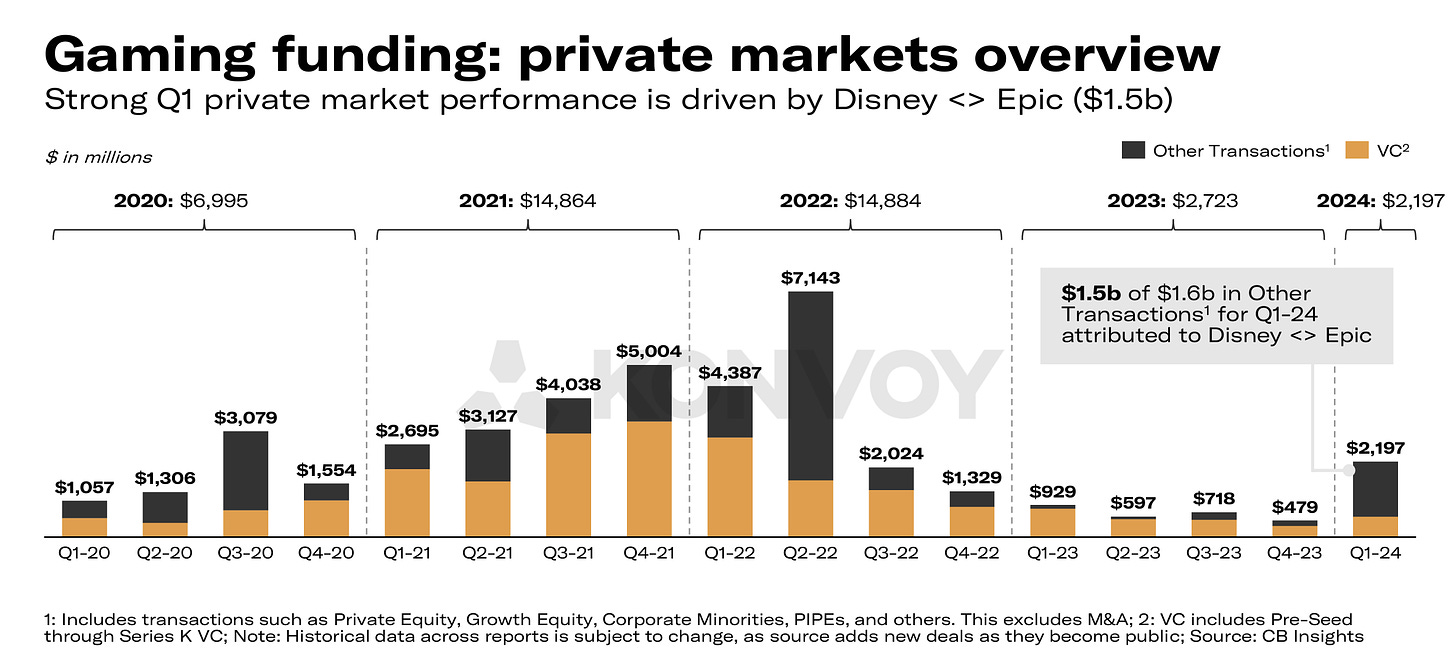
- The volume of private investments in gaming companies in Q1’24 reached a nearly two-year high - $2.197 billion. $1.5 billion of this amount is attributed to a deal between Epic Games and Disney.
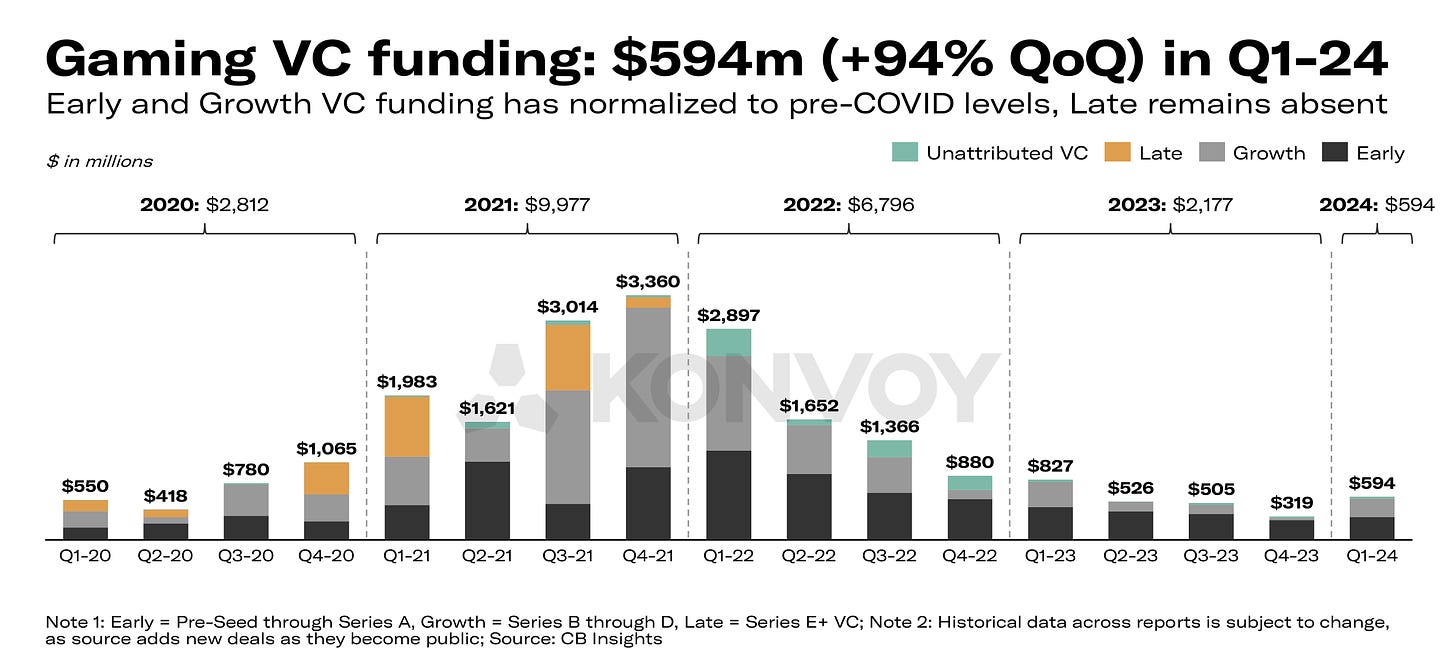
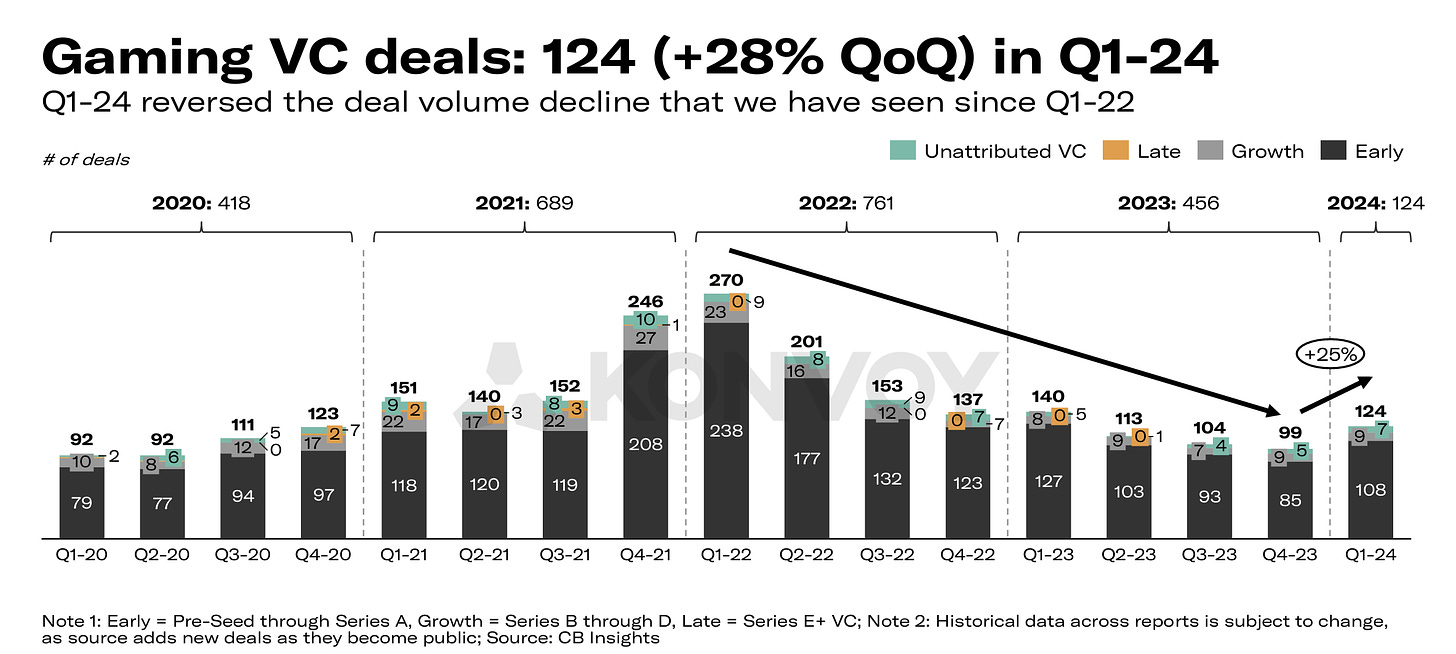
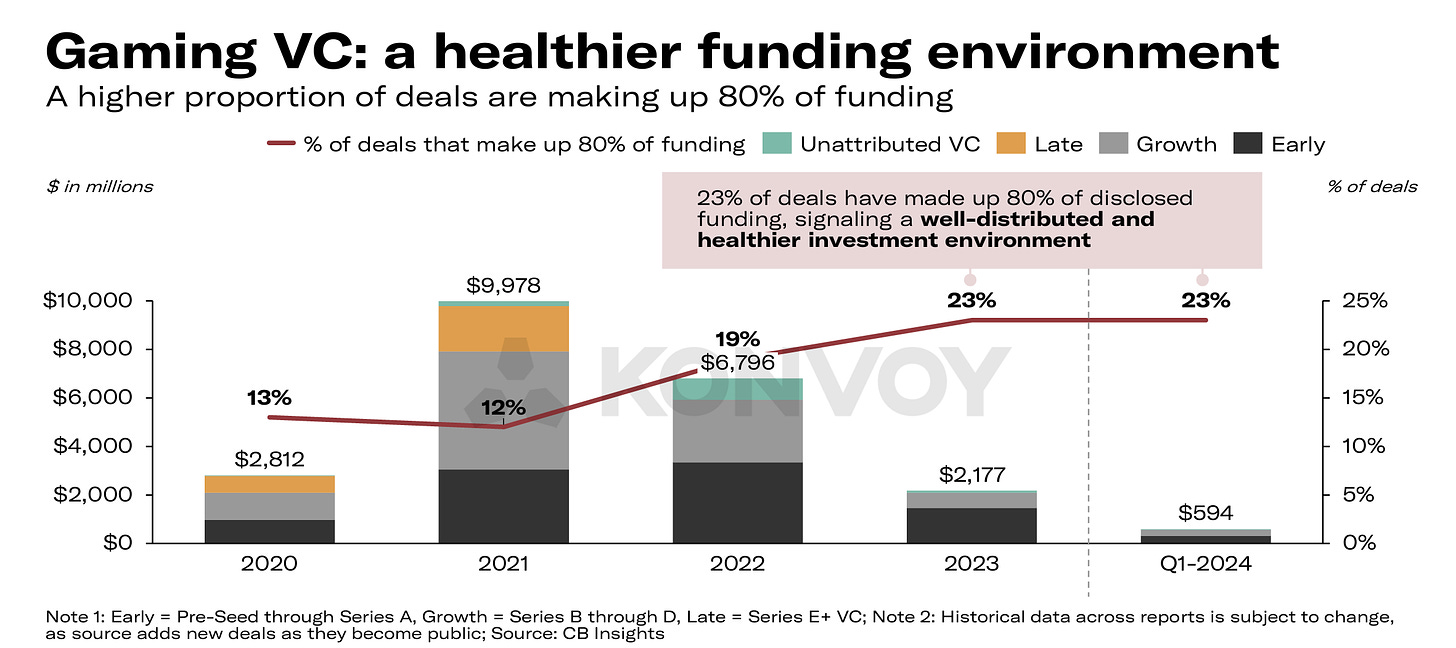
- VC investments reached a one-year high, totaling $594 million. This represents a 94% increase compared to the previous quarter in terms of deal volume. A total of 124 deals were made (+28% compared to the previous quarter) - the highest in the past year since Q1’23.
- In Q1’24, 80% of the total financing volume was accounted for by 23% of the deals. This is higher than in 2022 (19%); 2021 (12%); and 2020 (13%). This indicates a healthier situation in the investment market.
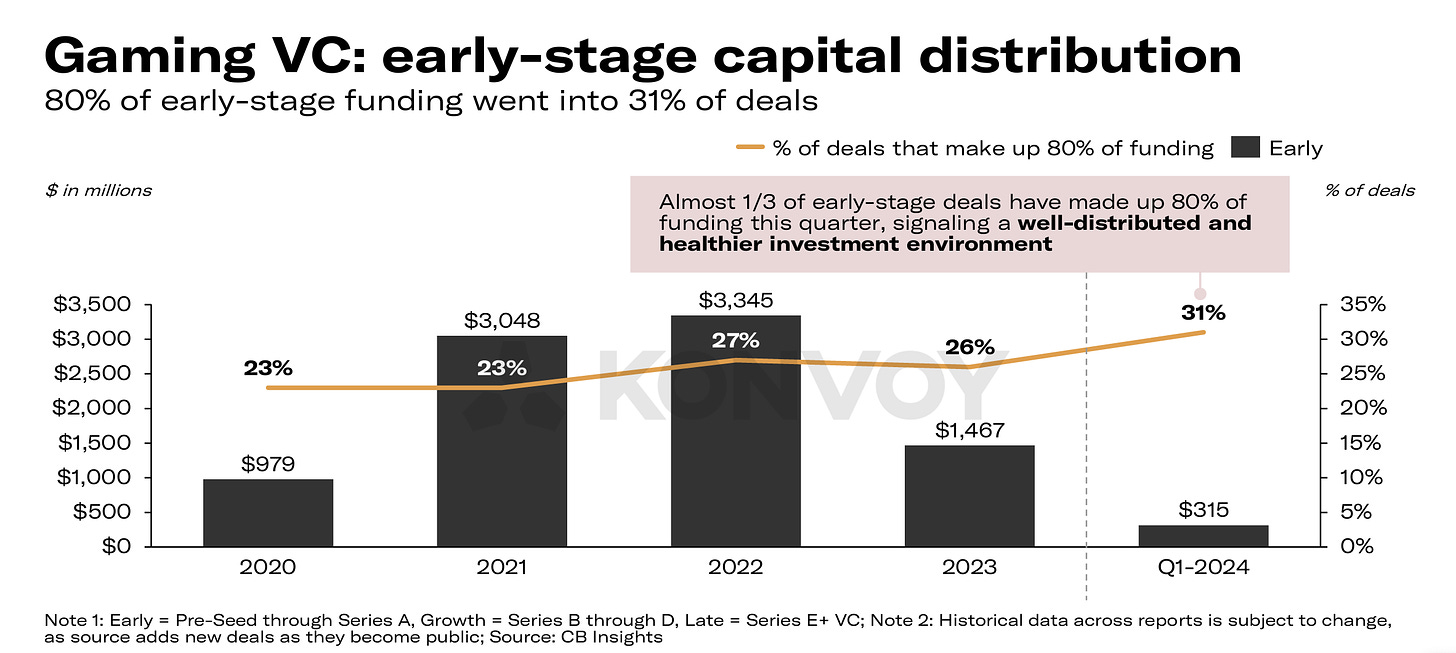
- In terms of capital distribution at early stages (from pre-seed to Series A), the situation is even better - 80% of allocated funds were distributed among 31% of companies. This is the best performance since 2020.
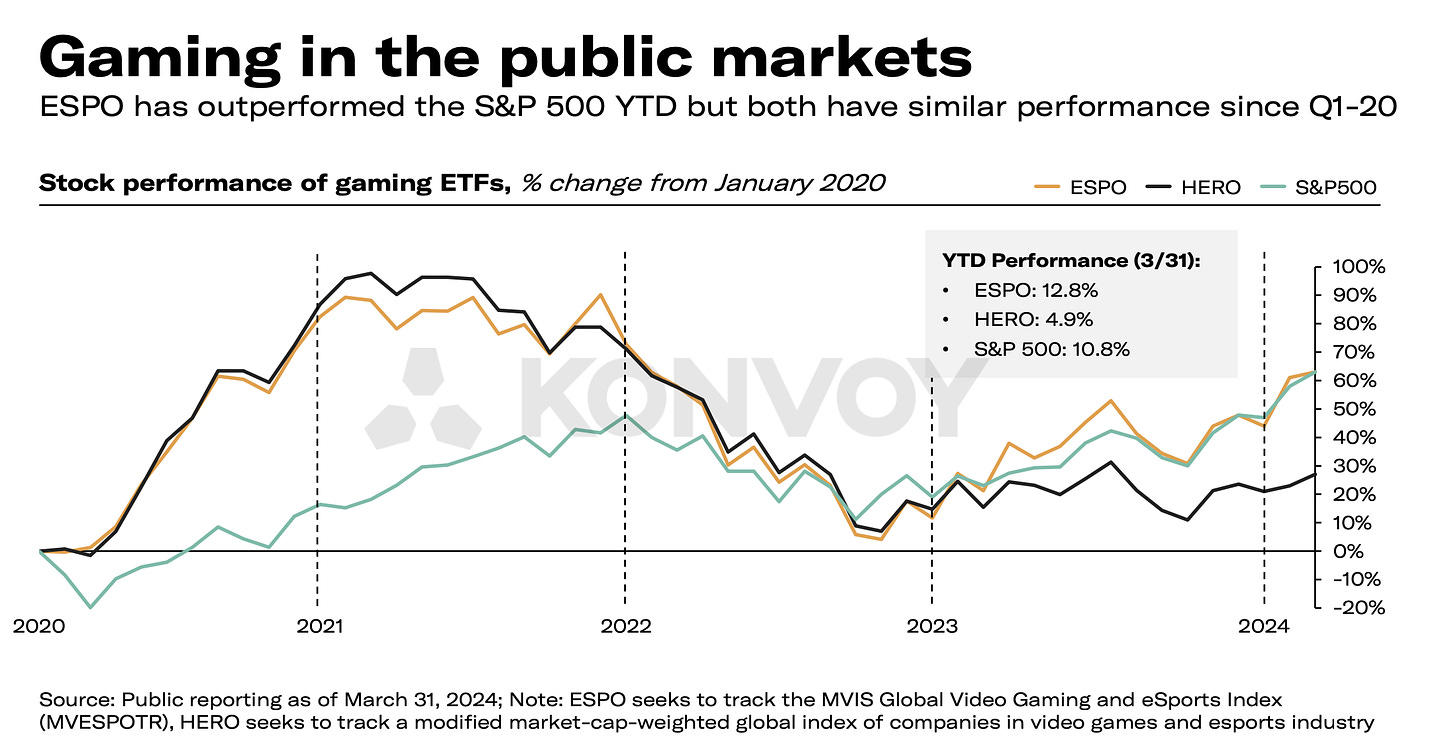
- In the first quarter of 2024, the ESPO (MVIS Global Video Gaming & eSports index) grew by 12.8%; the S&P 500 for the same period increased by 10.8%.
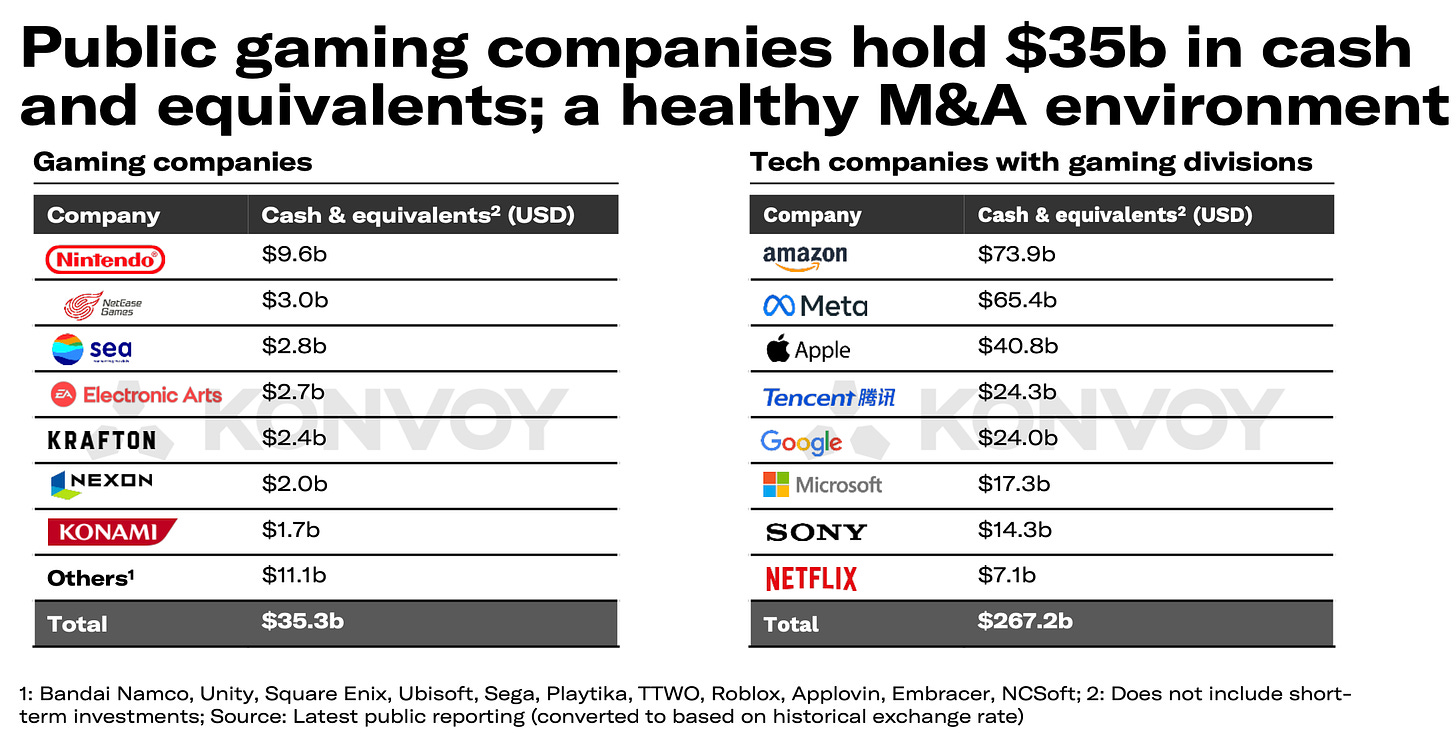
- Public gaming companies have $35.3 billion in cash reserves. This is excluding the $267.2 billion held by technology companies with gaming divisions (Tencent; Sony; Microsoft).
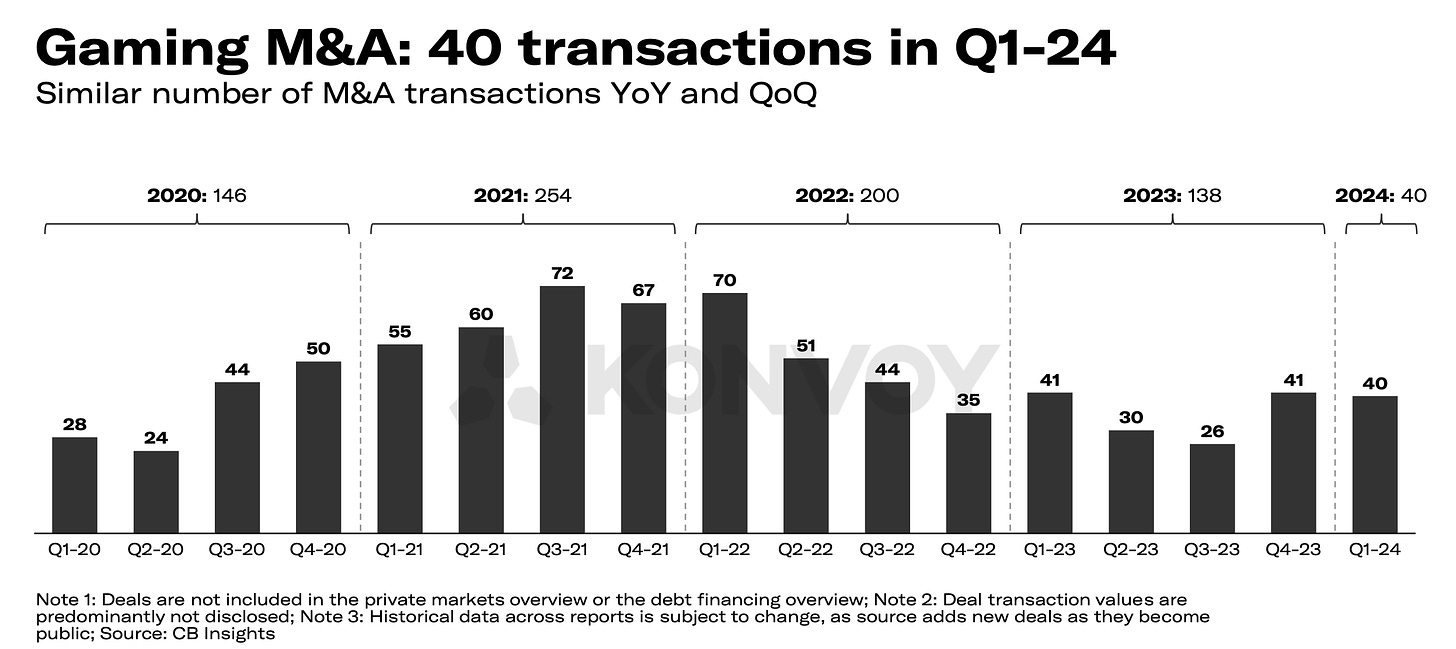
- The number of M&A deals in Q1’24 remained unchanged from the previous quarter - 40 transactions.
Deals
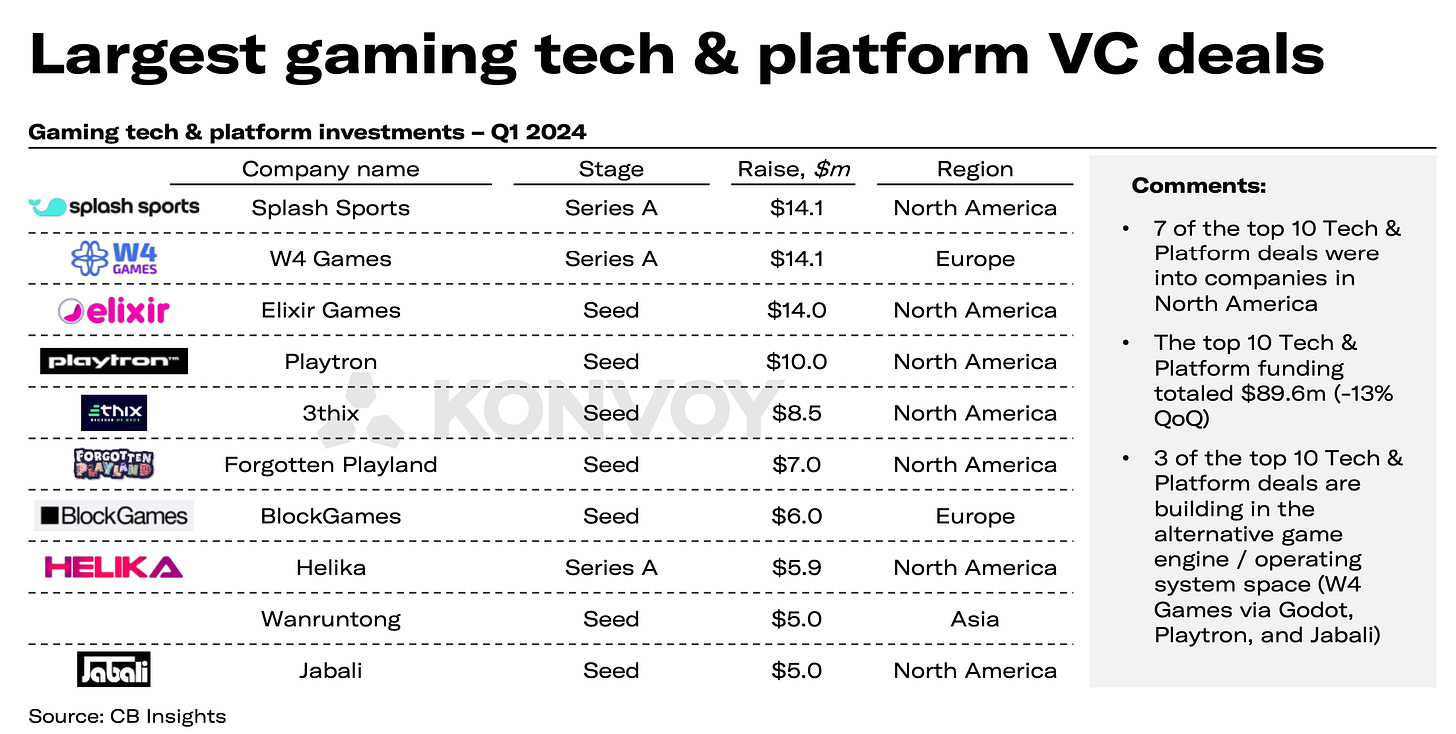
- The largest VC deals of the quarter with technology gaming companies are Splash Sports ($14.1M - Series A); W4 Games ($14.1M - Series A); Elixir Games ($14M - Seed).
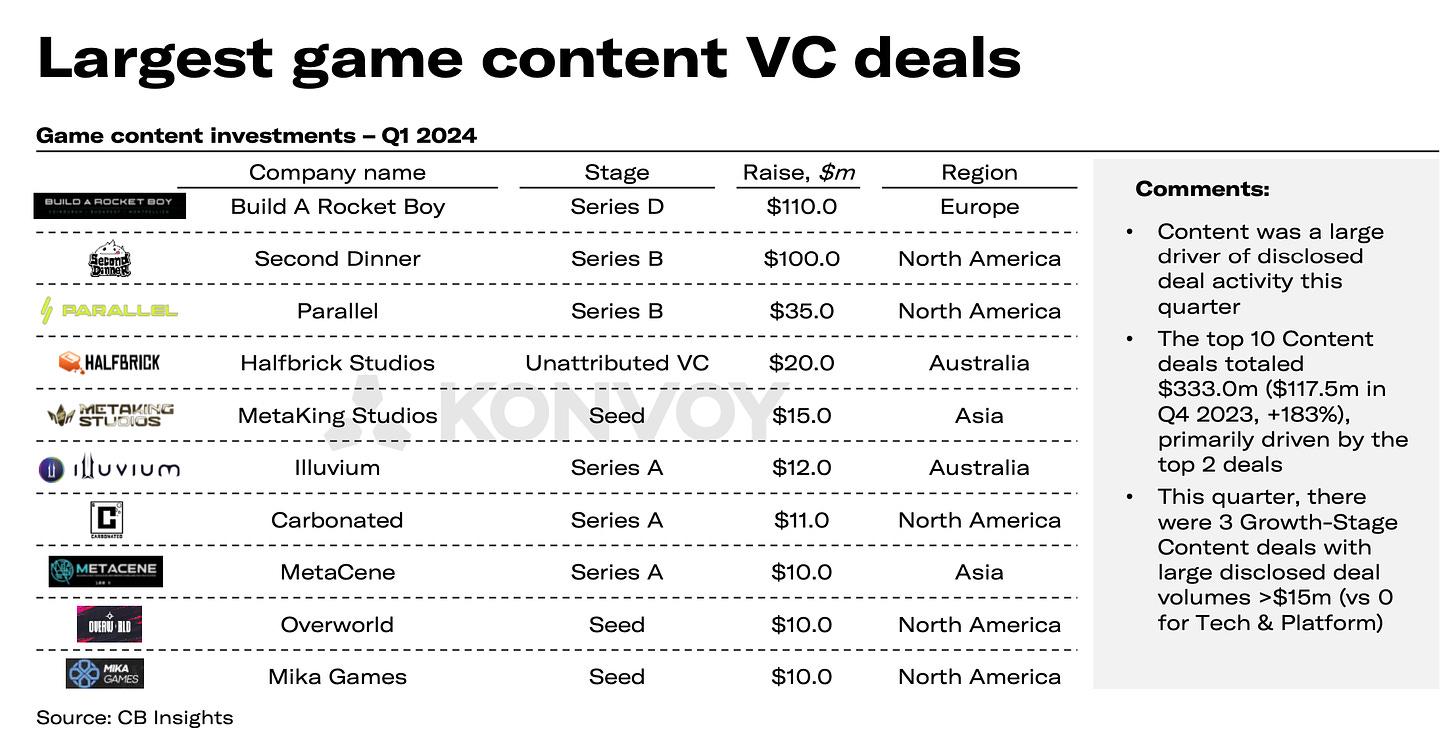
- The largest deals with content producers are Build a Rocket Boy ($110M - Series D); Second Dinner ($100M - Series B); Parallel ($35M - Series B).
VC Investment Distribution by Region
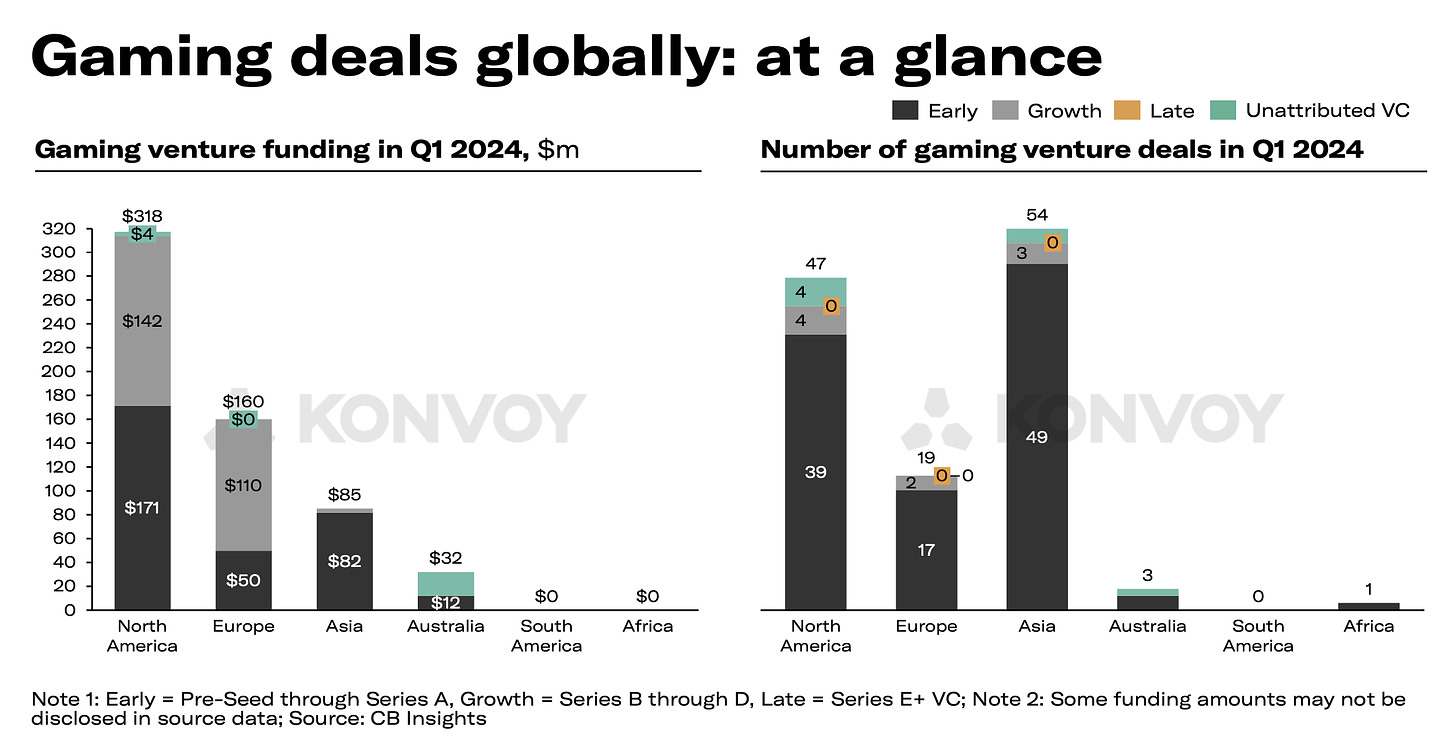
- In terms of volume, $318 million went to North America; $160 million to Europe; $85 million to Asia; $32 million to Australia.
- In terms of the number of deals, Asia leads (54 transactions), followed by North America (47 deals); Europe (19 deals); and Australia (3 deals). There was also one deal in Africa.
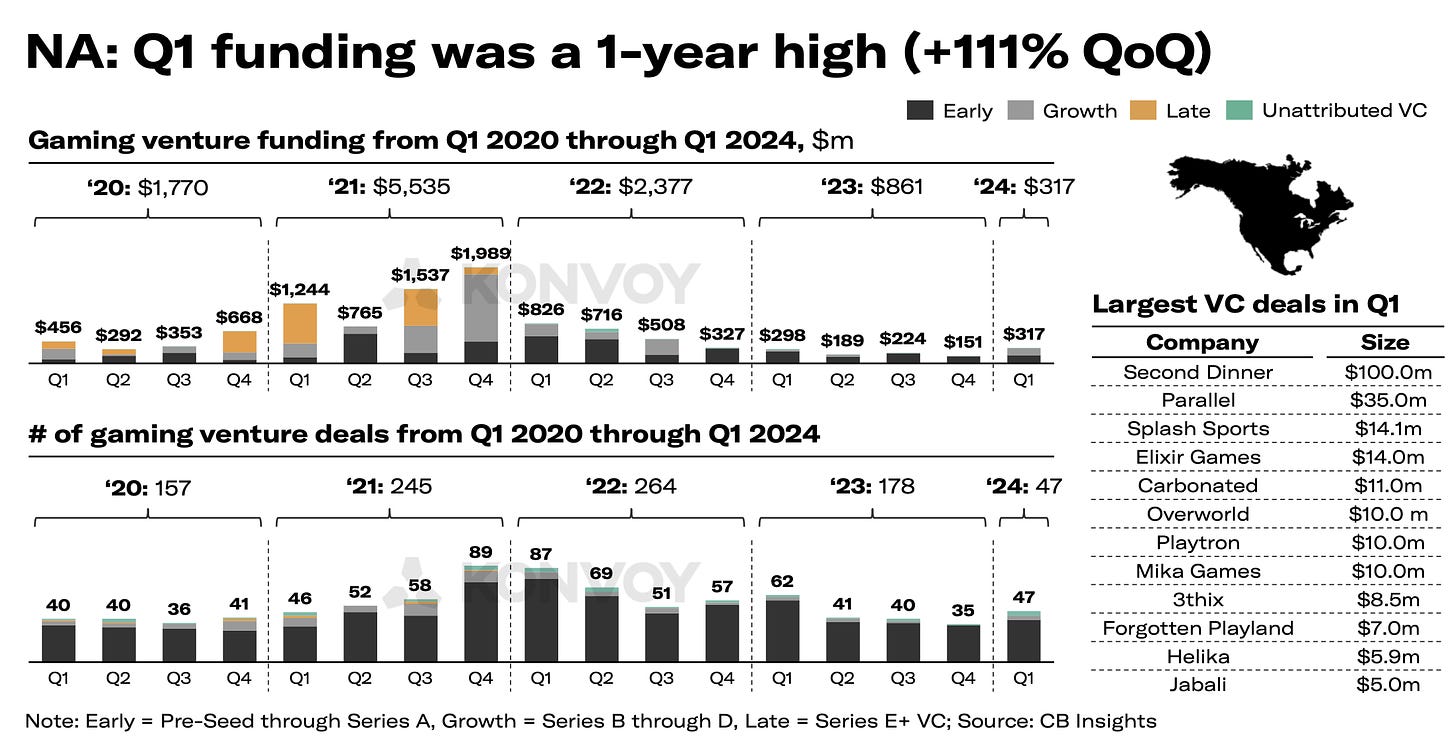
- The volume of deals in North America reached an annual high (increasing by 111% compared to the previous quarter). The number of deals also increased.
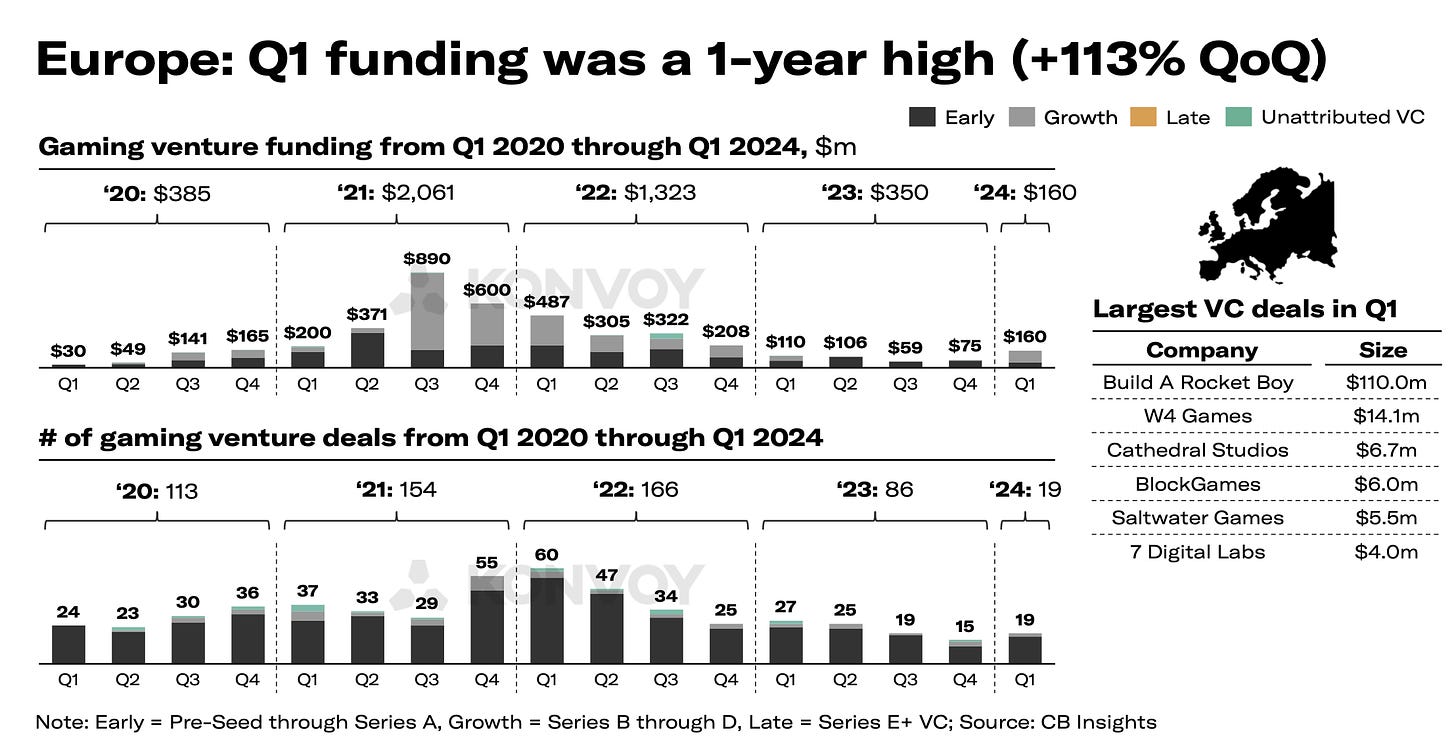
- In Europe, the situation is similar - reaching an annual high and a 113% increase in deal volume compared to the previous quarter. The number of deals increased by a quarter.
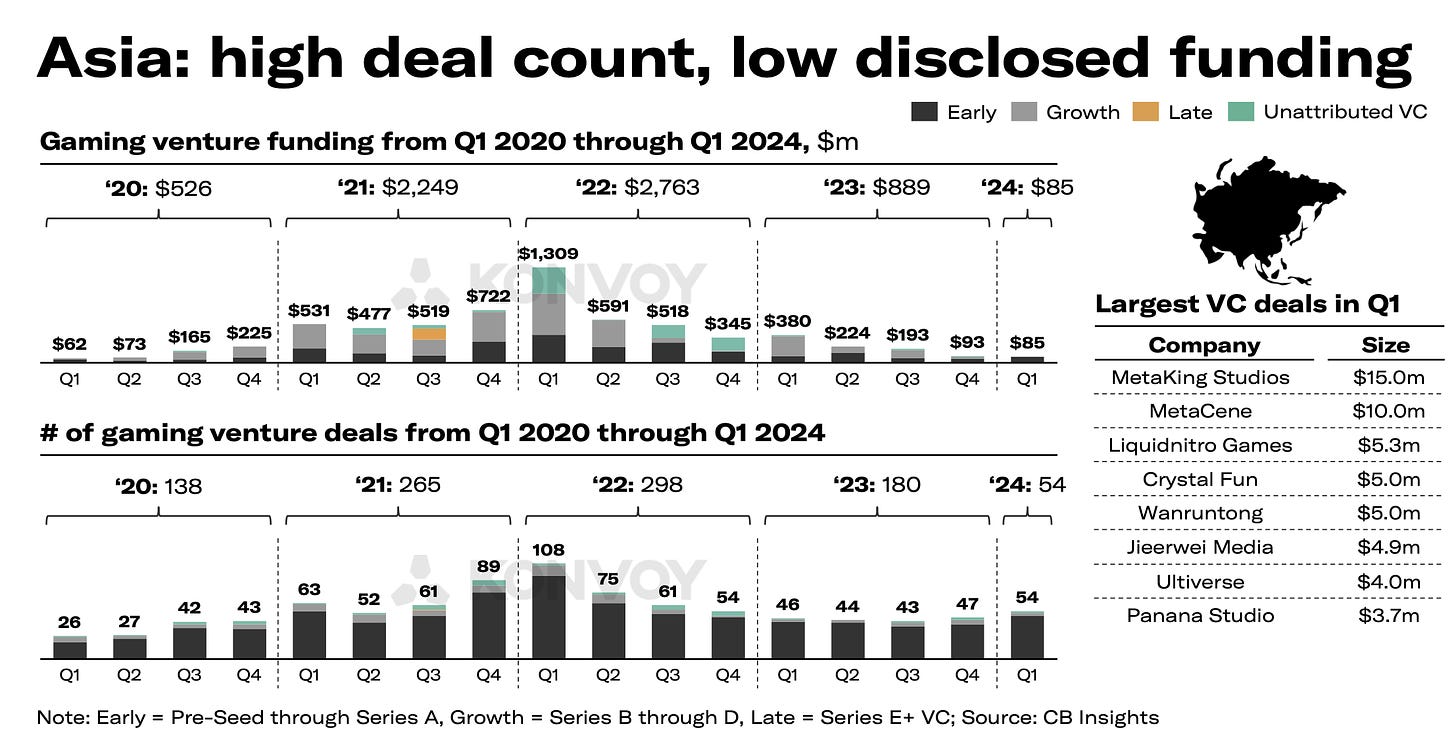
- The number of deals in Asia is the highest since Q4’22, but the volume is $85 million (only lower in Q2’20). This is due to the fact that the size of most transactions was not disclosed.
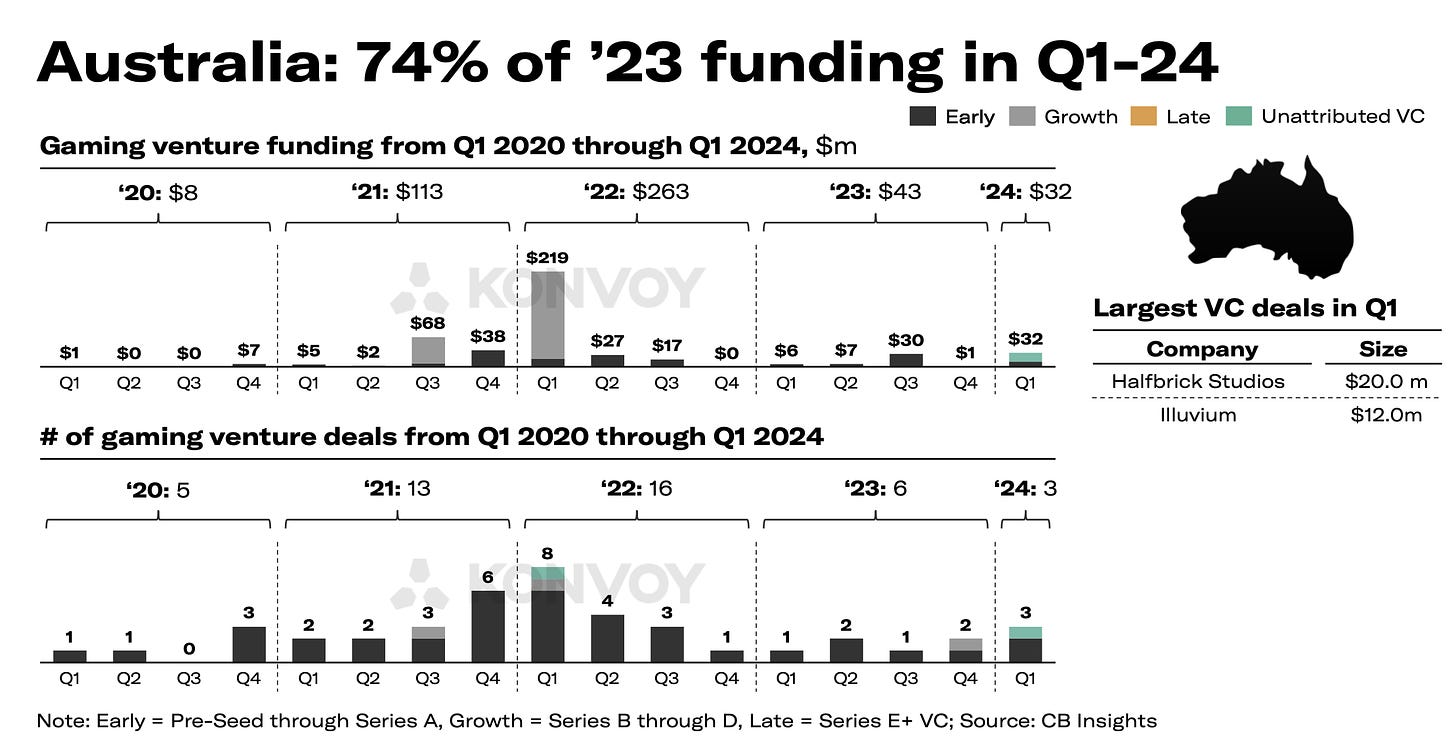
- 74% of Australia's total investment volume in 2023 occurred in Q1’24. The number of deals (3) is the highest since Q3’22. This is due to deals with Halfbrick Studios and Illuvium.
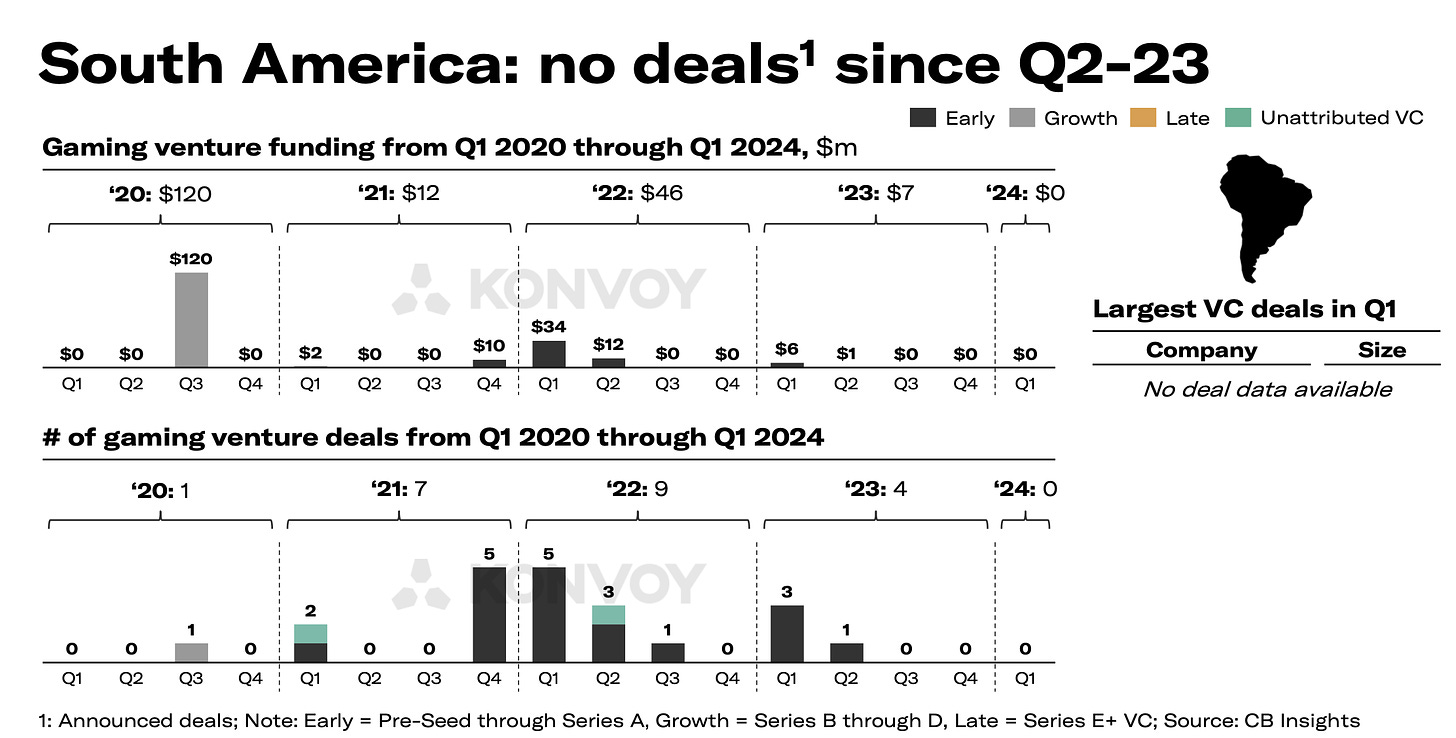
- There have been no announced VC deals in South America since Q2’23.
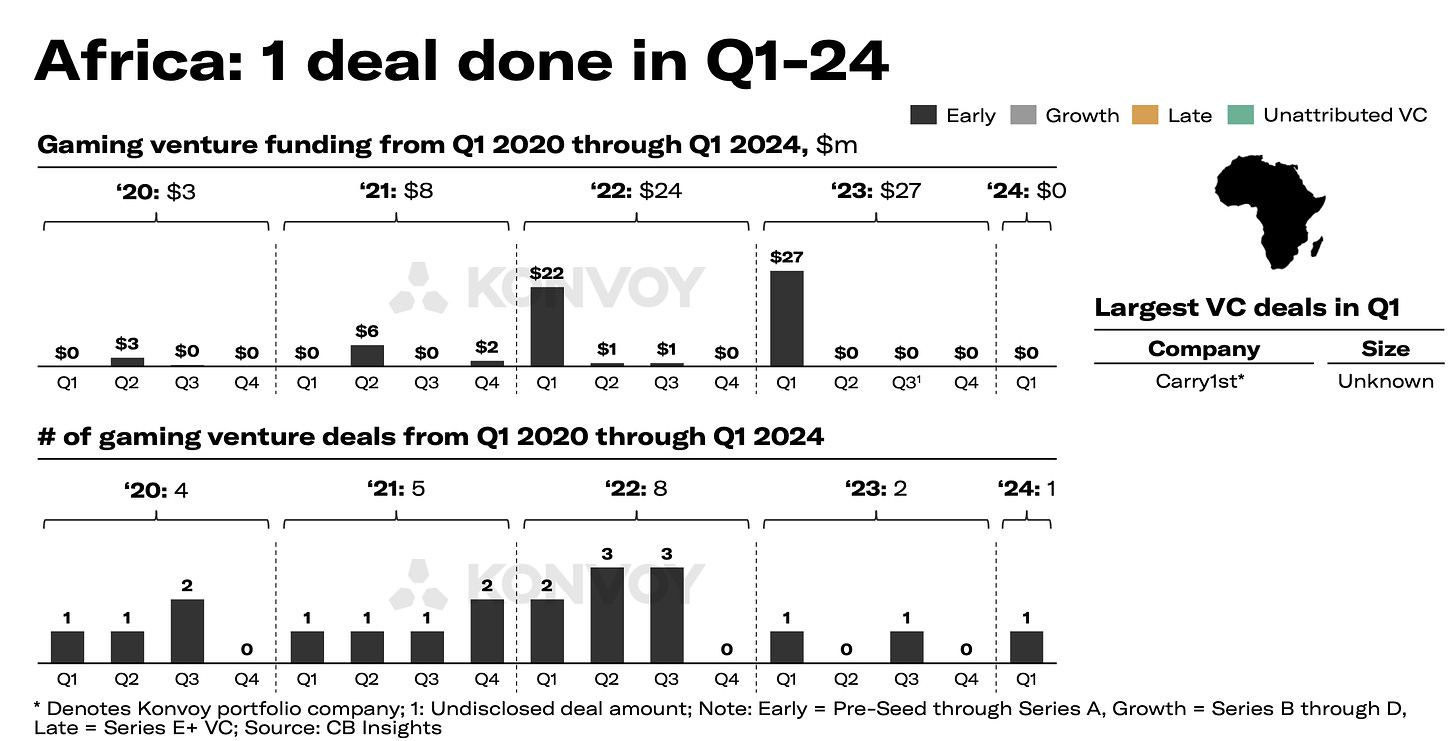
- In Africa, there was 1 VC deal in Q1’24 - Carry1st raised funds from the Sony Innovation Fund; however, the deal size was not disclosed.
Q1’24 trends
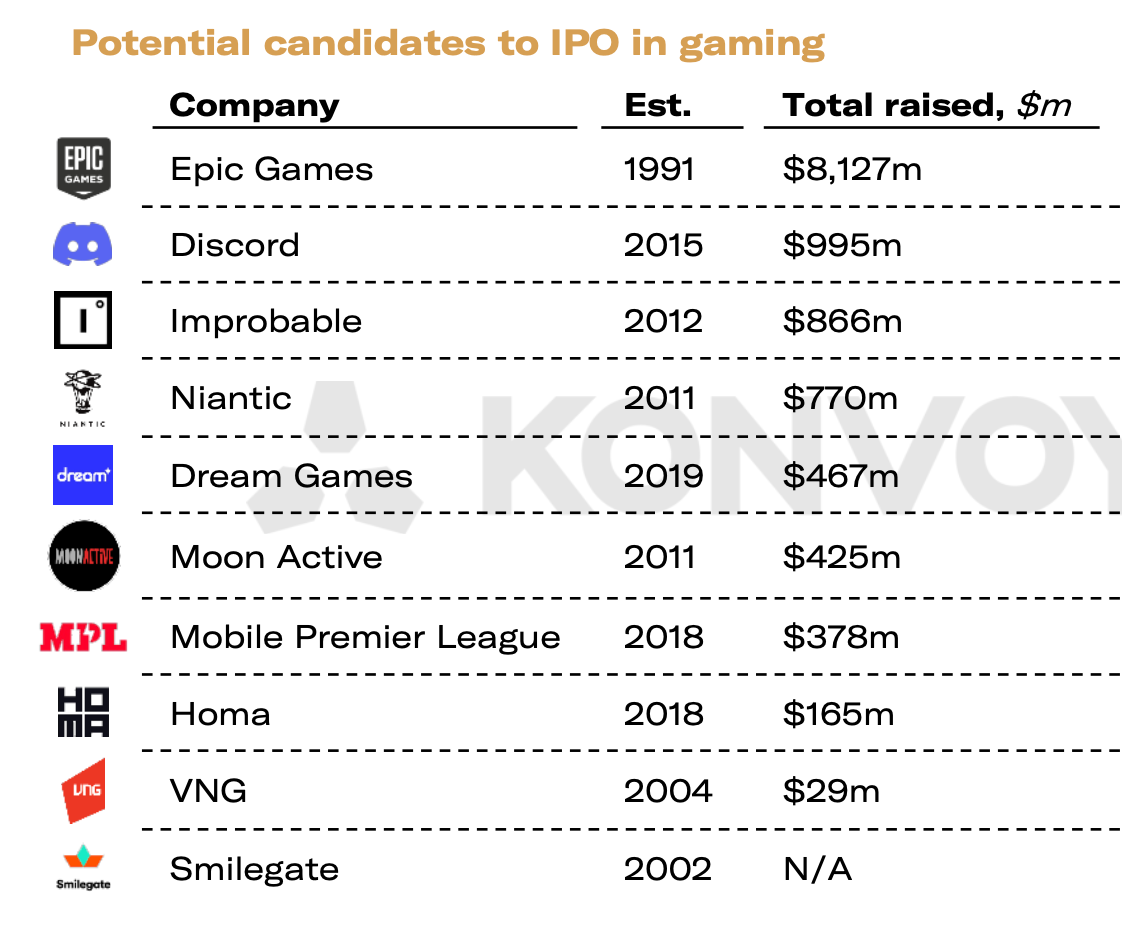
- There are increasing candidates for IPOs in the market. The main candidates are Epic Games; Discord; Improbable; Niantic; Dream Games.
- The possible ban of TikTok in the USA. If it happens, it will significantly affect the advertising market and the trust of companies in the USA.
- Major brands are actively investing in games. Disney invested in Epic Games; Mattel launched its publishing; Warner Bros. plans to release several GAAS projects.
- Apple continues to face pressure from governmental bodies of various countries demanding to allow third-party stores on iOS.
- Apple Vision Pro did not revolutionize the VR/AR market.
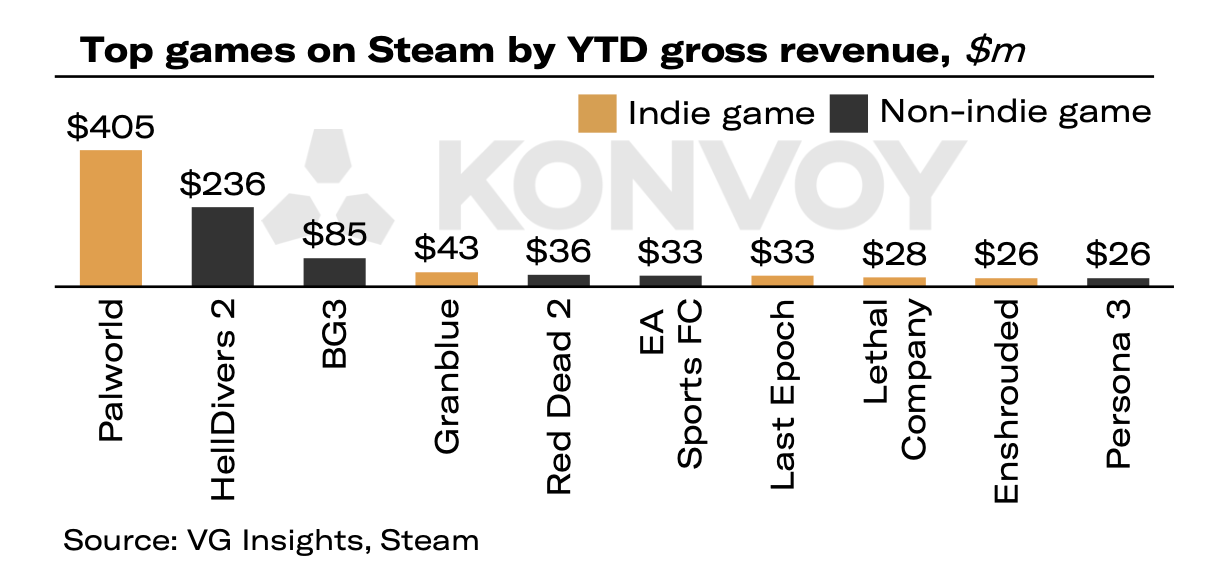
- Small developers are successfully showcasing themselves in the market. Examples include Palworld; Last Epoch; Lethal Company; Enshrouded.
Tune in next month for more updates!
In the meantime, you can take a look at our free demo to better understand how devtodev helps game projects grow and increase revenue.