
The competition between applications for traffic and for the unit of free user time is constantly increasing. Under such harsh conditions, is important to properly evaluate the state of your project, find bottlenecks and points of growth, make quick decisions on its development; analytics will help you in all these situations. We compiled a selection of the five most important reports that are useful for marketers, analysts, and project managers.
Usage and Payment metrics Reports
The bulk of the analytical conclusions can be made on the basis of metrics – these are 20% of the system functionality, that are responsible for 80% of the questions. Usage and Payment metrics reports allow you to examine key metrics, compare them and identify trends in the project development.
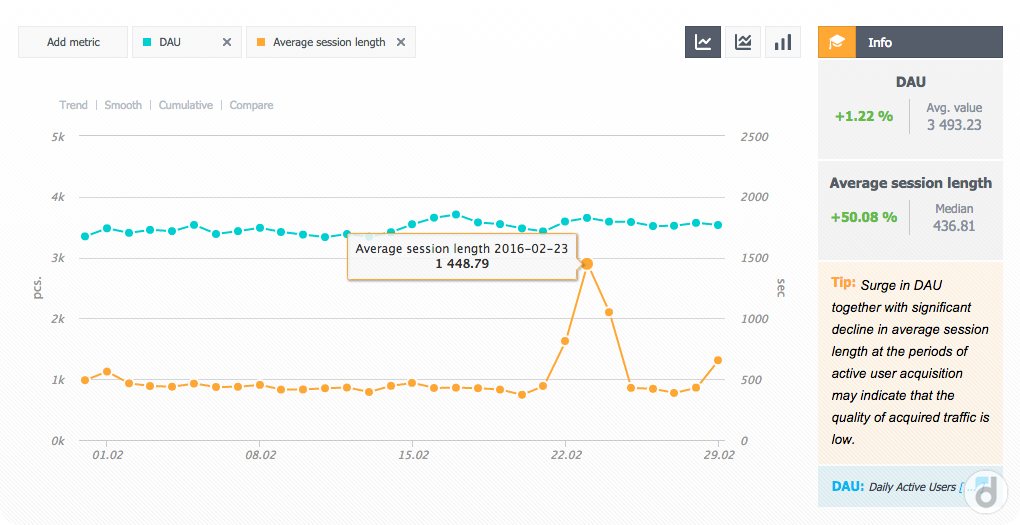
Usage report was created to study the user activity:
- a number of users (DAU, MAU, WAU),
- session parameters,
- the average time spent on the project (lifetime),
- a number of online users (with an update every five minutes), and so on.
Usage is able to respond various questions. For example, analyzing the average length of user session for three months, it is possible to draw conclusions about the impact on user activity of the release of a new chapter in the project. And by comparing the dynamics of DAU (daily audience) and MAU (monthly audience), we can estimate how regularly users visit the project.
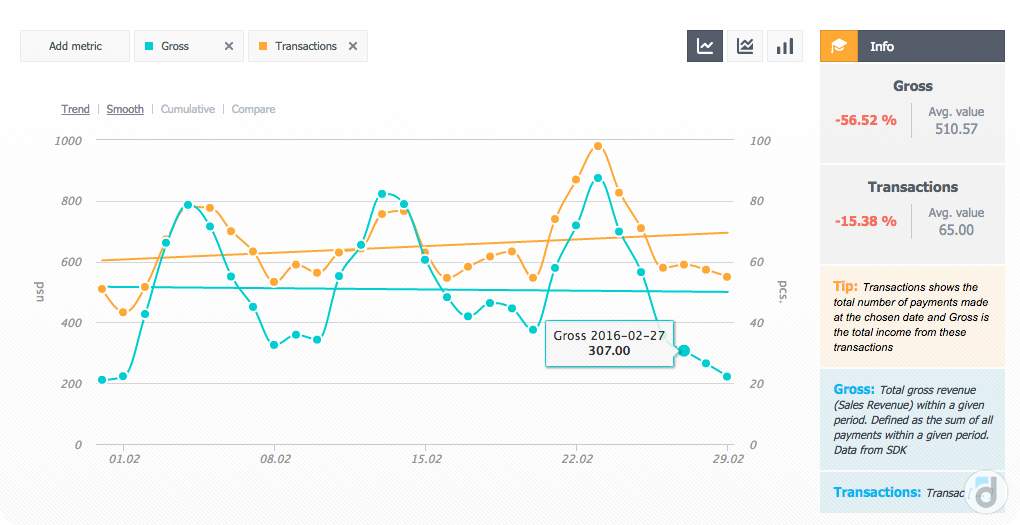
The report Payment metrics renders all payment metrics:
- ARPU and ARPPU,
- average check,
- share of paying users,
- total revenue, etc.
In this case, both reports can be built as for the whole mass of users so for any cut: traffic sources, application version, country, device, user language, any user segment.
Try to measure ARPU by country and determine where the average revenue per user is higher. This will help you to plan your entering to this country market.
Besides, in Usage and Payment metrics reports the values of the metrics can be compared with any other period. This helps to evaluate the effectiveness of the new application functionality or conduct a cohort analysis.
Let's say, in April you changed the prices inside the application and you want to evaluate how it affected the income from paying user. All you need to do is to build the report on ARPPU (average revenue per paying user) in March and compare it with the April data.
3rd party attribution
As a rule, analytical systems either work with traffic or build reports on user behavior. devtodev combines both functions: you may analyze the behavior and the traffic at the same time; for example, build a conversion funnel for different traffic sources to compare their quality. Besides, devtodev can receive traffic data from most modern trackers: Adjust, Tune, AppsFlyer.
3rd party attribution report offers to choose any metrics to analyze traffic sources, and any wanted cuts to display the data. For example, you choose to evaluate the quality of sources by the following metrics:
- Gross (total revenue from customers from one source)
- Installs (total number of users from a source)
- Installs cost (total price of all users from a source)
- ARPU (average revenue brought by a single user from a given source)
- 1-day retention (the percentage of users from the source, who returned to the application on the next day after the first visit)
- 7-days retention (the percentage of users from the source, who returned to the application after seven days after the first visit)
- ROI 14 (payback of traffic after 14 days from the start of the campaign)
- ROI 30 (payback of traffic after 30 days from the start of the campaign)
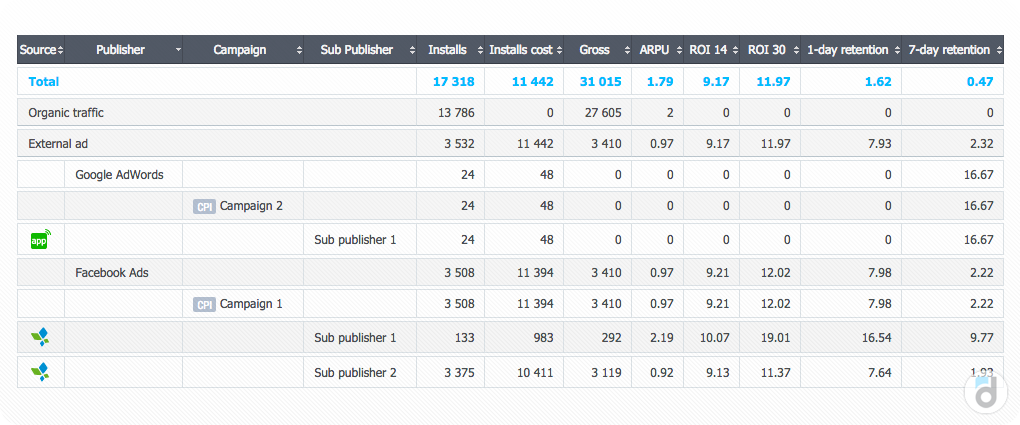
The metrics are located in the report columns (you may select up to 10 different metrics), and in the rows, the traffic sources cuts are located: first, data broken down by campaign and then, by the sub-publishers. You may also choose any cuts: country, website, campaign, device and so on.
With the help of 3rd party attribution, you may find underperforming traffic sources and quickly turn them off, shifting traffic to the sources that pay off better. Direct savings!
Tutorial steps
When launching your project the first time, the user answers himself the question whether he is interested in this app, how it differs from the others, what is its value. The first session largely determines the further long-term retention, and successful monetization of the project. Therefore, it is very important to make the time of acquaintance for a user as perfect as possible.
For this purpose, there is Tutorial steps report in devtodev, which allows you to select more than one hundred (!) steps in the first session, draw a graph of activity on these steps and find bottlenecks in which users are experiencing difficulties and/or leave the app forever.
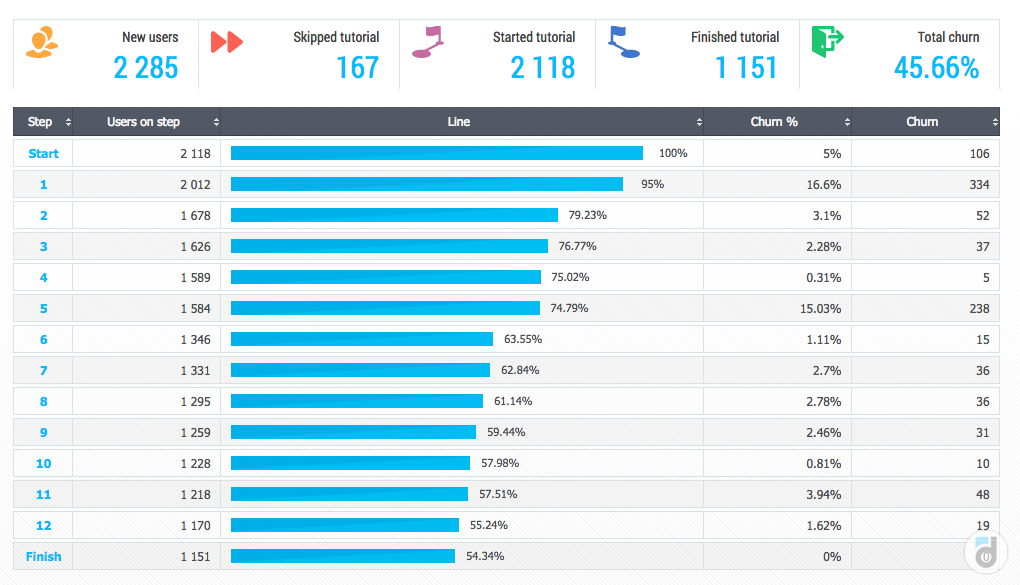
An example of working with the Tutorial steps: One of our customers integrated 120 tutorial steps of gaming project. Among them, there were those that are not visible to the user: loading of textures, loading of levels and so on. Due to such detailed integration, we found out that users churn on these invisible from the outside steps. The project went through technical optimization and reduced the churn of users by 15%, which increased retention rates by 8-10%.
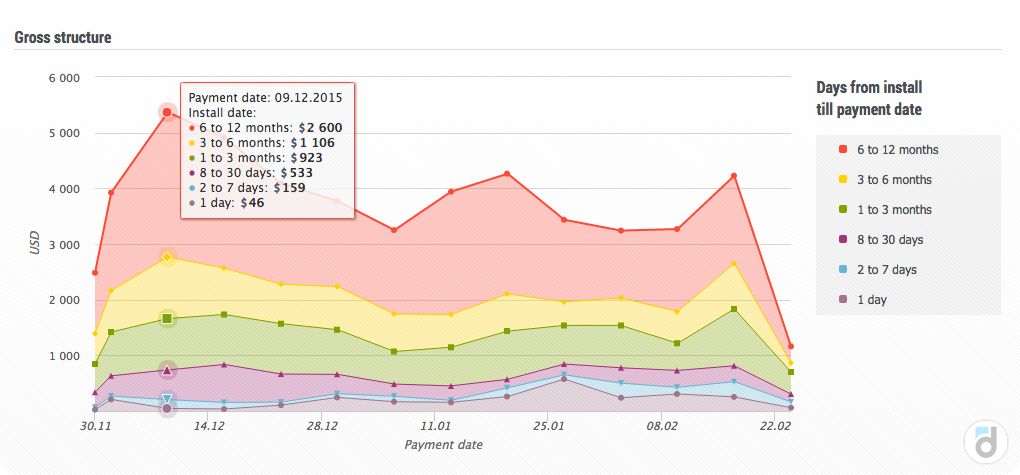
Users & Gross Structure
If users started to pay into your project, this is wonderful. Now you need to understand their behavior: when people are paying and for what, how their activity varies over time, how regularly do they pay and so on. For this purpose, there is a group of reports in devtodev called Payment analysis, and we examine one of them, Users & Gross Structure.
With the help of Users & Gross Structure, you may study the structure of the paying audience and revenue in the cut of time, that passed since the user registration.
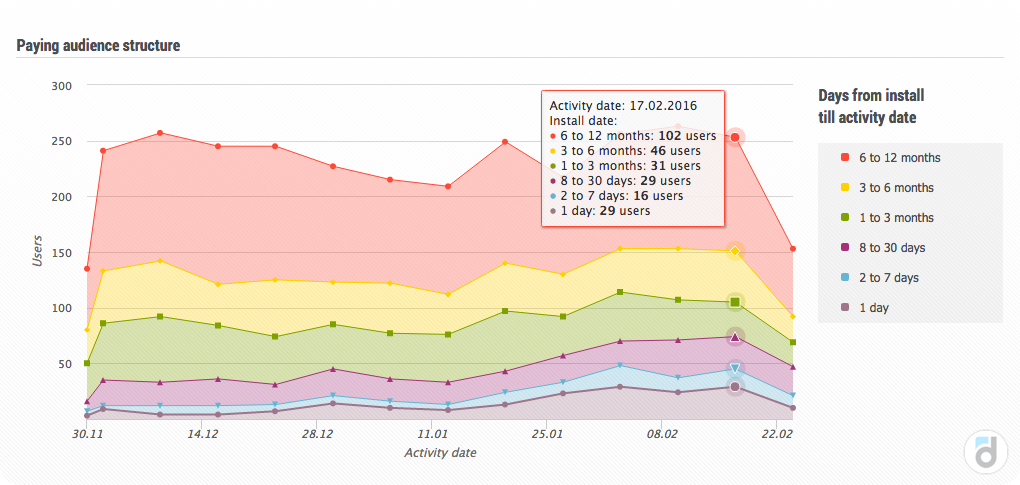
On the first screenshot above it is noticeable that the size of the paying audience is generally stable, but the time cut from the date of user registration helps to note the following signals:
- the number of “newbies” paying users (less than one month from the date of registration) is growing;
- and the number of "oldies" paying users is reduced.
We know that over time, the users payments in the project tend to grow, so the graph reflects a dangerous situation: the project loses those paying users who were registered for a long time.
The second graph shows that the situation also affects the dynamics of revenue. Revenue from users with the date of registration less than 3 months ago, is stable, and the total drop is due to a decrease in payments from the "oldies". So the conclusion is to retain the "oldies" and return them to the project. This might be achieved by sending them a push-notification with a gift or a bonus.
LTV forecast
LTV prediction is one of the most complex and interesting issues in analytics. Typically, the forecast is required urgently, but in order for it to be accurate, you need to wait some time. There is a contradiction, so various methods of calculating LTV try to overcome this issue.
LTV helps to determine price range necessary to buy traffic. You need one average user to bring more money than was spent on his attribution. devtodev predicts LTV, and here's how it works:
- monetization performance of the project is taken as a basis; knowledge about the changes in payments over time helps us to count how much they could contribute at the whole time spent in the project;
- at the same time in devtodev base, we are looking for projects that are similar to your genre, platform, metrics values; their data helps to adjust the forecast.
.png)
LTV forecast is obtained quick and accurate, helping you to predict revenue and determine the purchase price of the future users.
Reports that really help
Thus, using devtodev reports at any time you can:
- understand what is happening with your project at the moment (Usage, Payment metrics),
- find bottlenecks in the process of user familiarity with the application (Tutorial steps report),
- determine the points of growth for your project (Users & Gross structure),
- analyze traffic (3rd party attribution)
- determine in advance how much money one user will bring (LTV Forecast).
And this is just a few examples of improving the performance of your application with devtodev analytics. Our reports do not just collect a huge amount of confusing data; they draw your attention to the problems of the project and help to find a quick way to solve them. Look how it works on demo project, or check on real data – we offer a free trial for 30 days with access to the full functionality of the platform.


: The Basics")
: The Basics")


 in Mobile Games")
 in Mobile Games")


")
")


")
")


")
")


 Tactics for Mobile Games")
 Tactics for Mobile Games")


