
Following the logic that most applications in stores are monetized on the shareware model, articles on app analytics are mainly devoted to this model. However, there are other monetization models that also require high-quality analysts, and this is why we decided to prepare an article on how to analyze the subscription-based analytics for applications.
It will be mainly about SaaS, as this segment is dominated by subscription model.
Let’s start with the most simple question. What metrics are used for analytics of such applications? Basically the same:
- scale metrics (DAU, MAU, users online),
- traffic metrics (CAC, LTV, ROI),
- retention metrics (retention, lifetime),
- monetization metrics (ARPU, paying share, revenue).
Let us dwell in detail on some of them.
Scale Metrics
Speaking about the criteria of efficiency and viability of subscription-based projects, more often instead of the usual inequation LTV > CAC, which simply means the traffic payback, they mention the inequation:
LTV > 3*CAC
Note: LTV (LifeTime Value) — the amount of money received from one user for all the time, in average for the project; CAC (Customer Acquisition Cost) — the average cost of the single user acquisition (it doesn’t matter which model you use to buy traffic, CPA, CPC or anything else, you always may calculate the average cost of the single user acquisition).
Where did this multiplier 3 come from?
This is an expert value which has been formed over the years in the industry. Even it is “average across the board”, we may rely on it according to the experience.
We propose the following interpretation: one CAC we pay for the user itself, the next is payed for user’s retention (servers, technical support, notifications and mailings), the third is the revenue. Even it’s conditional, it’s easy to remember.
Equally conditional (though quite functioning) looks and another criteria of the efficiency of the project:
Traffic payback should occur within 12 months
Why is it exactly twelve? And again it’s an expert value that you may use as a benchmark, moreover a year is a great planning horizon. If your traffic is payed back in 13–14 months — that doesn’t mean your business is not effective, but it means that you have room for improvement. The faster your traffic costs payback, the better.
Read more: Game Analytics Metrics Glossary
Retention Metrics
For shareware projects we usually use 1-, 7-, 28- or 30-day retention. If it’s a subscription-based project, the step would not be a day but a month, as a rule. So it makes sense to use 1-, 2-, 3-month retention and so on.
If the decision of the subscription is preceded by a trial, which lasts for a few days, it makes sense to measure the retention metrics for each day of the trial.
One more recommendation: if your project has an unlimited ability of free use, it makes sense to calculate retention separately for paying and non-paying users. Actually, the retention in this kind of projects is the retention of paying users. And retention of non-paying users may be used as a signal to convert this kind of users into paying audience.
For SaaS the churn of users is also calculated — user’s outflow. This metric is opposite by the meaning to the retention metrics and means the amount of users (or money) that left the project within a period.
Wherein, if you calculate churn rate in money and not in users, it is possible (and should be!) to make this churn negative. In general an interesting metric is perhaps the only one of its kind, if it is less than zero, it’s great.
Negative churn measured in money is a situation when existing users are beginning to pay more, and this increase covers the outflow of money from the users who left the project.Thus, to achieve negative money churn, it is necessary to work on those user’s retention, who are about to leave the project, and to increase the amount of money from active users (for example, to offer them other price plans).
So we gradually came to monetization metrics.
Read more: How to Integrate an Analytics System into your Game
Monetization Metrics
Speaking of ARPU (= Revenue / Audience), we'd like to note, that there isn’t a lot of sense in calculating ARPU every day (or ARPDAU). This metric wouldn’t tell you anything.You should calculate it only by month (take the revenue for the month and divide by the monthly audience, MAU).
Also for the subscription-based projects, a special category of metrics applies — MRR (monthly recurring revenue) or ARR (annual recurring revenue).
MRR is divided by:
- Churned MRR — money lost on users who left the project and stopped subscription within a month;
- New MRR — money we received from users who subscribed within a month;
- Expansion MRR — money we received from users who moved to more expensive price plans within a month.
Thus, for each month the metric should be calculated:
MRR = New MRR + Expansion MRR — Churned MRR
Note that MRR is not the total revenue of the project. This is an indicator of qualitative changes that the project has undergone in the past month, in terms of money. To maximize MRR, it is necessary to reduce Churned MRR (to work on retention), to increase New MRR (be open to new users and successfully convert them) and Expansion MRR (offer other price plans to those users who already make payments).
One more important metric is LTV. With regard to how LTV should be calculated, a number of articles and books are written. Here we would like to share a simplified formula for the calculation of LTV for the subscription-based projects:
LTV = subscription cost / churn
The formula looks too simple, right?
Let’s look at an example.
Let’s assume, in the first month we have 100 users who subscribed, and subscription cost is $1 per month. Churn the project is very high and amounts to 90%.
We receive from the users in the first month: 1*100 = $100. The next month 90% of users leave the project and there is only 10 users left. From them we recieve 1*10 = $10. And in a month there is only one user left, and we receive $1 from them. And then he vanishes. Total, we received $111 from 100 users. So on average we received $0.90 from one user. Let’s calculate LTV according to our formula: LTV = 1 / 0.9 = $0.9.
It works!
In fact, this formula only works for cases when the churn of users doesn’t change from month to month, ie the probability that the user goes from the 1st month to the 2nd month coincides with the probability of the transition from any month N to month N+1. But this is not always the case.
Also, this model does not account for expansion MRR, which exists in a large number of projects.
Read our ebook on acquisition metrics!
Activation
In subscription-based projects the activation should be divided by two stages:
- primary activation. The user comes to the site (or downloads the app), explores it, answers himself the questions “what is it?”, “how is it going to change my life?”, “how much is it going to cost me?” and decides, whether to return to the project again (or, for example, to activate the trial version);
- activation into subscription. The user passes the trial and makes a decision about subscribing for the first month.
Actually, it is necessary to optimize both stages of activation. In such projects, it is particularly noticeable that the first session and the first time of using the project — is a key point to be optimized. The better you inform the user about the benefits of your project, the better your chances to convert him into the primary subscription, as well as into all the subsequent.
Perhaps, it is not even the feature of the subscription-based project. It is another reminder that the optimization of FTUE (first time user experience) is very important.
Segmentation
By analyzing all the users of the subscription-based project, you receive the “average across the board” metric values and are likely to make the wrong decisions.
To ensure that your decisions are more balanced, you should analyze separately each segment and calculate the metrics separately for users of each segment.
We recommend to allocate the following segments:
- Paying and non-paying users (in case it is possible to do at least anything in your project for free);
- Subscriptions for 1, 2, 3 months and so on. Looking at the users who renew (or don’t renew) the subscription, you can better understand the nature of the decision on the renewal, as well as measure the probability of renewal from month to month.
- Segmentation by the price plans. Every price plan is a separate segment.
Also, for the study of such projects we recommend using cohort analysis. It allows to monitor users dynamics in time, and to notice the qualitative changes in your project.
Usually for the cohort analysis, the users are grouped into cohorts by day (in our case — by months) of the registration and the metric is calculated in time.
For example let’s take half of the year in project life, look separately at the user’s cohorts registered in each of the months and study the percentage of users left in the project from month to month:
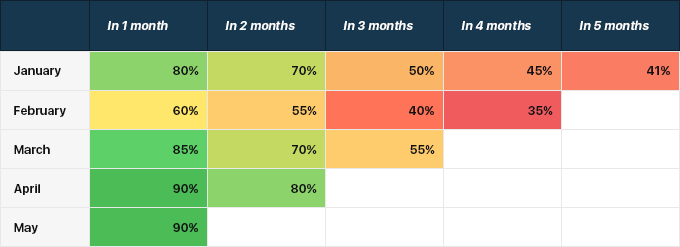
Analyzing the table from top to bottom, we see qualitative changes in the product. In particular, pay attention to the first column: something happened in February, causing the reduction in the amount of users. Then the project headed for a fix, and from May to June 90% of users remained in the project.
Then, analyzing the table from left to right, we are tracking the behavior of the particular cohort of users, that were registered in the same month. If you look at the first line, you may see the percentage of users left from the initial amount, when passing from month to month. And by the way, in the first line it looks a very sharp transition from 70% to 50% — it is a reason to find out the challenges faced by that users in that month.
In our opinion, these are the main features of subscription-based app analytics.


: The Basics")
: The Basics")


 in Mobile Games")
 in Mobile Games")


")
")


")
")


")
")


 Tactics for Mobile Games")
 Tactics for Mobile Games")


