
In this article, we are going to discuss time frames of day zero and day one retention rate calculations.
Retention rate is the most widely known and commonly used analytics metric. It says a lot about the quality of your product and your revenue. Although the revenue is not a direct function of the time users spend in your product, for some apps and games the correlation is very strong. As we can see on the data provided by devtodev clients, the longer the users use certain mobile apps, the higher the chance that they will spend money on it. Even more, the larger amount of money they will spend.
Retention rate is an extremely important metric. What do you know about it? Can you answer some basic questions?
Read more: Retention by Event Report - a Reliable Way to Measure User Loyalty
How Exactly do you Calculate Retention Rate?
- What is your starting point?
- What event indicates that the user has returned?
- What is a “day” when we are talking about a day N retention rate? Is it a calendar day or a 24-hour interval?
- If it’s a calendar day, then what time zone do you use?
In case you can’t answer these questions, you can read the documentation provided by your analytics platform or ask your analyst if you have one. The answer will probably surprise you. By the way, the difference in calculation methods is responsible for a fair share of misunderstandings because different analytics platforms provide retention rates that do not match.
Read more: Retention is Dropping - What to Do?
Let’s answer the third question: “What is a “day” when measuring the retention rate”. If all your users live in a single time zone then you can simply change server time so that it’s the same for both parties — your system and your users. This way you can be certain that your retention rate is calculated with 100% accuracy (up until you get a user who lives in another time zone).
This rather looks like an ideal case, however nearly always your users will live in different time zones. Sometimes, you are going to see a difference of much more than one or two hours.
How do you calculate retention rate if half of the users live in Europe and half — in the USA? What is a “day” in this case? Let’s take a look at the two most widely used calculation methods.
Read more: Rolling Retention
Calculate by Calendar Days and by 24-Hour Intervals
When you calculate retention rate by calendar days (e.g. day one), an average system includes all users who opened your app within the period from 0 to 48 hours from the installation.
Why 0? Because the user might install it at 23:50 on the 3d of September and open it at 00:14 on the 4th of September.
Why 48? Because they could install the app at 00:10 on the 3d of September and open it at 23:50 on the 4th of September.
However, 0 and 48 hours are values that are rather on the extreme side. Most users open the app within 12 to 36 hours.
The hourly retention rate calculation is much less vague. In this case, the D1 retention rate includes all users who opened the app within the period from 24 to 48 hours from the moment of its installation. Therefore, the hourly D1 retention rate is always less than the one calculated by calendar days.
Let’s look at the following graph:
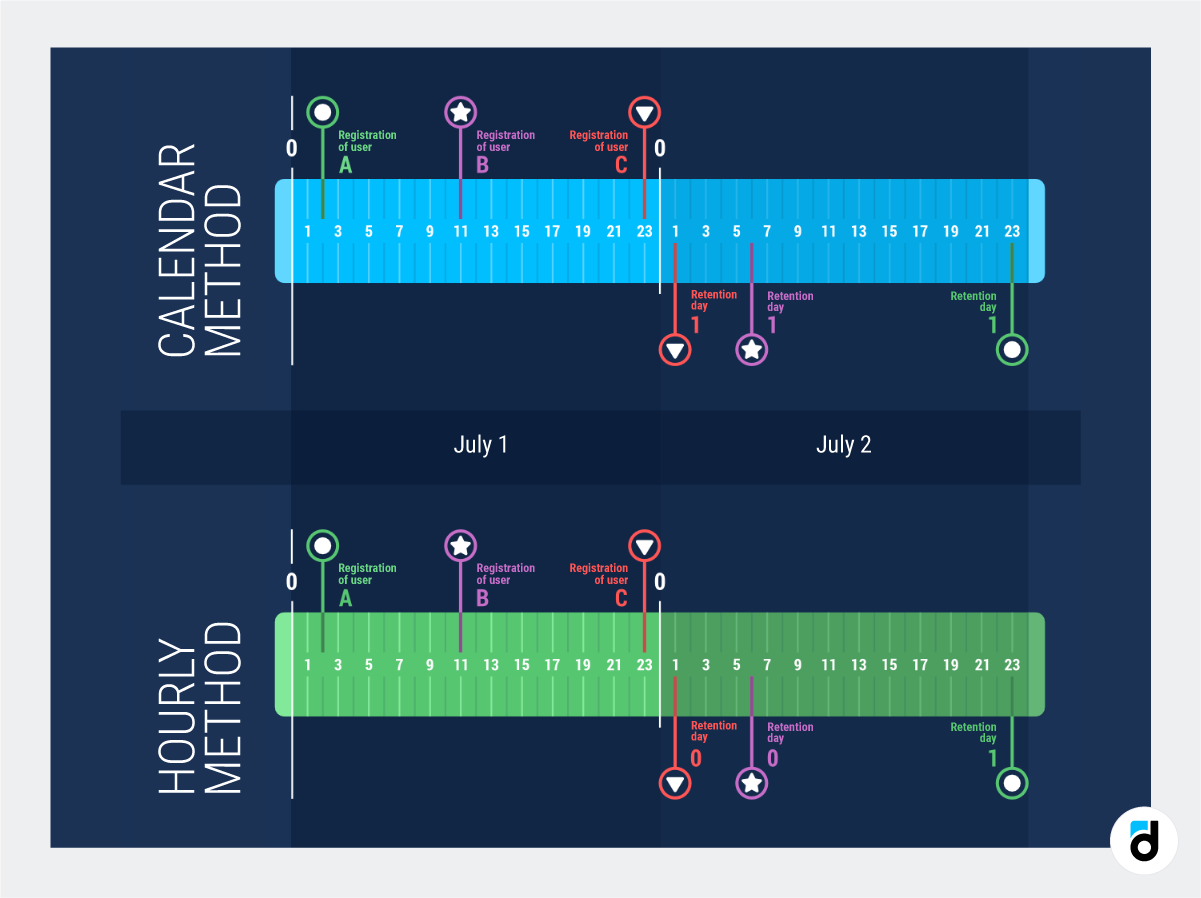
Here we have three users — A, B, and C. All of them installed the app on the first of June.
If you use the calendar method, the calculation is simple - all three users who opened the app on the second of June are included in the D1 retention rate. Even the user C who installed it at eleven p.m. and opened one hour later - at 1 a.m.
If you use the hourly method, the situation will look completely different because we will calculate the number of hours that passed between the installation and the first opening. In this case, only the A user will be included into D1 retention rate while users B and C will not because they opened the app in less than 24 hours after app installation. They will be included into the D0 retention rate.
Read more: A Simple Guide to Analyzing Paid Traffic and Avoiding Fraud
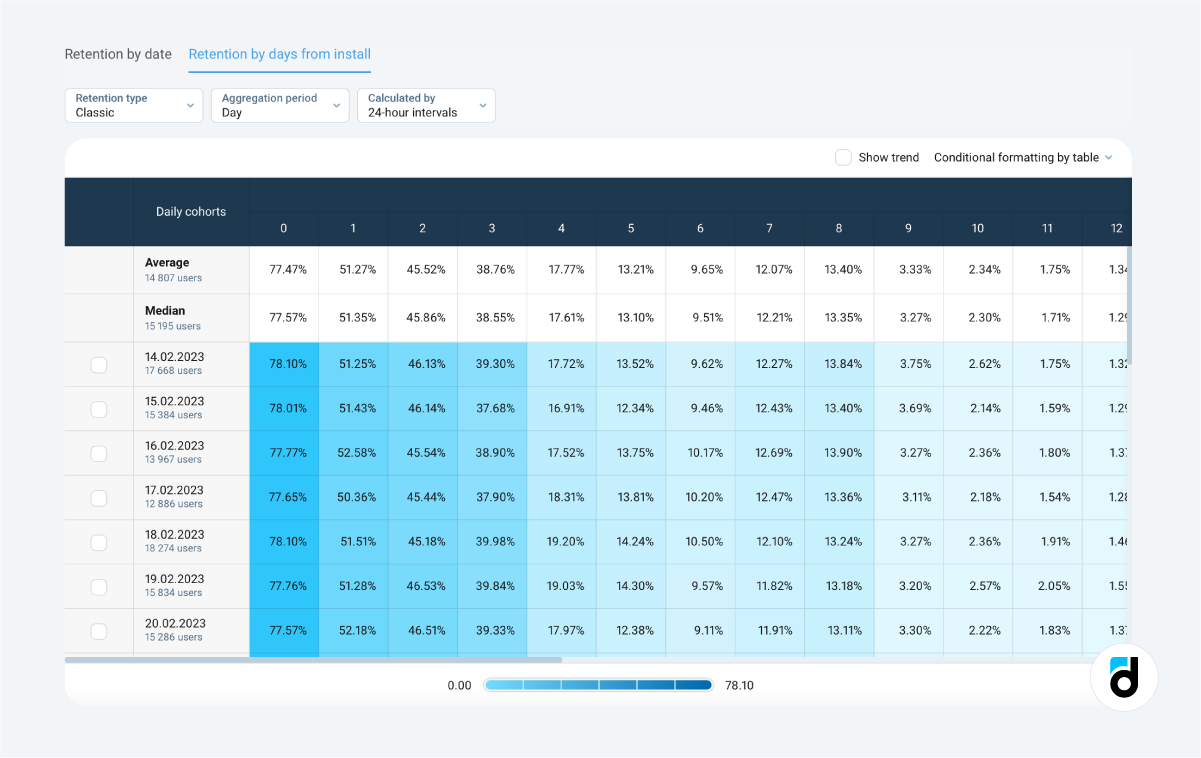
How does it Work in a Real Analytics Platform?
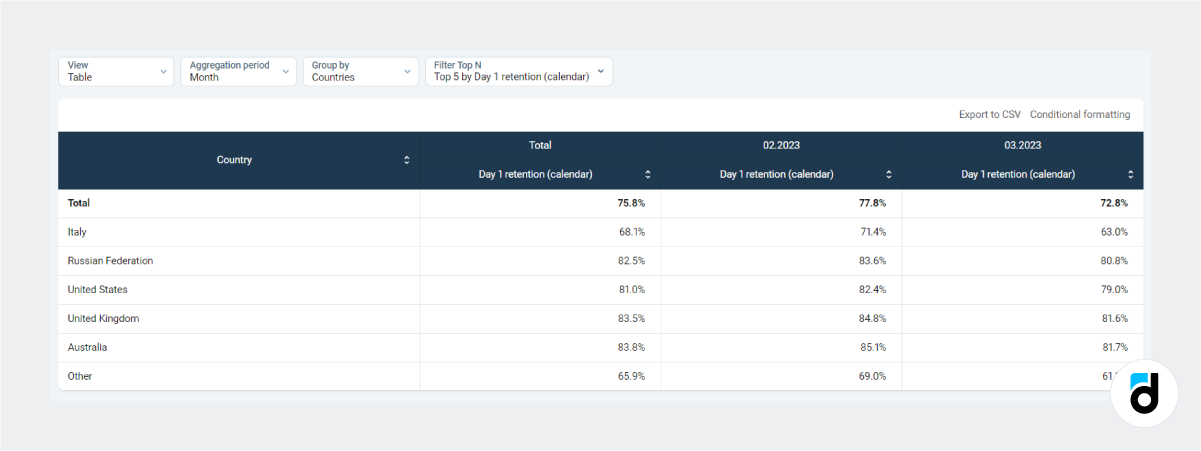
Let’s look at an analytics platform such as devtodev. It uses both approaches to calculating retention rate:
-
You can choose to calculate retention rate by calendar days. A “day” is set by the client.
-
Or you can use the default option and measure time by 24 hour intervals. For example, a user who opened the app within 24-48 hours after the installation, will be included into the D1 retention rate calculation.
What has Changed?
Some projects do not see any changes in retention rate regardless how they calculate it - by calendar days or by 24 hour intervals. These are the projects that a) have few users and b) most users live within the same time zone.
Other projects, however, can see their D1 retention rate change by 4-5%! It is a lot, considering that the average D1 retention rate is about 30%.
After devtodev introduced calculation of the retention rate by 24 hour intervals, it came to an idea of a new metric which is now called “Day zero retention rate”.
Read more: Accurate LTV Prediction using Machine Learning Model
Day 0 Retention Rate
What exactly is it? Day zero retention rate is the share of users who reopened the app within 0-24 hours after the first launch. It’s the share of users who got interested in the product enough to open it for the second time in the space of the first several hours.
D0 retention rate along with ‘Total conversion rate’ and ‘D1 retention rate’ metrics plays a crucial role in assessing user behaviour during several days after the first app launch.
devtodev analytics platform allows you to unify data on all kinds of retentions, set up a single pattern that will be accessible for all team members, and derive far easier even more information from your data.
N.B. The relative value of D0 retention is 30-40% higher than the D1 retention rate.