
In devtodev's webinars and in many articles one simple idea is often repeated: the first session of the user (first time user experience or FTUE) is very important.
Let us explain: a good dress is a card of invitation, and the more user likes your product during the first acquaintance with it, the higher will be the short-term retention, the higher will be the long-term retention, and finally the higher will be the monetization metrics. It turns out that the optimization of the first session is what should be focused on first. Besides, the changes in the first session (in case of games — it's usually the tutorial) is usually much cheaper than any changes of the key product features.
That's why we, at devtodev, developed the Tutorial Dynamics report that helps to measure the variation of the efficiency of the first session over time.
The fact is that not all the users pass the tutorial immediately — it would be wrong to assume this. Some users need a day or more to pass the simple training phase: and that's not about the level of the user, but rather about his spare time.
Moreover, we should not forget about the fact that the user may fall in churn at the stage of learning, and that the tutorial can be skipped altogether.
Read more: Best Game Analytics Platform: devtodev vs DeltaDNA
Tutorial Dynamics Report describes how quickly the users are passing the learning phase and identifies separately those who started the tutorial, but never finished it, and all those who skipped it.
The relation of these categories of users defines the concept of the effectiveness of the first session.
In the report you may see not only the dynamics of the new users, but also the information on how well and how quickly they pass the training phase:
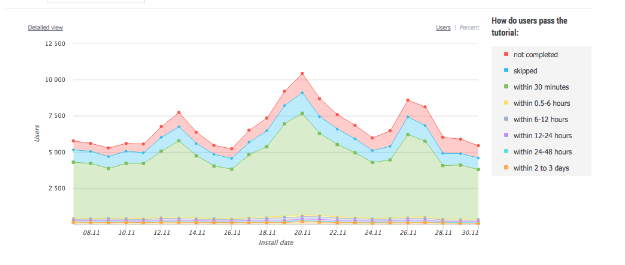
On the horizontal axis in this report the dates of registration of the players are placed, and on the vertical axis — the number of players registered on that date, and the number of players passed / not passed / skipped the tutorial.
We see that this game's tutorial is simple enough, and most of the players pass it in 30 minutes (green area). Only a small share of users skips it (blue area), or falls in churn during the tutorial (red area).
Turn on the display in percentage and see how the share of these categories of players changes in dynamics:
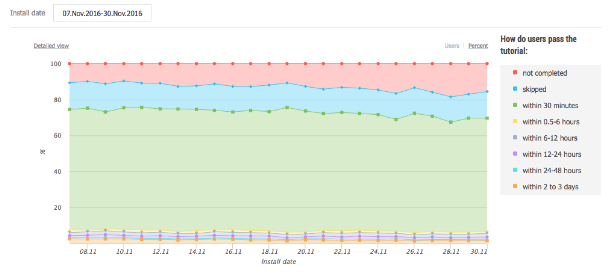
Almost don't change: 75% of the players passes the tutorial. However, a slight decrease of the share in the last week of November is a signal, that may indicate that the tutorial was amended, which causes some difficulties for the players.
Let us consider another case.
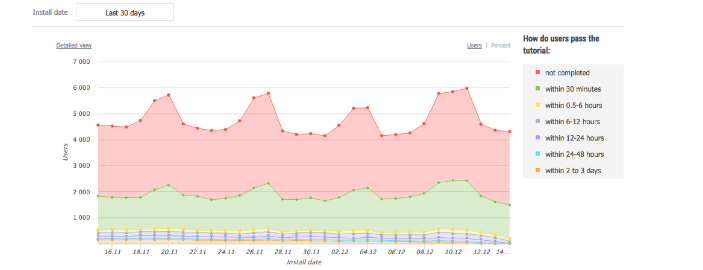
Here, we may see that the share of players, who falls in churn on the tutorial is much higher. It is impossible to skip the tutorial in this game, so the blue area is not available, but the ratio of the red and green areas is alarming.
In this report, you can turn off the details of passing the tutorial by time and easily compare the share of those who passed and not passed the training stage.
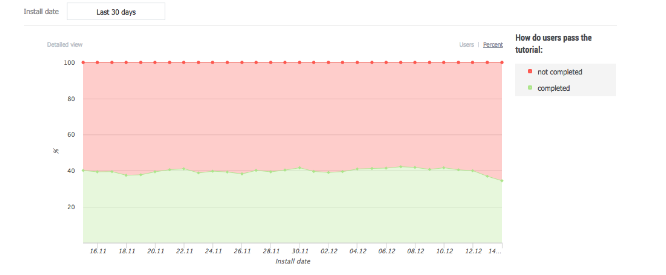
The share of those who pass the tutorial is slightly reduced in the last few days, but this is normal: as we have seen before, a lot of players prefer to pass the tutorial in this game for a few days, they are simply not finished yet.
But in general, only 40% of the players pass the tutorial! Admit that it is not enough. The optimal value is 70-80%.
How to understand what prevents players from passing the tutorial, at what stage they have difficulties or lose interest?
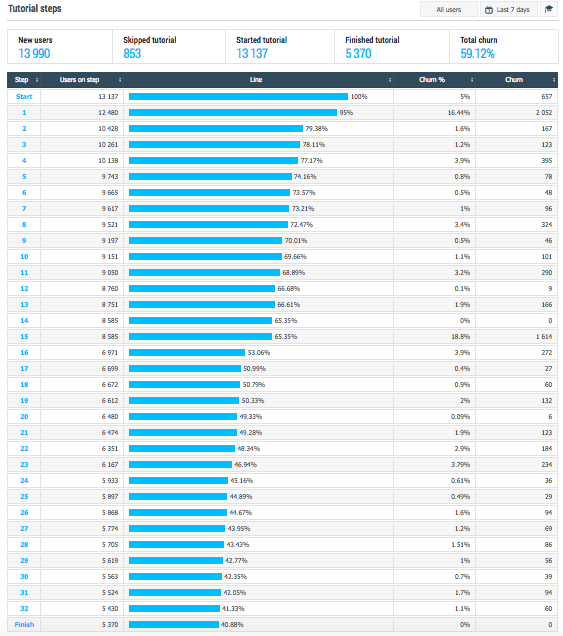
The thing is that this report is excellently paired with another report from devtodev, called Tutorial Steps. In fact, Tutorial Steps is the funnel of the first session, which can be built of more than a hundred steps and shows where people fall in churn during the tutorial.
Read more: How to Analyze App and Game Subscriptions
And we see the two points that cause the maximum churn right away: the transition from step 1 to step 2 and the transition from step 15 to step 16. We should run to the developers to find out what's going on and optimize the tutorial.
Сase study:
One of our customers has integrated 120 steps of tutorial, including even those steps that are not visible to the user (when the loading of the characters, scenes, textures is performed). And this report has shown that the greatest churn occurs on these invisible levels: tutorial is too heavy and slow, the user simply does not wait until the level is loaded and turns off the application (probably forever). Subsequently, the tutorial was optimized, and the 1-day retention increased by 10%! Considering that the average value of this indicator for the mobile games is about 30%, it's not bad at all.
It is also worth mentioning that the reports Tutorial Steps and Tutorial Dynamics can be built not only for all users at once, but also for any given user segment. Thus, it is possible to compare the effectiveness of the first session for the different categories of users: by country and language, by device, by the version of the application, by traffic sources.
The combination of these reports allows you to:
- measure the speed of passing the tutorial;
- keep track of the share of those who fell in churn on the tutorial or skipped it;
- measure how successful the effectiveness of the training phase changes from version to version;
- find the bottlenecks in the first session, where people fall in churn and lose interest.
And all this together allows you to optimize your first session. There is no limit to perfection, and this process can and should be iterative. And do not forget that the first session determines all subsequent metrics, including monetization.