
What do you do when your retention is dropping? What reports are you going to open in your analytics platform and what metrics are you going to analyze?
In this article we are going to describe a path that you may walk when you discover that your retention rate started to decline without obvious reasons like a recently rolled out update.
If you want to get familiar with an analytics platform, open the free demo project of the devtodev analytics platform and simply repeat after us!
Step 1. Producer notices that the retention is falling
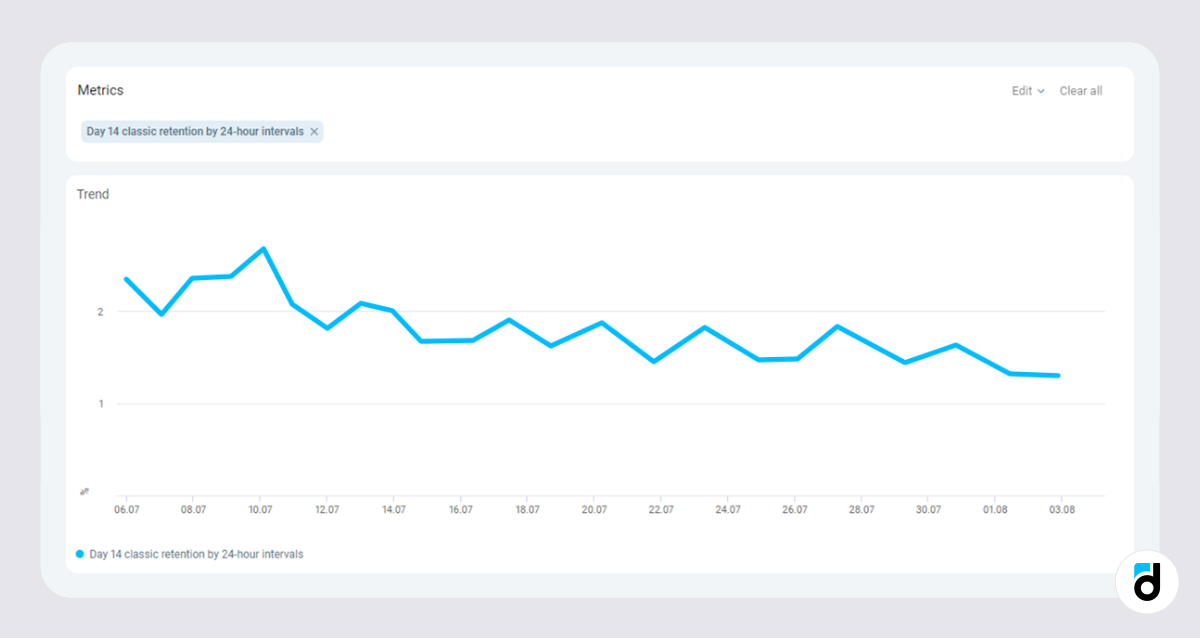
Your producer opens the Day 14 classic retention by 24 hour intervals report (Smart view -> Engagement -> Retention) or looks at one of the dashboards, and notices that your retention rate started to slowly decline twelve days ago.
Step 2. Analyst is trying to find the issue
The producer communicates the problem to an analyst. The analyst first tries to find other metrics that dropped, if the short-term retention has changed, what is the number of new users by sources and countries (Basic metrics or Acquisition -> Detailed stats )
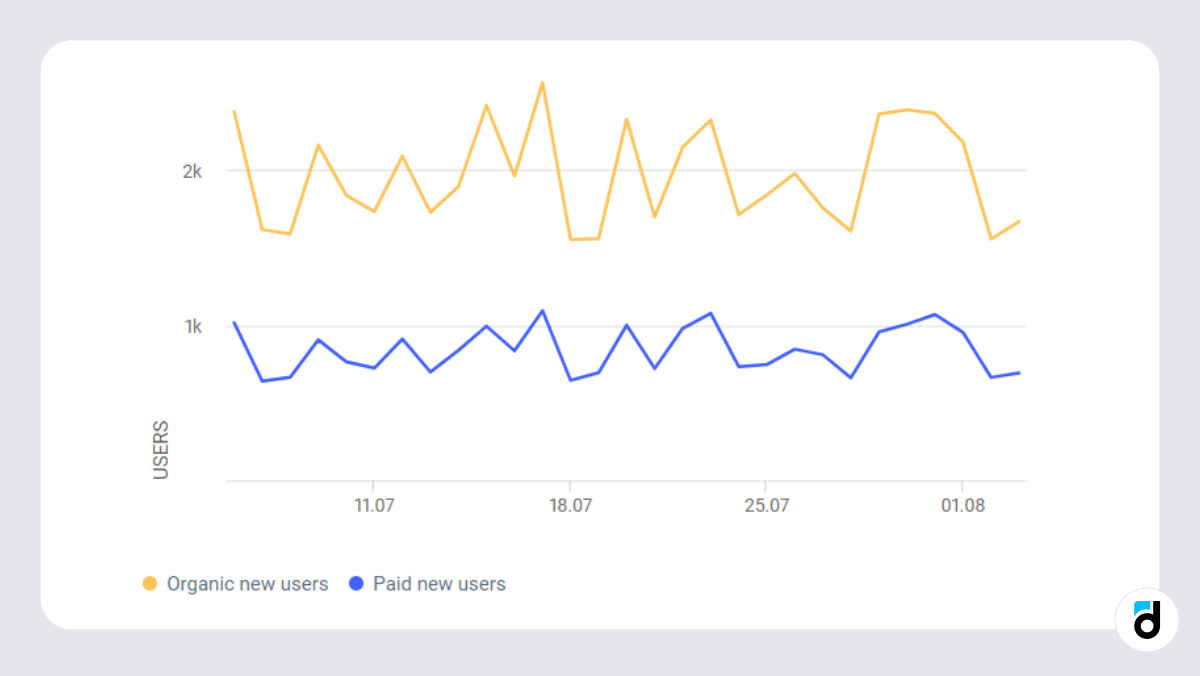
They will also analyze the incoming traffic. Probably, you’ve purchased traffic from other sources and you’ve acquired wrong users who are not interested in the product.
If the retention is declining over all sources, then you need to look for the reason in your app or game. You can check retention by OS, country, language, etc. The more detailed data you have, the more chances to find the cause of the decline you have.
Read more: How to Integrate an Analytics System into your Game
Step 3. Analyst finds the issue in traffic from the US
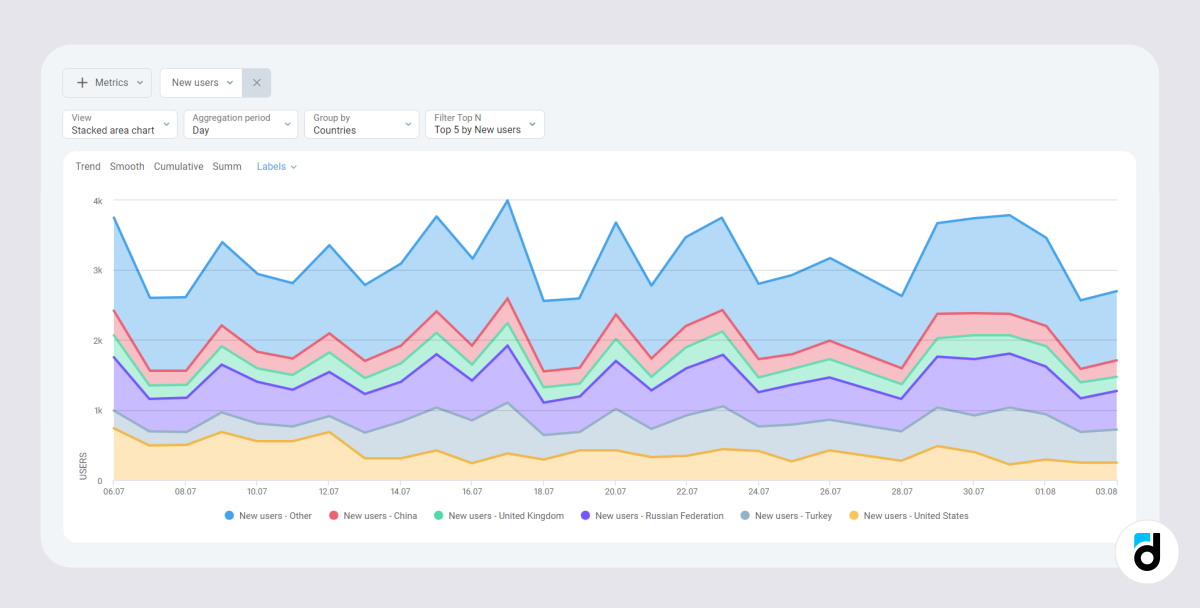
After analyzing some metrics, the analyst finds out that traffic from the US has dropped.
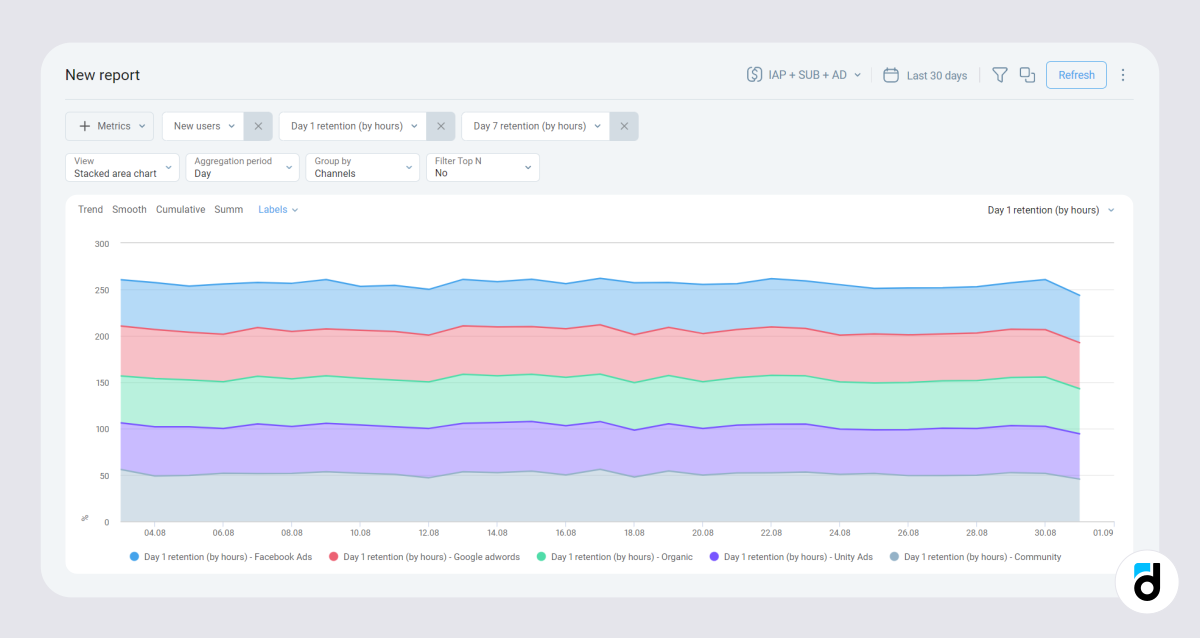
While the overall number of new users hasn’t changed (Smart view -> Acquisition -> Monitoring):
Step 4. The solution
Reports -> Basic metrics ('metric' - new users, 'group by' country, 'filters' - 'channel type' - paid channels)
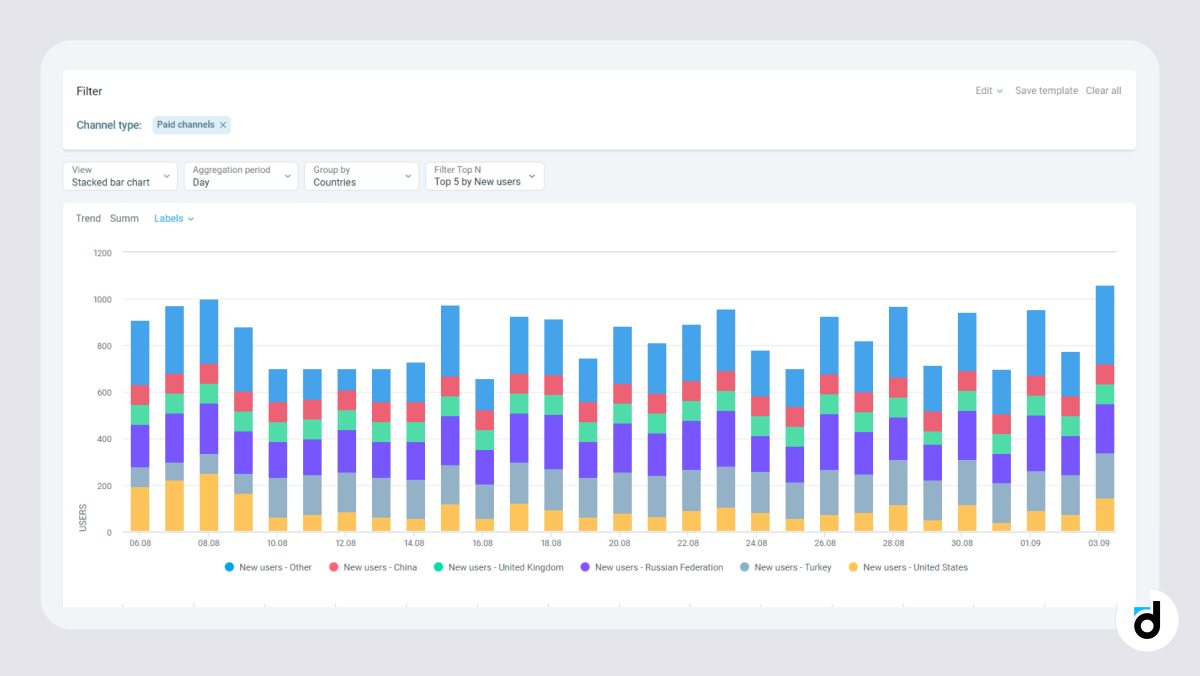
Obviously, 12 days ago we altered the advertising strategy and cut the budget on ads aimed at US citizens.
Read more: How to Apply Analytics at Every Stage of Product Development
Now we need to check its implication on the company’s revenue.
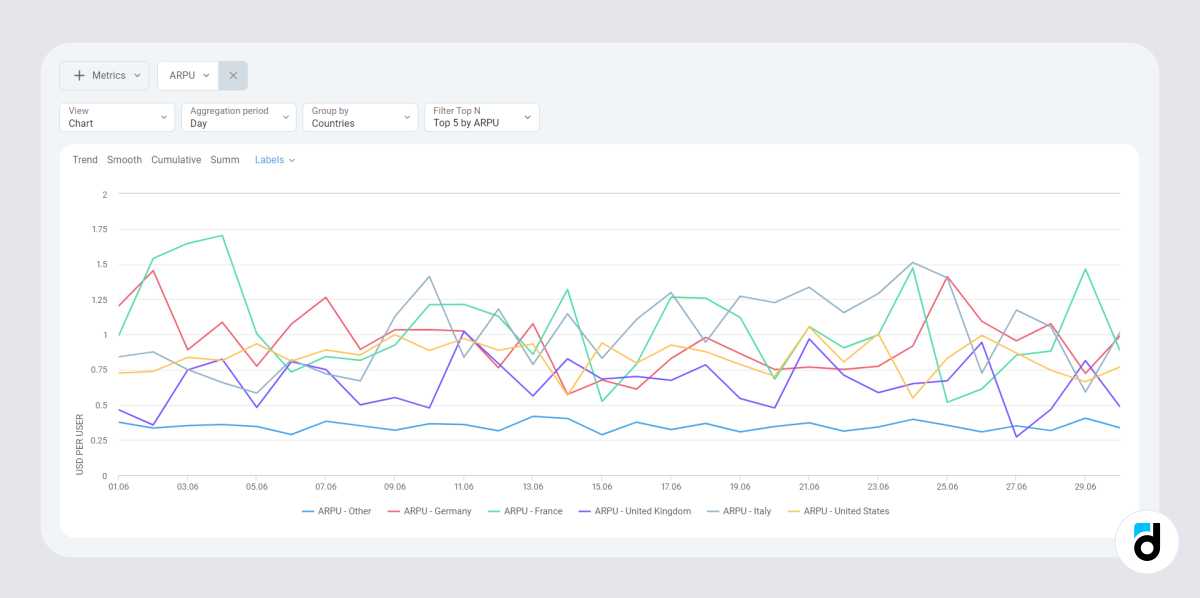
The analyst opens a report on ARPU by country for the previous period and finds that United States traffic ARPU was quite good:
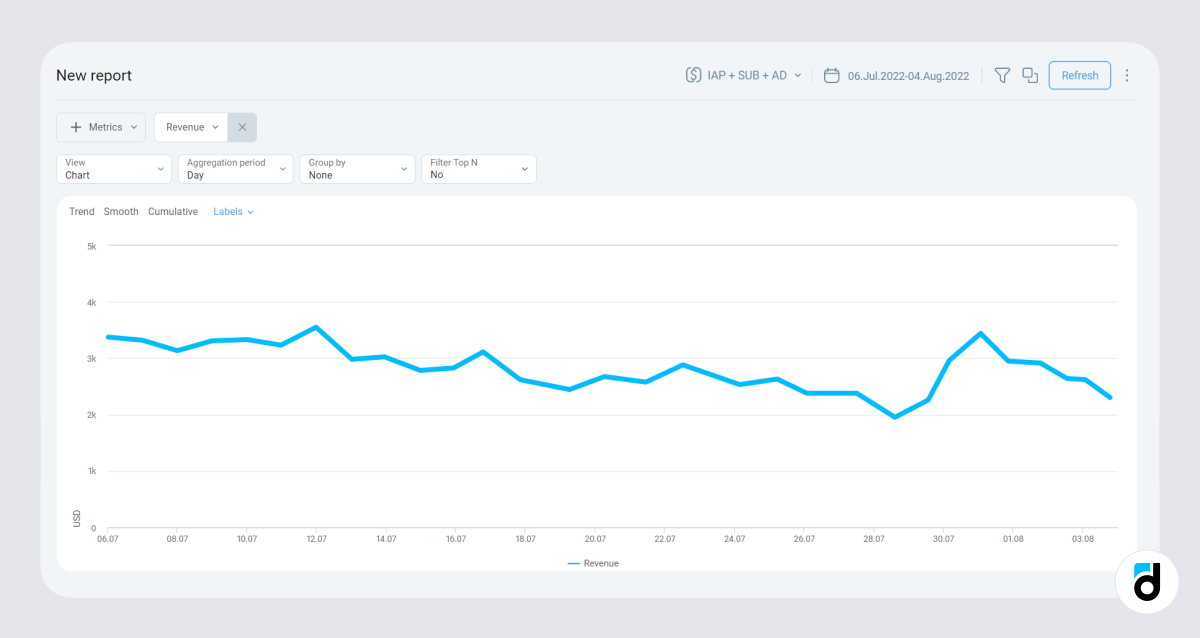
Then they open the report on revenue and see a stable decline:
Step 5. Retention has increased!
The analyst sends all the acquired information to the product manager and convinces them to resume ads aimed at US users.
After the manager reassigned the ad budget, our retention rate increased to the pre-issue level and so did our revenue!