")
Let’s figure out how we can calculate active users, what indicators we should use to segment them, and what statistical anomalies exist when you assess the audience.
A project audience is filled up with new users every day. Some of them lose their interest very quickly, one or another sometimes come back to the app, and others use it regularly. And the representatives of all these segments definitely open the app daily. Today we will talk about them - active users.
Active users are those who had at least one session during the selected time period. These intervals can be different, but mostly the following three groups are tested: daily, weekly and monthly audiences. They have well-established names:
- DAU - the number of unique users per day (Daily Active Users);
- WAU - the number of unique users per week (Weekly Active Users);
- MAU - the number of unique users per month (Monthly Active Users).
At the same time, it is possible to make similar calculations for any other periods, if they meet the KPIs of a company. For example, looking back on the year, we can count a yearly project audience and compare it with previous years to evaluate the dynamics.
Read more: How to Analyze Ads, In-apps and Subscriptions
It is worth paying attention that WAU for a certain week is not the sum of DAU for 7 days, since we are talking about unique users. For example, one of them can open an app on Monday and Tuesday, and they will get into DAU of Monday and DAU of Tuesday. But within a week (from Monday till Sunday) they will be counted only once.
The same goes for MAU. It is not the sum of 4 WAUs and 30 DAUs. From the calculation standpoint , these indicators are not interconnected and are computed separately.
Take a look at devtodev pricing!
To understand these indicators better, let's calculate them using an example.
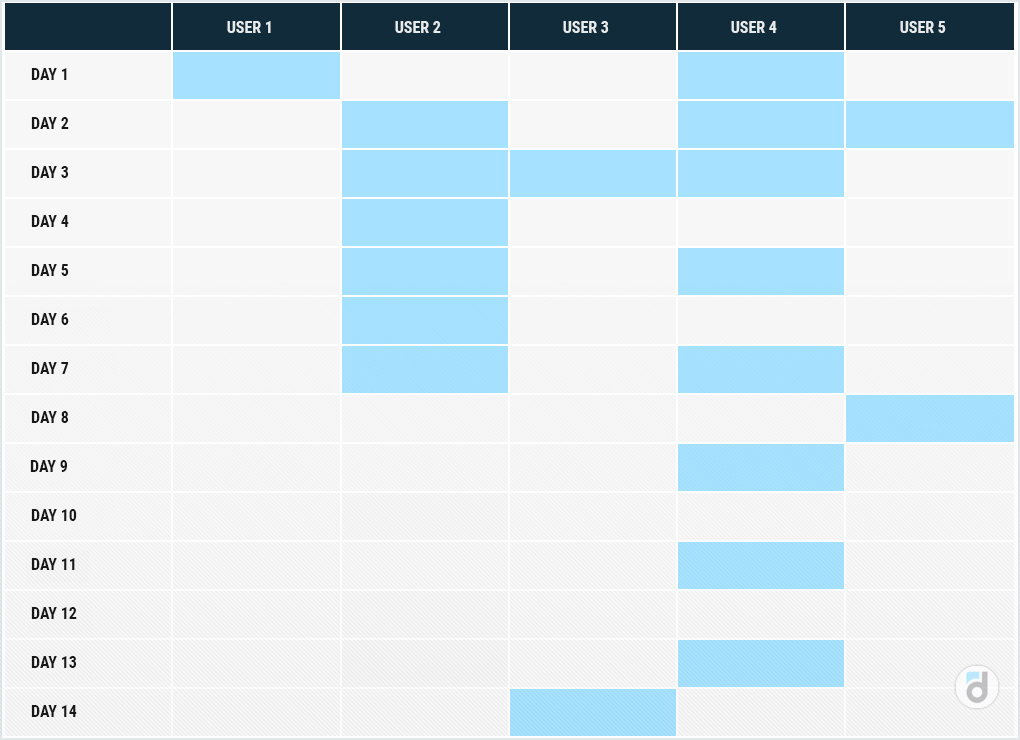
Let’s suppose we have information about various users’ app sessions for two weeks. No matter how many times a day a user logs into the project, this user will still be one unique visitor.
The days when users opened the app are marked with blue:
Read more: How to Apply Analytics at Every Stage of Product Development
So, let’s calculate the DAU for the 1st, 2nd, 5th, and 10th days first. To do this, we need to know how many unique users opened an app during these days:
- DAU of the 1st day = 2 (users 1 and 4);
- DAU of the 2nd day = 3 (users 2,4,5);
- DAU of the 3rd day = 3 (users 2,3,4);
- DAU of the 10th day = 0 (no one opened an app during this day).
And now let’s calculate WAU:
- It is 5 during the first week (from day 1 to day 7) — all the users opened an app;
- in the second week (from day 8 to day 14) this indicator is already 3 — the first and second users did not have any sessions.
We can choose any random week as well. For example, if we take a period from day 3 to day 9, WAU will be equal to 4.
In the same way, we can count Active Users for a month, for half a year, and for other time intervals.
Only 5 were represented in our example, and in a real project, there will be thousands, hundreds of thousands, millions of users who open the app daily. And the way they open the app indicates its stability, quality, and scale.
Read more: Game Analytics Metrics Glossary
In addition, it is more reasonable to track the active users metric in real time. If something goes wrong inside the app or on a server and users aren’t able to use a product, it will immediately affect this metric. To keep it under control, we can group users not by days, but by hours or even 10-minute intervals.
By the way, active users who are currently inside the app represent a separate metric that has its own name. Most often they are called 'users online', but we can also find such abbreviations as CCU (concurrent users) — users who are in an app at a certain moment, and PCCU (peak concurrent users) — the maximum number of users which are simultaneously inside the app.
The average CCU reflects the scale of a project well, and the PCCU is very important when planning server load.
Active users dynamics can change not only within a day, but it can also gradually rise or fall month by month. It is rather important to control it. Segmentation helps to simplify the analysis of changes in the number of active users. Thanks to it, you can quickly understand which segment of users caused the indicator to change
Here are some options of active audience segmentation.
By payments:
- paying / not paying
- made only 1 payment / made repeated payments
By the date of installation:
- 1 day / 2-7 days / 8-14 days / 15-30 days / 30- 60 days / 60+ days
By the frequency of visits:
- Every day / 4-6 times a week / 1-2 times a week / once a month and less
We can also divide them by countries, devices, operating systems, or by a custom event (which means that the audience is divided into users who performed or did not perform a certain action).
The last segmentation option can be used if an app has a key event that is important for completing a game experience or for creating the right first impression of a product (for example, completing a tutorial, N game levels, or visiting a store).
Read more: 5 Key Soft Skills of Game Analysts
It will be much easier to look for a possible cause of the problem when you identify the segment where a decrease of active users occurs.
This is what may happen:
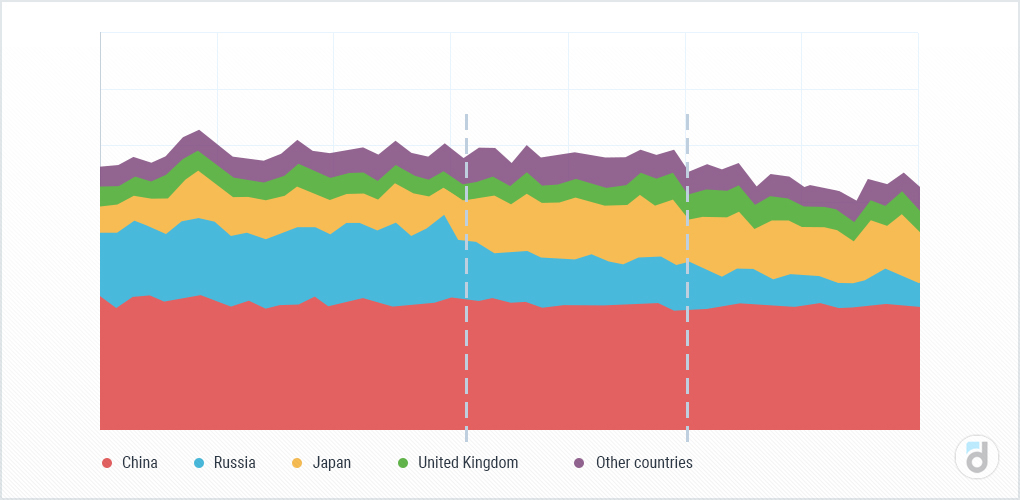
First, the number of active users in Russia begins to decrease, while the number of visitors from Japan increases, which compensates for the fall in another country. If we look only at a general DAU chart, we are unlikely to notice any changes over time. Only when the number of active users in Russia falls even more, we’ll be able to see it on the general chart. Meanwhile, quite a lot of time may already pass, which could be used to find and eliminate the cause of this fall.
Simpson’s paradox is one more statistical anomaly that confirms the importance of segmentation.
Practice using free devtodev demo
Let’s look at an example. We take four countries from the previous example and assume that they have the following paying conversion:
| Country | New users | Paying users | Conversion rate |
| Russia | 3,300 | 160 | 4.85% |
| Japan | 2,250 | 100 | 4.44% |
| United Kindom | 2,400 | 170 | 7.08% |
| China | 8,600 | 600 | 6.98% |
The next step is to calculate the total conversion rate of European and Asian countries:
| Region | New users | Paying users | Conversion rate |
| Europe | 5,700 | 330 | 5.8% |
| Asia | 10,850 | 700 | 6.5% |
As a result, we get the following:
- The conversion rate in Russia (4.85%) is higher than the conversion rate in Japan (4.44%);
- The conversion rate in the UK (7.08%) is higher than the conversion rate in China (6.98%);
- The overall conversion rate in European countries (5.8%) is lower than the conversion rate in Asian countries (6.5%).
All this once again suggests that segmentation may give results that are completely different from general indicator statistic .
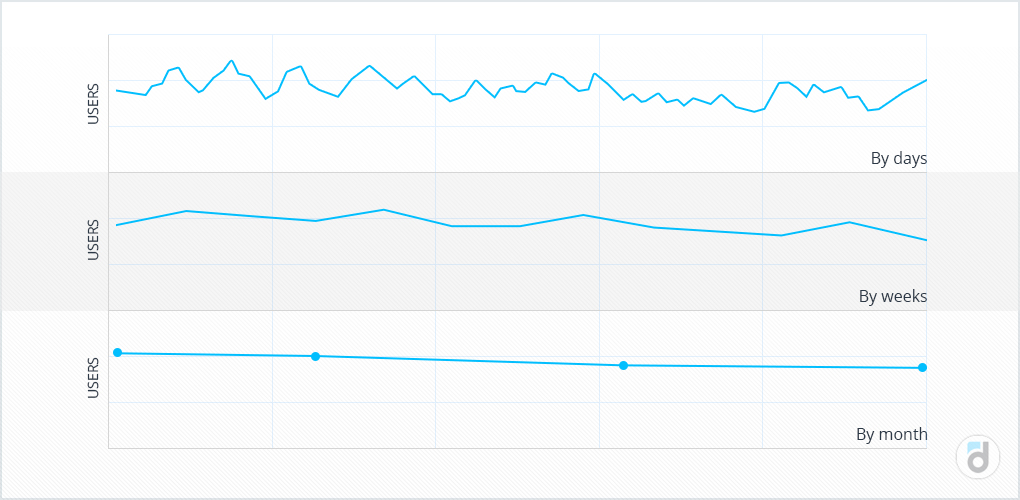
By the way, sometimes, it is impossible to determine this tendency clearly by looking at the DAU chart. But when you make groups by weeks or months (converting the chart to WAU and MAU) it becomes more evident.
Read more: 4 Simple Methods of Paying Audience Segmentation
Of course, the active users metric is important for the project itself. But in addition, it is also associated with other financial and behavioral metrics.
First of all, the number of active users is affected by the number of new users. The more new users there are, and the faster and more stable they join the project, the faster grows your audience.
The second equally important indicator is retention (user retention). It shows how users return to a project. If you bring there the new users who will not come back later, then they will not replenish the audience, and such acquisition won’t be effective at all. It is important to engage users with the product so that they will wish to return. And the bigger the number of these users is, the larger will be an active audience.
Here is anexample:
| User type | Option1 | Option 2 | Option 3 |
| New users | 5,000 | 1,000 | 5,000 |
| D30 retention rate | 10% | 10% | 3% |
| How many users left | 500 | 100 | 150 |
We can have a good in-app retention scorecard, but if there is a small number of new users the audience will grow very slowly. And vice versa, if there is a good flow of new users and a low retention rate, then most of them will leave a project. It also won’t increase an audience.
The larger the project's audience is, the more there are potential payers among it. Exactly in this order users become paying:
New users → Active users → Paying users
Besides, it is important that a user remains active in a product after making the first purchase because this will increase the chances that they will make repeat purchases.
Thus, active users affect revenue in a direct way:
Revenue = Active users * Paying share * ARPPU
The number of active users is one of the most important metrics of the product, which is indirectly responsible for its success. It combines the quality of new users acquisition campaign and retention metrics, directly affecting revenue. Therefore, when analyzing active users, we should also pay attention to the rate of audience growth, because this metric is one of the most positive signs of active product development.