
Both analysts and marketers, irrespective of their specific field, frequently grapple with a common challenge: revenue forecasting. The only difference lies in the formulation of the question: "How much revenue will we generate by the year's end?" "Which feature, A or B, will yield us greater profits?" "Does it make commercial sense to venture into a new market?" and so forth.
In this article, we have compiled nine proven tips that will enhance the precision of your revenue forecasting.
Tip 1. Use Time Series
Forecasting revenue can be a challenging task, and it may even seem impossible if you lack historical earnings data. In most cases, you have access to data reflecting how your revenue evolved in the past, which involves dealing with time series.
In this article, we will explore several methods you should consider:
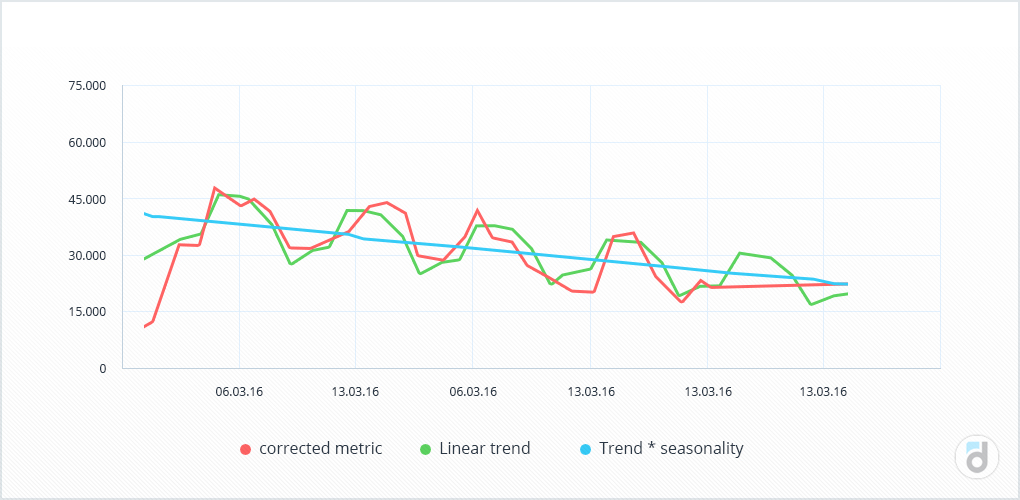
Trends and seasonality
We've already dedicated a comprehensive article to this topic. Now, we'd like to offer some practical tips to complement it.
Exercise caution when dealing with polynomial trends. They can be highly effective, sometimes even outperforming other methods, in modeling existing data. However, when it comes to revenue forecasting, they can be rather unpredictable. Depending on the polynomial's degree, the forecasted data (the 'tail' of the graph) may curve in different directions. The higher the degree, the more flexible the graph becomes, and the higher the likelihood that it may curve in the wrong direction.
A simple linear trend is the most straightforward way to grasp the dynamics. It indicates whether your income is rising or falling and also quantifies the rate of change. This is generally sufficient for understanding the overall development direction but falls short when it comes to making precise forecasts.
Consider breaking down your time series into segments. Just like everything else, online projects have life cycles. Predicting future outcomes using a linear trend that encompasses all data from the project's inception may not be meaningful since many variables have changed over time. Instead, it's beneficial to identify distinct stages of your project, comprehend the factors leading from one stage to the next, and base your forecasts on the data from the most recent stage. Think back to yourself five or ten years ago – back then, not everyone could have envisioned themselves in 2023. This serves as an example of why segmenting time series data is crucial.
Read more: Accurate LTV Prediction using Machine Learning Model
Autoregression
Experience has shown that this method tends to be more accurate than relying solely on trend and seasonality. With this approach, you construct a regression model for income, utilizing income data from one, two, or even N prior periods.
By doing so, you can uncover hidden patterns within the data that might elude traditional trend and seasonality analysis. The more historical periods you incorporate into your regression model, the longer the forecasting horizon becomes.
For instance, consider having daily revenue data for the entire preceding year. In this case, you can generate forecasts for each of the 30 days in the upcoming month by introducing 30 additional variables into the regression model.
Have a project? Try Devtodev demo for free and see our pricing!
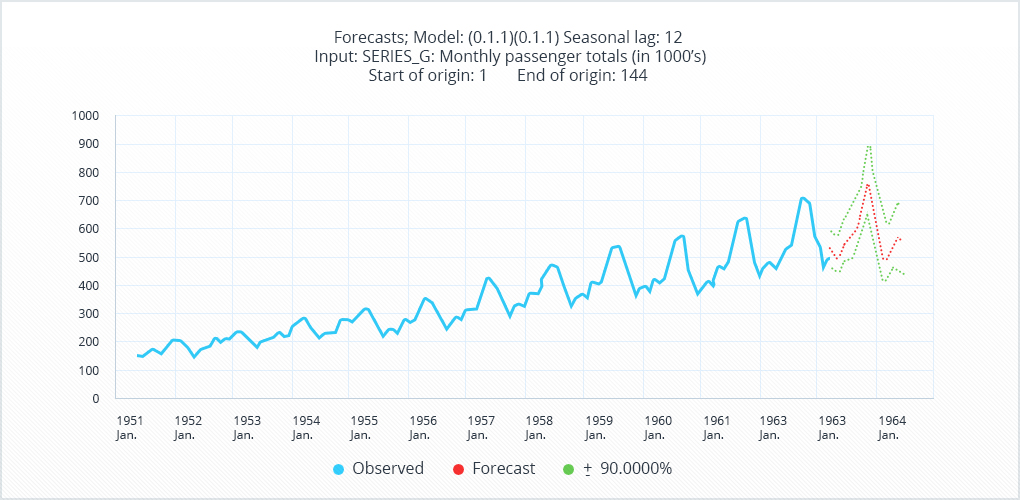
ARMA and ARIMA
These models have evolved from the fundamental regression model. In fact, the "AR" in their names stands for "AutoRegressive," while "MA" stands for "Moving Average." These models delve deeper into the data, uncovering its underlying patterns more effectively. While implementing these models in Excel may be challenging (although there are add-ins available for this purpose), it is still feasible. We recommend using dedicated statistical tools like SPSS or Statistica. However, it's important to note that these recommendations are based solely on our personal experience with these tools.
In general, ARMA and ARIMA models tend to yield more accurate predictions compared to simple autoregression. Nevertheless, the increase in accuracy is not as dramatic as the improvement seen when moving from autoregression to incorporating trends and seasonality. As such, if you need a quick forecast, there may be no compelling reason to invest time in ARMA and ARIMA.
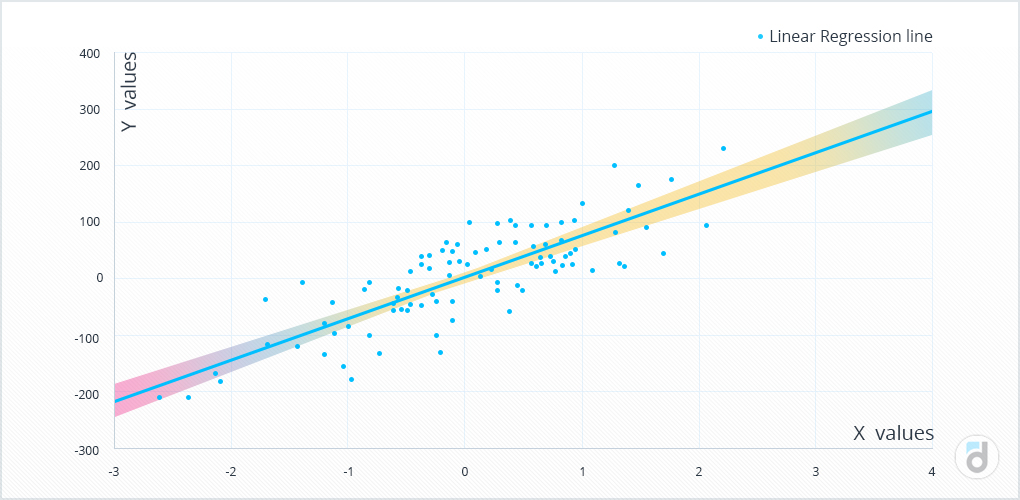
Tip 2. Don’t Forget about Regression Models
Regression is, in fact, a highly versatile method. Its advantage over time series analysis lies in the fact that with time series, predictions are solely based on revenue values from previous periods. In a regression model, on the other hand, you can consider a broader array of metrics.
There are various ways to calculate revenue. For instance, revenue can be calculated as the product of audience size and Average Revenue per User (ARPU). Audience size is a quantitative metric that provides insights into the project's scale and is influenced by traffic. Revenue per user, on the other hand, is a qualitative metric that reveals how willing your users are to pay. Since these metrics exhibit distinct behaviors and are influenced by different factors, it's important to analyze and predict them separately. Similar reasoning can be applied when looking at another revenue formula: paying users multiplied by ARPU. In theory, regression can be applied to any of the metrics at your disposal.
Read more: Analyze 3 Revenue Sources - Ads, In-apps and Subscriptions
Just a few pointers:
- If possible (although not always achievable in Excel), use only significant variables when building the model. Inputting a hundred metrics doesn't necessarily mean that all of them should be included in the final equation.
- Ensure that your input metrics are as independent as possible and have weak correlations. Otherwise, you risk obtaining unstable results. Such results might perform well when replicating your input data but may yield unusual values when it comes to revenue forecasting.
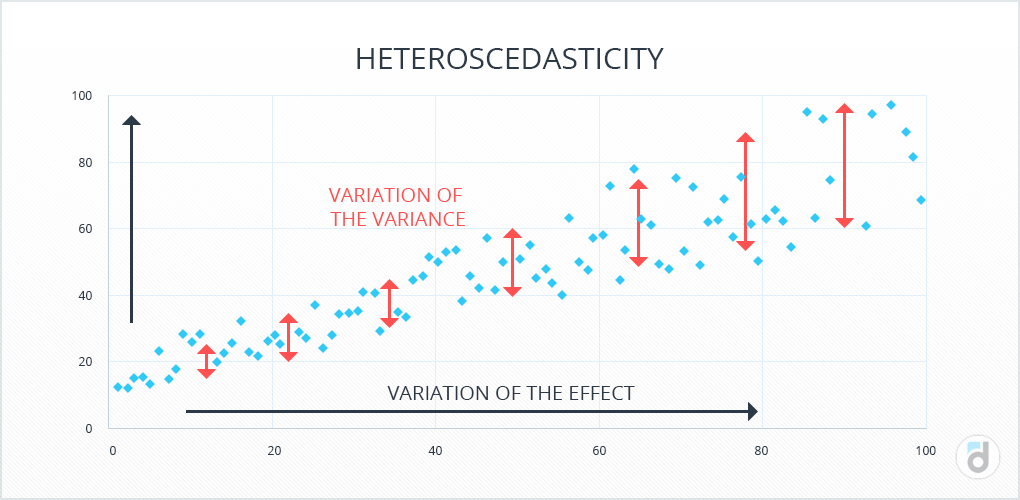
- Get familiar with your residuals. If you studied regression at university, you might remember the term 'heteroscedasticity.' Don't worry; it's not as intimidating as it sounds! If you've done everything correctly, when examining the residual plot, you'll find it appears as an unpredictable random value with a mean of zero. However, if you notice a pattern (like a sinusoid), it might be an indication of heteroscedasticity. This suggests that you haven't accounted for an additional underlying logic governing data distribution. In such cases, you may need to adjust the regression equation by incorporating an unaccounted-for component (in this instance, a sinusoid).
Tip 3. Build Custom Models for your Project
Time series and regression are not the only methods available for forecasting revenue. You can always develop custom models tailored to your specific project.
Here's an example of a model we prefer to create:
- Calculate the number of users in their first, second, third, and subsequent months within the project at the current time.
- Determine the percentage of users who remain active in the second month and the percentage who transition from the second to the third month, and so on.
- Finally, calculate the average amount spent by a user who is in the N-th month of the project, often referred to as ARPU for that month.
This data provides ample information for constructing the model. You gain insights into how users progress from one month to the next and how much they contribute financially. It's worth noting that these calculations can be done on various timeframes, whether annually, weekly, or even daily (though I personally haven't experimented with daily periods). The choice of period should align with how long users typically engage with your project.
Using this model, you can effectively plan your traffic inflow by simply adjusting the number of new users for a given month.
Tip 4. Calculate the Payback of your Traffic
At times, particularly during the initial stages, a project's success hinges entirely on the acquisition of new users. If new users are joining, the project thrives; if there's a shortage of users, it falters.
This is why all the tips mentioned earlier become invaluable only when you have a grasp of when and how much traffic you'll be able to attract.
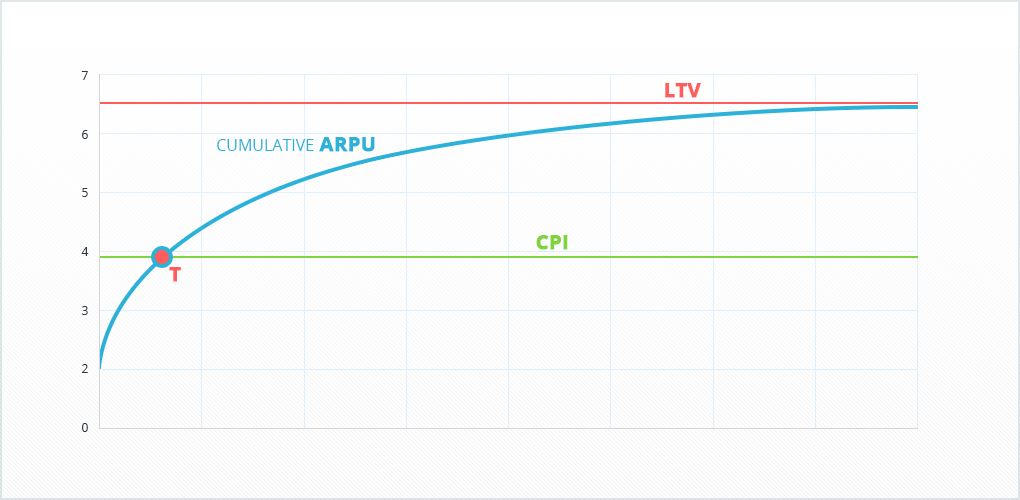
Hence, it would be immensely beneficial to chart a cumulative income curve derived from your daily traffic: quantifying the average revenue generated per user on the first day, within the first, second, or third week, and the first month, among others. This cumulative value is what leads to the calculation of LTV, representing the upper limit. Armed with knowledge about your cumulative income, you can significantly enhance the precision of your revenue projections by taking into account the timing and volume of user acquisitions. Furthermore, it empowers you to compute the payback period for your traffic.
Read our free ebook on monetization metrics
Tip 5. Use Expert Forecasting
This tip is primarily applicable in situations where you are planning significant project changes that could have a substantial impact on your revenue. However, it can also prove valuable when the anticipated impact is less pronounced.
For instance, let's consider a scenario where your company is gearing up to launch new content, features, or a different subscription model - essentially, any noteworthy change. It's prudent to start by consulting with key individuals involved in the preparation process, such as the project manager, game designer, producer, and marketer, regarding the expected revenue impact. As an analyst, this allows you to create a reliable forecast by blending their expert insights with your precise calculations.
Here's one approach to implement this: each month, you can solicit input from specific groups of your colleagues concerning the projected project revenue for the following month. By accumulating data regarding their assessments and comparing them to the actual revenue outcomes, you can effectively rank the reliability of their opinions and even consider excluding some groups if necessary.
For instance, you might observe that the producer tends to be optimistic in estimating income, while the marketers tend to be more conservative. The truth often lies somewhere in between, and past data will guide you toward a more accurate assessment. Moreover, this approach provides a valuable opportunity to gain firsthand insights into the planned changes.
Tip 6. Place your Bets
Boost your colleagues' engagement by introducing gamification elements to the process!
We are confident that we don't need to explain how betting works. What's essential here is that if you regularly engage in this game with your core team members, it can enhance their comprehension of projected revenue and enable everyone to establish a logical connection between their actions and the value of key indicators.
Furthermore, this game can shed light on why your forecasts didn't align with actual revenue figures: perhaps you overlooked certain crucial factors?
Tip 7. Analyze all Changes
We firmly believe that by meticulously analyzing all changes right from the inception of your product, you can gain a deeper understanding of your project, your audience, and your revenue structure. Consequently, we recommend thoroughly assessing all modifications and maintaining a comprehensive log of each published feature to make more precise and informed decisions.
Over time, you'll likely observe that some alterations in your product significantly boost revenue and related metrics, while others have a negligible impact. Subsequently, you'll be better equipped to predict revenue from new features by drawing comparisons with similar changes in the past.
Read more: How to Launch a Promo Campaign and Increase Product Revenue
In this context, it's worth recalling Bayes' theorem. Upon delving deeper into its principles, you'll discover both promising and challenging aspects.
- The good news is that accounting for all possible variables when forecasting revenue enhances the accuracy of your projections.
- The less favorable news is that it's practically impossible to consider every conceivable variable.
Nevertheless, there's no need for despair. Instead, aim to consider and formalize as many factors as you can identify. As your set of factors expands, the complexity of your forecasts will increase, but so too will their accuracy.
Consider, for example, making a forecast for a football match. Your initial prediction may be emotional, such as "Barcelona will defeat Real Madrid 3:1." If Barcelona doesn't win as expected, you begin dissecting the reasons behind it. Your forecast then comprises numerous factors, including the teams' current positions in the league table, their historical match outcomes, home-field advantage, player injuries, team motivation, and more. Over time, your forecasts will become substantially more accurate. Essentially, you're building your own neural network: through the analysis of errors, you refine your forecasts by incorporating additional factors, ultimately enhancing their precision.

Recognize that forecasting is an interactive journey. Through continuous practice, meticulous evaluation, and in-depth examination of outcomes, you hone your forecasting abilities and gradually evolve into an expert.
Tip 8. Combine Different Methods
If this article were a test, the correct answer would be 'all of the above.'
There are numerous combinations to choose from, and we encourage you to select the one that works best for your needs. However, we've found a combination that works well for us:
- Forecast audience and ARPU separately.
- Utilize time sequences.
- Refine your audience forecast based on traffic data.
- Adjust your ARPU forecast with input from project changes and expert evaluations.
- Multiply the audience and ARPU forecasts to derive the revenue forecast.
- Consider making further adjustments based on detailed analysis of planned changes and a custom model tracking user progression.
We trust these tips have been valuable, and we wish you nothing but precise forecasts and continually increasing revenue!
P.S.
By the way, we'd like to recommend several books on the topic to you:
-
Nate Silver “The Signal and the Noise”. This book provides a detailed exploration of Bayes' approach to forecasting, with real-life examples spanning from baseball to politics.
-
Eric Siegel “Predictive Analytics”. While this book may be less theoretically inclined compared to "The Signal and the Noise," it stands out for its illuminating examples. The subtitle of the book reads: "The power to predict who will click, buy, lie, or die," and it delves into these scenarios in great detail.
-
“How to analyze promotional activities in games”. We modestly recommend this book by devtodev, available online for free. Don't be deterred by the terms "promotional activities" and "games" in the title – this book offers a comprehensive guide on analyzing project changes. Recall tip 7 from our previous article: the more rigorously you analyze changes in your project, the more accurate your forecasts become.