What is CPI? It means exactly what it reads — cost per install. In other words, this is the amount of money you spend on making a single user install your app or game, regardless of turning them into a premium user. This metric is widely used in mobile marketing with regard to acquiring new users for games and apps.
Cost per install is also a pricing model that allows the advertiser to pay for the actual app or game installations only and avoid common fraud (read devtodev tips and tricks that will help you with buying installs).
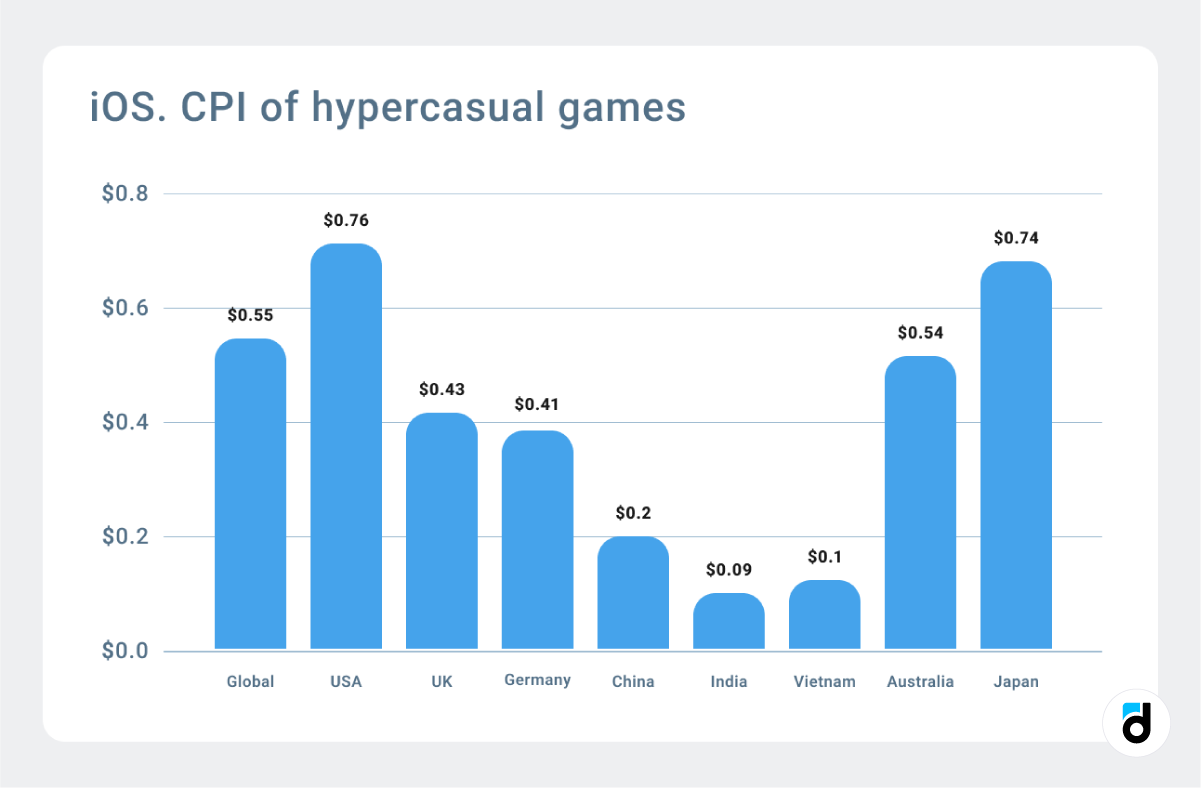
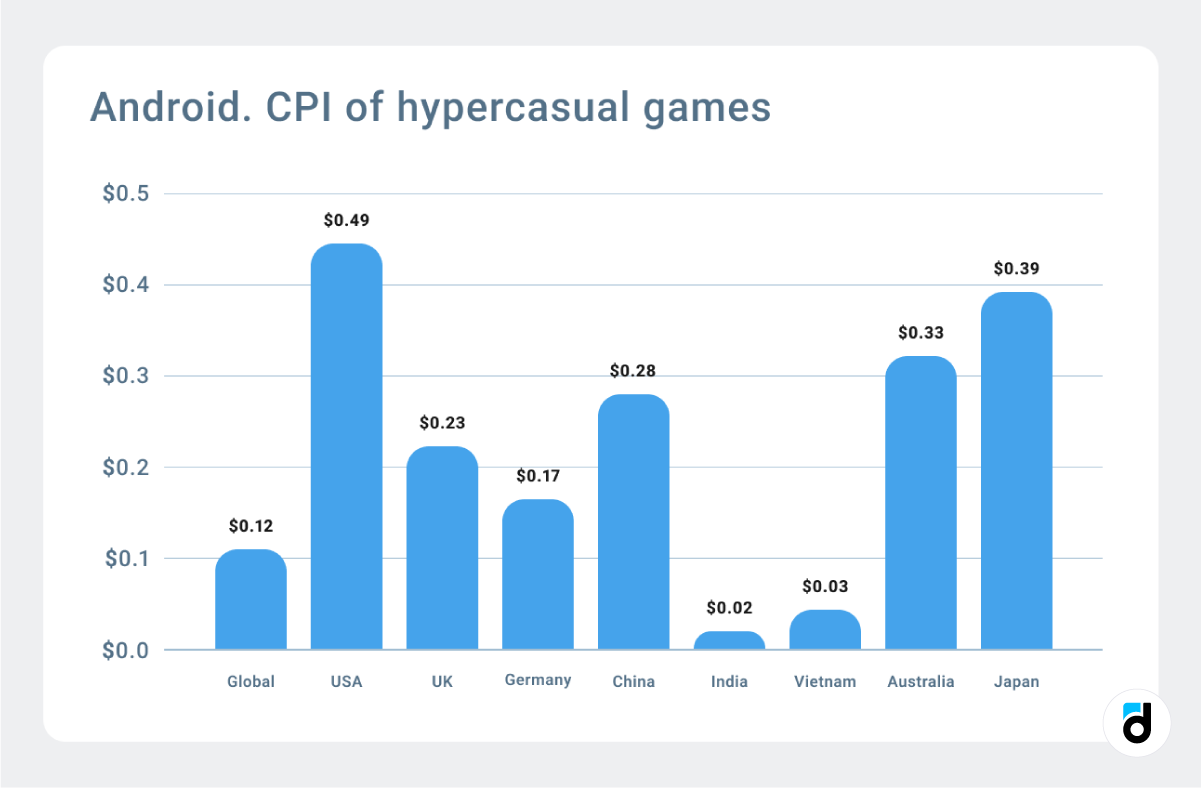
CPI of a product in a region doesn’t stick to a single number because it changes over season, by the platform, media channel, genre, advert cost, and also depending on the chosen traffic provider, aka ad network. The metric is too dependent on ad performance and on the traffic that is being targeted for it to be meaningful at the geo level. That’s why it’s hard to find reliable benchmarks for this data. However, you can still find some information simply for reference.
Cost per install calculation
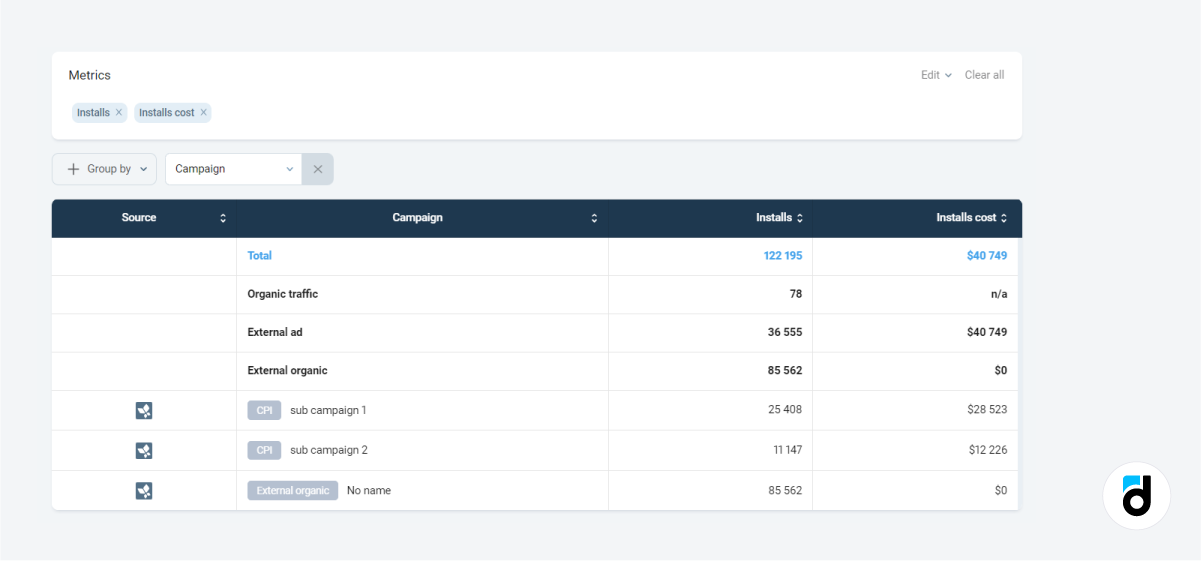
CPI is calculated straightforwardly: you take the amount of money that you spent on advertising your mobile game or app (it can be a particular marketing campaign) and then divide it by the number of actual installs that resulted from this campaign.
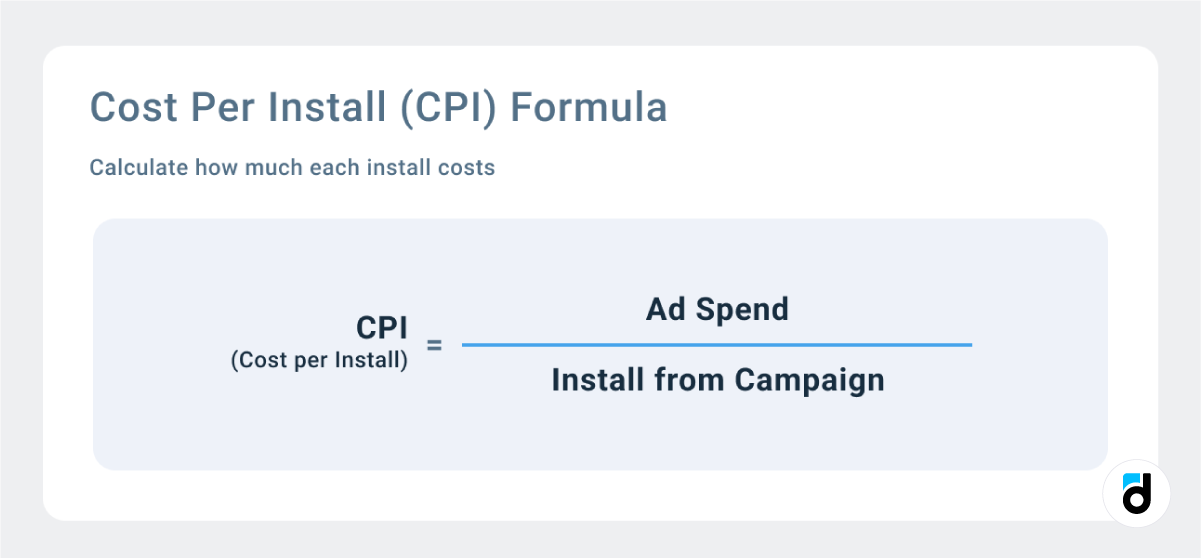
For example: if you spent $15,000 on the campaign and got 5,000 installs as a result, then your CPI will be 15,000/5,000 = $3.
How to apply CPI?
CPI is best used in combination with ARPU to assess your marketing efforts and evaluate the quality of traffic. Basically, if your CPI is less than ARPU, then you earn money. However, if your CPI is more than ARPU, you spend more money on acquiring a new user than you later make from them. This means that your paid advertisements are neither viable nor sustainable, and you need to change the factors listed above — your traffic provider, and acquisition channels. Or you need to invest more effort into increasing the ARPU and generating more revenue.
You need to track other metrics, such as session length and engagement, because the traffic provider might provide you with low-quality users who will install the app or game but then quickly churn. If you don’t track the two metrics, CPI becomes a vanity figure.
You can measure the session length by simply integrating an analytics platform. Tracking engagement is more difficult because you need to decide on the target action, but it is still possible using events and funnels.
One more important metric closely related to CPC (CPI is its particular case) is LTV (lifetime value of a user). While ARPU provides revenue data for a period, LTV gives you information about all the purchases made by one user during the entire engagement period. There is a widely accepted notion that LTV should equal more than three CPC (cost per acquisition) or you risk spending far too much on ads.
Key CPI Stats by Game Genre to Know in 2023
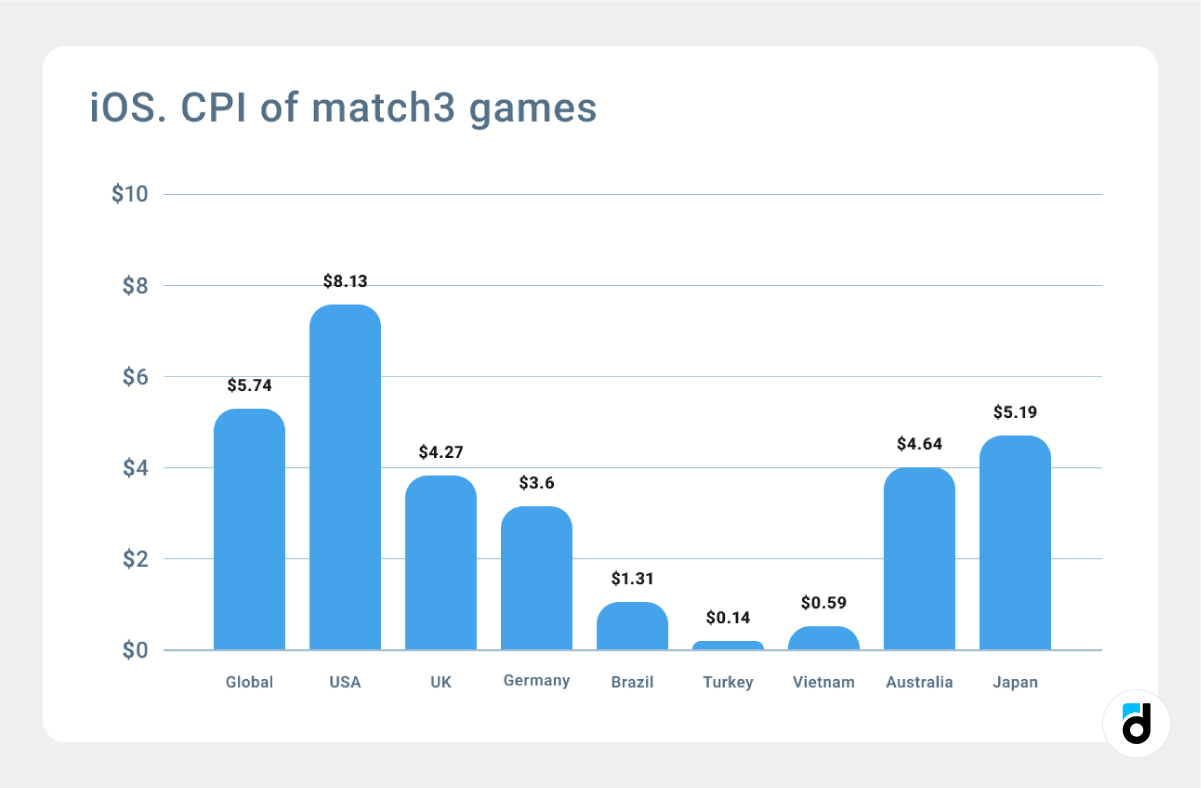
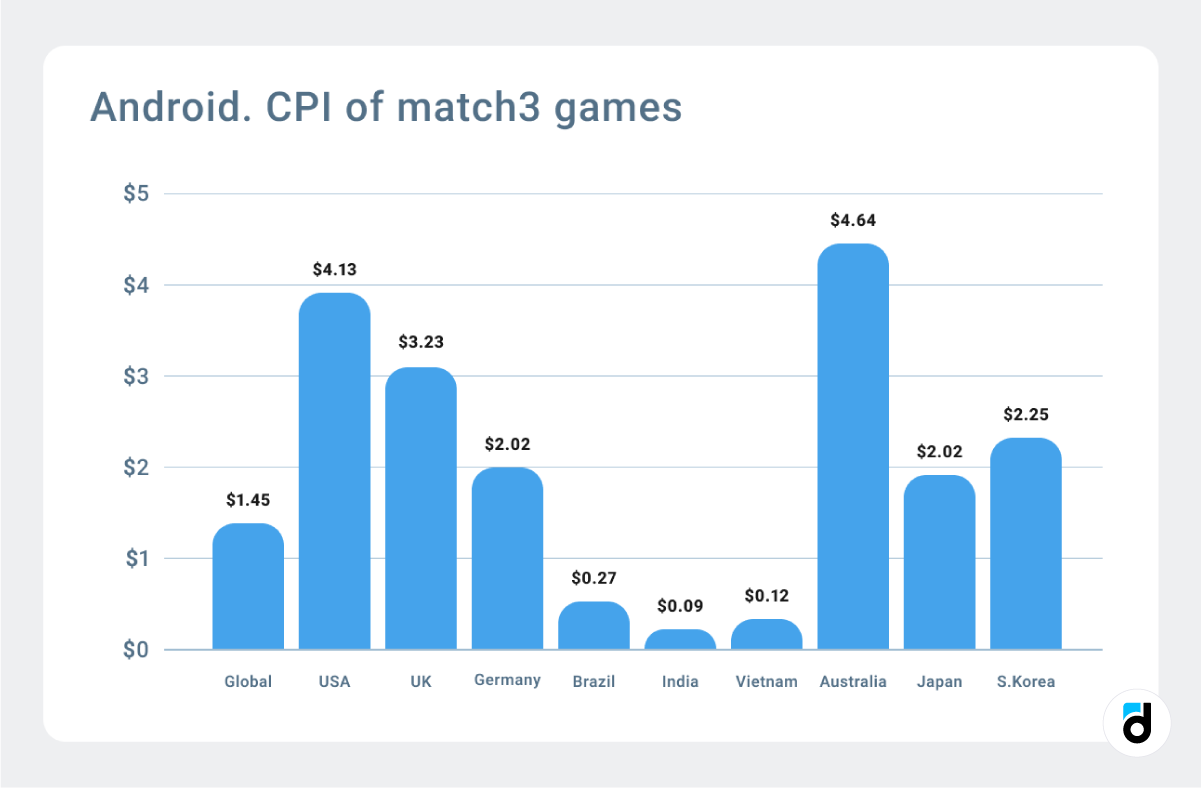
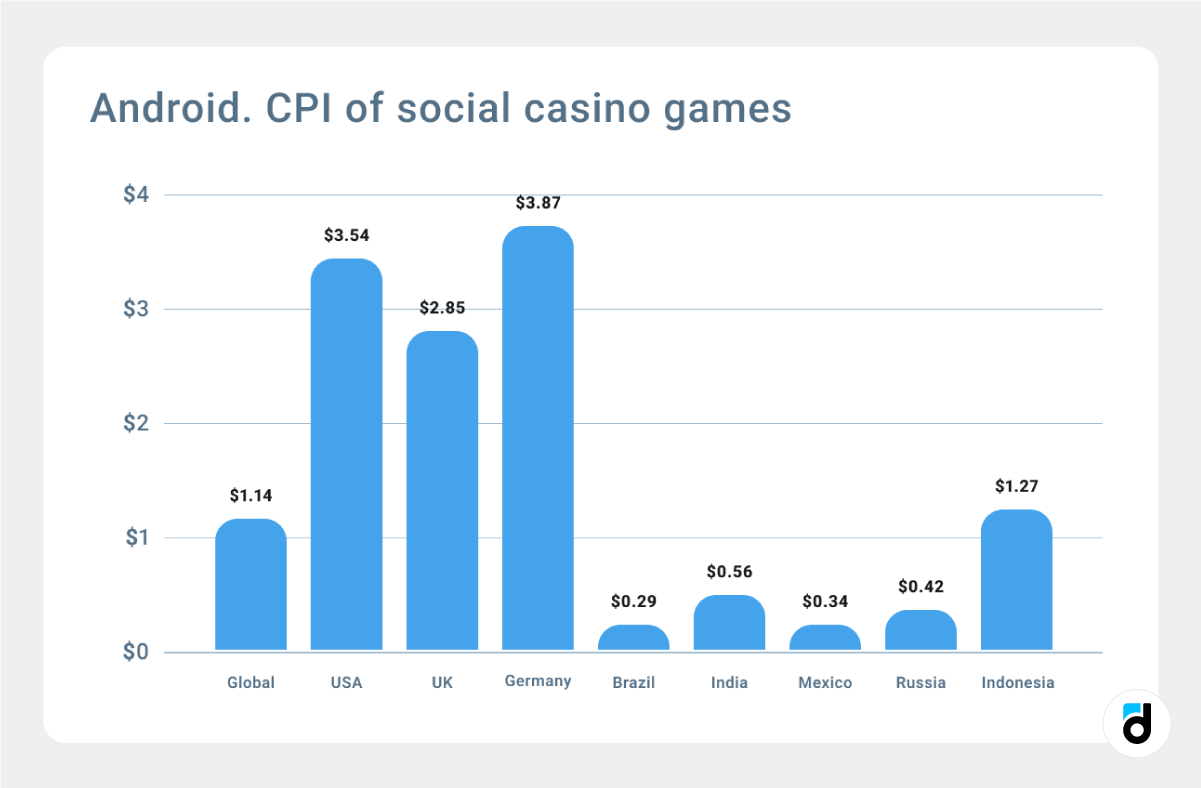
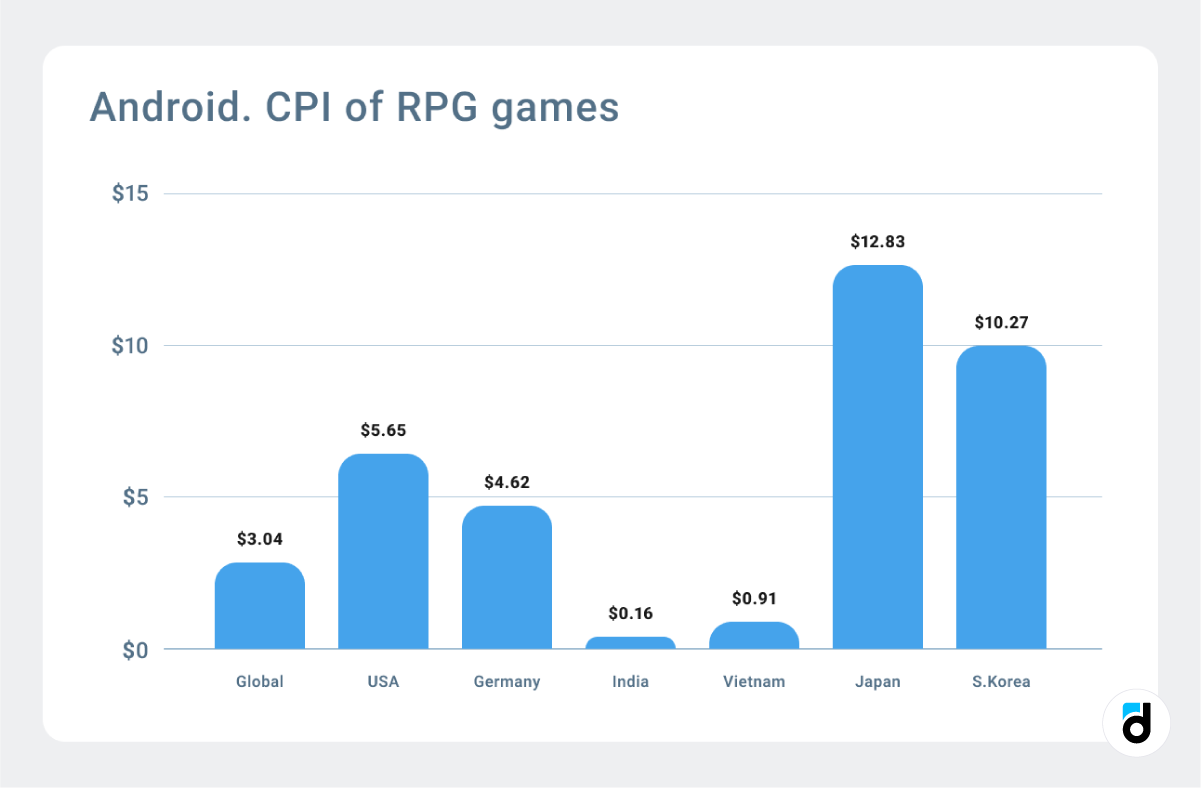
For the graphs below, we used information from the AppsFlyer website.
Hypercasual games CPI for iOS
Hypercasual games CPI for Android
Match3 games CPI for iOS
Match3 games CPI for Android
Casino games CPI for Android
RPG games CPI for Android
Simulation games CPI for iOS
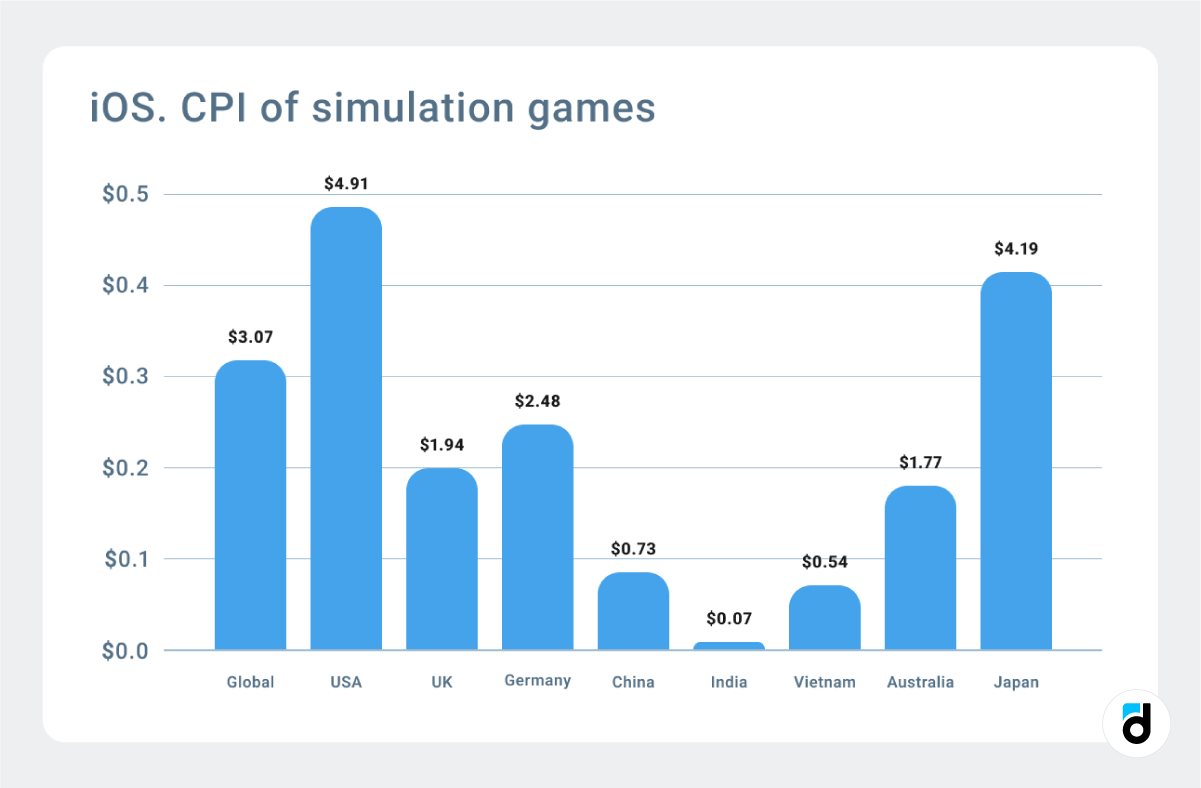
Simulation games CPI for Android
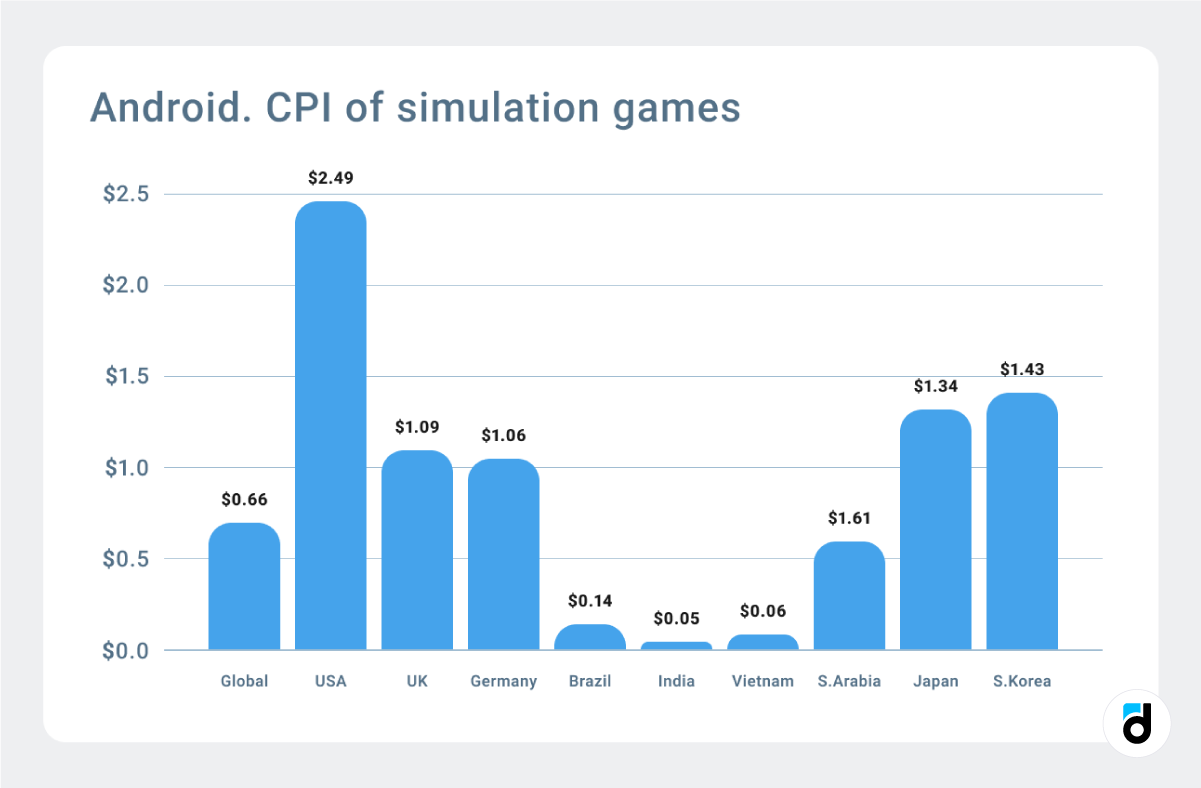
Puzzle games CPI for Android
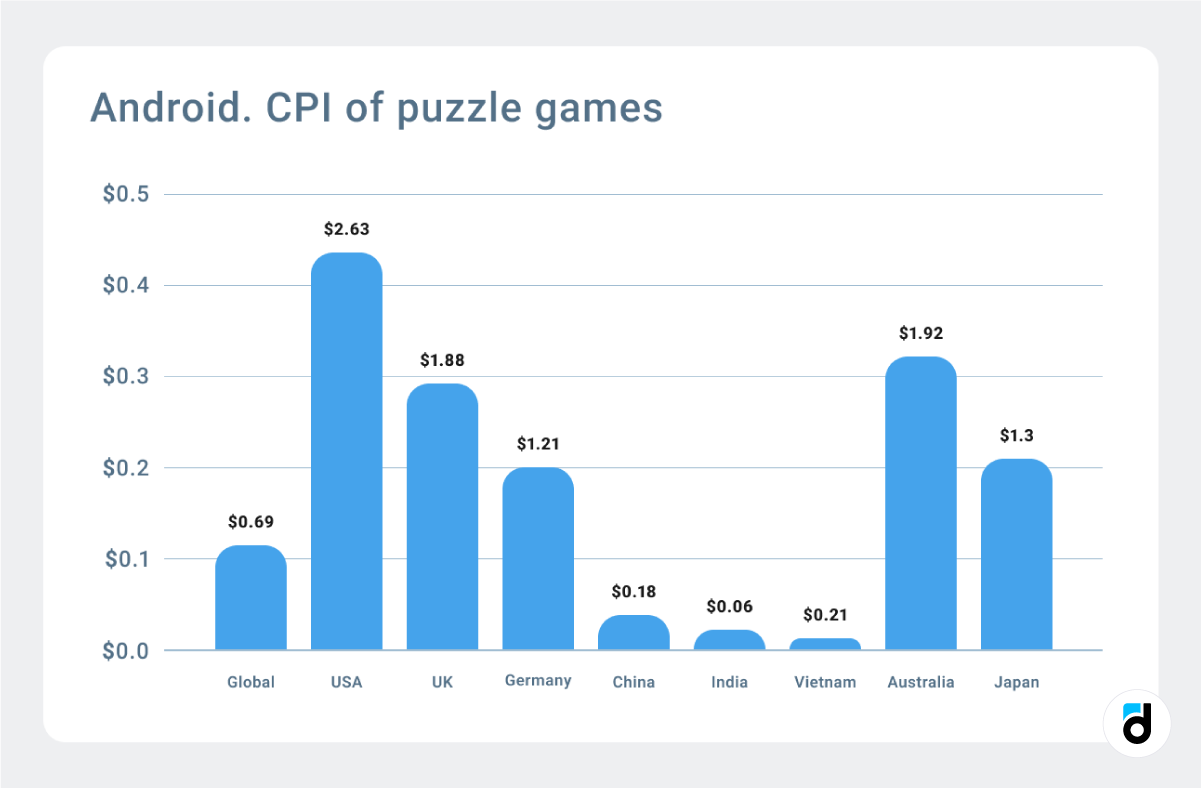
Gaming CPI by ad format
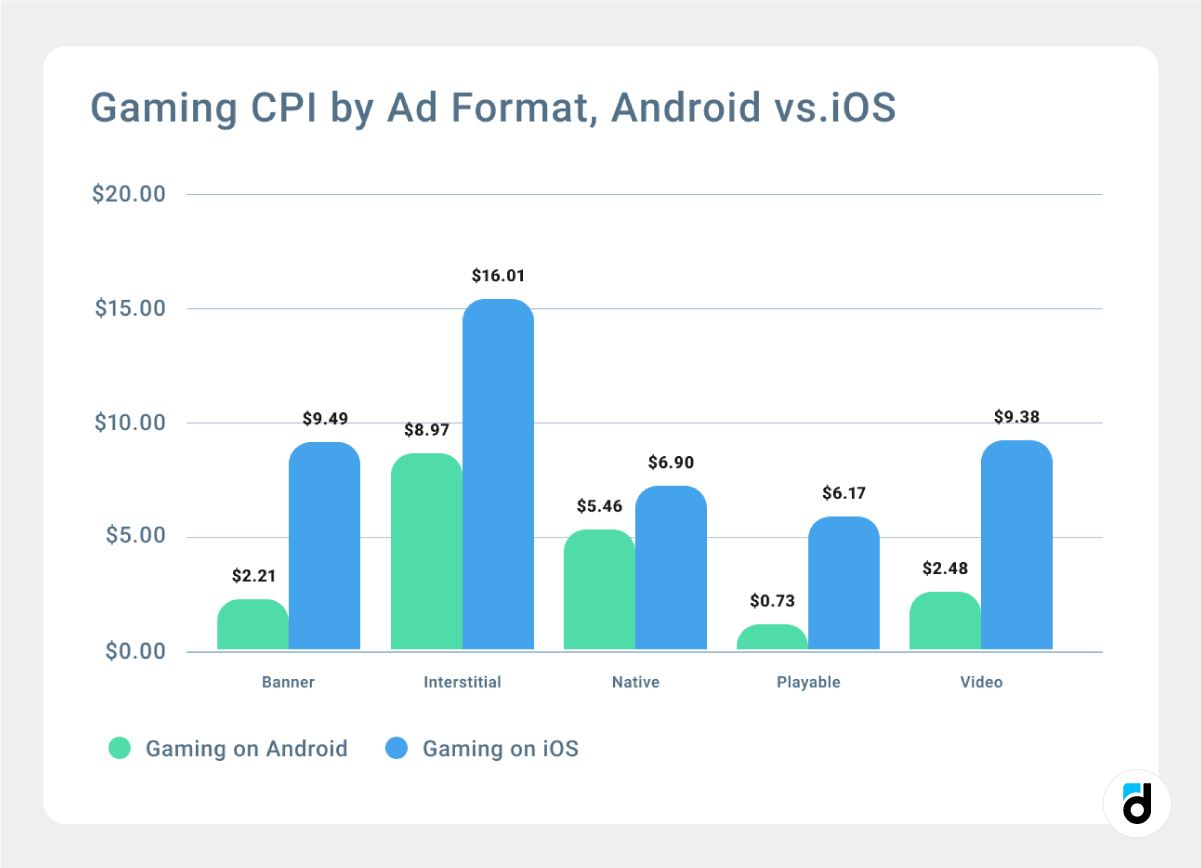
Source: Liftoff
Final Thoughts
CPI metric values vary greatly depending on the country, platform, genre, etc. However, if you have reference benchmarks, which can be some median values, you will find it easier to assess your marketing campaign's performance.
Actually, CPI values may not be reliable for your project if it stands out in some way. So, always keep track of other basic metrics mentioned above and found in analytics platforms so that you can analyze them with the CPI data and not miss the time when the ad campaign takes the wrong turn.
Start with devtodev demo project, get familiar with the pricing and join!

