
Sticky factor — what it is, thy this metic plays a big role in any project, how to calculate it.
New users install your app every day. Some of them will never use the product again, but some will do it every day. Your income highly depends on how they are going to behave in your app and how much they are interested in it. Because the more loyal they are the more they tend to pay.
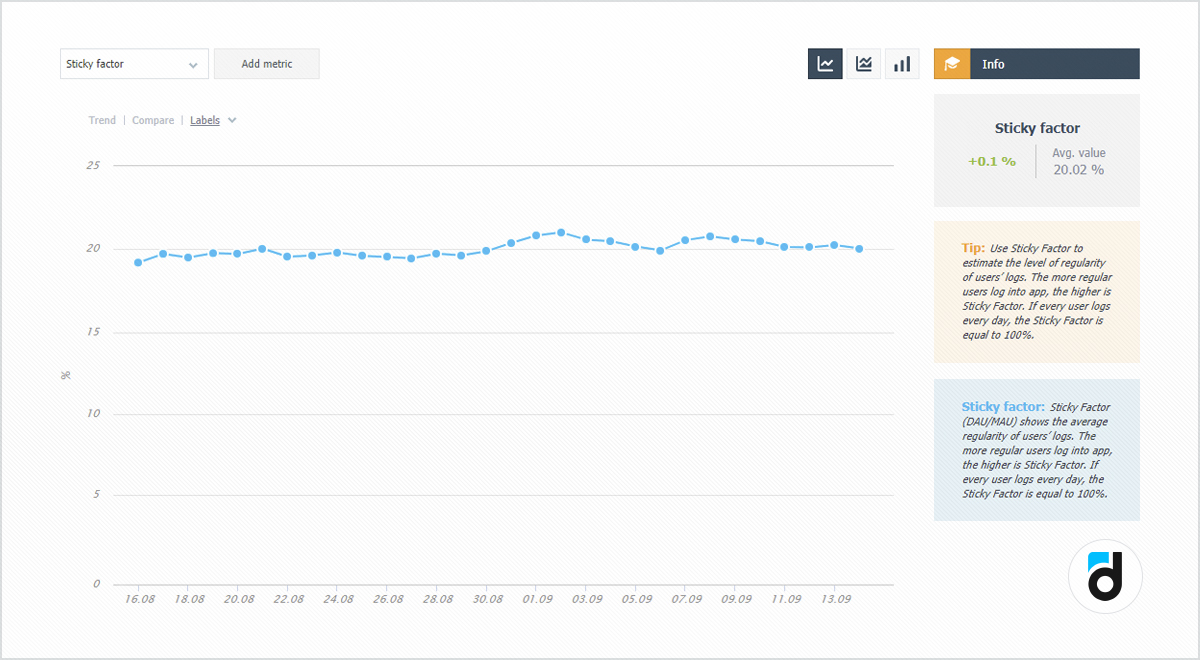
We can evaluate users’ interest, loyalty, and degree of engagement by using a number of metrics, and the sticky factor or stickiness factor is one of them. We can use this metric to evaluate how stable our user base is and how regular they open our app. We usually calculate it as the number of daily unique users divided by the number of monthly unique users.
Sticky Factor = DAU / MAU * 100%
But sometimes we use DAU/MAU ratio.
Let’s take a closer look at how this metric works.
Let’s assume that 1,000 unique visitors open an app every day. It means that the DAU of this project equals 1,000. If these are different visitors every day then the project’s MAU is going to equal 30,000 and the sticky factor will equal 1,000 / 30,000 = 3%. This is the lowest value this metric can accept and it shows that users do not stay in the app and that its retention rate is, most likely, low and it doesn’t have a user base required to generate income.
Read more: 70 links to become a better game analyst
The reverse situation is when people use the product every day and then its DAU equals 1,000, MAU — also 1,000, and the sticky factor = 100%. This is a dream that will never come true of course and this metric usually highly depends on the product's genre and its intended use. For games, for example, sticky factor of around 20% is considered to be good, but for social media and messengers, it is often around 50%.
In devtodev, we previously analyzed games’ sticky factor and we found out that it varies between 4 and 37%. On average it makes exactly 18%.
Sticky factor, as well as retention rate, characterizes audience retention and shows the probability of a newly acquired user to stay in the product. It also shows how good this product retains or “hooks” users.
Read more: Man Metrics. ROI
It is reasonable to control this metric after certain time periods for each product to evaluate the impact of changes made, compare it for different users’ segments and estimate it during A/B testing to get a better understanding of what elements influence users’ interest.
If you want to increase the sticky factor, you can apply the same measures you use to improve the retention rate because your task is to get a user interested in the product and to make them use it over and over again. The following can be helpful:
-
Acquire target audience initially interested in your product and its functions.
-
Create valuable and up-to-date content stimulating a user to come back to the project.
-
Provide a convenient interface with lots of useful tools and features.
-
An app should have something for sharing and somebody to share and discuss it with.
-
Reminders about the product and useful changes (in the form of emails or push notifications), etc.
Despite the sticky factor is not directly linked to income, it characterizes the audience’s loyalty and activity, which, in turn, directly affects monetization and income. It means that the more stable and involved your user base is the faster product’s audience forms and grows. The bigger it is the more payments users make and hence the product income grows. devtodev research shows that there is a correlation between the sticky factor and income (it accounts for 50-60%), which supports the idea of this metric’s influence on product’s financial metrics.
Read more: Main Metrics.Downloads