
Correlation does not imply causation. For an analyst, this idea seems pretty simple, but in practice a lot of people often make important decisions forgetting this rule.
Calculating correlation is quite simple, and sometimes it's very tempting to make intuitive conclusions about the causal relationship between the variables, but I very much hope that at least one person who reads this article and wishes to make such a beckoning connection from correlation to a causal relationship, will prevent himself from doing so in the future.
What is correlation?
Wikipedia states that correlation is the statistical relationship between the two or more random variables. Thus changing the values of one or several of these quantities accompany a systematic change in the values of other quantity or quantities.
As a rule, we consider two quantities with several values for each. Let's say we are considering the figures of a day-1 retention and revenue of the project for each day for two months.
We look at how these quantities behave, and the correlation is a measure of the similarity of their behavior:
-
if they both jump in the same direction day after day, the correlation will be close to 1;
-
if they constantly jump in different directions, and the decrease of one metric corresponds to an increase of the other, then the correlation will be close to -1;
-
and if their behavior looks independent relative to each other, then the correlation is close to 0.
So the value of the correlation coefficient varies in the interval [-1; 1]. If the correlation equals to 1 (or close to 1), does it mean that by increasing one indicator you will automatically increase the other? No, it doesn’t.

In our example (on the picture above), correlation equals to 9%, which means that there is no correlation. Does it mean that if we want to increase the revenue, we can do anything we want, but increasing the 1-day retention wouldn't help us? No, it doesn’t.
“What does all of this mean then?!”, - you'll be probably asking. Correlation is one of the varieties of the relationship, but it does not have to be causal.
At the same time, the lack of correlation between the two quantities does not mean that there is no relationship between them. For example, a relationship may have a complex non-linear character, which does not reveal a correlation.
So why doesn't correlation mean a causal relationship?
The third variable
Let's take a look at the canonical example: there is a positive correlation between the number of travels of the student and his academic performance. Does this mean that if you want your child to get only As and Bs, you need to collect the last funds and send the child on a trip? Nope. Let's investigate.
Travelling is not cheap, and in order for a child to travel a lot, parents should have money. If parents have money, then most likely they have a fairly high level of education. And educated parents usually have educated children.
Thus, the travels have nothing to do with it. We are dealing with two additional variables that were not stated in the original message: it's the level of parents' education and the level of their income. Accordingly, there is a chain of positive correlations: travels -> level of parents' income -> level of parents' education -> academic performance of the child.
And there are lots of such examples:
-
In those countries where the majority of the population does not have access to higher education, life expectancy is lower. Does this mean that higher education increases life expectancy? Nope. The third variable here is the standard of living in the country. It affects both life expectancy and access to the higher education.
-
Considering the fires in a particular city, you can identify a high correlation level between the damage from the fire and the number of firefighters who participated in its elimination. The third variable is the size (level) of the fire. If the fire is large, then it takes a lot of firefighters, and the damage is likely to be greater than from a smaller one. And of course it doesn't mean that every new fireman brings additional damage.
- There is a positive relationship between the sales of ice cream in a particular city and the number of drownings. Will you drown, if you eat ice-cream? Nope. The third variable here is the temperature outside. If it's hot outside, people buy ice cream and they also go swimming.
-
During the survey among 33 surgeons, it turned out that those who play video games more often, can also better cope with the test laparoscopic operation on a special simulator. The authors make a conclusion that medical schools should consider using video games for training, which is wrong: the third variable here is the level of the visual-motor skills of the surgeon. Those surgeons who have good visual-motor skills (i. e., they are good at using eyes and hands), are likely to use their skills naturally both in video games and at work. Possessing such skills by nature, they probably become better surgeons than those who lack such skills.
Finally, an important scientific discovery: almost one hundred percent of people who eat cucumbers will be dead in a hundred years. Cucumber is a slow killer! Find the third variable yourself.

Accidental correlation
Look at the graph below.
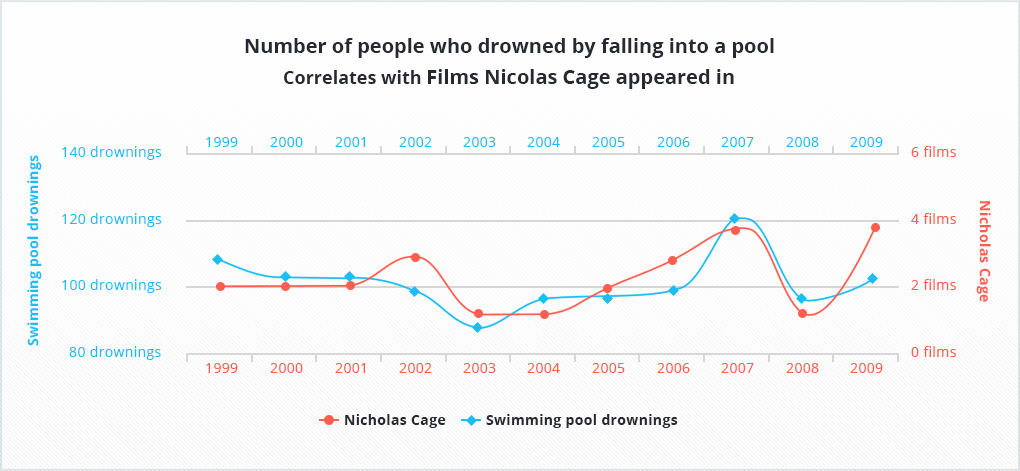
Poor, poor people! Now, in order not to drown, we must first check the level of ice cream sales and then the amount of films Nicolas Cage has made during a year!

You did not think that the correlation between the two indicators can be accidental, did you?
Here is one more example, where the correlation is reduced to absurdity, and where one can trace the path from the childhood allergies in Australia to the shape of road signs.
By the way, there is an interesting tool from Google: you draw a graph, and then Google shows you the keywords which trends you just drew.

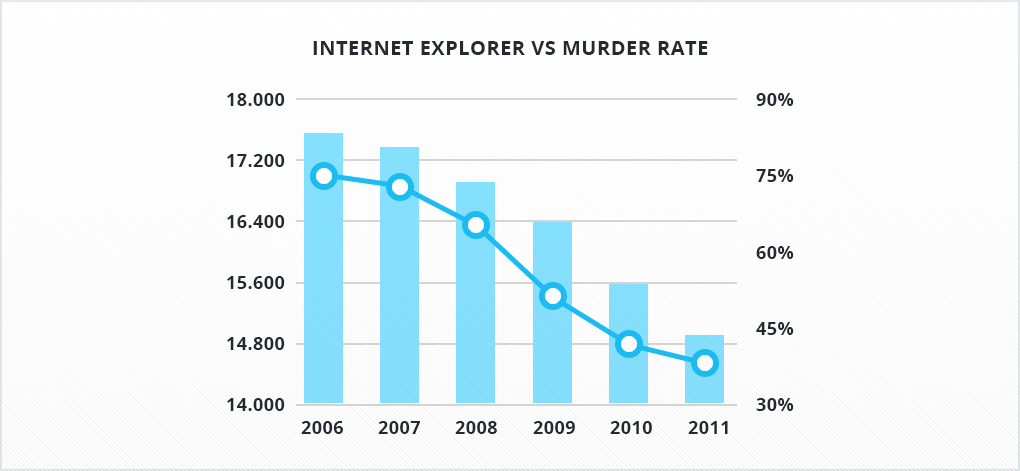
Or here's another example: the Internet Explorer browser market share in the US versus the number of murders in the United States.
And how do we live now (and correctly understand the relationship of the product metrics changes)?
-
If it worked for someone, it won't necessarily work for you:
If you drop out from university, you won't necessarily create Apple.
If you rewrite the tutorial, you won't necessarily increase the revenue.
If you add the words "world", "clash", "go" to the name of your game, your game won't necessarily become a hit.
If you find a relationship between the two variables, we recommend that you understand this relationship in detail, what depends on what, what affects what, and whether it affects at all. An understanding of the subject area and its model are built from such relationships in your head.
Practical recommendations: if another product did an A/B test and found out that the red button has higher CTR than the green one, it doesn't mean that you need to go ahead and make all the buttons red at once.
If you participated in the conference, and after that the inflow of the new users increased by 30%, do not rush to apply for the next exhibition, it's better to understand in detail the reasons for the increase in the inflow (maybe it is due to the seasonality?).
Case study:
In one of the games, the average revenue per user (ARPU) increases from month to month. You will probably agree, that it's not the worst signal. Сoncurrent to this the developers measure Net Promoter Score on the monthly basis to evaluate the loyalty of the players.
An interesting fact was discovered: NPS is falling over time! So the revenue grows and loyalty falls.
The less is the loyalty of users - the less they pay? In order to increase the revenue, do you need to reduce loyalty? Of course, it’s not so.
And then what? Let's investigate.
If we detail NPS by segments of users depending on their lifecycle in the game, we'll see: the survey is primarily taken by newcomers, and most of them don't even have an idea of paying yet. At this time, payments are made by the other players, a long-established base of active users, who express their loyalty not by giving a "ten" in the survey, but by money - the best of all awards.
So instead of making a false conclusion about the causal relationship between NPS and money, it's better to figure out why newcomers lose their loyalty month by month. Perhaps you will find the reasons for the low loyalty of new users, and by eliminating them, increase your user base and, as a result, the money.
In a sense, the fact that the correlation doesn't imply causation explains why we have not been replaced by the robots yet. Have a good head on your shoulders!
And in an idle moment, you may play a game “Guess the Correlation”.


: The Basics")
: The Basics")


 in Mobile Games")
 in Mobile Games")


")
")


")
")


")
")


 Tactics for Mobile Games")
 Tactics for Mobile Games")


