
Retention is one of the main metrics in the analysis of games and applications because it has a direct impact on your revenue. Mobile app user retention is a rich notion that can be explored from different perspectives.
If you want your project to bring maximum profit, you need to drive to it as many users as possible because they will pay to access it or make purchases in its in-game store. At the same time, the audience should be interested in returning to the product as often as possible and doing this for as long as possible.
How to calculate retention
Retention is calculated not for individual users, but for entire cohorts. You can compute it for any day.
Formula:
Day N Retention = Number of users that launched an app on Day N / Number of users who installed an app N days ago * 100%
Using the retention value, you can determine what percentage of users from the cohort (who installed the application N days ago) opened the application on day N.
For example, on January 1, 1020 people installed the app (this is our cohort). Later this number reduced and we can calculate the app user retention rate of the following days using the formula above:
|
Day from install |
1 |
2 |
3 |
4 |
5 |
6 |
7 |
... |
24 |
25 |
26 |
27 |
28 |
|
Number of users |
314 |
177 |
129 |
95 |
85 |
73 |
59 |
... |
11 |
10 |
10 |
9 |
7 |
|
Retention |
30.8% |
17.3% |
12.6% |
9.3% |
8.4% |
7.2% |
5.8% |
... |
1.1% |
1.0% |
1.0% |
0.9% |
0.7% |
Typically, an app user retention graph looks like this:
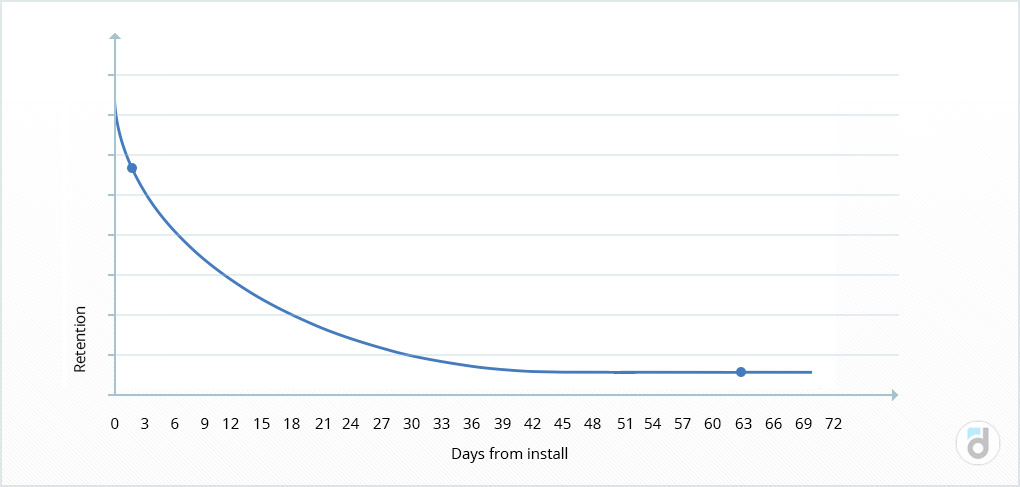
You can see that the largest churn (outflow) occurs in the first days after installation, then it decreases, and at the end, only the most loyal users remain in the project.
Read more: Map of Key Analytics Metrics in Games
Day 1, 7, and 28 retention
For the convenience of comparison, retention is often calculated on days 1, 7, and 28.
The ideal situation is when the user regularly needs your app, and they always open it when they face a particular problem. However, retention values for different projects will vary depending on their genre. Most of us go to social networks many times a day, meanwhile, we book hotels much less often. As a result, the retention of these applications will be very different.
On average, the following values are considered to be good:
D1 Retention: 40%
D7 Retention: 20%
D28 Retention: 10%
Try everything out in free devtodev demo
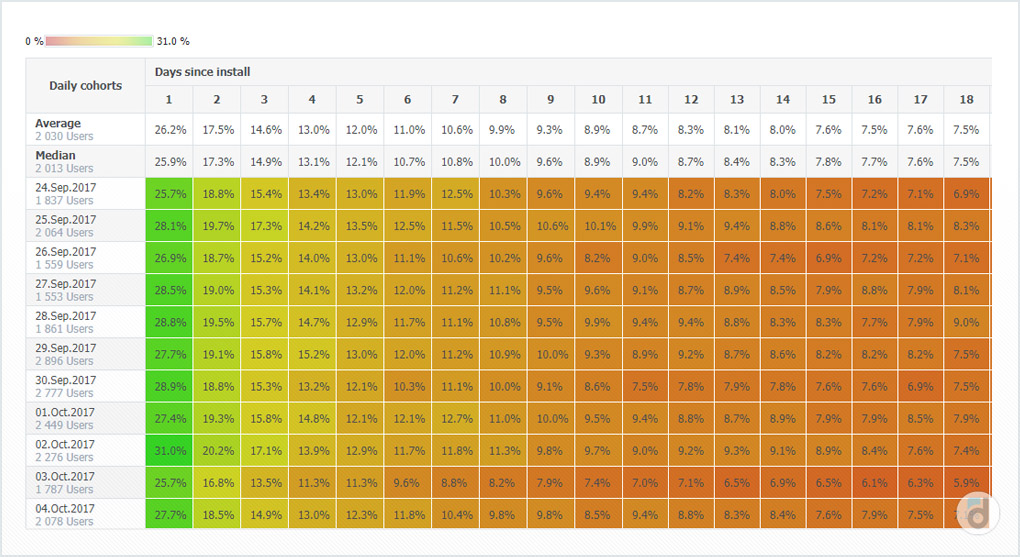
As you can see, the average user retention rate for apps decreases quite rapidly.
D1 Retention depends on the first impression: how the app caters to the user’s needs, tasks and requests. You should pay close attention to the D1 Retention values since it allows you to make a forecast for the times ahead. If during a soft launch D1 Retention was below the predicted value, it means that people could not understand the product, its essence, advantages, and value for them, i.e. “to activate”.
In order to improve the first day retention, you need to conduct an in-depth analysis of the first session and understand whether the user is engaged in the product and whether it catches them. It means you need to check whether this chain breaks (installation -> activation -> return -> payment) in the second step.
D7 Retention shows the percentage of users who are satisfied with the project, but they haven’t grown loyalty to it yet.
D28 Retention shows the percentage of users who have already mastered the functionality of the application and use it regularly. Most likely they already got used to it and do not plan to change it to something else in the near future. It is these people who are likely to make payments in your product.
Read more: Main Metrics. Downloads
Hourly calculation method
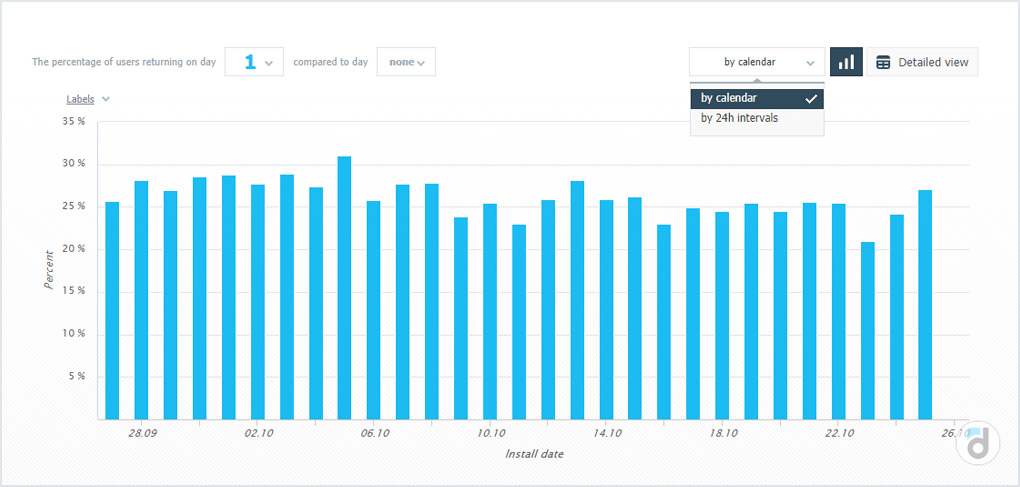
Retention can be computed not only by calendar days but also by hours. In this case, D1 Retention is the percentage of users who installed the application and launched it within the period from 24 to 48 hours.
At devtodev analytics platform, it might look like this:
On the diagram below, red dots on the timeline indicate the sessions of one user. If you count them by calendar days, you will see that the user made three visits - on the first, second, and fourth day from the date of installation of the application. If you estimate them by hours, it turns out that the first and second sessions fall into one 24-hour interval and will be counted as one visit. So, if you use the hourly calculation method, you can count two visits only.
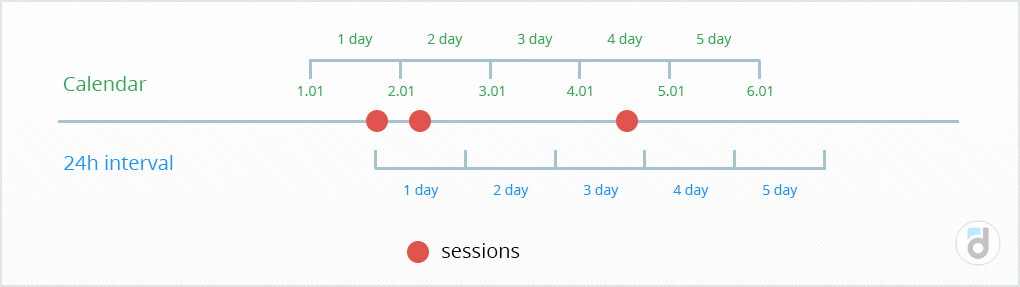
You can apply this method if your users live in different time zones.
If you use hourly calculation, you can additionally evaluate another metric - Zero-Day Retention (D0 Retention). That is, count the percentage of users who entered the application on the day of installation.
It is important to segment data on retention based on various criteria (country, platform, and others). For example, users who come from different sources will have different ideas about your product and different expectations from it. As a result, their retention values will vary. Based on this data, you can identify the most effective source of traffic and try to acquire more users from it.
Read more: How to Improve a Free-to-Play In-Game Store
What does it affect?
Retention - is an important metric and you need to monitor and, if possible, increase it, because:
-
It affects the size of the audience. In general, the influx of new users should be bigger than the churn.
-
It affects the income from your application. The longer we manage to keep the user in it, the more loyal they become. As a result, the possibility that they will make a payment becomes higher. If you use a subscription model (recurring payments), then the benefit is even more obvious - the more months a user remains signed, the more payments we will receive from them. A large, yet stable audience is often the key to success.
-
It is convenient to compare the values of this metric for different cohorts. For example, you can analyze user behavior after you’ve made certain changes in your product.
- It is used to calculate Lifetime and LTV, which are also included in the list of the most important project metrics. With their help, you can find the most profitable user segments and identify their sources.
Read more: Main Metrics. Active Users (DAU, WAU, MAU)
How to improve retention
Here are some app user retention strategies:
-
Convey to the user the essence and all the advantages of the application in the most accessible form (for example, using a tutorial) during the very first session.
-
If users do not return to the project, remind them about it using push notifications, email newsletters, etc.
-
Maintain interest in the product using bonuses and gifts.
-
Keep them interested by using other methods: hide special features and content in the product and let users open them only when they perform certain actions; give them new tasks every day, etc.
-
Give the user a sense of satisfaction from achieving certain goals. In order to do this, you need to break the entire user path into stages and focus their attention on the fact of passing each stage.
-
Connect the app with social networks and let the user interact with their friends.
You can approach the improvement of retention from the opposite side: you can study the behavior of loyal users (see what exactly and in what sequence they did, look at their sessions, at how they used the app) and attempt to send new users in the same direction.
Retention is one of the most important product metrics that directly affects the size of its audience, growth prospects, and also helps to understand what impression it makes on the user. This metric needs to be constantly monitored and improved.
Read more: Main Metrics. Sticky Factor