
Recently we released our brand new Performance Report. Frankly speaking, we are proud of it a lot and we want to share our joy and explain what is so great about this report.
Our goal in developing this report was achieving the maximum clarity and transparency. We wanted our client: an application developer (as well as a marketer, analyst, game designer, an owner of the application) to understand everything about the current state of the project by one look at this report.
And this is how we have achieved it.
Set of metrics. The report consists of 6 metrics:
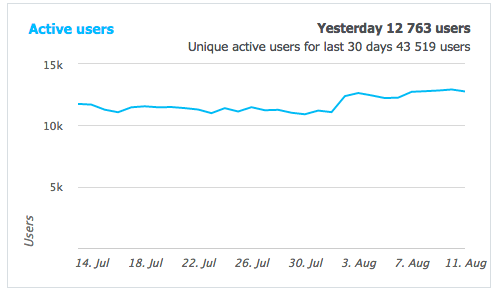
- Active Users (DAU) - the number of unique users that logged into the project throughout the day;
- New Users - the number of unique users who visited the app for the first time at that day;
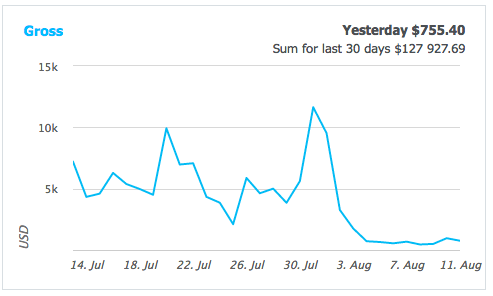
- Gross - the total amount of money paid by the users at that day;
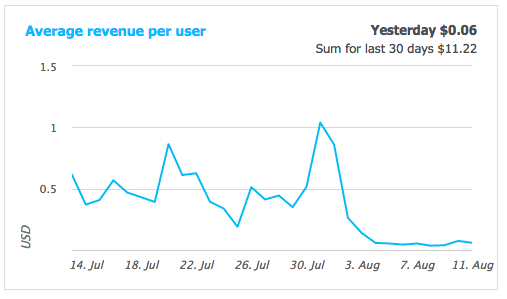
- ARPU (Average Revenue Per User) - Average revenue per active user for that day; It is calculated as Gross / Active Users;
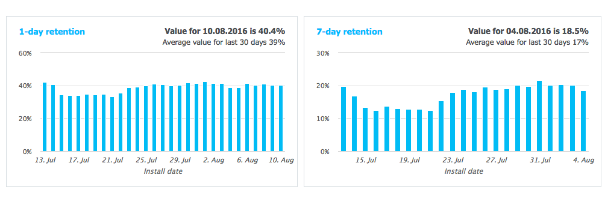
- 1-day retention - the percentage of users who have returned to the application 1 day after their first visit. As a rule, this metric is used referring to the short-term retention of users - whether they liked appearance of the application or understood how it might be useful for them;
- 7-days retention - the percentage of users who have returned to the application 7 days after the first visit. Users remaining in the application for 7 days, already figured out the usage of the application in more detail and are less likely to leave it in the coming days.
Thus, the set of metrics includes scale metrics of the application, by analyzing which you may understand how large it is, if it is growing or not (talking about such metrics as Active Users, New Users, Gross), and quality metrics which speak about the internal changes in the project: if the project is better in retaining users, if the users become to pay more on average (ARPU, 1-day retention, 7-days retention). Furthermore, this set of metrics allows you to immediately look at the audience, the money and the quality of the retention rate.
30-days period of analysis. We chose between 7, 14 and 30 days and sticked to the 30 days, because that's how you can see both the actual dynamics of the project, and the seasonal behavior of the users. For example, if there is a rise in revenue every Friday and Saturday in your project (which is quite typical for mobile games), then for a period of 30 days, you may sure identify it, while 7 or 14 days is not enough to do this. So for each metric, you may follow how it behaved over the past 30 days, keep track of its dynamics, trends and seasonality.
Read more: Consumer Basket

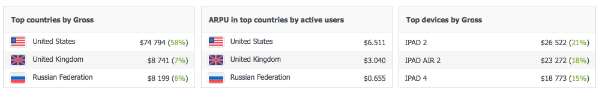
The cuts by country and device. We saw that our customers tend to build reports in these cuts and let this knowledge to our advantage. In fact, most commonly developers want to know the structure of the revenue or of the audience by countries or by platforms. There is another useful cut by the traffic sources, but simply not everyone has such a cut.
The report is opened by default. Before that, we used to open another report by default, which was updated every 5 minutes and showed a cumulative value of the number of users and money in real-time, compared with yesterday. We don't have anything against this report, it remains in devtodev, but we decided that new Performance Report would simply remove more questions. Thus, we want to minimize the obstacles between the developer of the application and the application itself, between the data and the decisions taken on their basis.
Read more: Main Metrics. Paying Users
So, what questions can be answered by using the Performance Report:
- what is the size of the project audience?
- how many users log into the application per day?
- how much money do they pay?
- how the project retains users?
- how all these indicators changed over the last 30 days?
- Whether there were any qualitative changes in the project and if they are reflected in its scale?
- what are the most popular countries and platforms in the means of the audience and money?
In particular, by using only Performance Report, you can accomplish the following hypothetical (and quite probable) cases:
- There is a drop in project revenue. We look at the audience and ARPU.
On this basis, we understand whether to chase the marketer or the game designer, and what to do: to buy new traffic or to look for the reasons within the product itself, evaluate its changes over the last 30 days (in our example it is the very case!).
- There is a drop in project audience. There are two hypotheses: either there are less new users to come or the project has worse retention than it used to. If there are less new users, then you should find the marketer and ask what happened (maybe you’ve just run out of money for the new traffic); if there is a drop in retention, then you should take a look at what was done in the project for the last few days. Likewise, by comparing 1-day retention and 7-days retention, we may evaluate, if the drop occurred due to a change of the first session of the user or with the core loop of the application.
- Why are we talking about the drops again and again? Let’s assume, we noticed the qualitative growth of the 1-day retention (for example, over the past 30 days, we redesigned the first session, and the users are retained better from the very beginning). Here we may also track how it affected the qualitative change in the growth of audience and revenue.
Please note, everything is done in one place, in one report, without a single click on it! It opens by default: you run devtodev and immediately see the basic information about the project.
Of course, it is impossible to obtain absolute knowledge about the project with the help of only one such report. If you want more detailed information - please, we have dozens of other useful reports. But we continue to insist: the Performance Report perfectly handles the role of the first report the user sees on the project.


: The Basics")
: The Basics")


 in Mobile Games")
 in Mobile Games")


")
")


")
")


")
")


 Tactics for Mobile Games")
 Tactics for Mobile Games")


