
Сonditional formatting (color code) offers convenient visualization of data in devtodev. How does it work in real life? It applies colors to cells in a cell range based on their values (colored vs not-colored, colored intensively vs less intensively), and this lets you easily spot maximum and minimum values as well as trends. So, conditional formatting makes your analysis easy, fast and effective.
Another feature: How to create push notifications in devtodev
Preconditions
In devtodev, conditional formatting is available in three reports - SQL (Reports -> SQL), Basic metrics (Reports -> Basic metrics) and Custom events (Reports -> Custom events).
You are free to apply conditional formatting only to the reports where your data is arranged in tables:
-
If you use the SQL report, the conditional formatting will be available with ‘Query results’ only.
-
If you use the ‘Basic metrics’ report, then you need to select ‘Table’ or ‘Transposed table’ in the ‘View’ drop-down menu. If you select any other option, then conditional formatting will not be available.
-
If you use the ‘Custom events’ report, then you need to select any ‘Aggregation period’ and ‘View’ -> ‘Table’.
How to Build a Proper Report
We are going to use the Basic metrics report as an example because the SQL report as well as the Custom events report function in a very similar way.
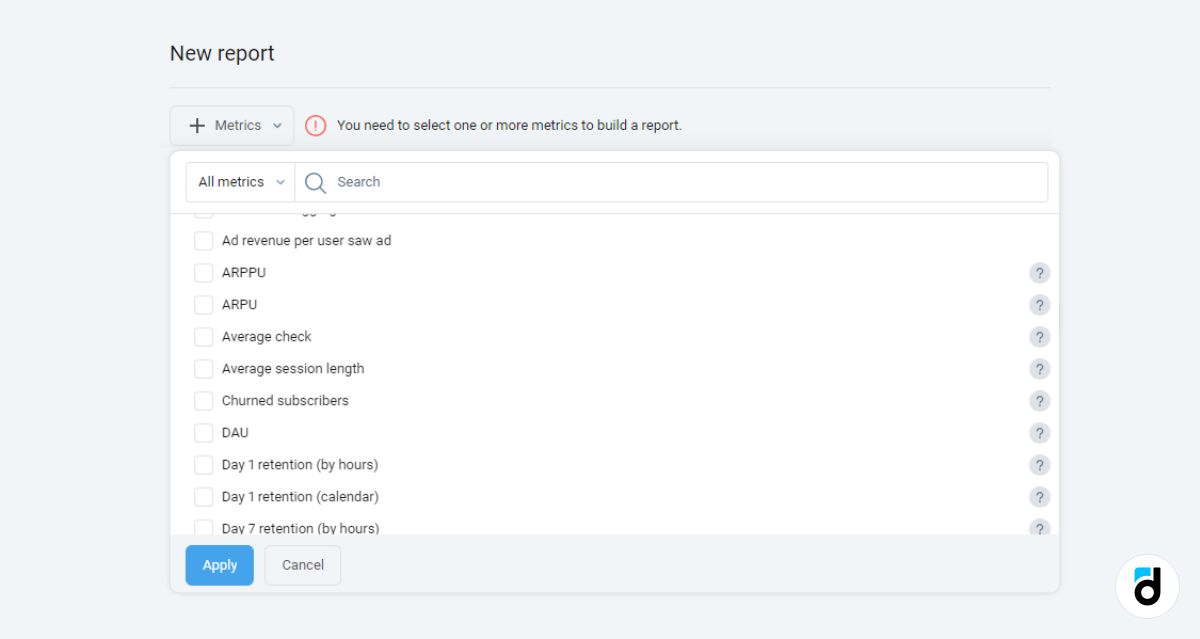
Open ‘Reports’ -> ‘Basic metrics’. Click ‘+ Metrics’ and select the metrics that you want to view. You can choose up to five metrics at a time. Click ‘Apply’.
‘View’: select ‘Table’ if you want to see a simple table, or ‘Transposed table’ if you want to reverse columns and rows in the report.
‘Aggregation period’: it can be equal to a day, week, month, or year. Select ‘No’ if you want to see the total number only.
Attention! Be mindful of the ‘Period’ in the top right corner of the report. In case you select ‘Last 7 days’ as a period and a year as an aggregation period, you will still see the results for the last 7 days only!
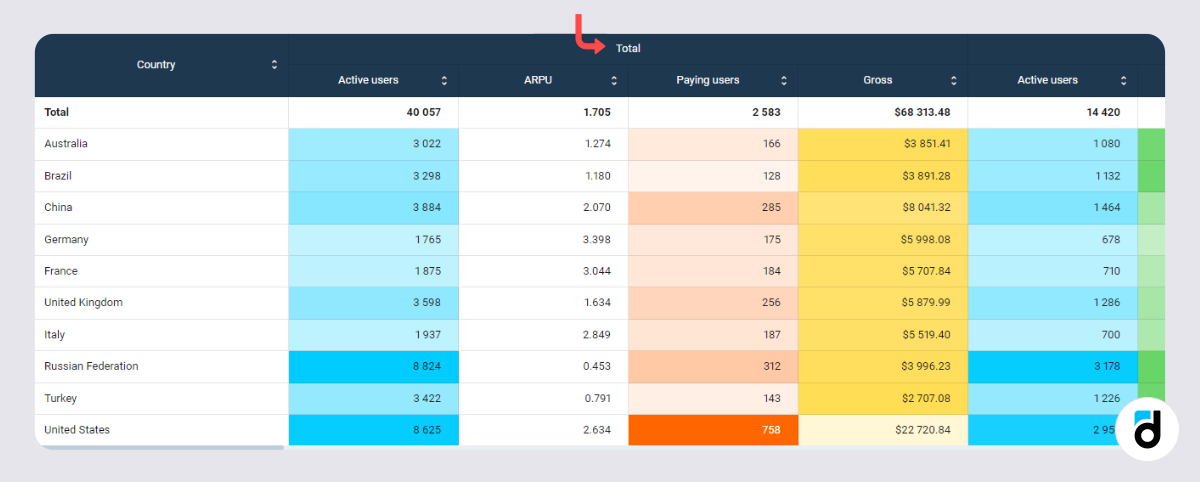
‘Group by’: here you can choose the way you want to group your users, e.g. by a basic property (country, device, payment sum, etc.) or a custom property (character,equipment, etc.). The predefined value is None.
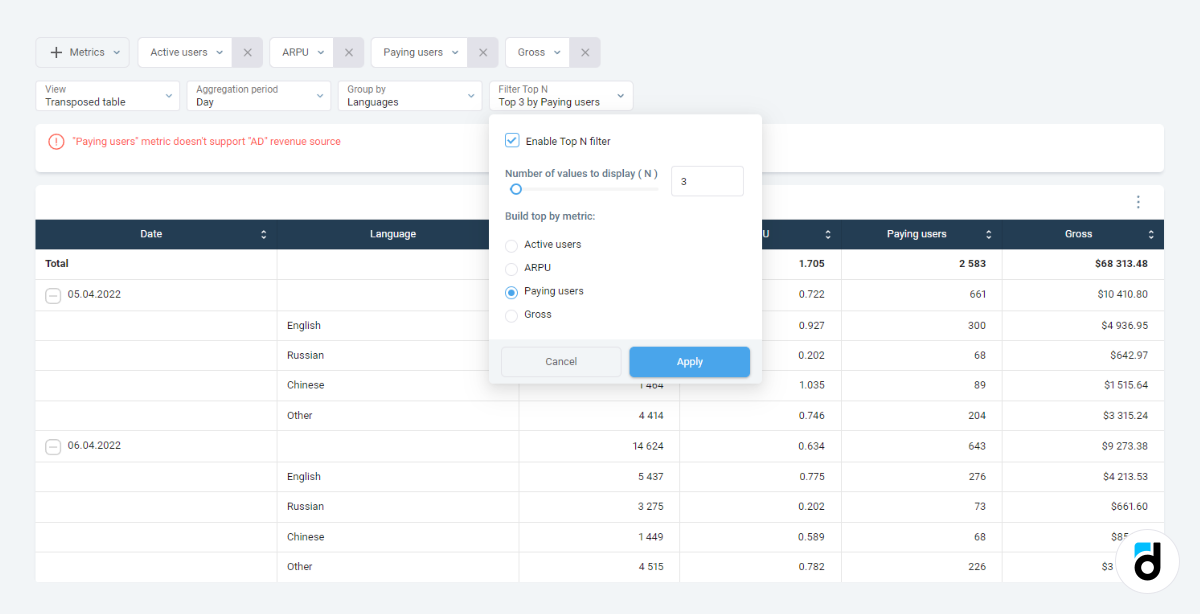
‘Filter Top N’ can be activated only if you have selected a groping type. Please note that Top N filtering is mandatory if you use grouping by custom property.
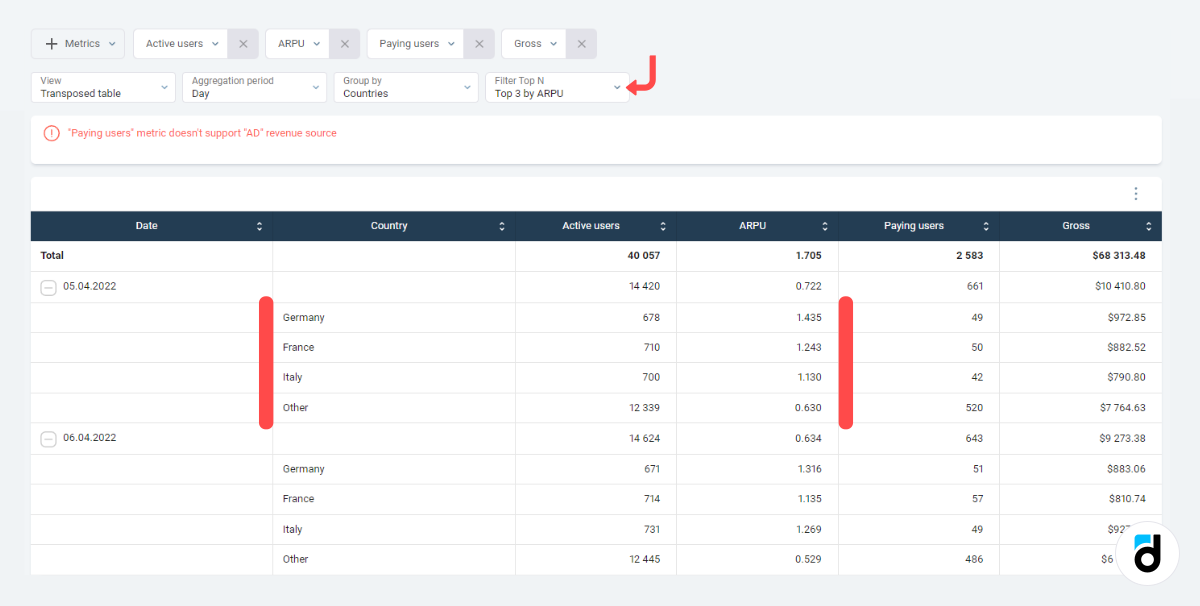
‘Filter Top N’ allows you to select a certain number of top results of the metrics that you chose by clicking ‘+ Metrics’, e.g. you group results by language and want to display only top five countries with the highest number of paying users, or you group results by country and want to see three countries with the highest ARPU rate:
Important! After you set all the options, build a report by clicking ‘Refresh’ in the top right corner. Click it after applying any changes in the settings because the page will NOT refresh automatically.
Conditional formatting of the report
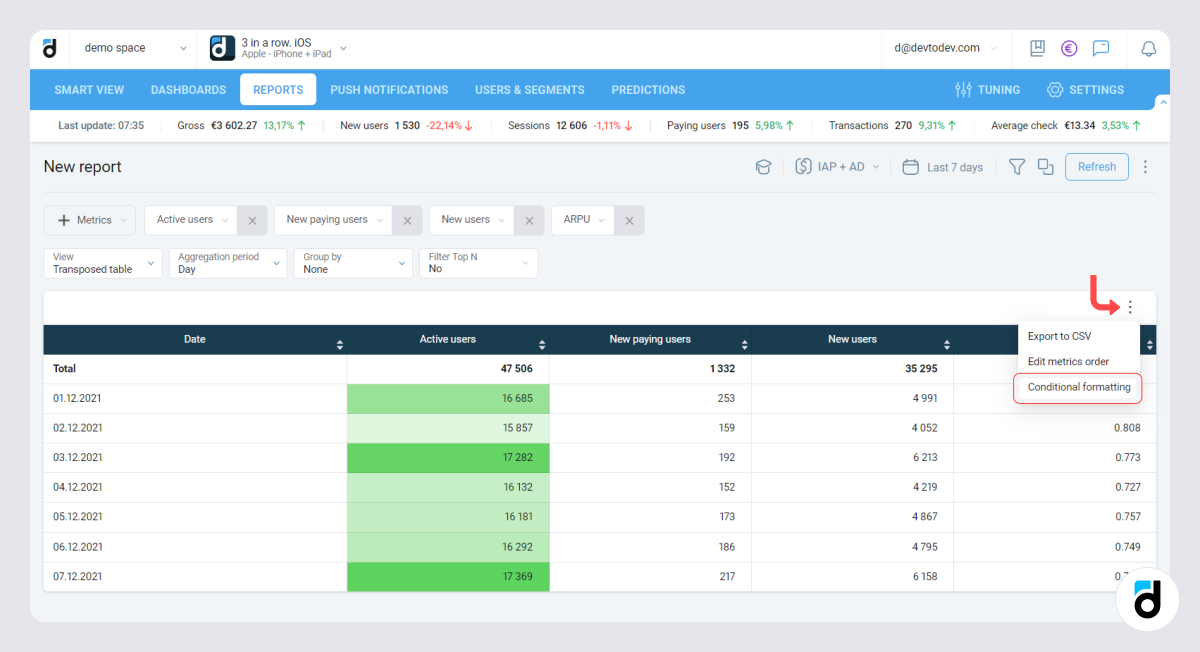
To apply conditional formatting (color code) to the generated report, click the sandwich menu in the top right corner of the table and select ‘Conditional formatting’ from the drop-down list:
You open a menu containing the selected metrics (the ones that you selected with ‘+ Metrics’) and a drop-down menu.
There are two types of formatting - by a specific value and color scale.
You need to choose the formatting type for every metric on the left:
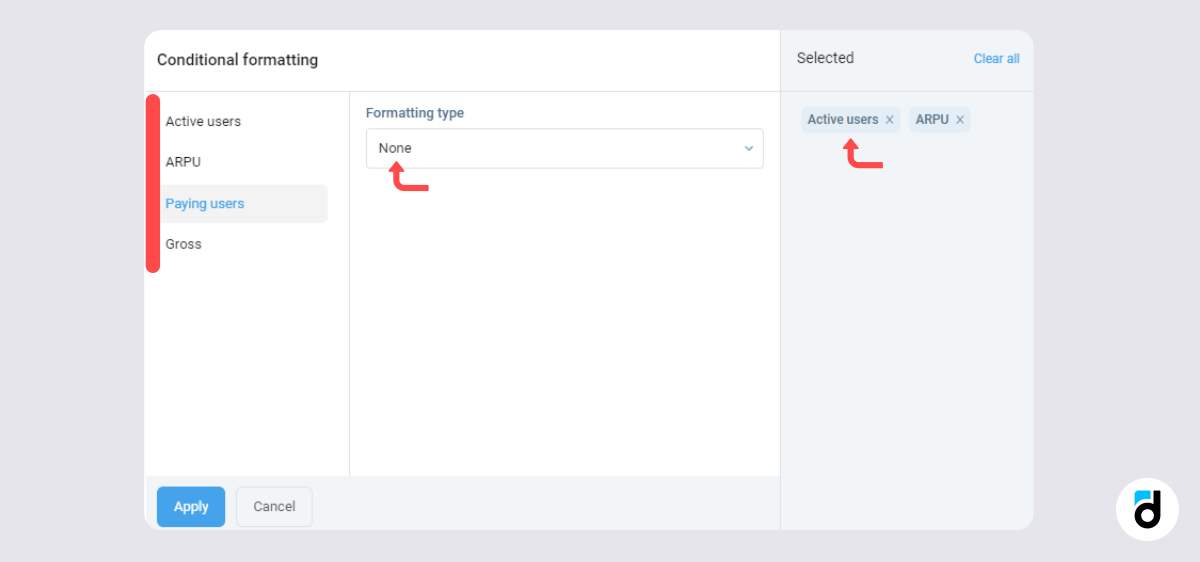
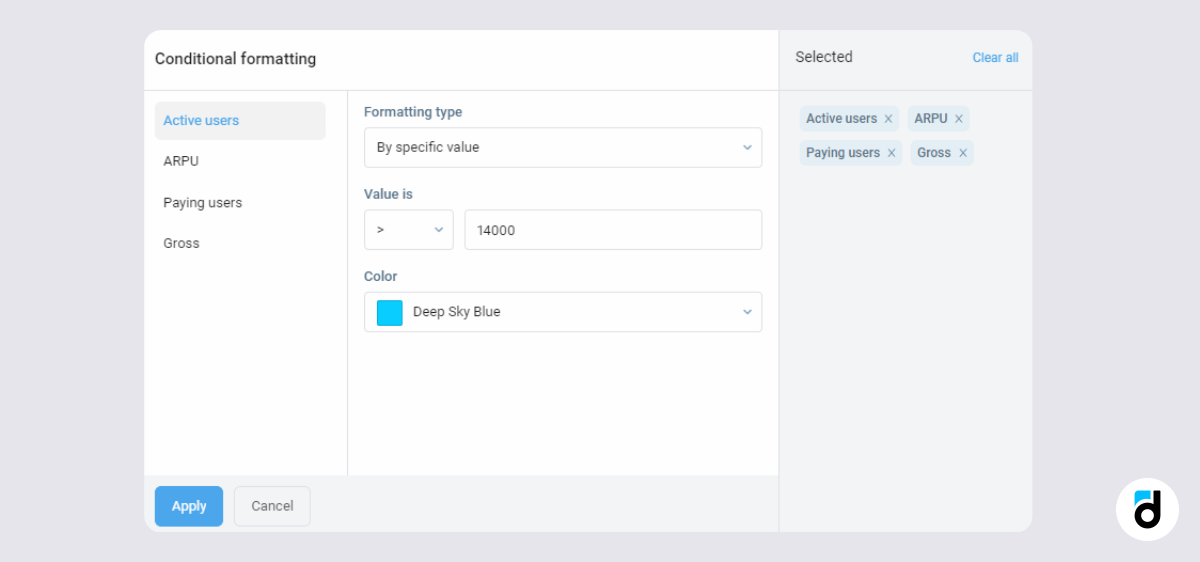
By Specific Value
Use this type of formatting if you need to highlight specific values only. It’s quite simple: just select the value (more than >, less than <, etc.) you want to highlight and the desired color for every meric:
As a result, you will get a tabe like this one:
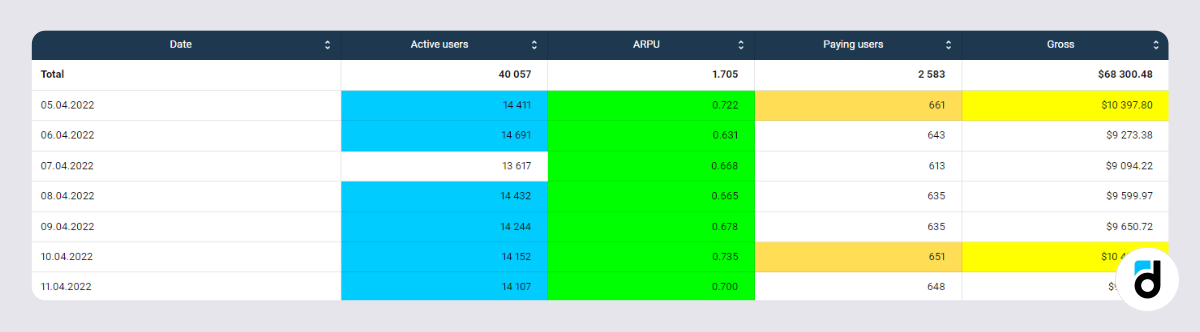
Please note that you don’t need to click the ‘Refresh’ button to see the result.
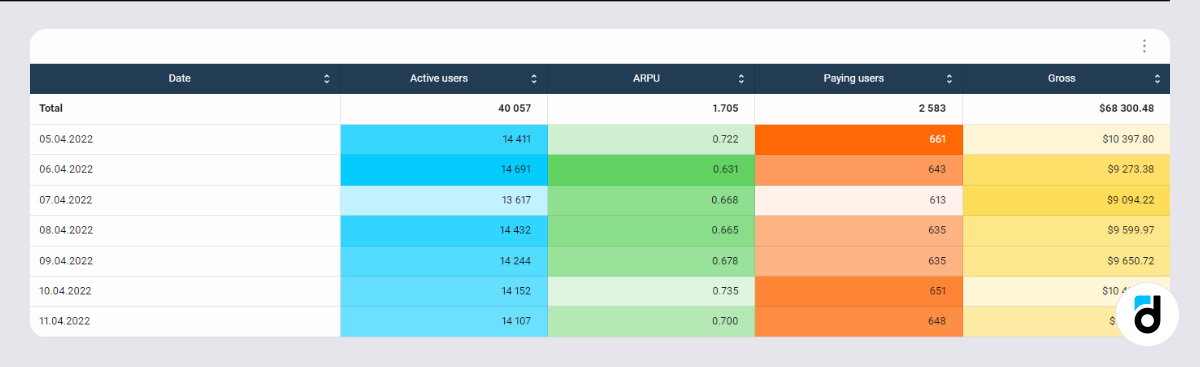
Color Scale
Use this type of formatting if you want to color all values in a column and accent the highest or the lowest value. This is a little bit more complex.
If you use the ‘Transposed table’ view: for EACH metric separately, select the order (‘max value brightest’ or ‘min value brightest’), select the color, ignore ‘Scale condition’, and click ‘Apply’:
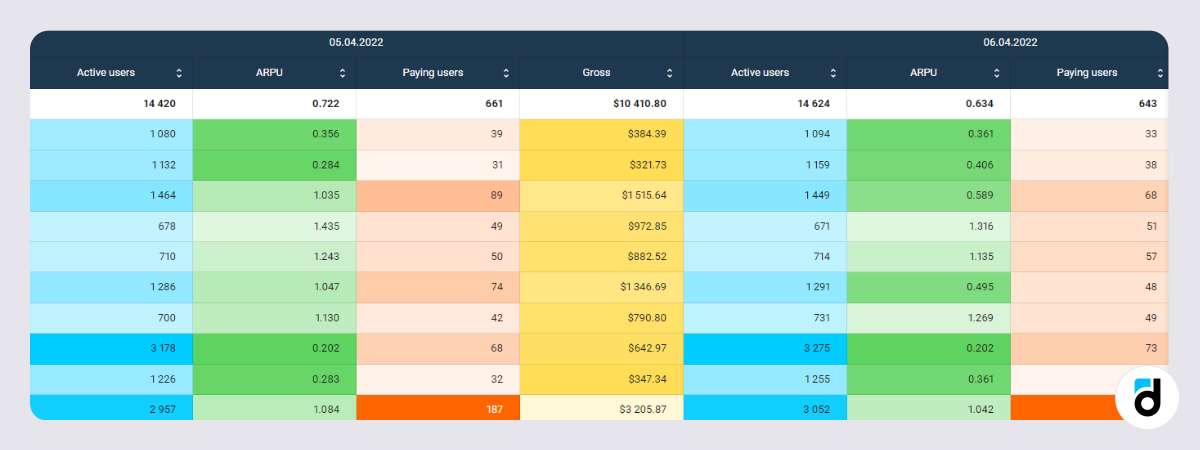
If you use the ‘Table’ view (which means that you have more than one column with the same name) and any type of grouping, you can apply two ‘Scale conditions’:
Format each column separately (the color scale is applied to each column separately based on its minimum and maximum values regardless of the metric values on other days):
Format by all metric values (the color scale is applied to the entire range and each cell is colored according to its value):
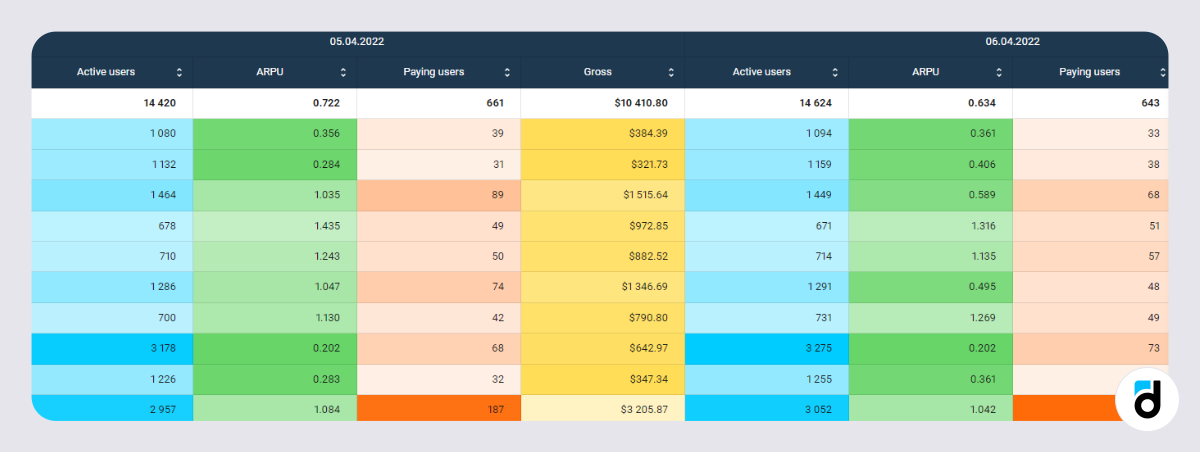
If you use the ‘Table’ view and any type of grouping, you can check the ‘Format total values’ box and then the color scale will be applied to the ‘Total’ columns too:
Here we’ve checked the ‘Format total values’ for active users, paying users and gross metrics, but didn’t do the same for the ARPU metric.
As you can see, devtodev is a perfect tool for conditional formatting of table data. Color code is multipurpose and can be used for analyzing many types of data.
You can try it out in our free demo