
When you are creating your new product, it is very important not to just stop there at the moment of launch, but to gradually improve it as well.
After some hard work, you come up with the number of versions in your hands, which are better and better each time. But how much better? What’s your next improvement must be about?
That’s why devtodev added the new section called “Versions”. With its help, you can comprehensively study how the new versions of the project are better than the old ones, and thus, constantly work on improving the product.

Before we explain how this works, let's discuss which changes usually distinguish one version from another:
- Changes in the tutorial and in the activation process (onboarding). You try to make them more understandable and exciting, so that the user, having understood the basics of the game, wants to play it further.
- Changes in retention. You roll out new game cycles, new content, new hooks that keep the user in the game. This applies to both short-term and long-term retention.
- Changes in monetization. It can be anything: from the new content to the new prices and a different order of prices for the chests.
Thus, speaking of the set of metrics, we can distinguish the following:
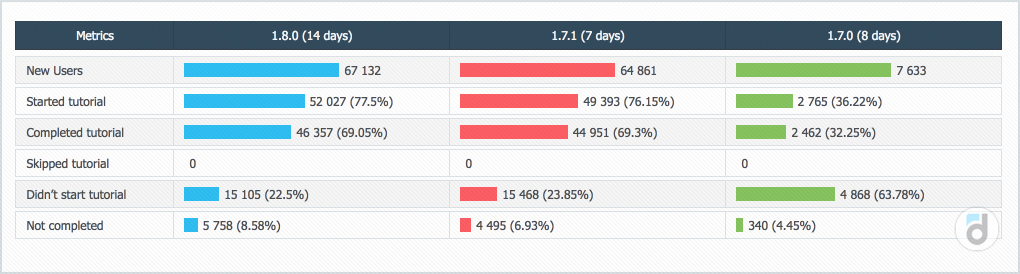
- tutorial metrics: how many users started the tutorial, what is the share of users that passed it to the end / skipped it / stopped in its progress right in the middle of tutorial;
- retention metrics: of the first, seventh and other days;
- monetization metrics: how much money users of each version bring for their first two, three, five days in the project.
Read more: Retention is Dropping - What to Do?
What else is important at the release of the new version?
It is important to understand that it works without errors. And it is very important to know how new users come into it and how old ones are updated.
Having taken all this into account, we created the Versions section. The section consists of five reports. Let's look at each of them in more detail.
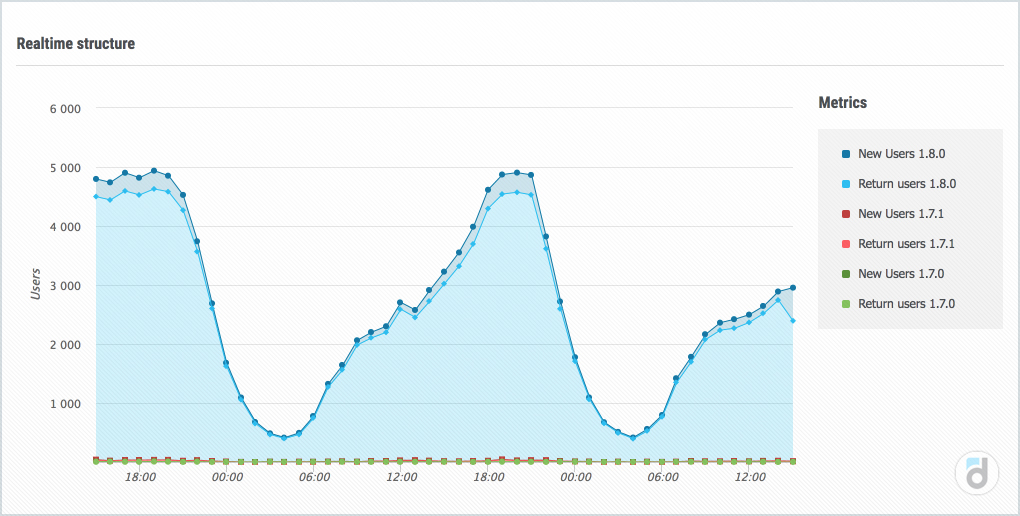
The Realtime Structure report is designed for online monitoring when a new version is released. The data in the report is updated every hour, and you can quickly find the problem.
The report shows the structure of users in the cut of versions for the last 48 hours, separately highlighting new users and those who have updated from the old version.
The Tutorial Completion report shows all the metrics of passing the tutorial by your users.
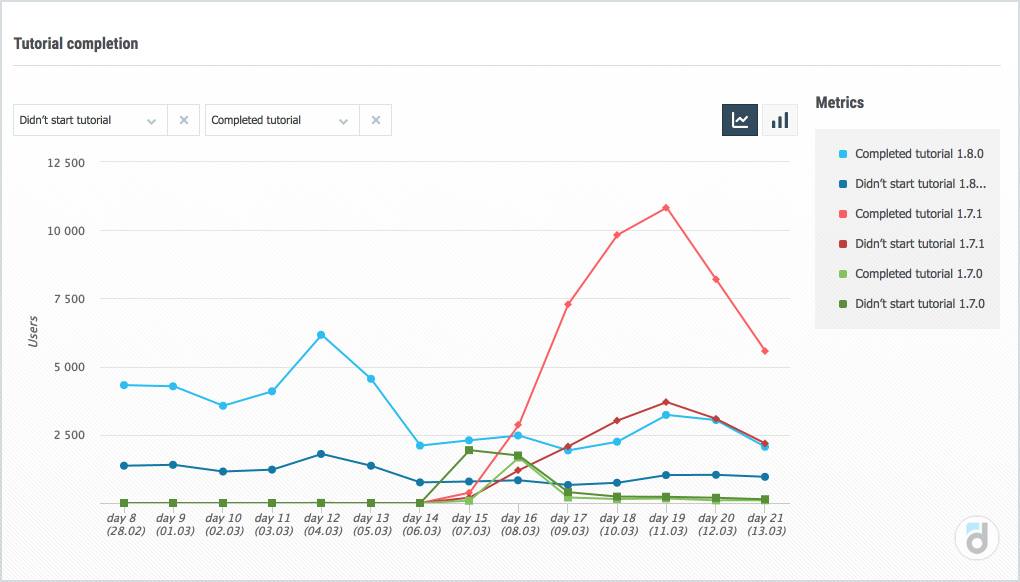
You choose which metrics from the list you want to display on graph:
- new users
- users who started the tutorial
- users who did not start the tutorial
- users who skipped the tutorial
- users who finished the tutorial
- users who did not finish the tutorial
- time of passing the tutorial (we show the median for all users).
In the report, the data for all versions is given to one point, so you compare by the different versions the performance of the tutorial for the first, second day after the release of the version and so on.
We also show the funnel of passing the tutorial, and you can track its passage in the cut of versions not only in dynamics by days, but also for the entire time at once.
Similarly the Retention report works.
Read more: How to Apply Analytics at Every Stage of Product Development
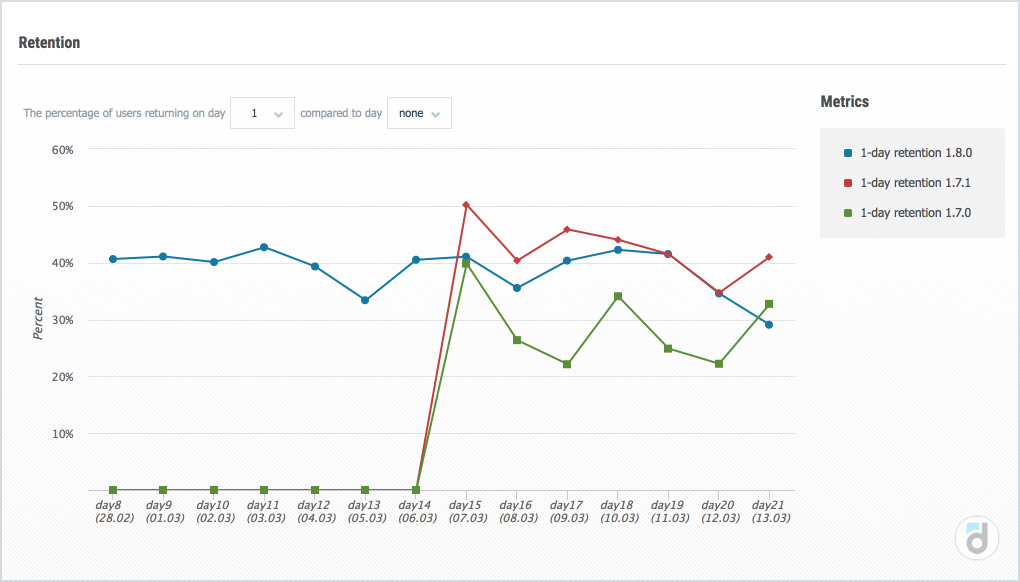
You choose which day (or days) to display on the graph, and devtodev shows how these indicators change in the cut of versions. Again, the data for all versions is given to a single point, so you are comparing the retention of the first, the second day from release of the version, and so on.
In the example above, three weeks have passed since the last (1.8.0) version was released, so the report window is shifted to the right. In the previous versions, users came only two weeks after the version was released, so the red and green graphs do not start right away.
If we compare the 1-day retention indicator in the cut of versions, we see that the retention in version 1.8.0 is better than in version 1.7.0, and definitely not better than in version 1.7.1.
Read more: Top 10 Youtube Channels for Data Analysts
The N-day revenue report shows the cumulative revenue from one user in the particular version.
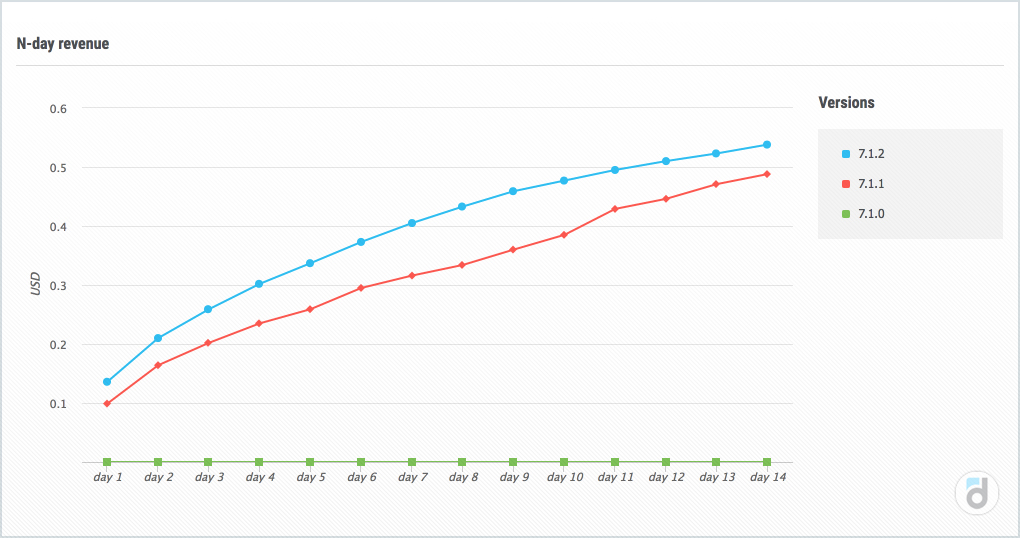
You see a graph of how much money comes on average from one user for the first day, the first two days, the first three days, ..., the first fourteen days in the version. So you can quickly determine the monetization potential of the version and compare them with each other.
In particular, on the above chart, you see that the users of version 7.1.2 start off the bat and immediately begin to pay an average more than the users of the previous (7.1.1) version.
And version 7.1.0 did not bring money at all, at least for the first 14 days from the date of registration, no one of its users made any payments.
Finally, the Audience report shows the structure of your audience by versions over the past two weeks.
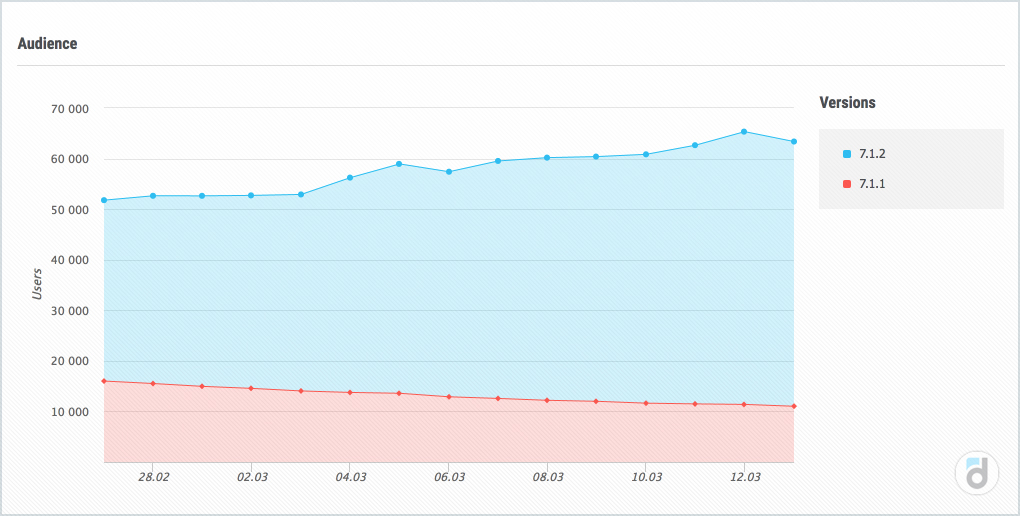
Looking at this report, you can understand how users flow from one version to another, what versions were released recently, and how many players used them.
Read more: 3 Cases of devtodev Integration (RemiVision, SneakyBox, Stepico)
Let's try to use the report on a real case.
Let's say you decided to change the start page in your product. You decided to change the color of the "Register" button, to experiment with the fonts and the background image. You take the first day retention metric as the basic metric.
After choosing the right color, you are looking for a new font, then, having decided on the font, you set the optimal picture, in your opinion.
And now let's compare the last version with the original one. I would not be surprised if it ended up worse than the version you started making the changes with.

Firstly, did you check the statistical significance? Never forget about it.
Secondly, it is possible that you simply misinterpreted the data available and gave out the wishful thinking.
And thirdly, taking as a basis only 1-day retention, you forgot about those metrics that preceded (the success of the tutorial), and those that followed it (monetization metrics).
The Versions section in devtodev allows you to compare versions in a complex way, so that you see the differences between them at all phases, and you can make better and faster decisions about whether the new version is really better than the old one and how much.
The only thing left is to wish your product to develop, so that each new version is better than the previous one by all fronts.


: The Basics")
: The Basics")


 in Mobile Games")
 in Mobile Games")


")
")


")
")


")
")


 Tactics for Mobile Games")
 Tactics for Mobile Games")


