
In this article, we’ll be looking at the most crucial user engagement metrics out there.
The competition on the mobile app/game market is fierce. In February 2023 alone, approximately 87 thousand mobile apps were released through the Google Play Store. Focusing on installs alone is not nearly enough for the app to be successful and this is where user engagement comes into play.
What is engagement?
Engagement is a vague notion that changes its meaning depending on the context. In the case of mobile apps and games, this is a measure of how your app is perceived by users, how useful (or exciting) they find it, and how well it fulfills their goals. So, basically we are talking about the frequency of visits, the length of those visits, and a target action execution.
Read more: User Retention: Measure by Hours or Calendar Days?
Tracking this metric can give developers and analysts additional information about the quality of newly acquired traffic, UX, the overall value of the app, even about some technical flaws. User engagement is measured by a number of metrics and not a single one of them taken alone can provide actionable data that is enough to make a decision. Rather, in order to get data-backed answers, you need to look at the bigger picture.
App Engagement Metrics You Must Know
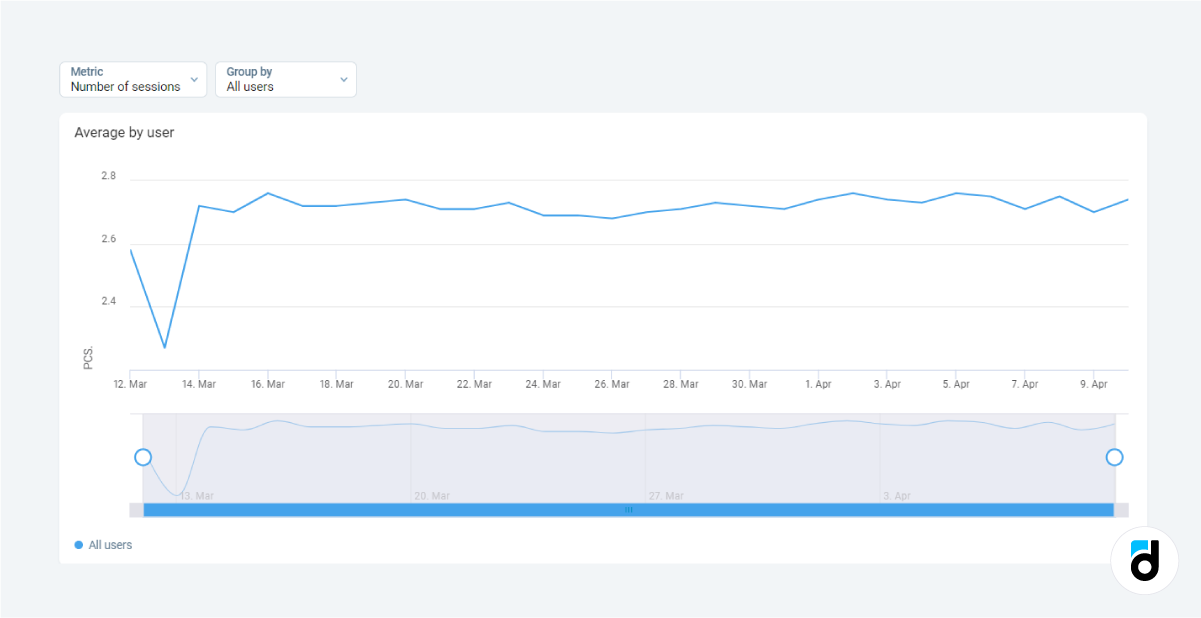
Number of sessions
Number of sessions is the total number of app launches. In this case, it is wrong to say that “the more the better” because the metric varies greatly depending on the niche. You hardly open a travel app every day because it is season-dependent, meanwhile you open your favorite game several times a day therefore creating many sessions.
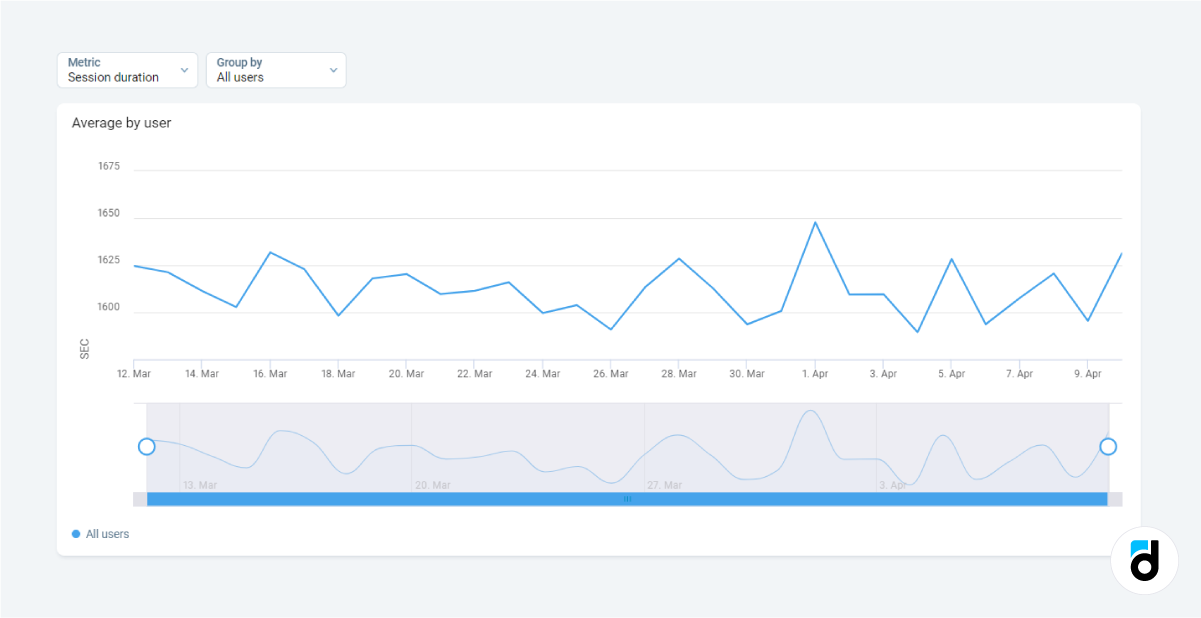
Average session length
Average session length is another engagement metric. It measures the time between app launch (session start) and exit (session finish). And again, as with the number of sessions, you shouldn’t pursue a higher session length. The “ideal” length totally depends on the type (app/game) and niche.
Conversion rate
Conversion rate is the percentage of users who completed a certain action to the total number of users. In case of your ultimate goal (e.g. a purchase), you can say that these users are the most engaged because they installed the app and reached a target.
DAU/WAU/MAU
DAU/WAU/MAU (daily active users, weekly active users and monthly active users). These are three important user engagement metrics. The difference between them is that you count daily numbers in the first case, weekly in the second, and monthly in the third. In general, this is the number of active users who opened the app over a specific period of time. The higher they are, the better.
Read more: One-time and scheduled push notifications
Lifetime
Lifetime is the entire time period between app install and the time when the user drops off for good. In a nutshell, the lifetime metric describes the average time a user continues to be active in the project. As with stickiness and retention rate, the higher this metric is, the better.
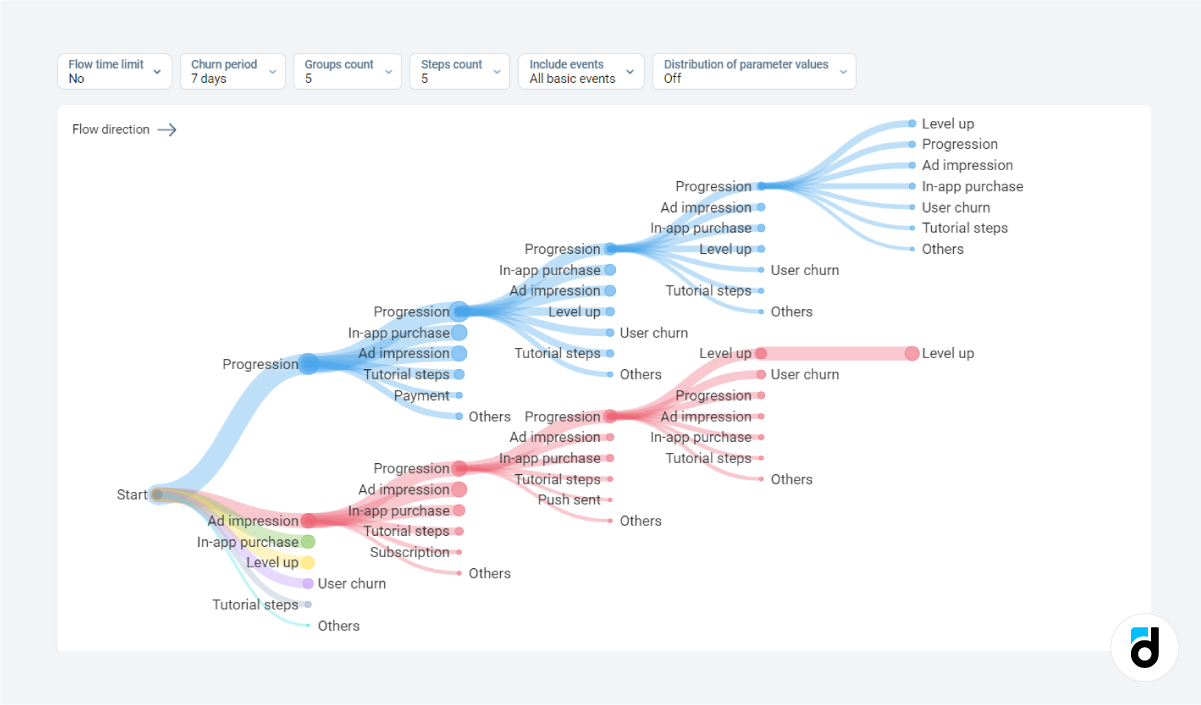
User flow
User flow is the best way to keep track of user actions within the app. It is not how you usually picture a “metric” but it is still extremely telling of user behavior and their engagement with the app or game.
Sticky factor
Sticky factor is the DAU/MAU ratio. “Sticky apps” are highly engaging and have a large number of repeat users who open them on a regular basis. This is arguably the most important engagement metric that indicates how valuable your app is to users.
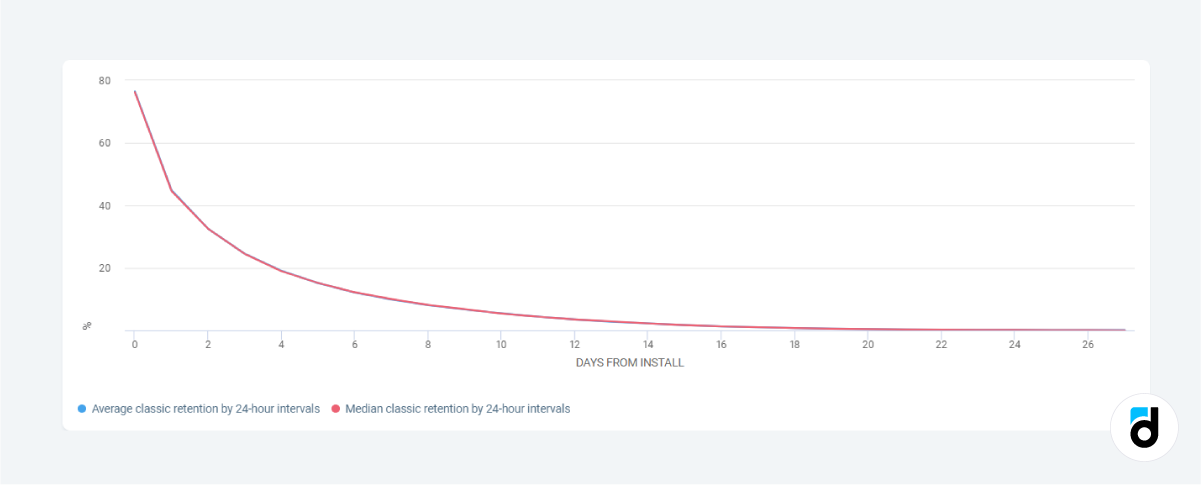
Retention rate
Retention rate is a famous and widely-used metric. There is no single “retention rate” because this is the percentage of users who engaged with the app at a specific day. devtodev users often calculate day 7 retention rate (the number of users who installed the app one week ago and opened it again on the 7th day), as well as day 1, day 28, and day 360 retention rate. If you want to, you can calculate day 5 retention rate or any other of your choice.
It is somewhat similar to the sticky factor mentioned above because it reveals the percentage of people who open your product more than once and therefore are engaged with it.
Read more: User Retention: Measure by Hours or Calendar Days?
Activation rate
Activation rate. App installation is supposed to be followed by activation. People may install an app or game simply because they accidentally clicked the wrong button, or they opened it for the first time but had difficulty signing up. To measure the activation rate, you need to set an activation action - it can be launching the app for the first time, completing onboarding, creating an account, etc. So, be aware of the ratio of downloads, installs and activations. This will help you identify the very first problems that users face and fix them immediately.
Read more: Retention by Event Report - a Reliable Way to Measure User Loyalty
NPS
NPS. Net promoter score is a simple scale with scores ranging from 0 to 10 and a question about the product. After calculating the results, you can divide your users into three categories - detractors, passives, and promoters. The calculation is quite easy: first, divide the number of detractors and promoters by the total number of people who gave ratings and multiply by 100%, then take the percentage of detractors from the percentage of promoters.
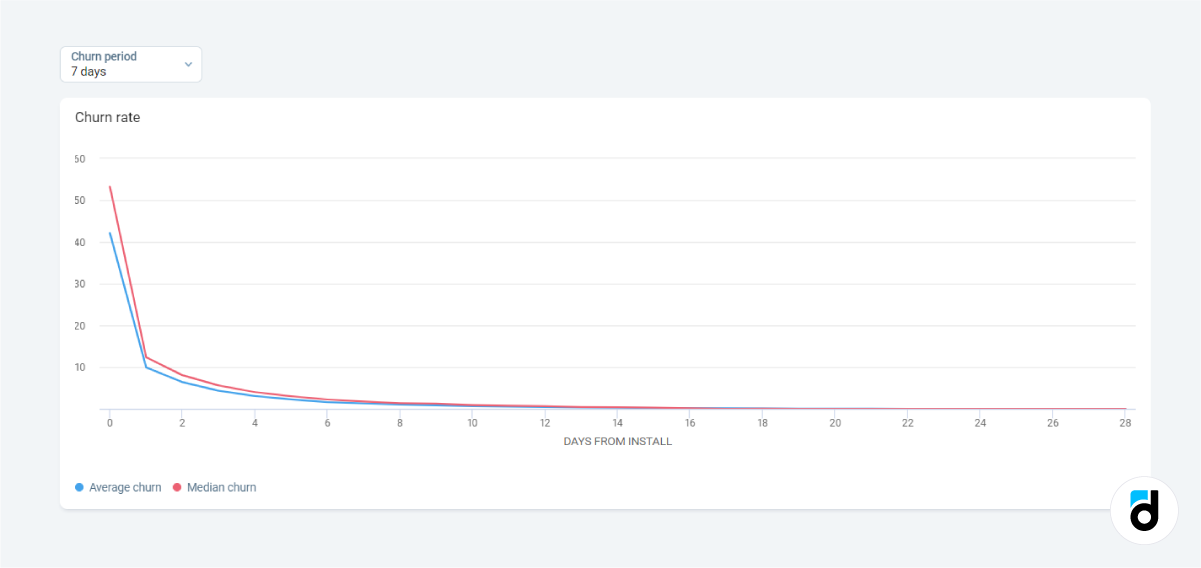
Churn rate
Churn rate is another engagement metric which is, however, rather on a negative side. Churn rate is the percentage of users who dropped off of the app and never came back. You need to use various analytics tools (like events) to find places where you lose the users and fix them.
Read more: How to identify and re-engage churned users
Bounce rate
Bounce rate. This is the churn rate with a limitation. Bounce rate is the ratio of the number of users who quit after viewing the first app screen to the total number of users. Don’t worry if some of the users bounce off because they may just change their mind after app installation. However, if the bounce rate is rather high, try to find the reasons.