
devtodev is helping you keep in touch with what’s happening in the game market. Every month we publish an overview of reports on the most popular games worldwide, top-grossing games, successful releases, favorite video game types, trends, etc. This overview is prepared by Dmitriy Byshonkov - the author of the GameDev Reports by devtodev Telegram channel. You can read the July report here.
Table of Contents
- App Annie: 2021 Mobile Gaming Tear Down - report
- Sensor Tower: Top Grossing Mobile Games Worldwide in July 2021
- The NPD Group: US users have spent $4.6B on games in July 2021
- Sensor Tower: Top Mobile Games by Downloads in July 2021
- Newzoo: How different generations interact with games
- Stream Elements & Rainmaker.gg: Twitch views in July were up by 23%
- AppMagic: Top Mobile Games Downloads and Revenue in July 2021
- GSD: PlayStation, Xbox, Mario, and FIFA are the main brands at the EMEAA Market in H1 2021
- Sensor Tower: Dragon Ball Z: Dokkah Battle passed the $3 billion milestone
- Sensor Tower: Top Mobile Games in South Korea by Revenue and Downloads in Q2 2021
- Newzoo: How Gamers consume food and drinks while playing
- Sensor Tower: Mobile Market Forecast 2021-2025
- Sensor Tower: US users are using 46 apps per month on average
- Steam: Participation in Demo Festivals might increase wishlists by 421%
- Sensor Tower: State of Mobile Game Advertising 2021 Report
- Sensor Tower: Tabletop games Revenue in the US increased by 40% last year
- Clash Royale earned record revenue in the last 2 years in June
- Newzoo & Pangle: Puzzle Games Report
- App Annie & AppsFlyer: State of App Marketing in Latin America 2021
- Sensor Tower: Gardenscapes Revenue passed $3 billion
- App Annie: Hypercasual downloads increased by 15% in Q2 2021
- ISFE: European Gaming market earned €23.3 billion in 2020
- Newzoo: Global Cloud Gaming Report 2021 - briefly
- SocialPeta: Mobile Marketing Situation in H1 2021
App Annie: 2021 Mobile Gaming Tear Down - report
-
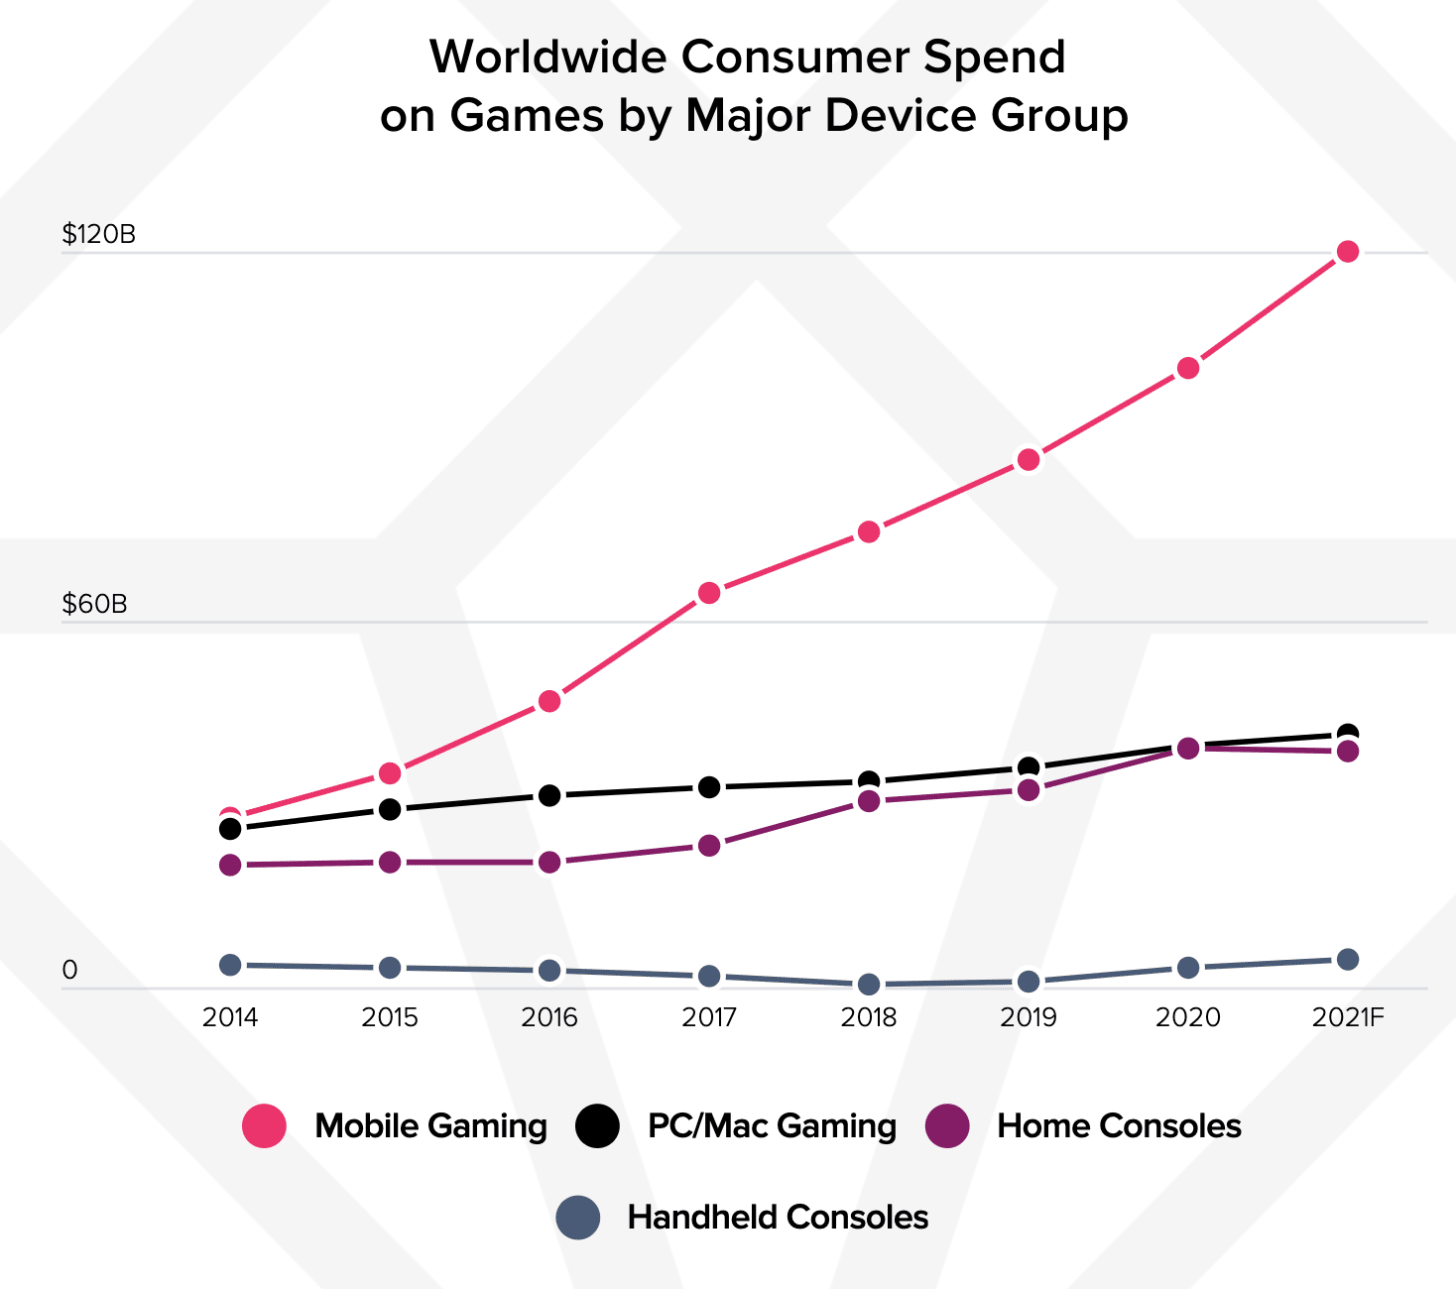
The Mobile Gaming market in 2021 will reach $120 billion. It’s 3 times more than the console market, according to App Annie specialists.
- During the H1 2021 users were paying $1.7B per week in games. It’s 40% more than pre-pandemic.
-
810 games have been earning >$1M per month in H1 2021. 7 of them managed to earn >$100M per month. In 2019, there were 650 mobile games with >$1M in revenue and only 2 reached >$100M revenue plank.
-
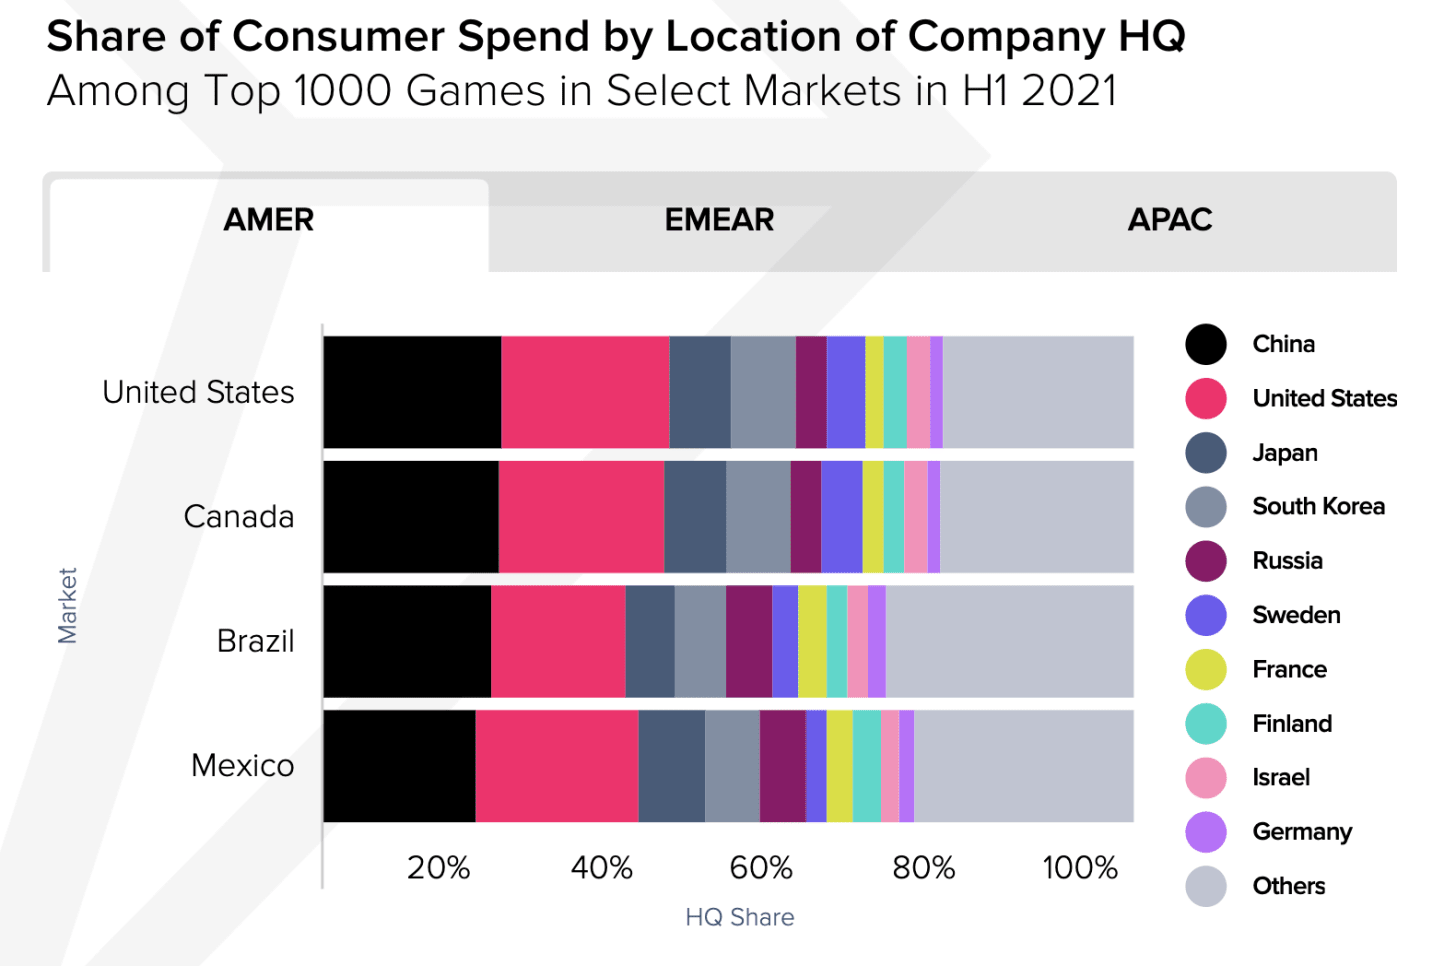
Companies with HQ in China are earning more than any other company in the world. For example, they were responsible for 22% of all revenue in the US market in H1 2021.
- Hypercasual games had the most downloads in H1 2021 (6.8B - 2 times more, than in 2019). Shooters have the best time spending; the RPG genre has the highest revenue.
Forecast:
-
The hypercasual genre will continue to grow in most regions.
-
Innovative genres will take away the audience from classic genres.
-
Shooters & action games with online & social features will continue to engage the audience well.
Sensor Tower: Top Grossing Mobile Games Worldwide in July 2021
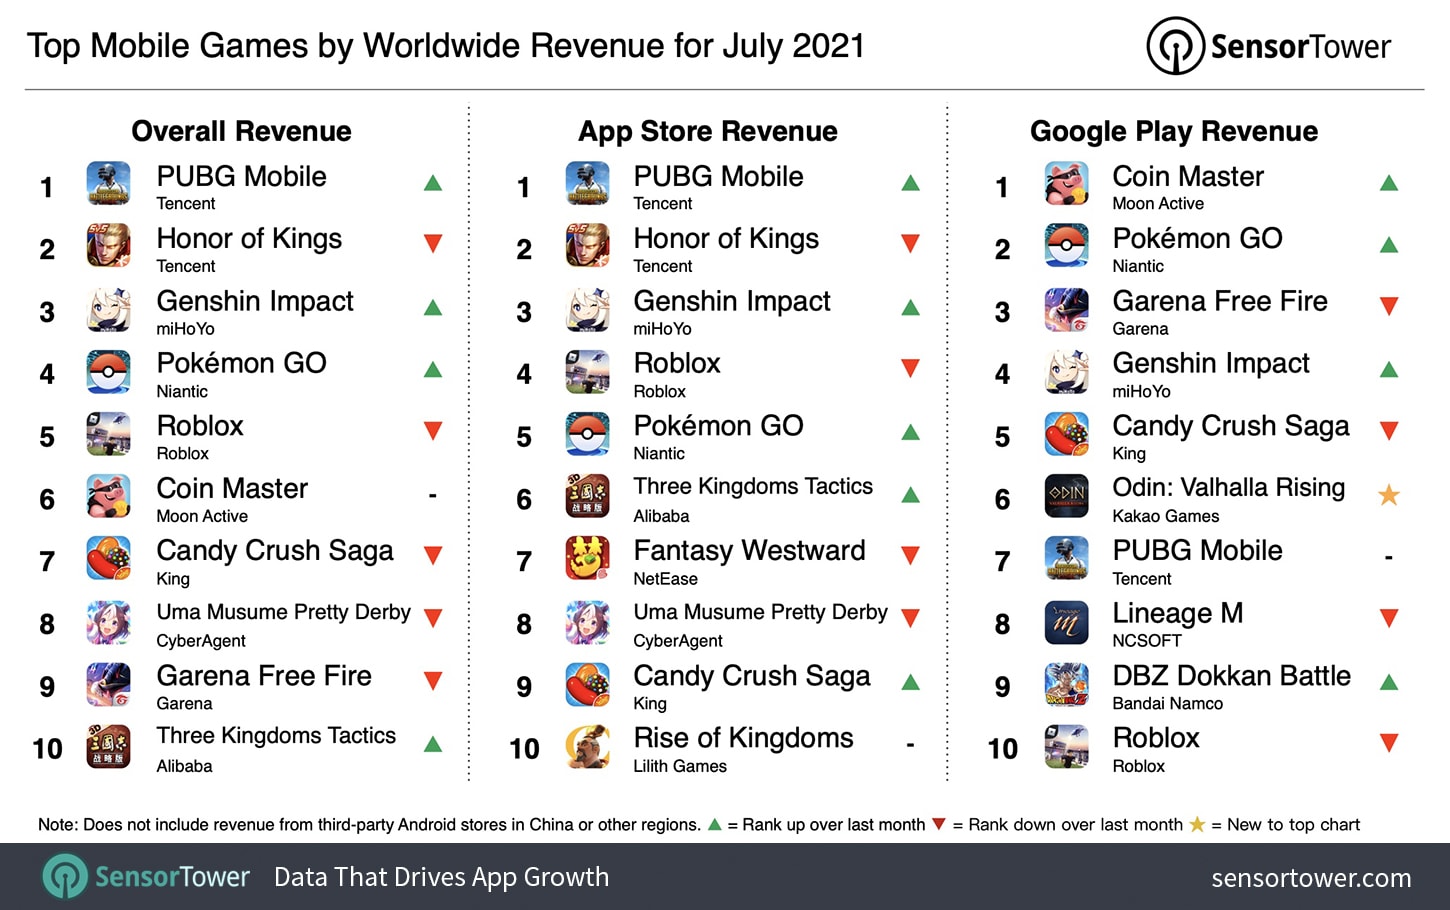
- PUBG Mobile achieved first place with $299M of revenue. It’s 26.7% more than a year before. 68.4% of all revenue came from China, 6.7% - from the US, and 6% - from Turkey.
-
Honor of Kings is in second place with $231.2M of revenue. The project showed only a 2% YoY increase. 94.7% of all money came from China.
-
Generally, users have spent $7.6B in App Store and Google Play on games in July 2021. It’s 7.2% more than a year before. The US is responsible for $2.2B of this sum (29%). Japan is next with a 19.8% share and China is third (17.4%). But, Sensor Tower is not tracking alternative stores in China, which makes the data not complete.
-
Pokemon GO showed fifth better month in history with $150.4M of revenue.
The NPD Group: US users have spent $4.6B on games in July 2021
-
It’s 10% more than a year before. It’s also the best month since July 2008 in revenue.
-
PlayStation 5 became the most successful console of the month in terms of dollar figures, while Nintendo Switch sold most consoles.
-
Gaming hardware spending increased 50% YoY. Most likely, it’s connected with the next-gen hardware release.
-
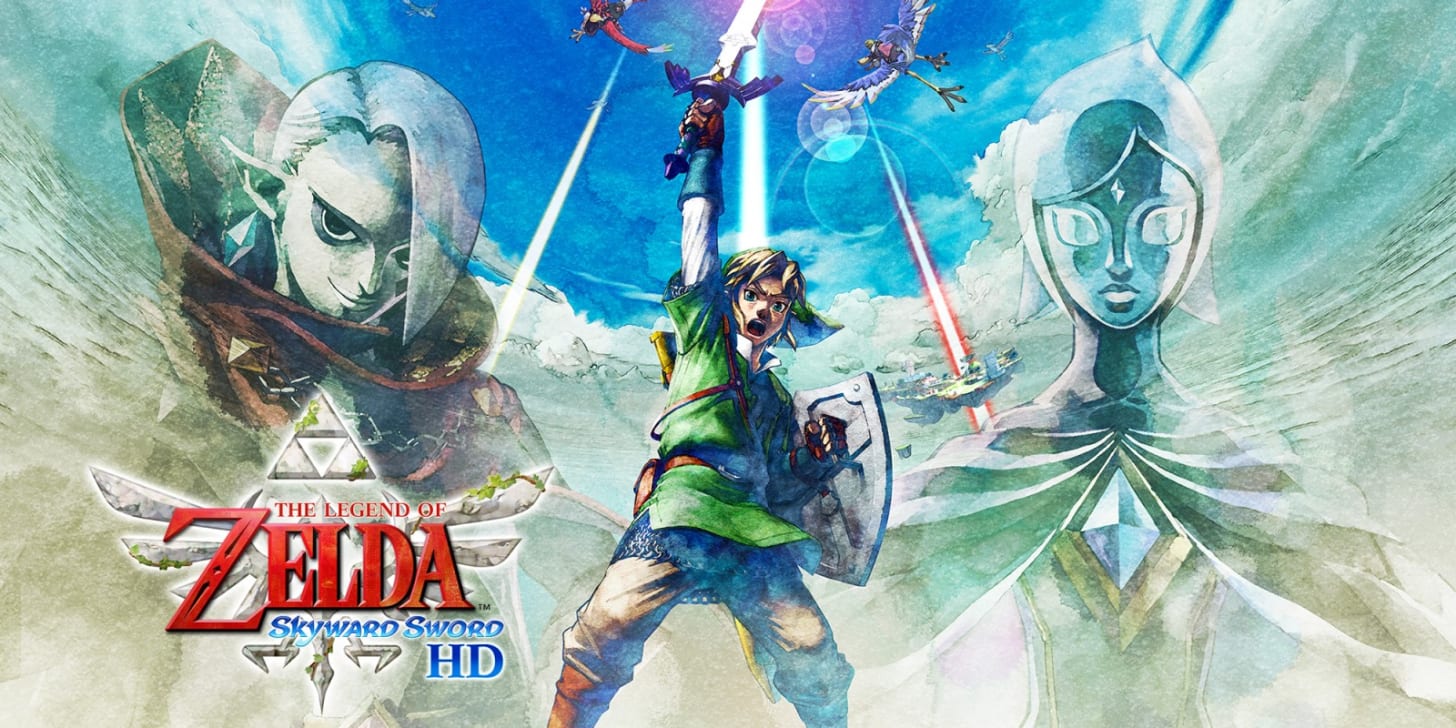
The Legend of Zelda: Skyward Sword HD became the most successful project of July 2021 in the US.
-
Spending on accessories increased by 11% compared to last year and reached $189 million.
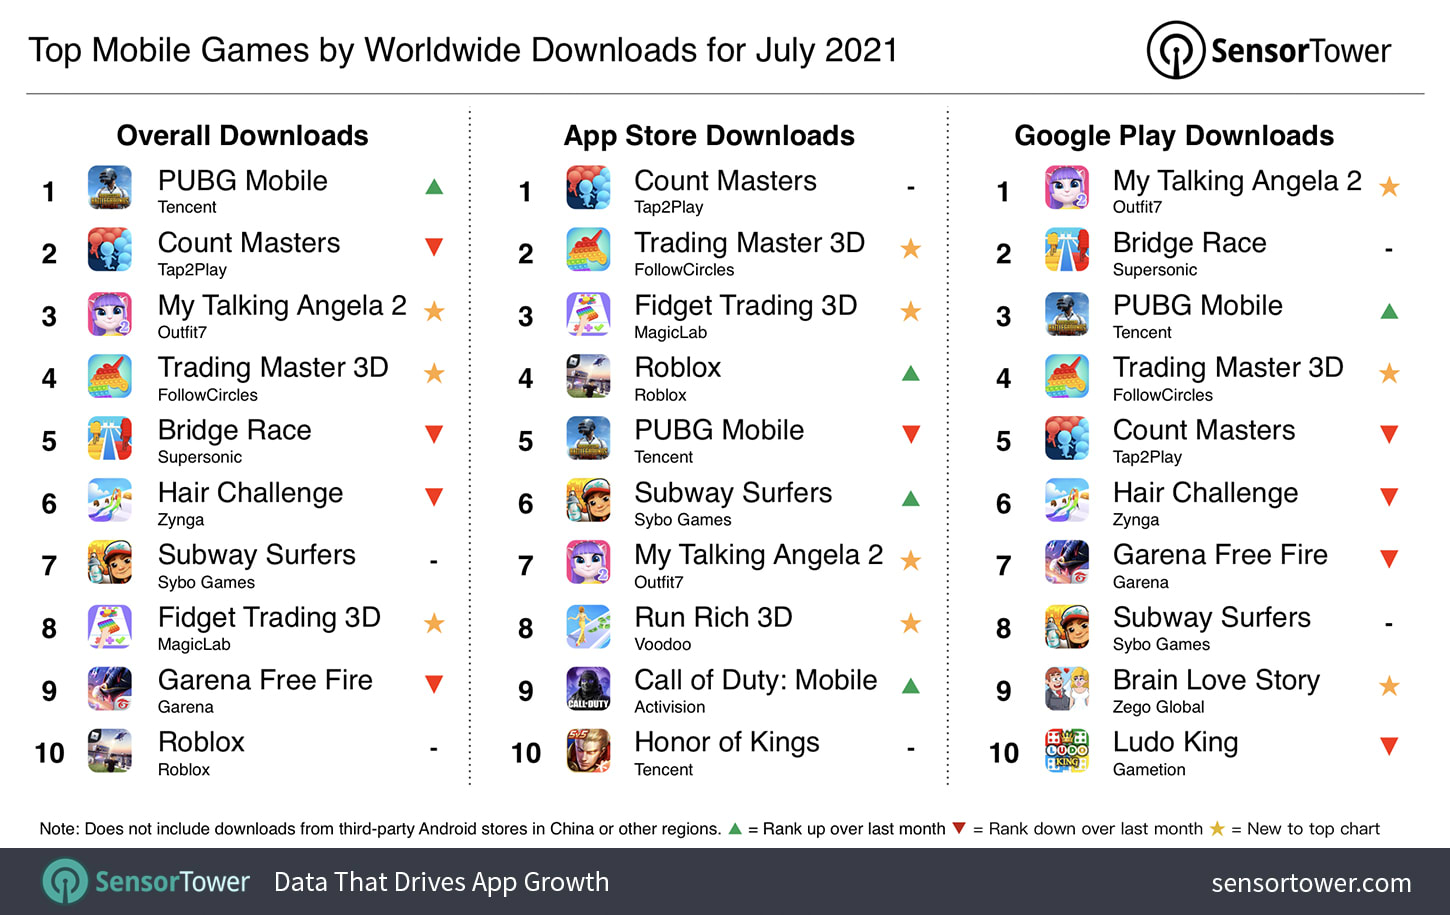
Sensor Tower: Top Mobile Games by Downloads in July 2021
-
PUBG Mobile is the July 2021 king. Indian users generated most downloads after the return of the game to stores. China is second.
-
Count Masters from Tap2Play is in second place with 24.4M installs. The US is responsible for 10.6% of all traffic, India is accounting for approximately 7%.
-
Overall in July games were downloaded 4.7B times via App Store and Google Play. It’s 2.3% lower than a year before.
-
Last month, India was the first country by downloads with 815M installs (17.2% of all amount). The US is second (9.3%), Brazil is third (8.3%).
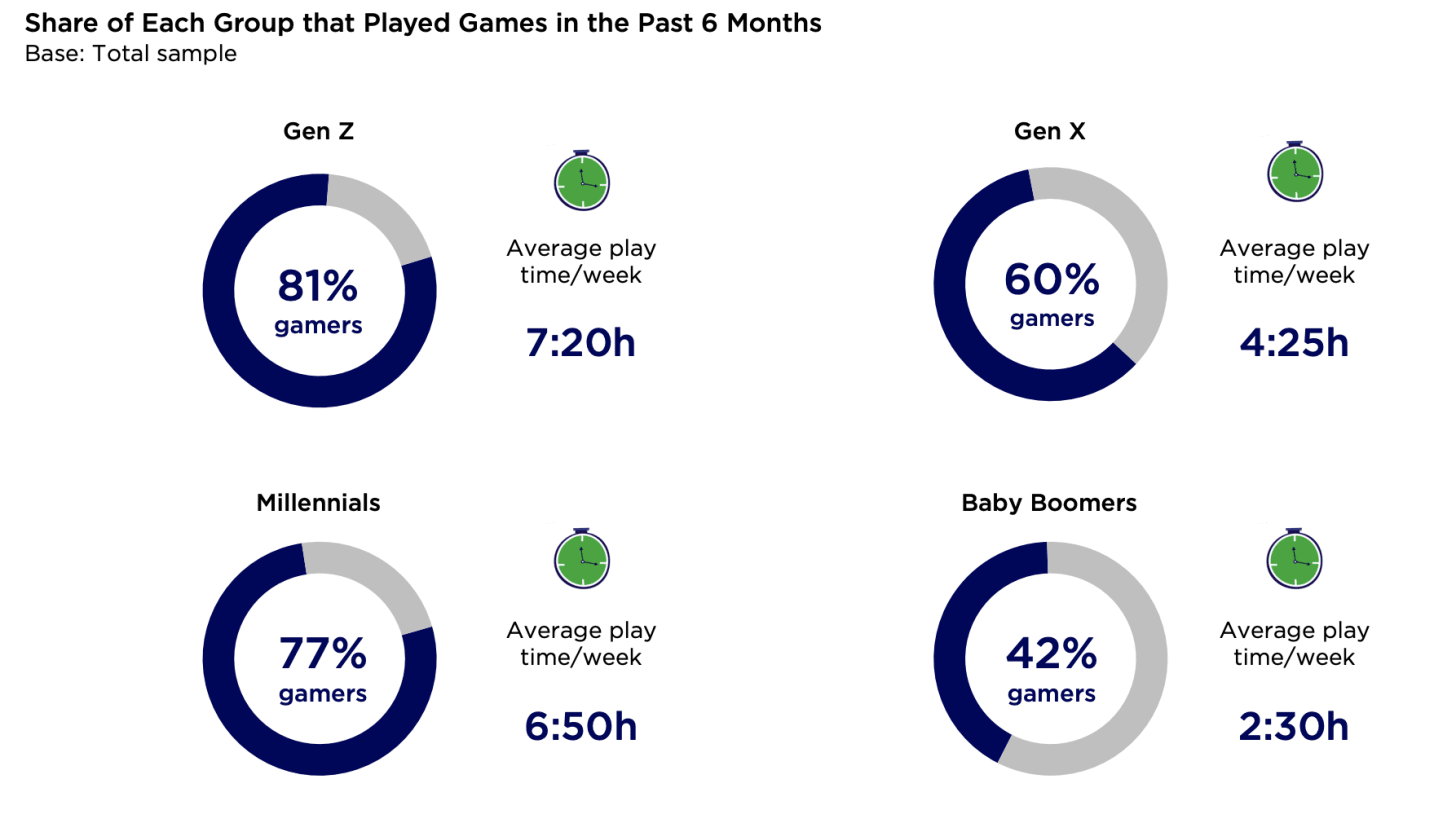
Newzoo: How different generations interact with games
-
Millennials and Gen Z people spend on games more time than on any other activity.
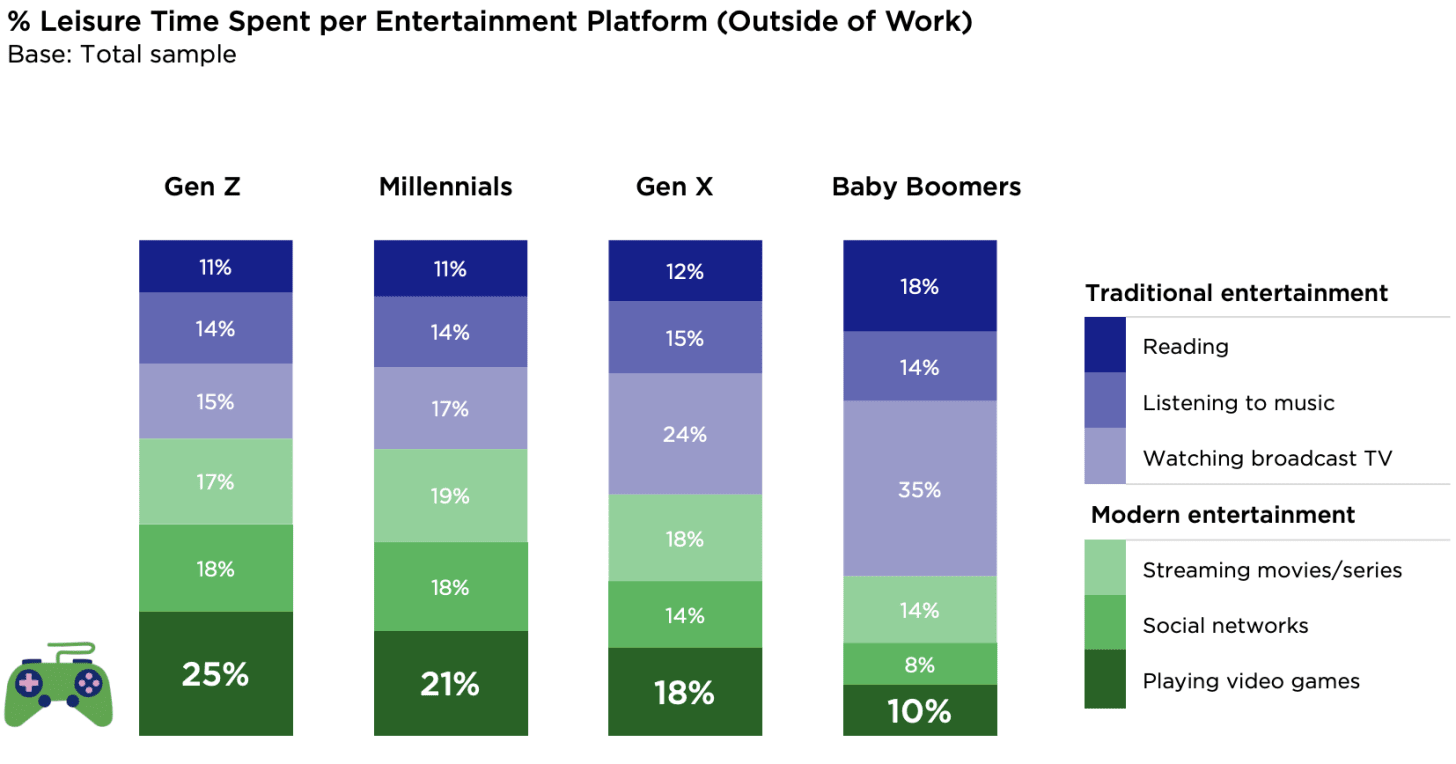
- People up to 40 years old spend, on average, 7 hours per week on games. The elder generation’s number is about 3 hours per week.
- Young players (Gen Z & Millenials) are often playing games and watching videos about them. Gen X & Baby Boomers are using videos more applicable - they’re watching how to pass difficult levels and reviews.
The full version of the report
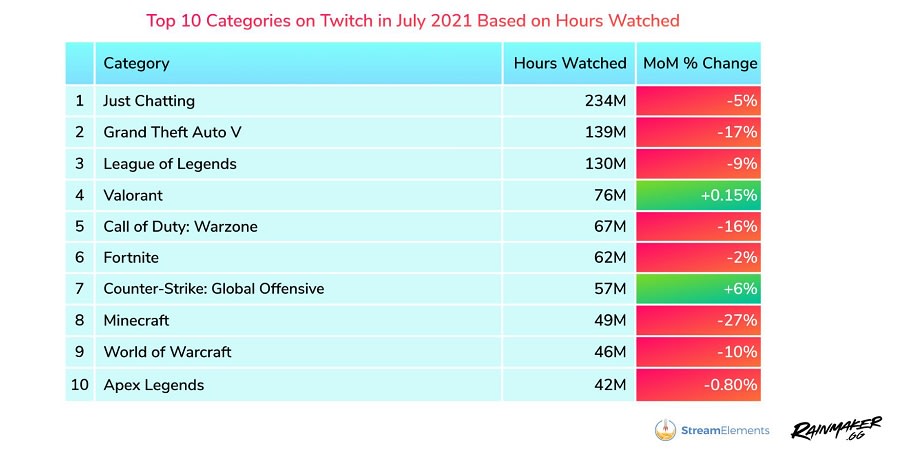
Stream Elements & Rainmaker.gg: Twitch views in July were up by 23%
-
Users watched 1.75B hours of video in total in July on Twitch. It’s 23% more than a year before.
-
Facebook Gaming also set a new record with 522M hours viewed.
-
The most popular genre is talk shows. GTA V is next with 139M hours watched - but the game showed a 17% decrease in views YoY.
AppMagic: Top Mobile Games Downloads and Revenue in July 2021
Downloads
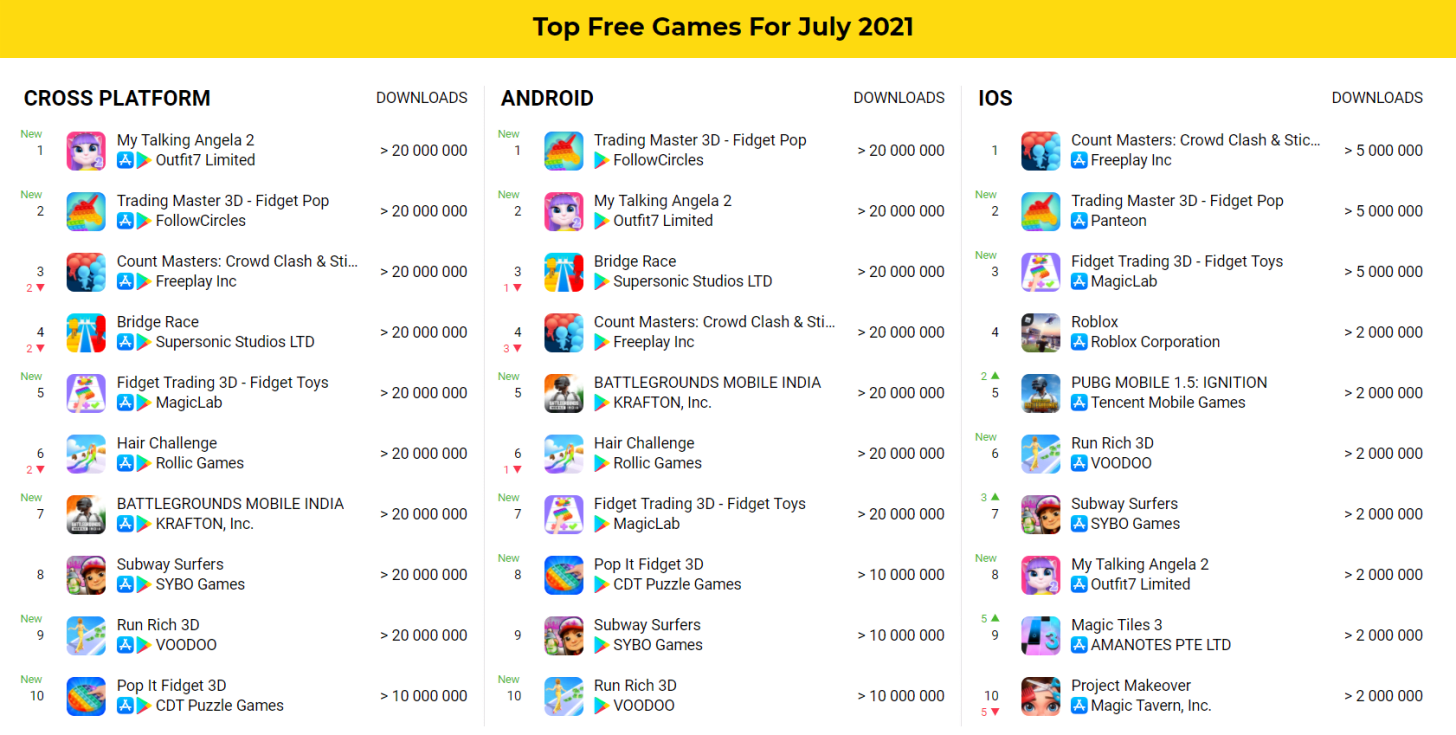
-
My Talking Angela achieved 44.6M of downloads and first place. Only 3.9M of installs were on App Store.
-
Battlegrounds Mobile India (Indian version of the PUBG) reached 5 place by downloads in Google Play with 21.2M installs.
Revenue
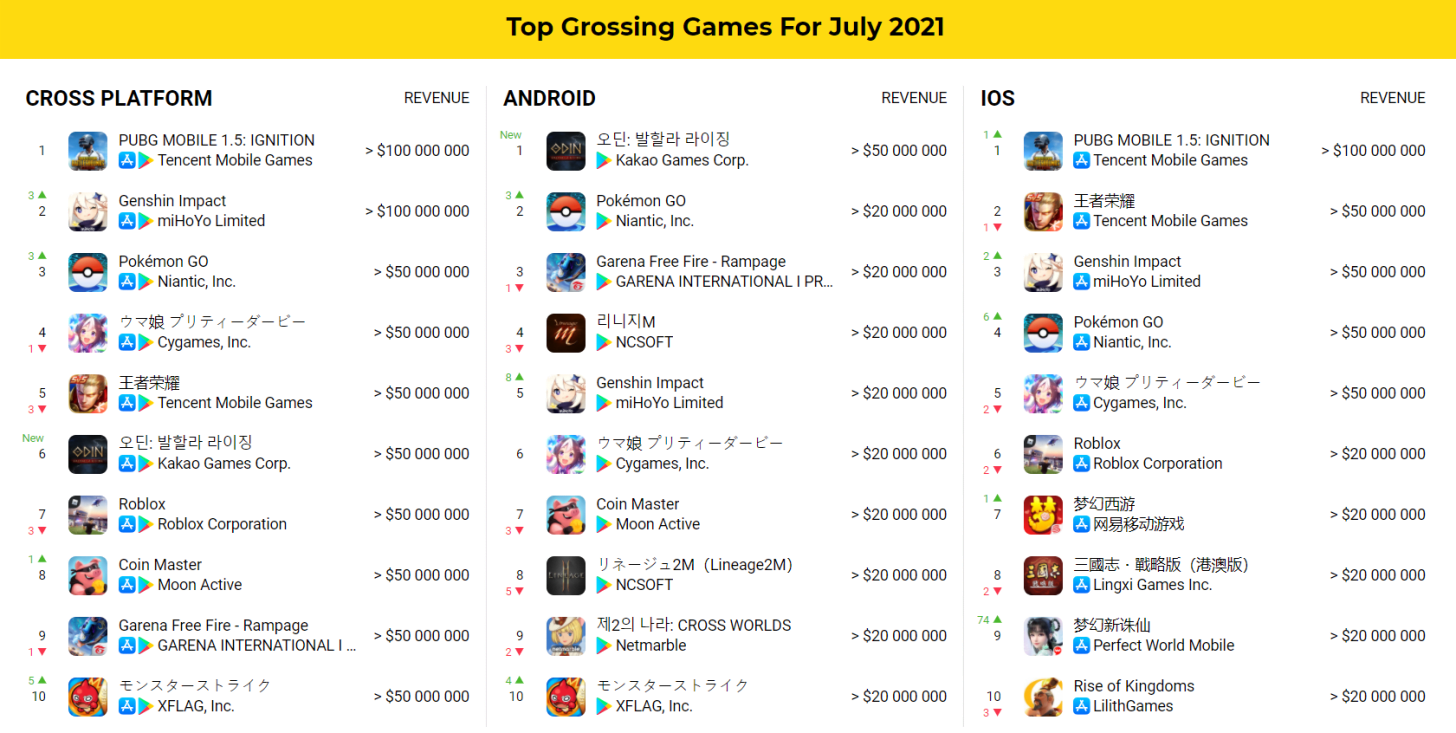
-
PUBG Mobile earned $141.2M in July. It’s the best result.
-
ODIN: Valhalla Rising from South Korean Kakao Games became the most profitable game on Google Play - its revenue was $80.2M last month.
-
Fantasy New Jade Dynasty from Perfect World Entertainment had a nice month too. The game boosted from the 83d position by iOS revenue in June to the 9th position in July with $34.9M of revenue.
GSD: PlayStation, Xbox, Mario, and FIFA are the main brands at the EMEAA Market in H1 2021
![]()
-
In the region, which includes Europe, the Middle East, Africa, Australia, and parts of Asia, 2.7M of game consoles (+4% YoY); 8.2M of gaming accessories (-5% YoY), and 82M games (-22% YoY) were sold in H1 2021.
-
Nintendo Switch sales dropped by 26% compared to the first half of 2020.
-
DualSense was the most successful region accessory, DualShock is just after. The most popular gaming headset was Pulse 3D Wireless Headset.
-
Gaming sales decreased by 22% compared to H1 2020 but grew by 5% compared to H1 2019.
-
In H1 2021 67% of all game purchases were made digitally. The year before there were 62% of purchases in such format.
-
FIFA 21 is the most popular game in the region in H1 2021. In terms of physical-only sales Super Mario 3D World + Bowser's Fury won first place; while the digital-only sales king was GTA V.
-
PS5 top-seller in H1 2021 was Spider-Man: Miles Morales; on Nintendo Switch - Mario 3D World + Bowser's Fury; on Xbox Series S|X - Call of Duty: Black Ops Cold War.
-
As for the new titles released, in H1 2021 were sold only 9M of copies. It’s less than in both 2020 (12.8M) and 2019 (17.2M).
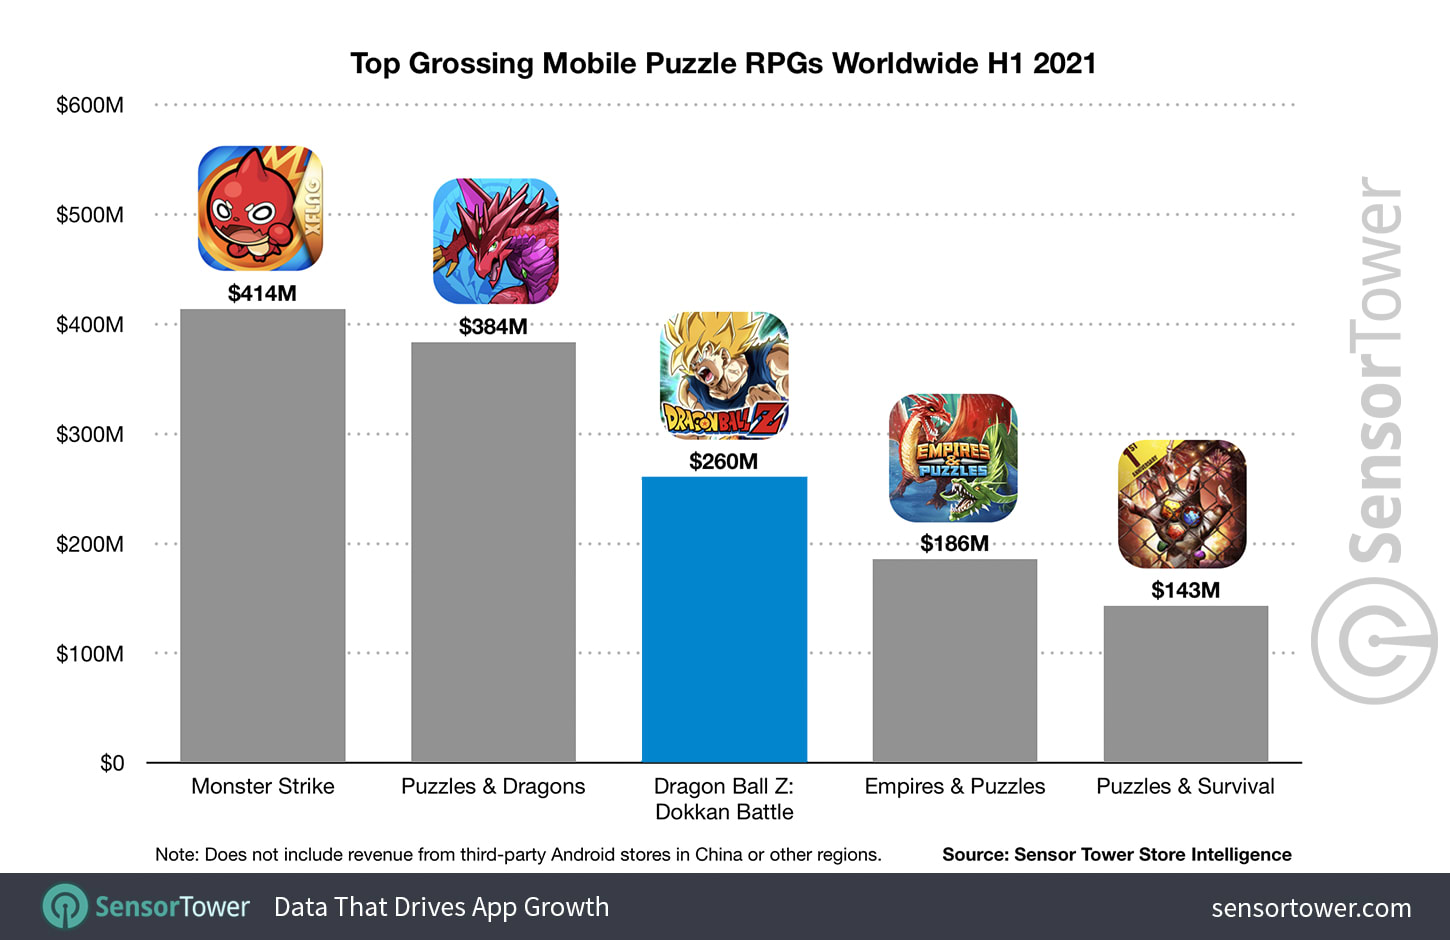
Sensor Tower: Dragon Ball Z: Dokkah Battle passed the $3 billion milestone
-
It took the game 6.5 years to reach it. Getting the last billion was a matter of 20 months, starting 2019.
-
In H1 2021 the game earned $260.4M. In genre it conceded Monster Strike (by Mixi - $414M) and Puzzles & Dragons (by GungHo - $384M).
-
In July 2021 the Dragon Ball Z: Dokkah Battle showed the third-best result in history with $80.5M of revenue. It also showed the same month’s best downloads since August 2017 - 1.6M.
-
Japan is the first region for the Dragon Ball Z: Dokkah Battle, it was responsible for 60% of all the revenue ($1.8B). The US is in second place, France is third.
-
App Store is accounting for 51.6% of all revenue, Google Play share is 48.4%.
-
Currently, the Dragon Ball Z: Dokkah Battle installs are on the 67.4M level. Japan is first (with 11.5M users), the US is second, Brazil is third. Google Play is responsible for 76% of all downloads.
Sensor Tower: Top Mobile Games in South Korea by Revenue and Downloads in Q2 2021
Revenue:
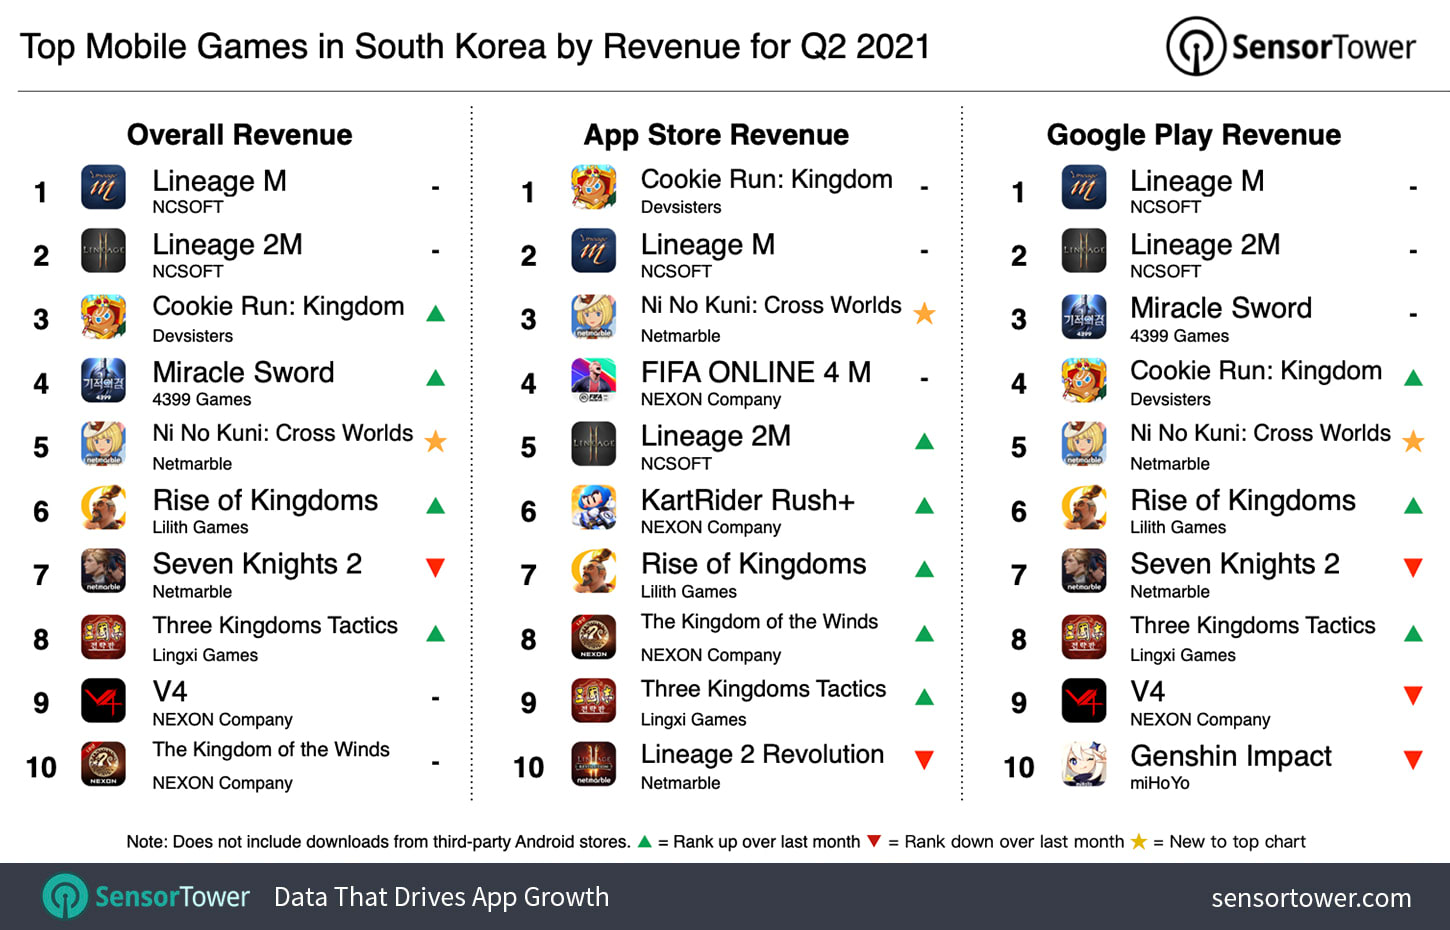
-
Lineage M earned more than any other game in Q2 2021 - $156M. It’s 7.4% growth compared to Q1 2021.
-
Lineage 2M is second with $99M revenue.
-
Released in February 2021 Three Kingdoms Tactics by Lingxi Games showed $26M of revenue in Q2 2021 - it’s 184% higher than in Q1 2021.
-
Generally, South Korean users spent $1.37B (+20% YoY) on games in Q2 2021. It’s 42% more than in Q2 2019.
Downloads:
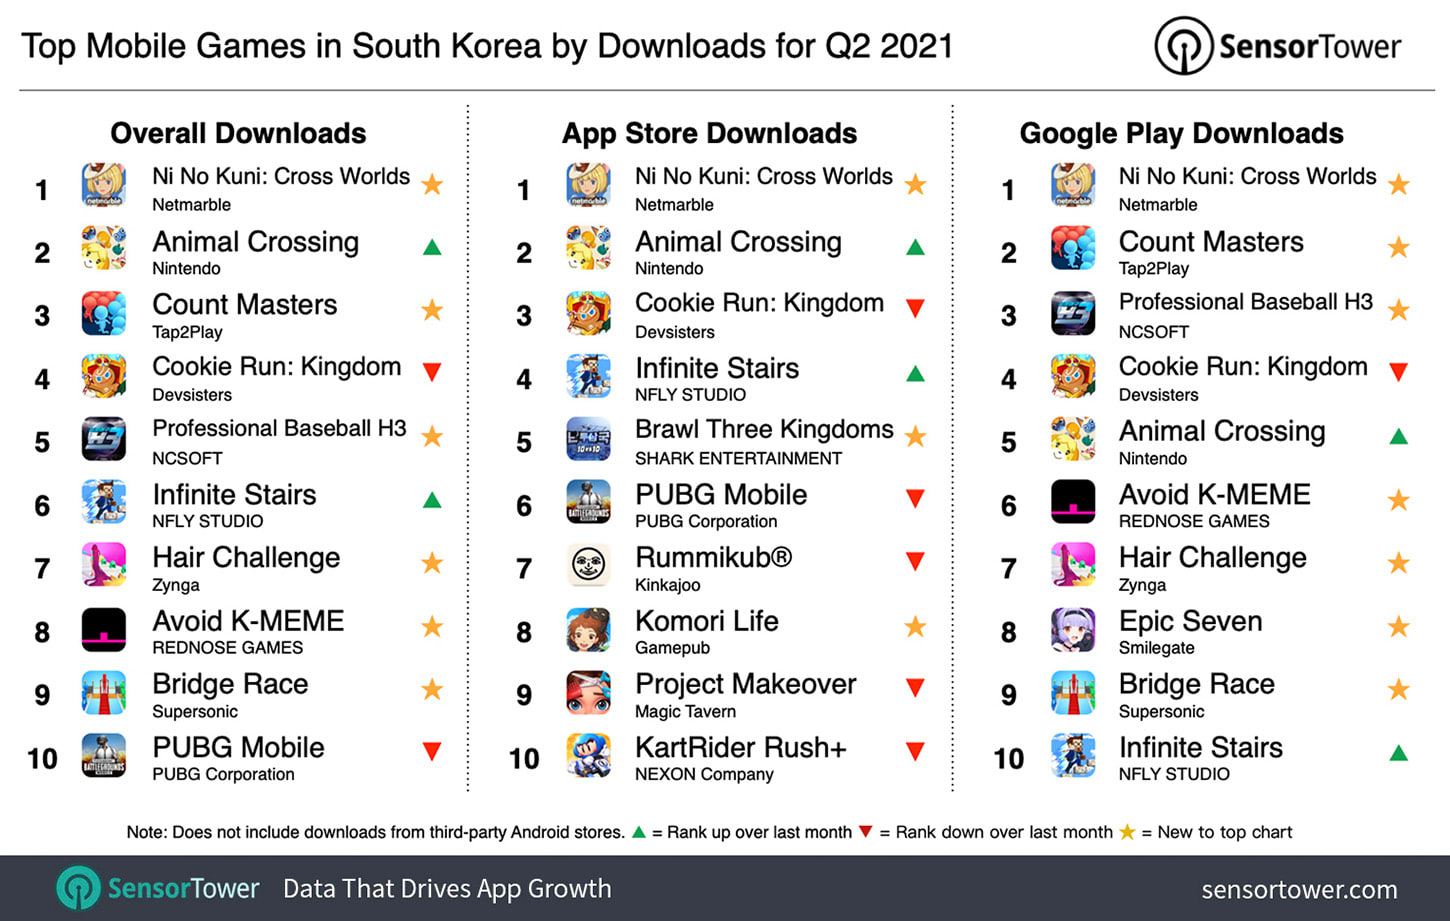
-
Ni No Kuni: Cross Worlds became the most popular game of the second quarter with 1.8M of installs.
-
The second place belongs to Animal Crossing: Pocket Camp from Nintendo with 1.1M of downloads (+330% growth from Q1 2021).
Newzoo: How Gamers consume food and drinks while playing
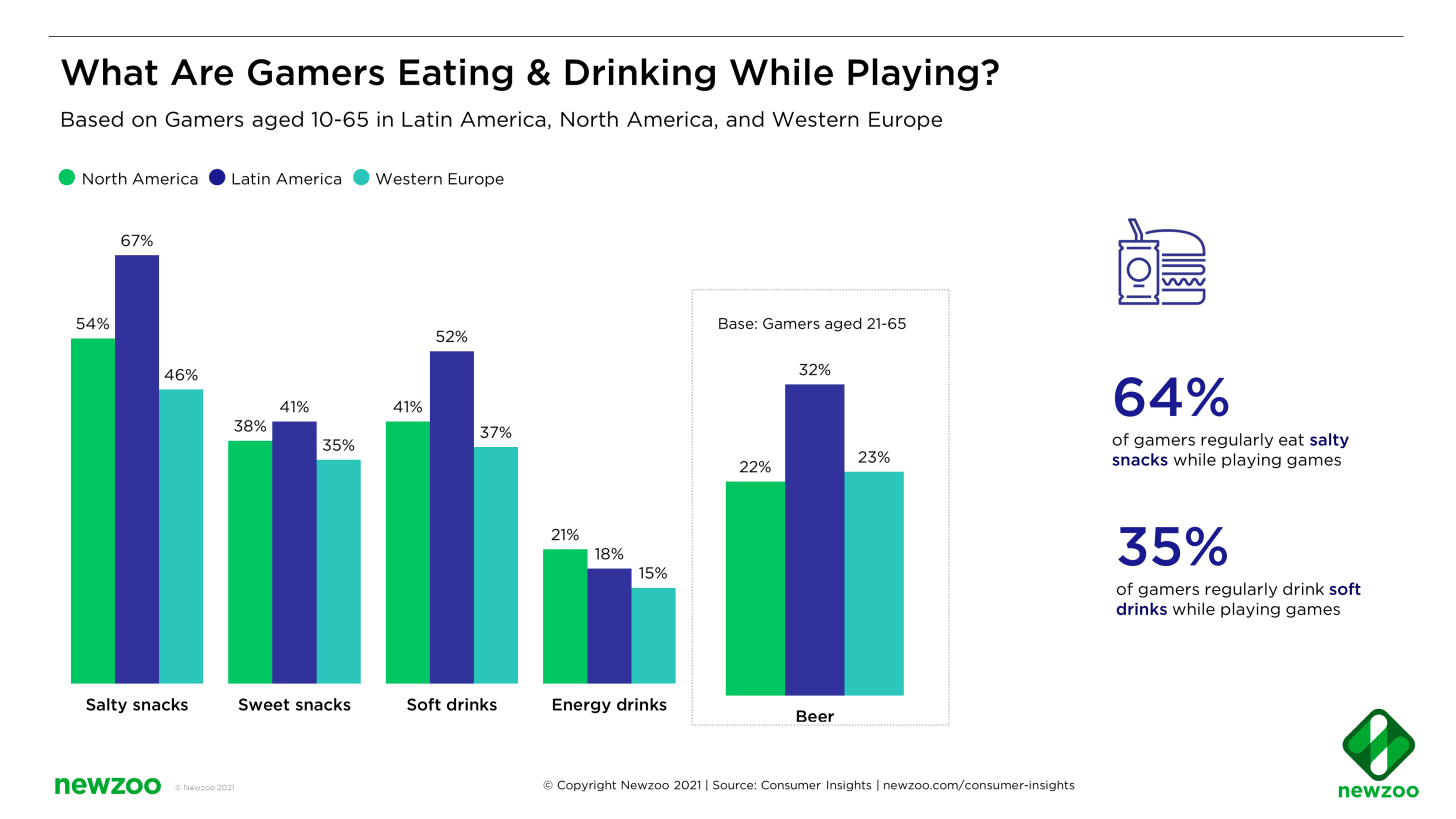
-
81% of all gamers are regularly eating while playing.
-
Among those who are watching gaming videos or streams this percentage is even higher - 92%.
-
64% of players regularly eat salty snacks while playing. 35% drink soft drinks. About 24% from the age of 21 like to drink beer (it’s interesting that in Latin America this percentage is higher - 32%).
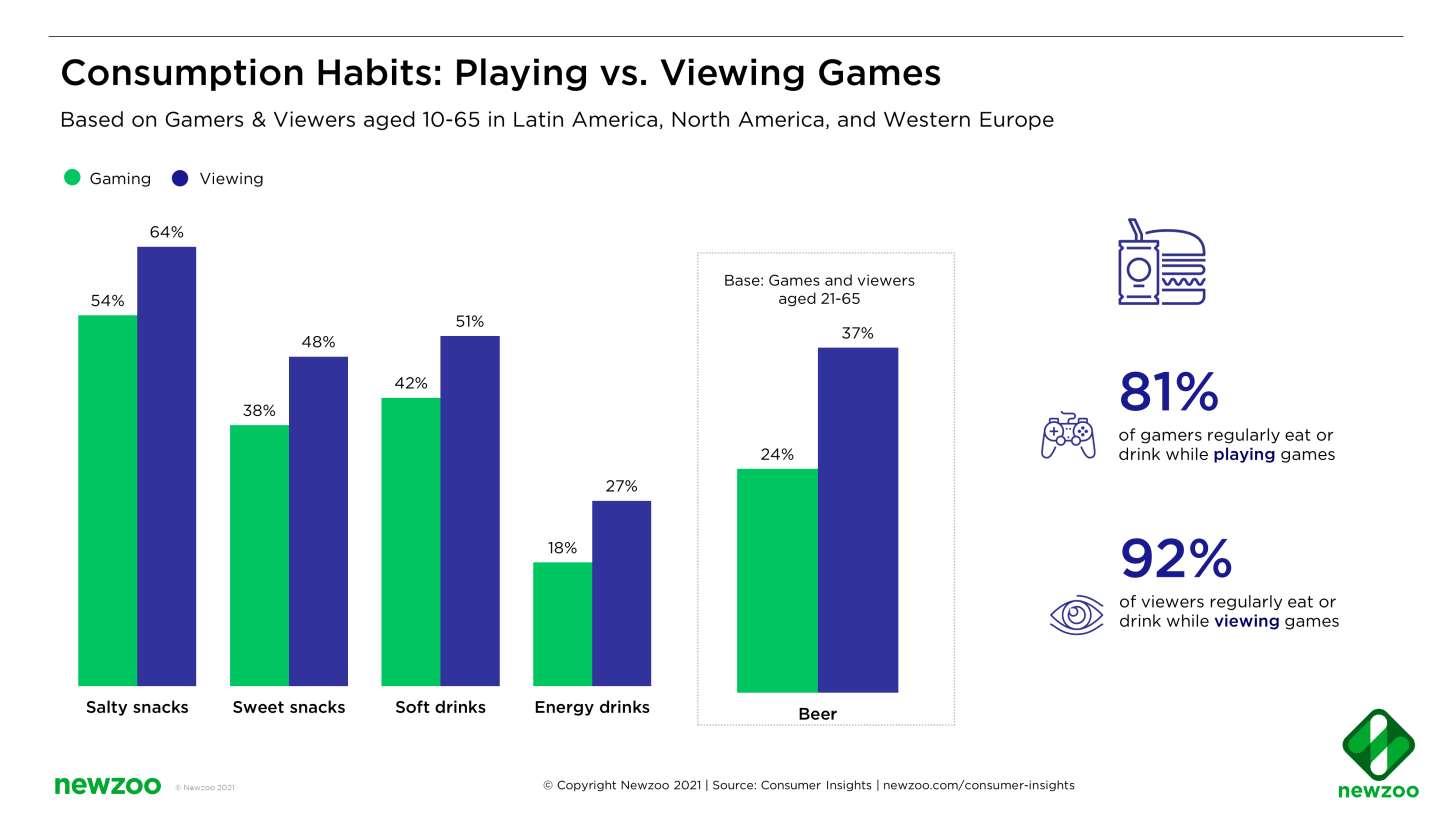
-
Users, in general, tend to consume more food and drinks when watching games, not playing them.
Sensor Tower: Mobile Market Forecast 2021-2025
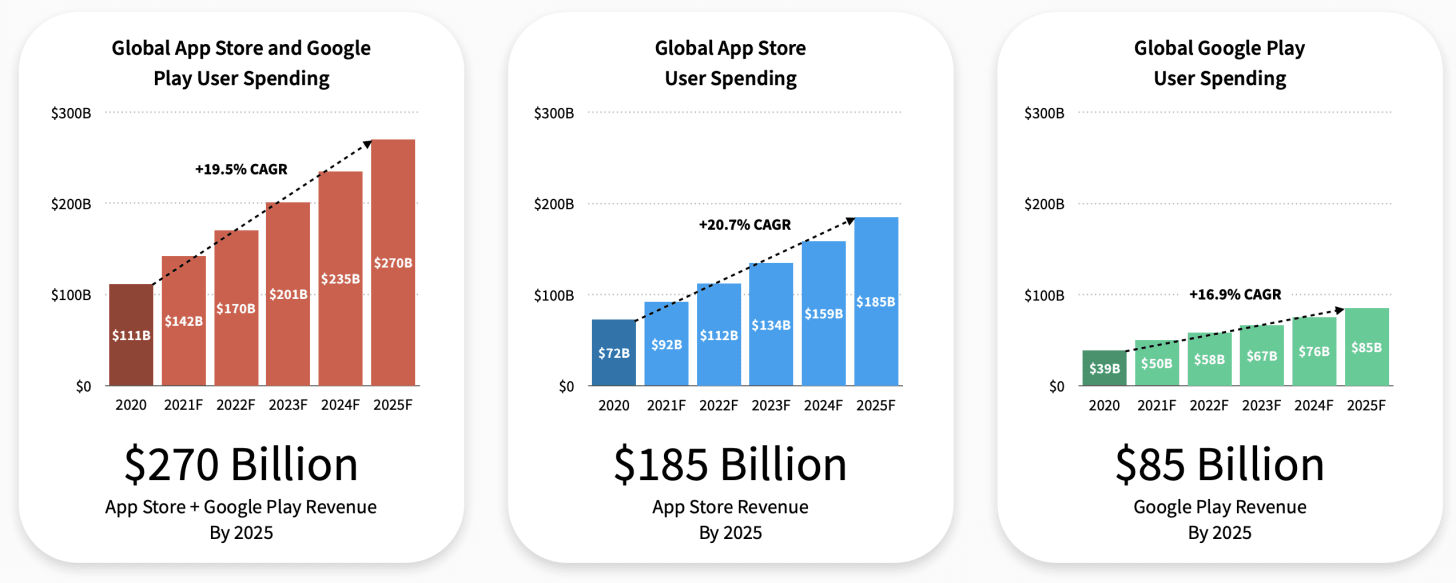
-
Overall user spending on mobile apps will increase from $142B this year to $270B in 2025.
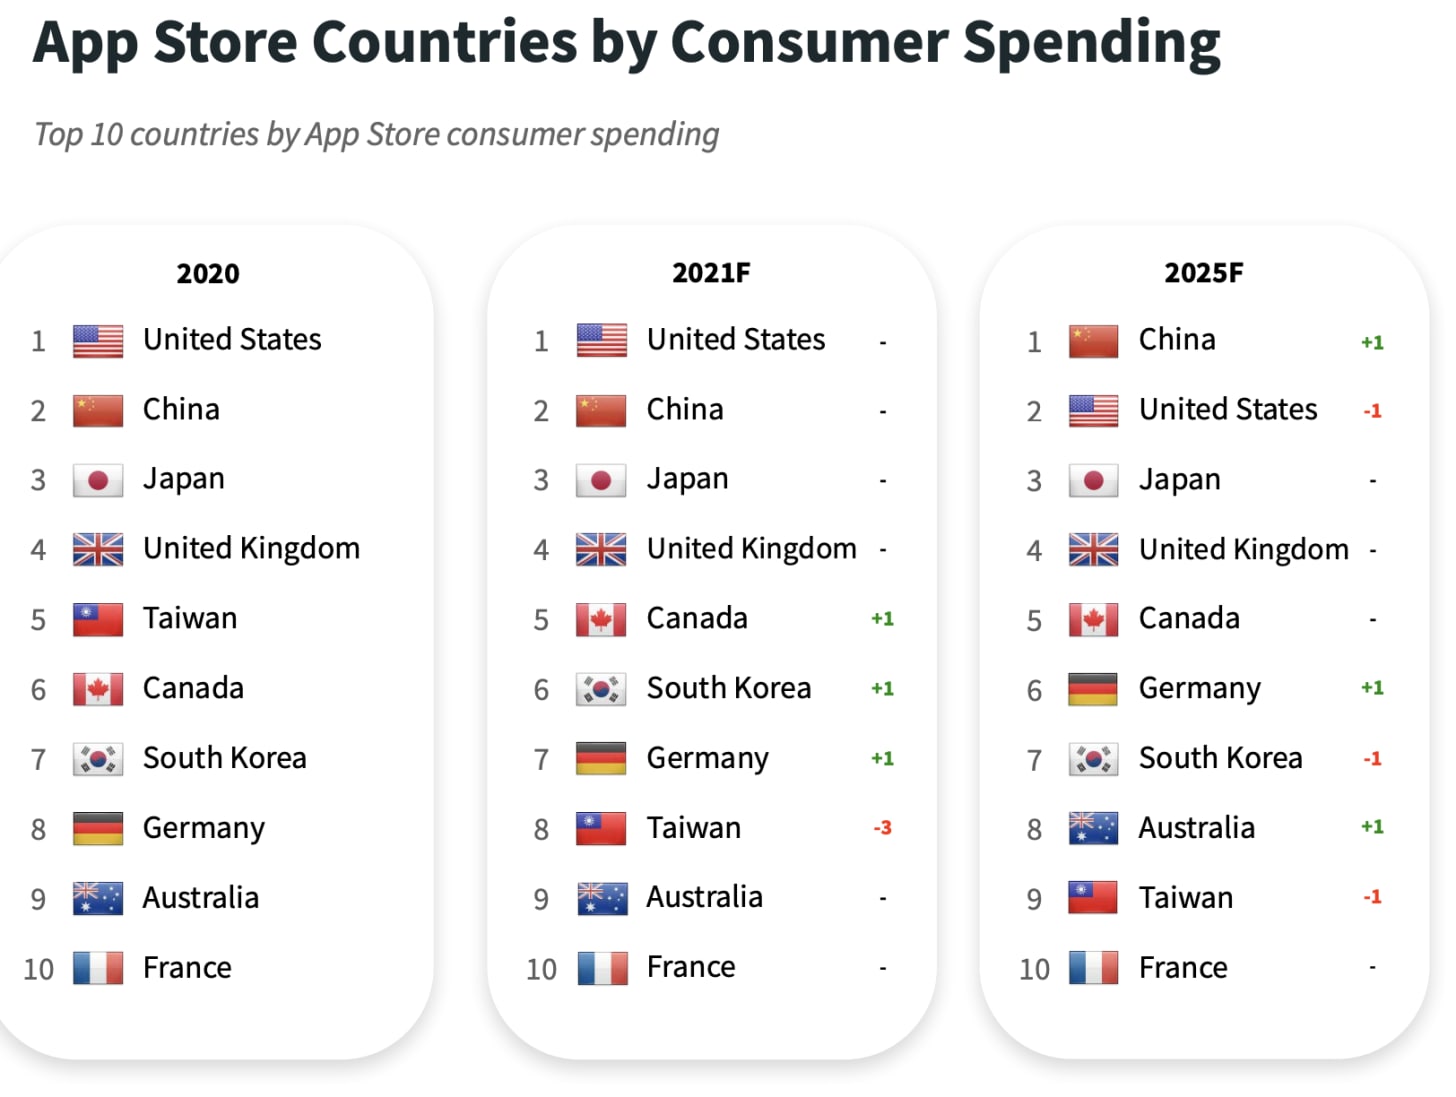
-
App Store gaming revenue will increase from $56B in 2021 to $78B in 2025. The share of gaming apps in overall amount will decrease from 61% now to 42% in 2025.
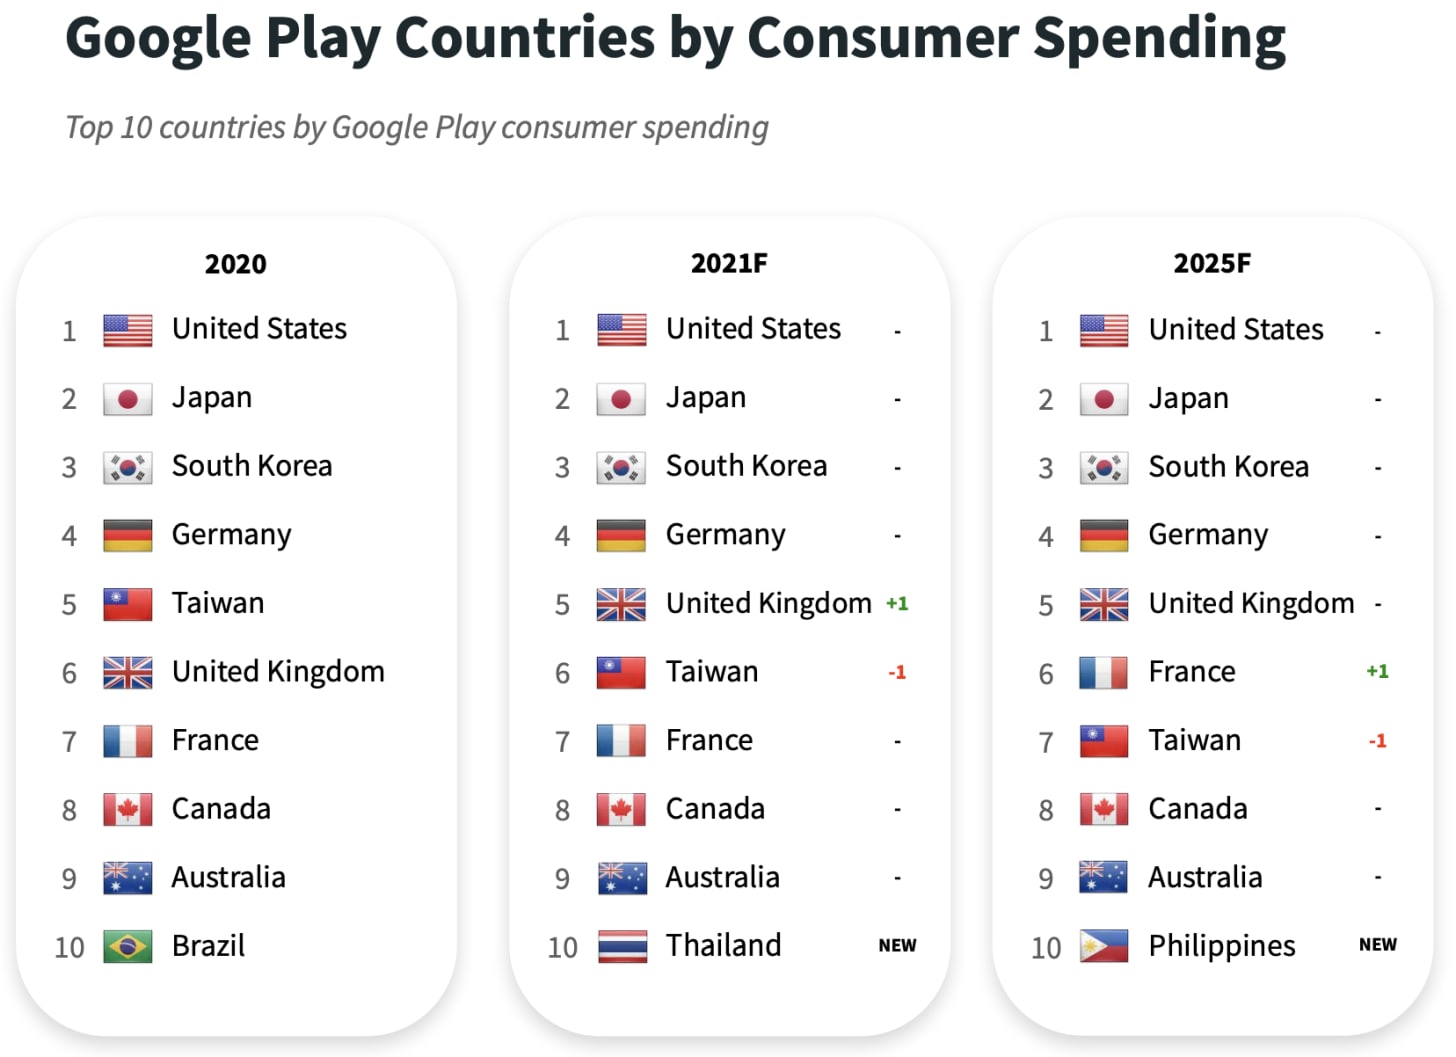
- As for Google Play, the gaming revenue will grow from $40B in 2021 to $60B in 2025. The share will decrease too, from 80% to 71% in 2025, but not as drastically as on the App Store.
-
As for the downloads, both App Store and Google Play will show growth. From 10.5B to 13B in 2025 and from 47B to 66B respectively.
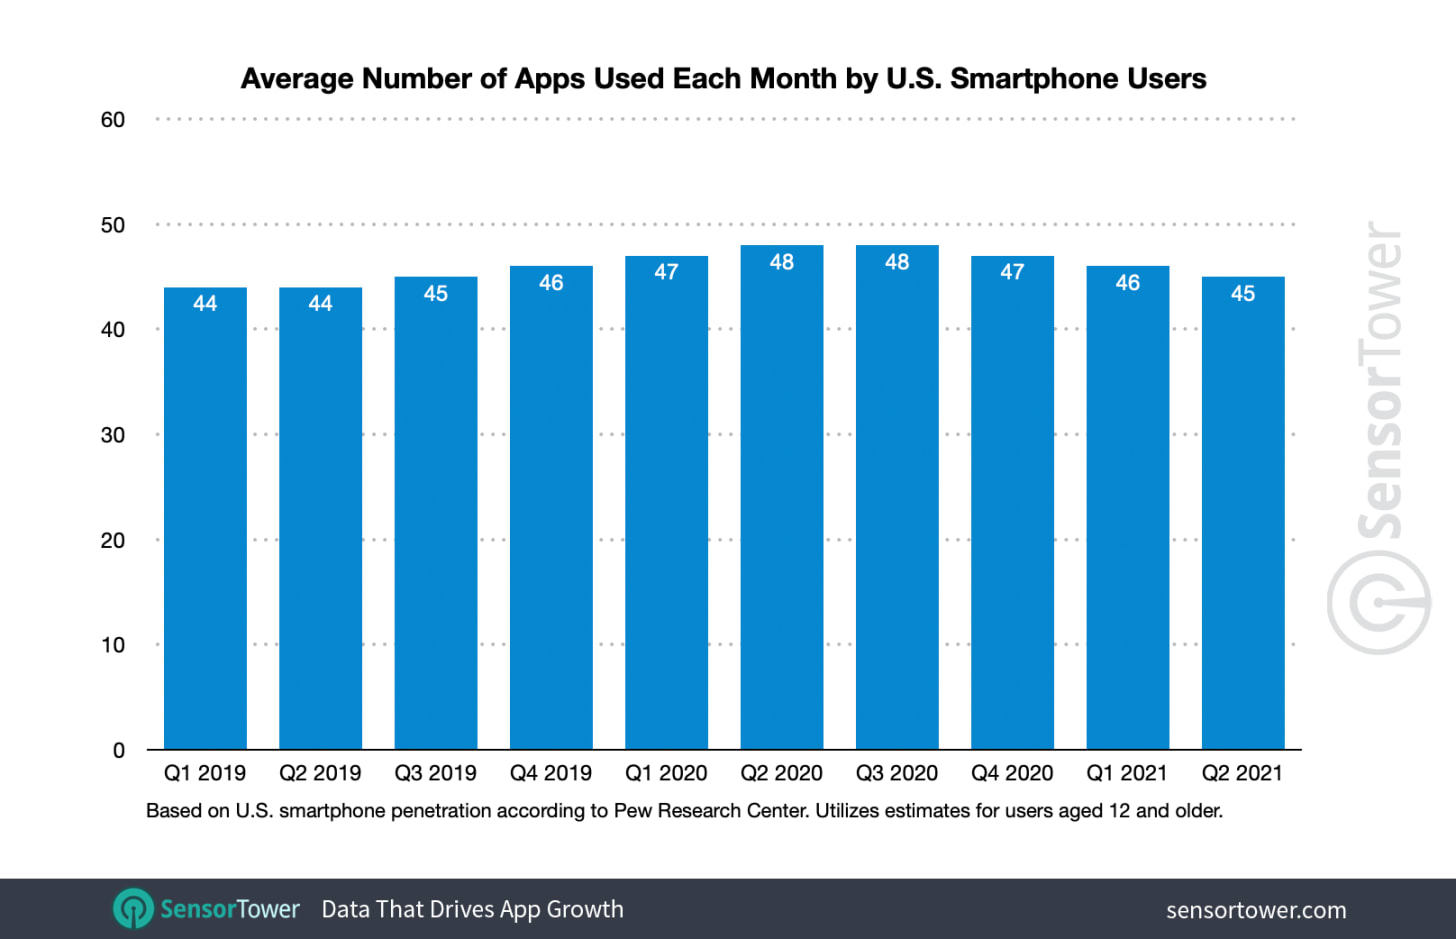
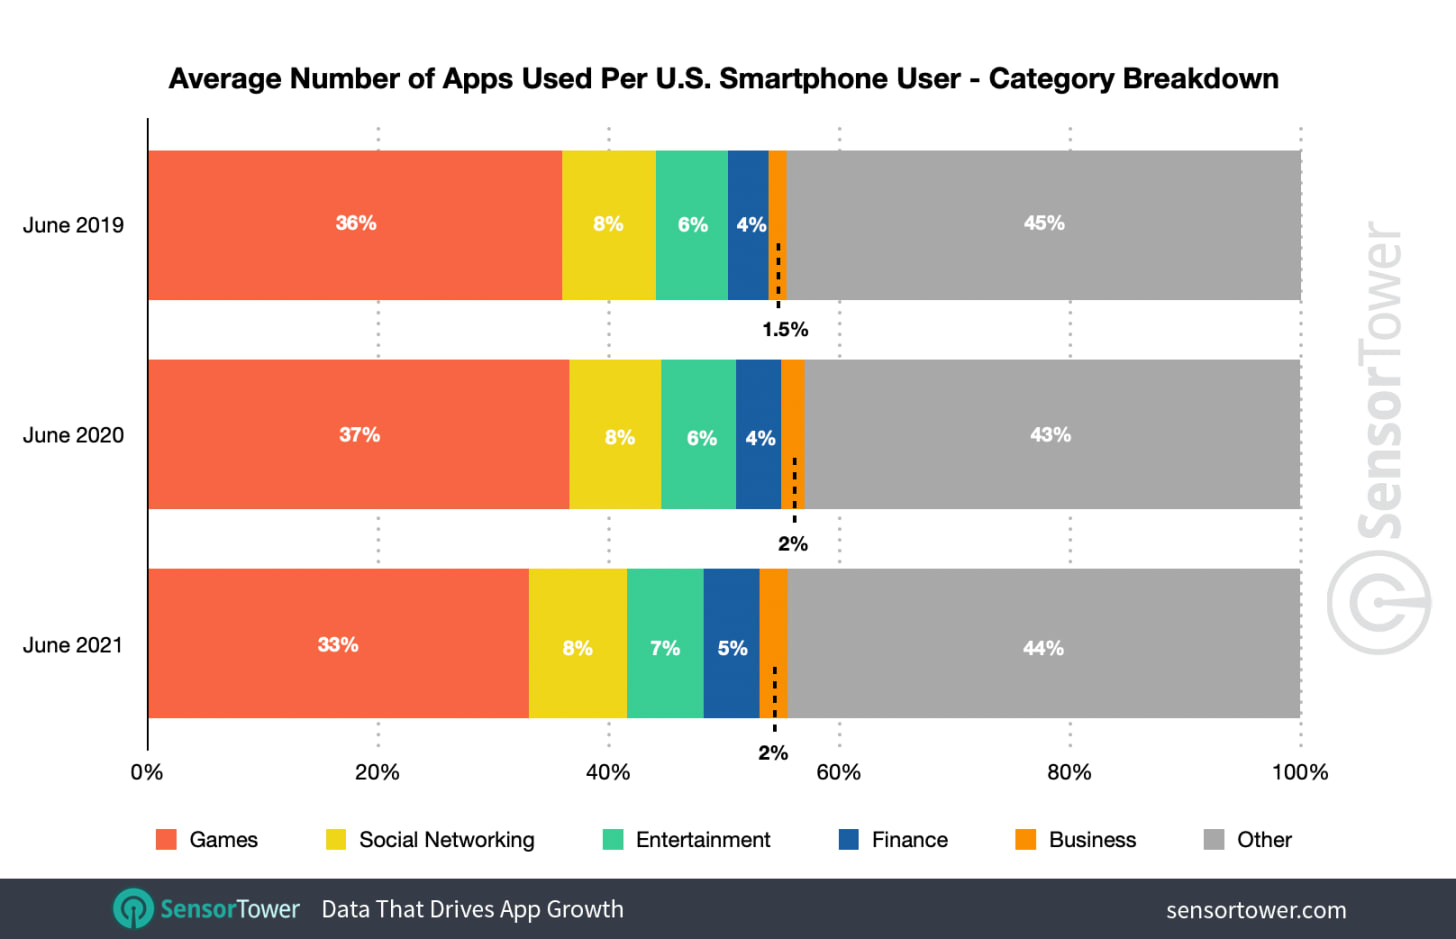
Sensor Tower: US users are using 46 apps per month on average
-
The share of games decreased a little bit from 2019 (36%) and 2020 (37%) resulting in 33% of gaming apps in 2021.
-
Sensor Tower analytics connects this to the releases like Among Us and Genshin Impact. Players have found their favorite games and spend the majority of their time there.
Steam: Participation in Demo Festivals might increase wishlists by 421%

-
About half of projects found out that their wishlists even surpassed the aforementioned number. 45% of projects failed to beat the 421% record. And in 5% of the games wishlists got smaller after participation.
-
Demo Festivals has a lingering effect, which increases wishlists conversion up to 15%.
-
More wishlists - more sales. Demo Festivals participants observed an increase of 292% in sales.
Sensor Tower: State of Mobile Game Advertising 2021 Report
-
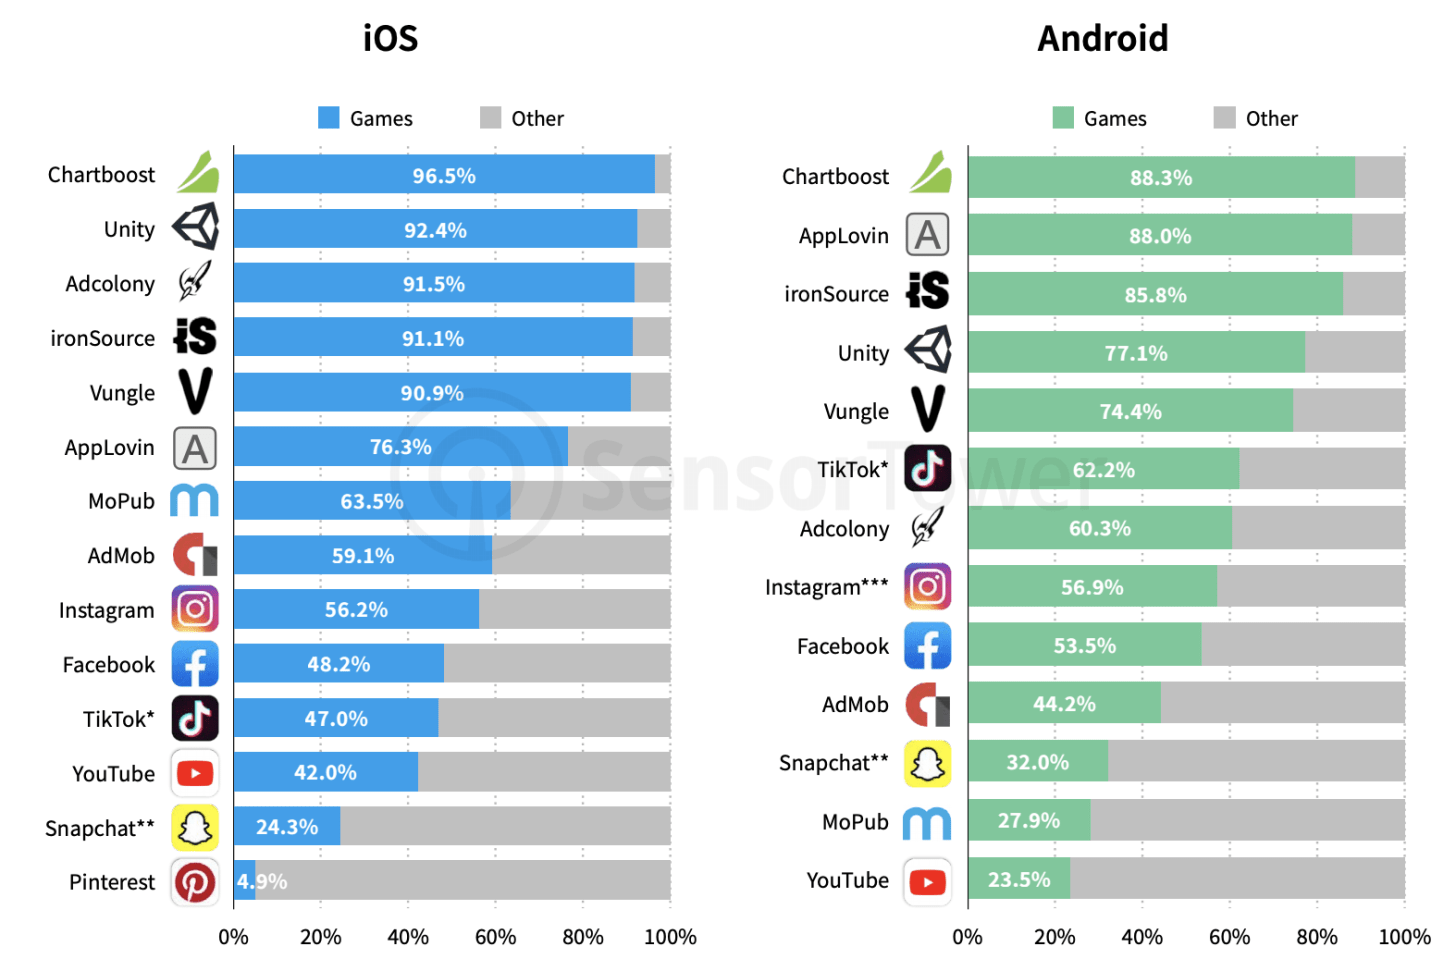
There were five ad networks highly focused on games - Chartboost, Unity, Adcolony, ironSource, and Vungle - each of them has more than 90% share of voice for mobile games (iOS).
-
Video is still the most popular format in mobile games with >50% share from all creatives.
-
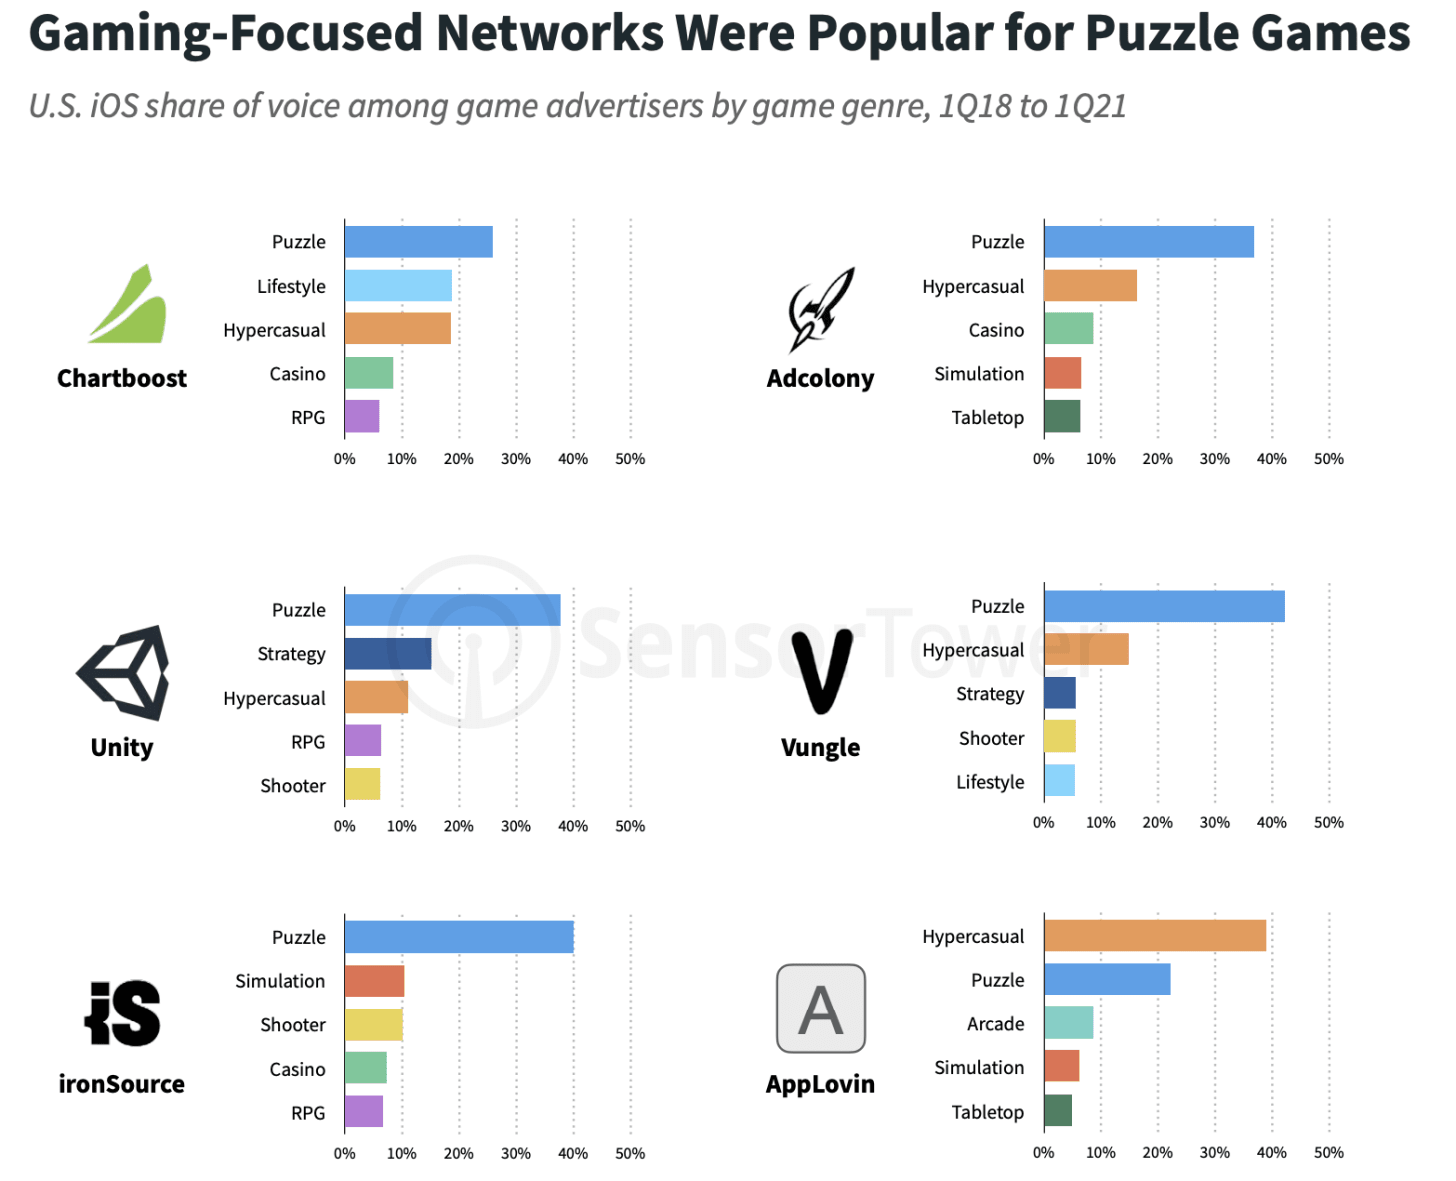
Puzzles are responsible for the lion's share of all UA. The genre is at first place in Chartboost, Adcolony, Unity, Vungle, ironSource, MoPub, Facebook, and AdMob.
4 US Ad Creatives trends:
-
Fake playable ads.
-
Relaxing music videos.
-
Playable ads for mid-core games.
-
Real-world conversations videos.
Link to the full version of the report.
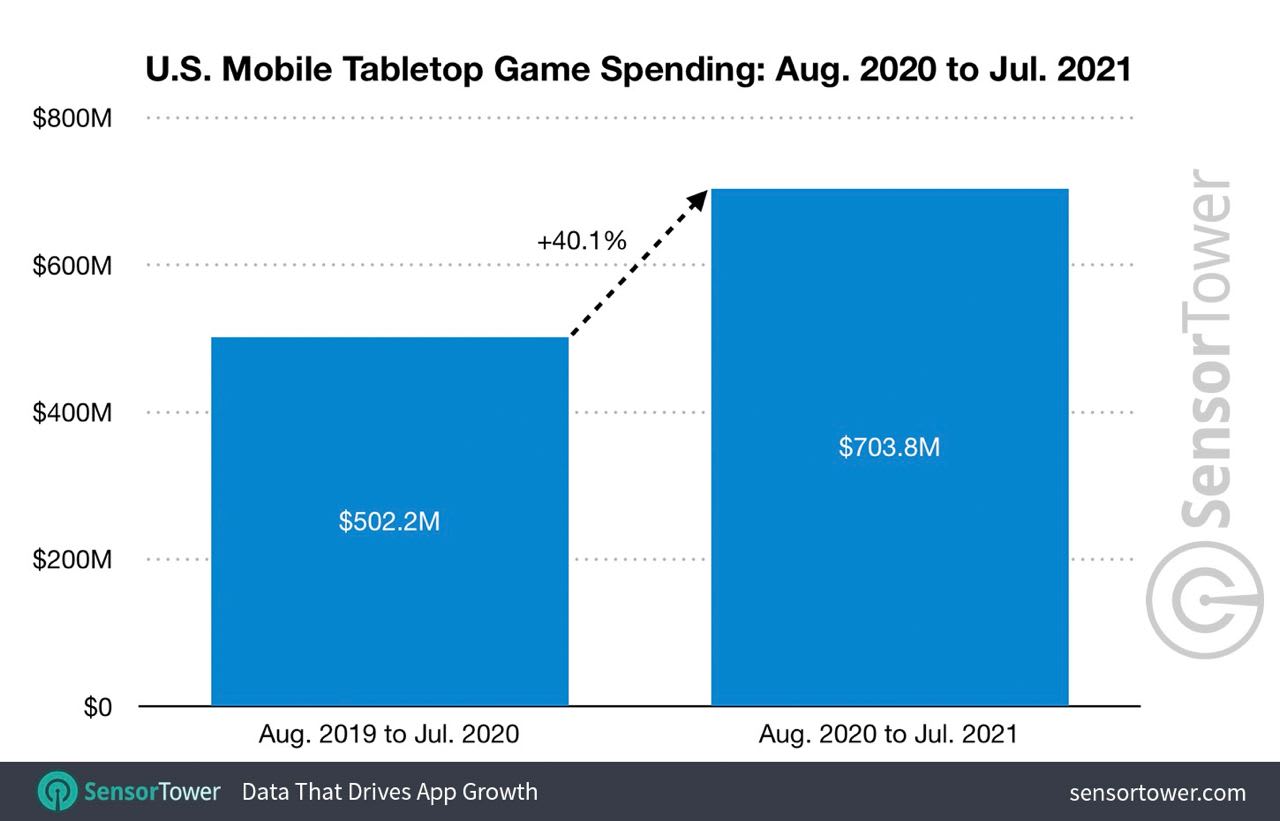
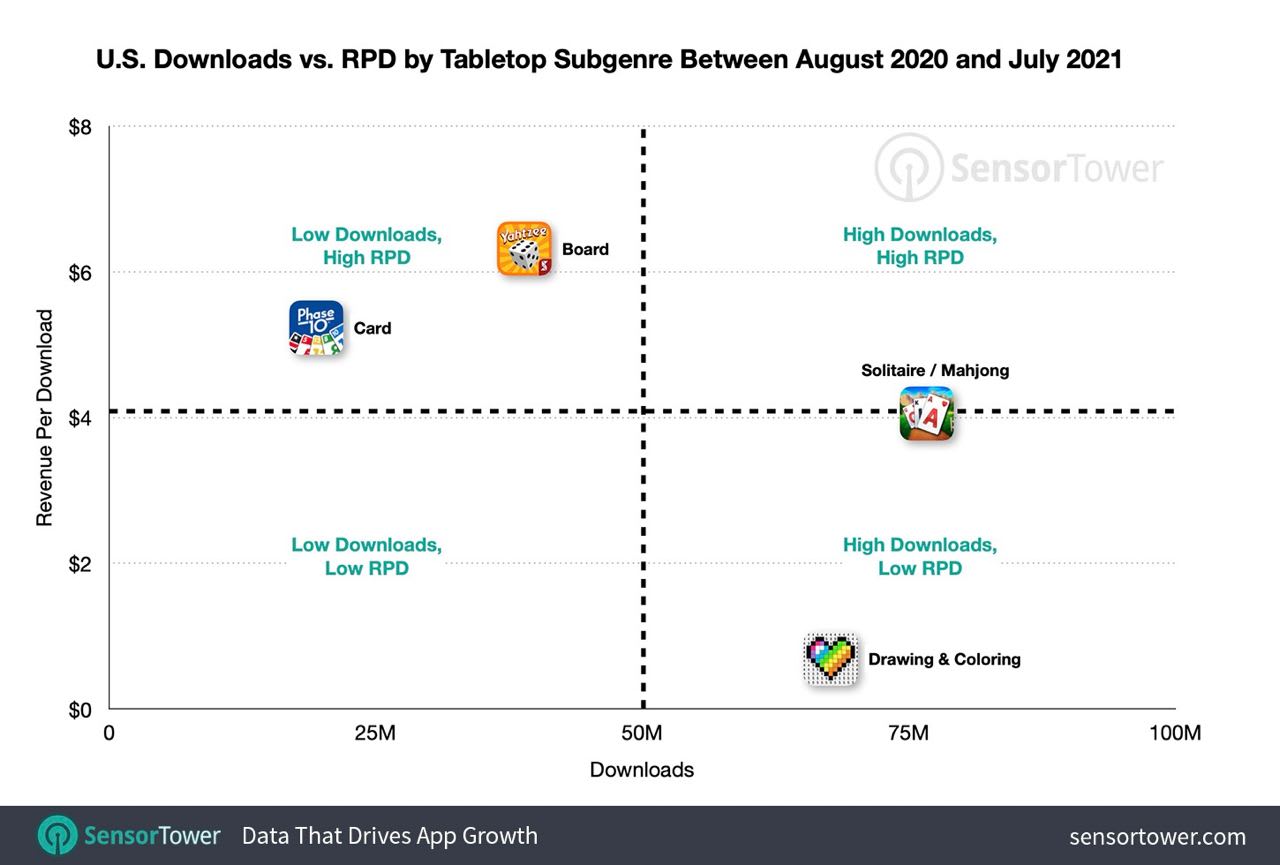
Sensor Tower: Tabletop games Revenue in the US increased by 40% last year
-
Genre revenue reached $703.8 million.
-
Solitaire Grand Harvest is on top by revenue ($115.3M), Solitaire TriPeaks (GSN) is second, and Yahtzee with Buddies Dice (Scopely) is third.
-
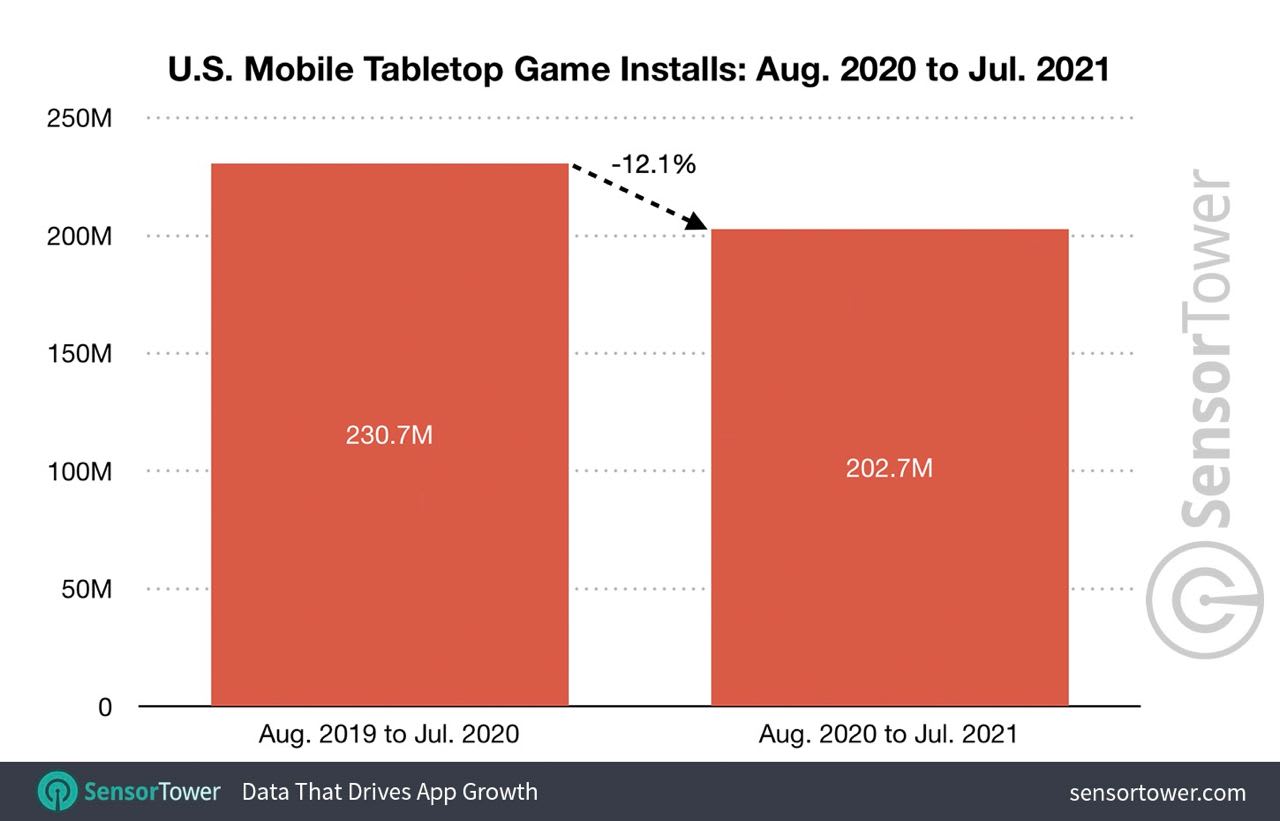
The genre generated 202.7M downloads last year - it’s 12.1% less than the year before.
-
Happy Color from X-Flow is the top project by downloads with 8.3M.
-
When we’re talking about subcategories, solitaire\mahjong - is the main revenue driver of the genre. It’s responsible for $310M (44% of the entire genre) of revenue and 76.8M downloads (about 37%).
Clash Royale earned record revenue in the last 2 years in June

-
The project received $42.5 million from both App Store and Google Play. It’s 2 times more than a year before.
-
Clash Royale showed the best month by downloads - 5.5 million times. It’s the best number from September 2020.
-
The last time the game earned more was only in July 2019. Its revenue was $46M back then.
-
An increase in revenue is connected with “magic items” implementation in March 2021.
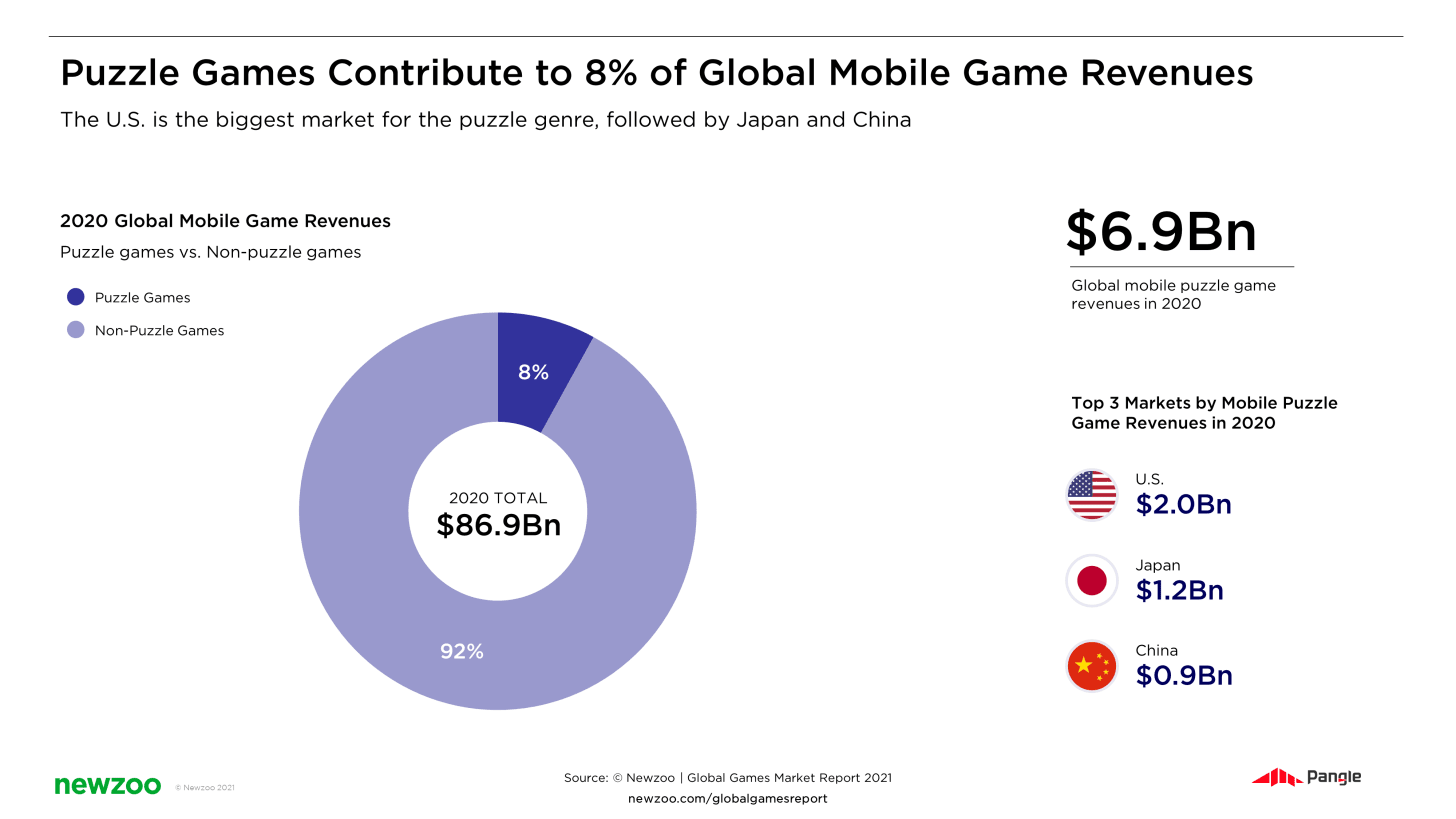
Newzoo & Pangle: Puzzle Games Report
-
In 2020 the puzzle genre earned $6.9B in revenue. It’s 8% of the overall income of the mobile gaming market.
-
The majority of money ($2B) came from the US. Japan is second with $1.2B and China is third with $0.9B. Cumulatively, those 3 countries are responsible for more than 50% of genre revenue.
-
Puzzle Games were one of the first to try hybrid monetization with in-apps, ads, and subscriptions mix.
-
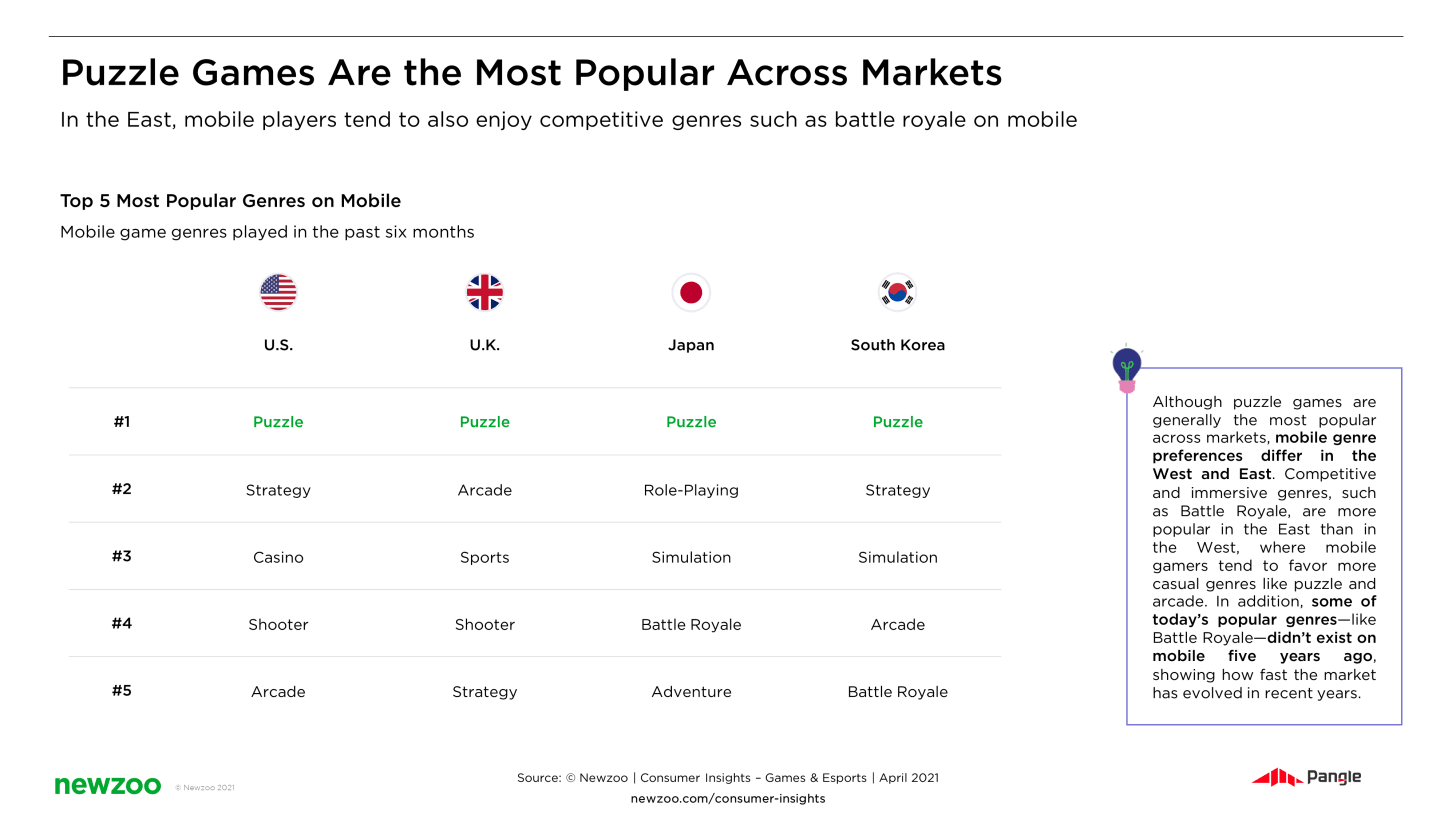
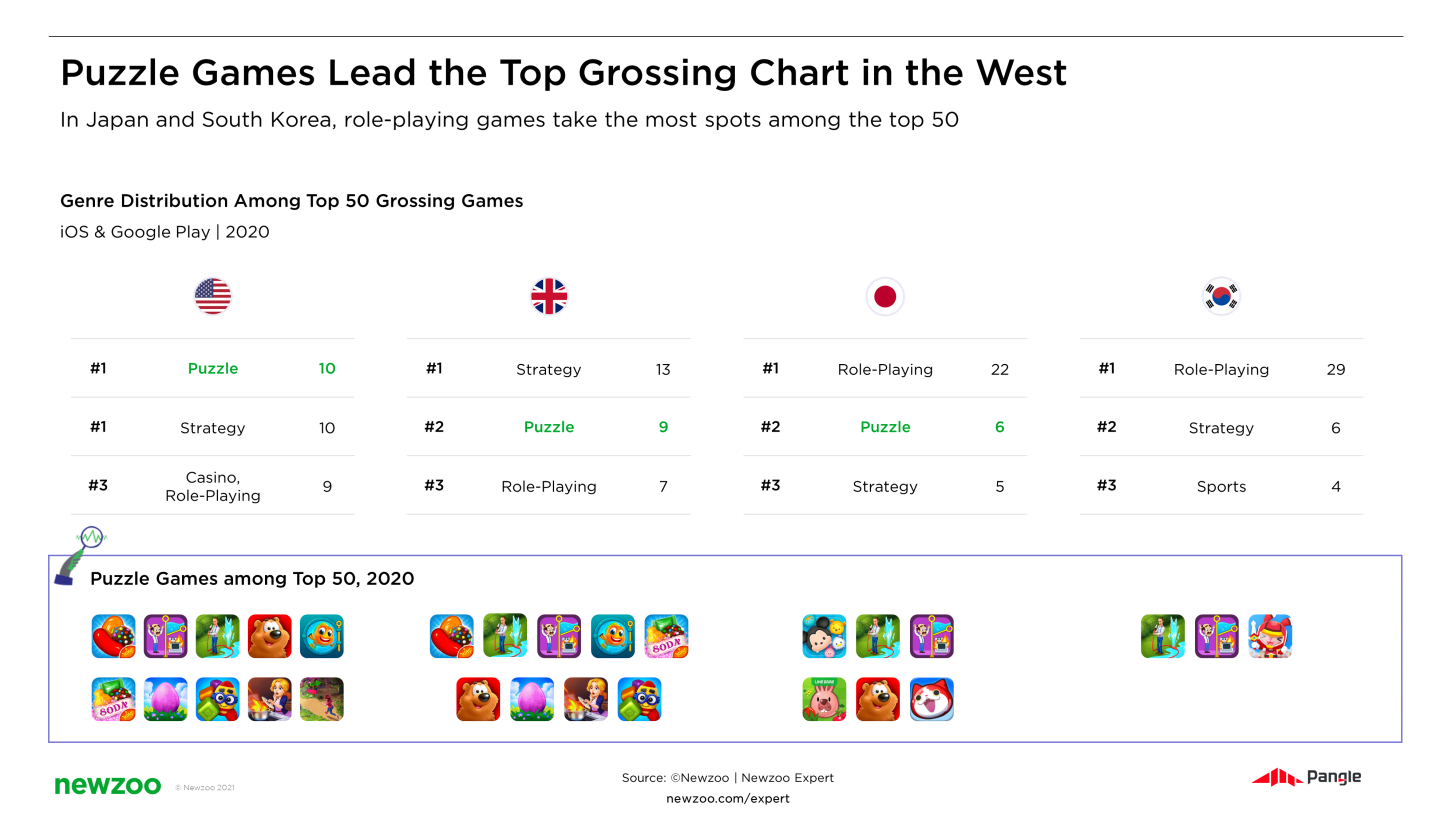
Puzzle Games is the first genre by popularity in the US, Great Britain, Japan, and South Korea.
- In the US the Puzzle genre has the same amount of Top Grossing games (10) as the Strategy genre.
-
Women play Puzzle games more often. The closest to equality situation is in South Korea, where 48% of the Puzzle audience are male.
-
It’s one of the few titles, where western developers perform much better than eastern. Even in the Asian markets.
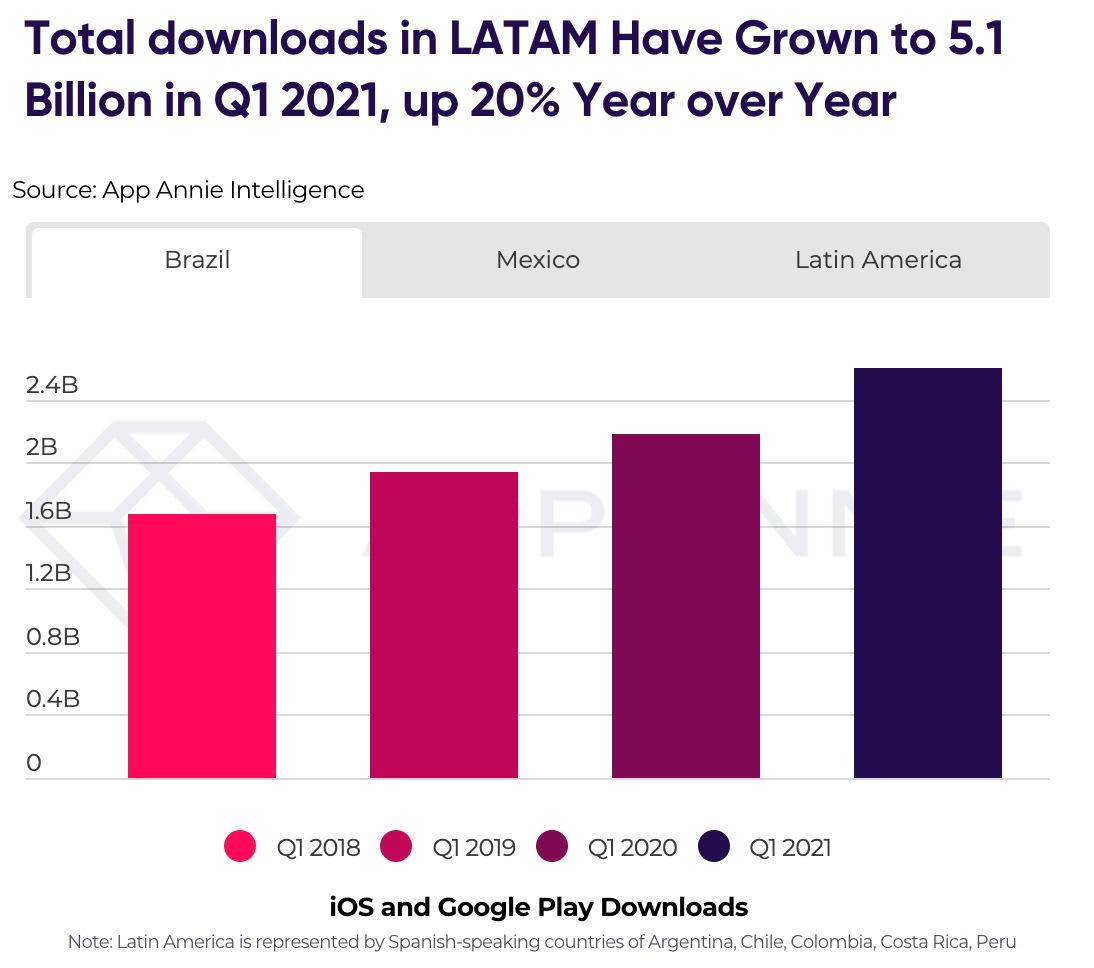
App Annie & AppsFlyer: State of App Marketing in Latin America 2021
-
The number of downloads in Latin America reached 5.1B in Q1 2021 and showed a 20% YoY growth.
-
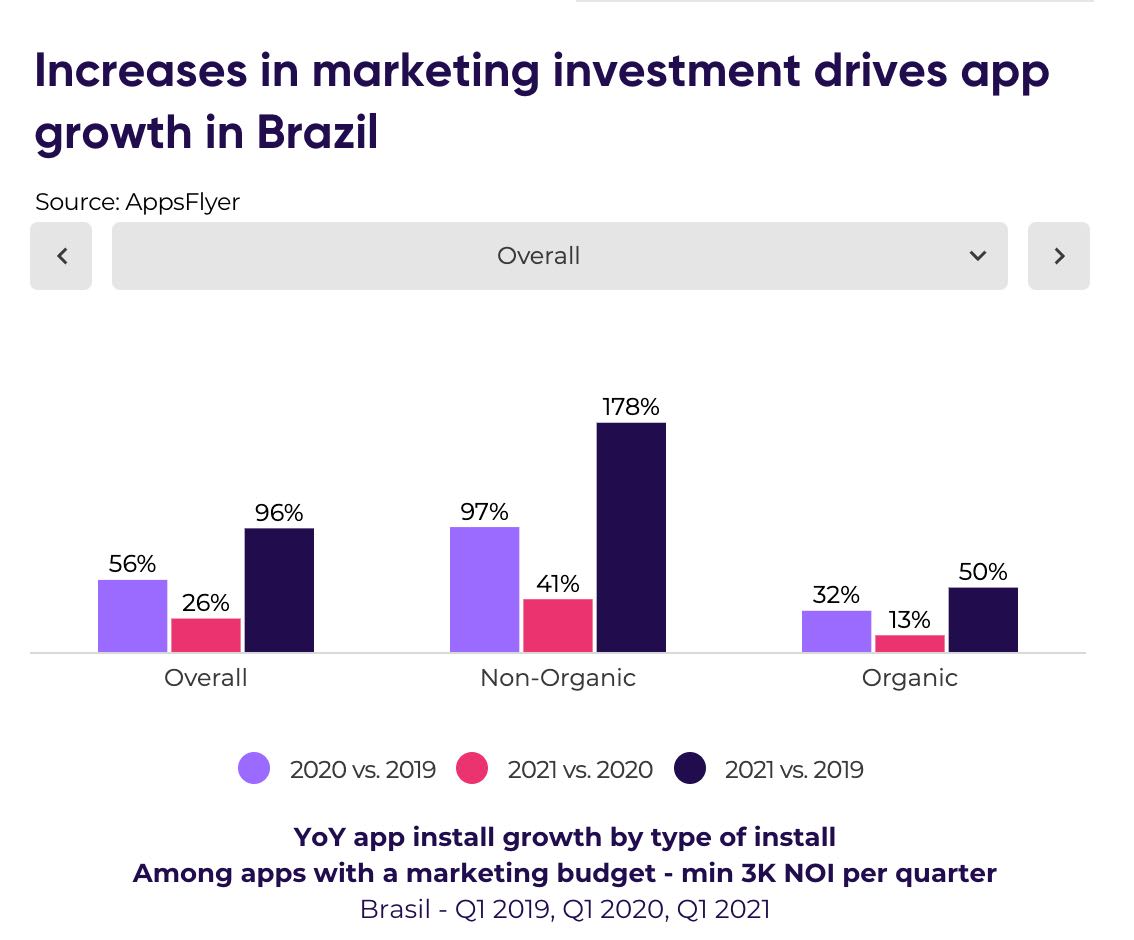
The amount of paid traffic in Brazil increased by 41% compared to 2020 and by 178% compared to 2019. Mexico is just behind with 48% growth to 2020 and 120% to 2020.
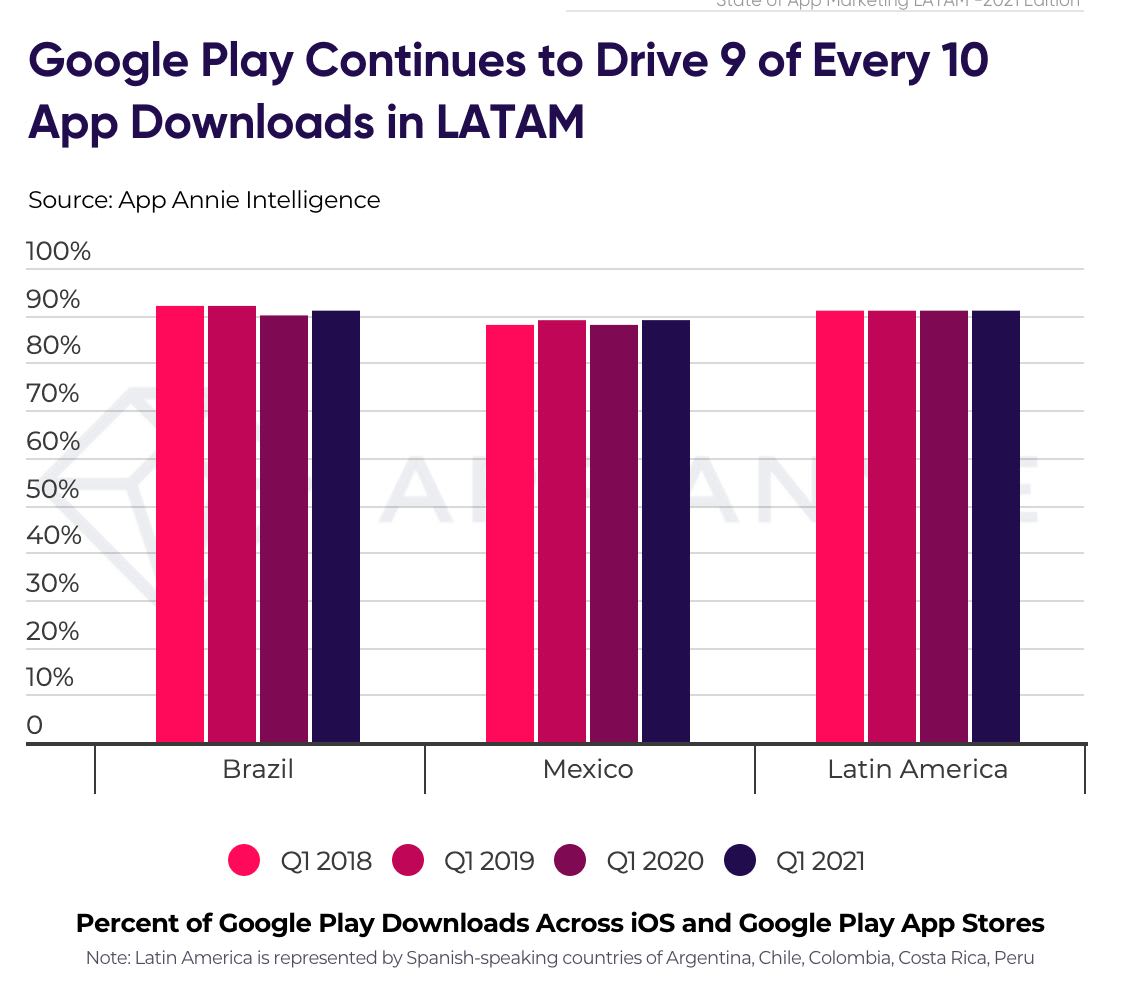
- Google Play is responsible for 9 out of 10 downloads in the region.
-
In Brazil and Mexico in Q1 2021 the amount of both paid and organic traffic decreased slightly.
- Coin Master, Garena Free Fire, and Lords Mobile are the three Top Grossing games in LATAM in Q1 2021.
-
In Brazil, in Q1 2021 the amount of in-app purchases in games increased by 64%.
-
On average, the number of paying users in Latin America increased by 32% in 2020.
Top 10% of games in the region has the following Retention numbers:
-
D1 - 37%
-
D3 - 18,95%
-
D7 - 11,69%
-
D14 - 7,47%
-
D30 - 4,3%
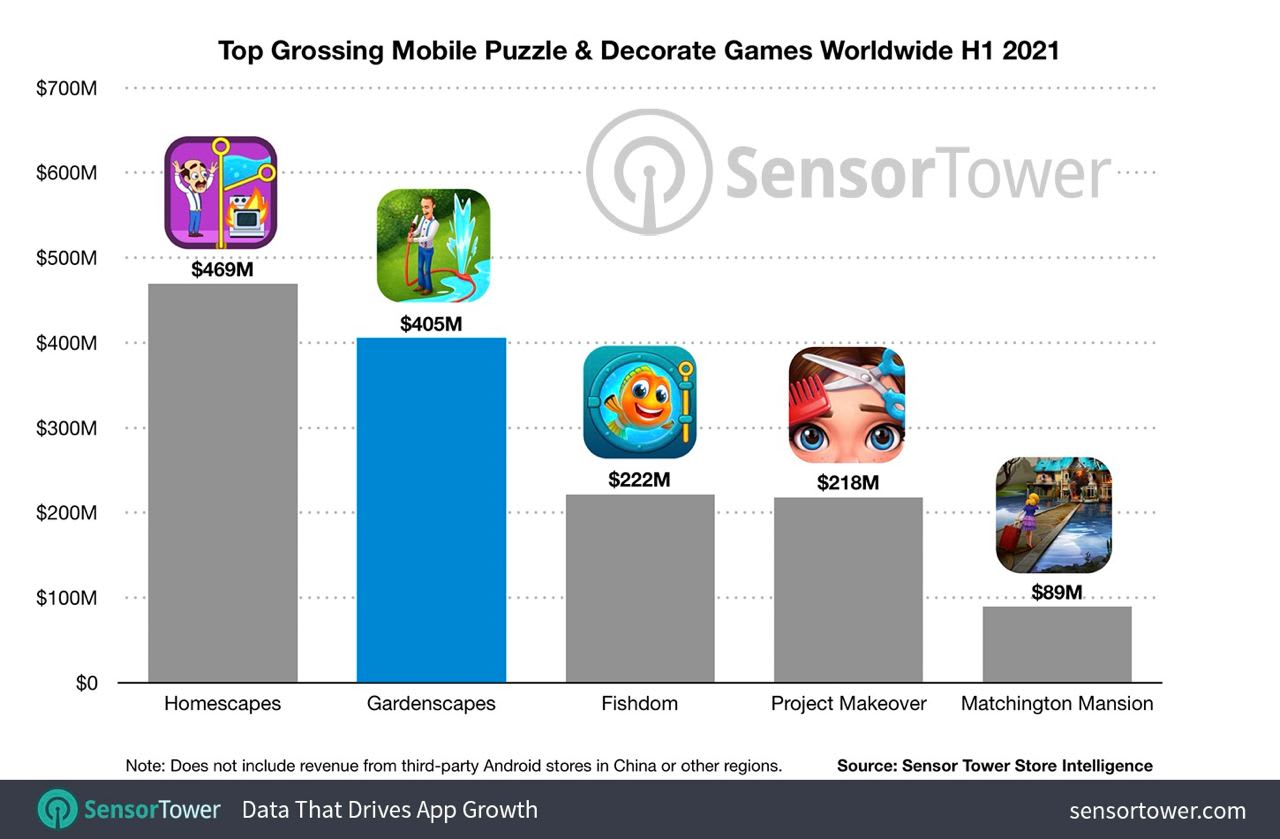
Sensor Tower: Gardenscapes Revenue passed $3 billion
-
H1 2021 brought Gardenscapes $405M, which is less than Homescapes ($469M), but more than Fishdom ($222M). Interesting, that all three games were released by Playrix.
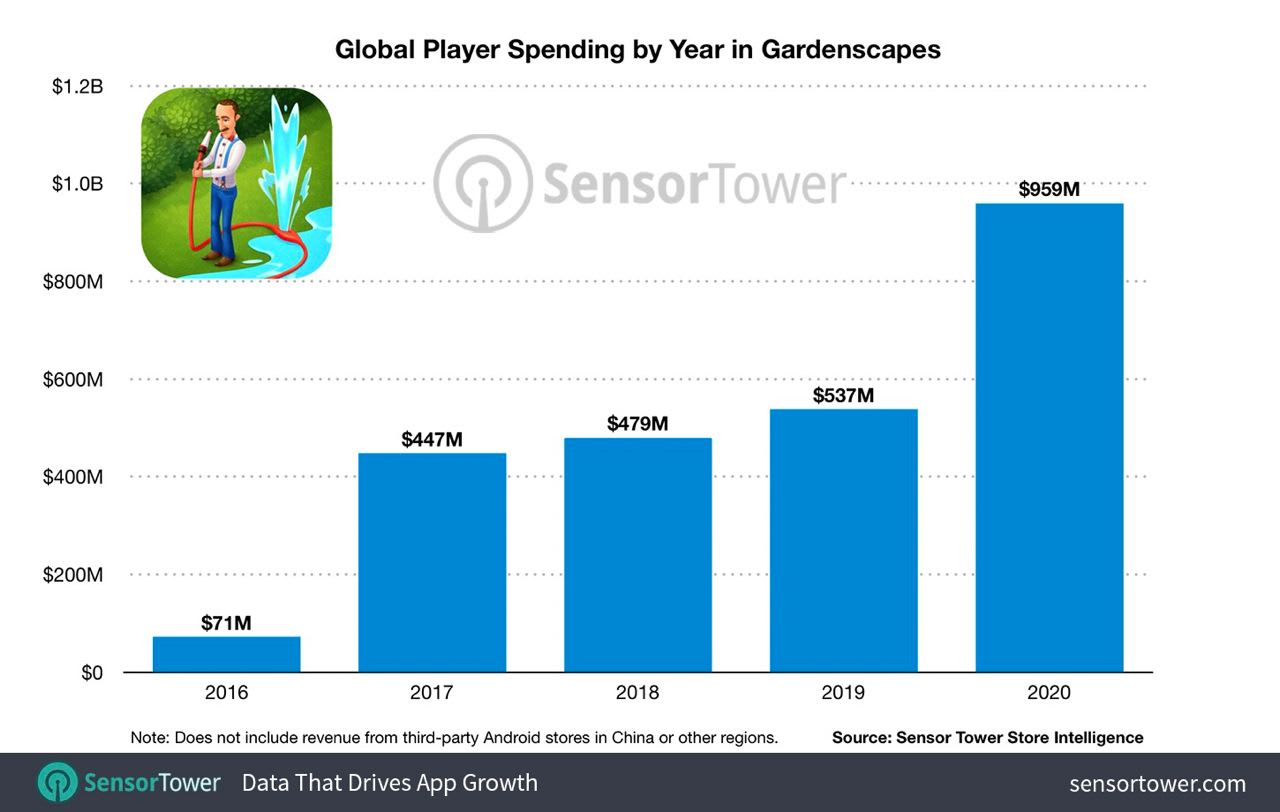
- 2020 was the most lucrative year for Gardenscapes with $959M of revenue. It’s 78% higher than in 2019.
-
The US is responsible for the major part of the share (37%) - $1.1 billion. Japan is second, Germany is third, China is fourth.
-
The distribution of revenue between platforms is almost equal. 50.2% comes from App Store and 49,8% - from Google Play.
App Annie: Hypercasual downloads increased by 15% in Q2 2021

-
Bridge Race from Supersonic was the main game of the quarter.
-
The Action subgenre of hypercasual games showed the highest growth - 35%. Analytics are connecting such results with solid Join Clash 3D performance.
ISFE: European Gaming market earned €23.3 billion in 2020

-
It’s 22% higher than in 2019. An increase from 2018 to 2019 was only 3%.
-
44% of the earned sum came from the console revenue. Mobile devices are responsible for 40% of the share, 14% were generated by the PC market. The remaining 2% came from streaming platforms.
-
Despite the small share, streaming services grew from €341M in 2019 to €397M in 2020 showing a 16.5% increase.
-
40% of revenue came from digital sales, 40% - from the app and in-app purchases. The other 20% are box games sales.
-
The digital game market in Europe in 2020 was evaluated at €14 billion - it’s 31% more than a year before.
-
The cybersport will beat the €1B mark in 2021. In 2020 it was valued at €947M.
-
86,953 people worked in the European gaming industry in 2019. It’s an increase from 77,916 in 2018. Only 20% of employees are women.
-
Top hits of the 2020 year are FIFA 21, Grand Theft Auto V, FIFA 20, Call of Duty: Black Ops Cold War, and Animal Crossing New Horizons
Newzoo: Global Cloud Gaming Report 2021 - briefly
-
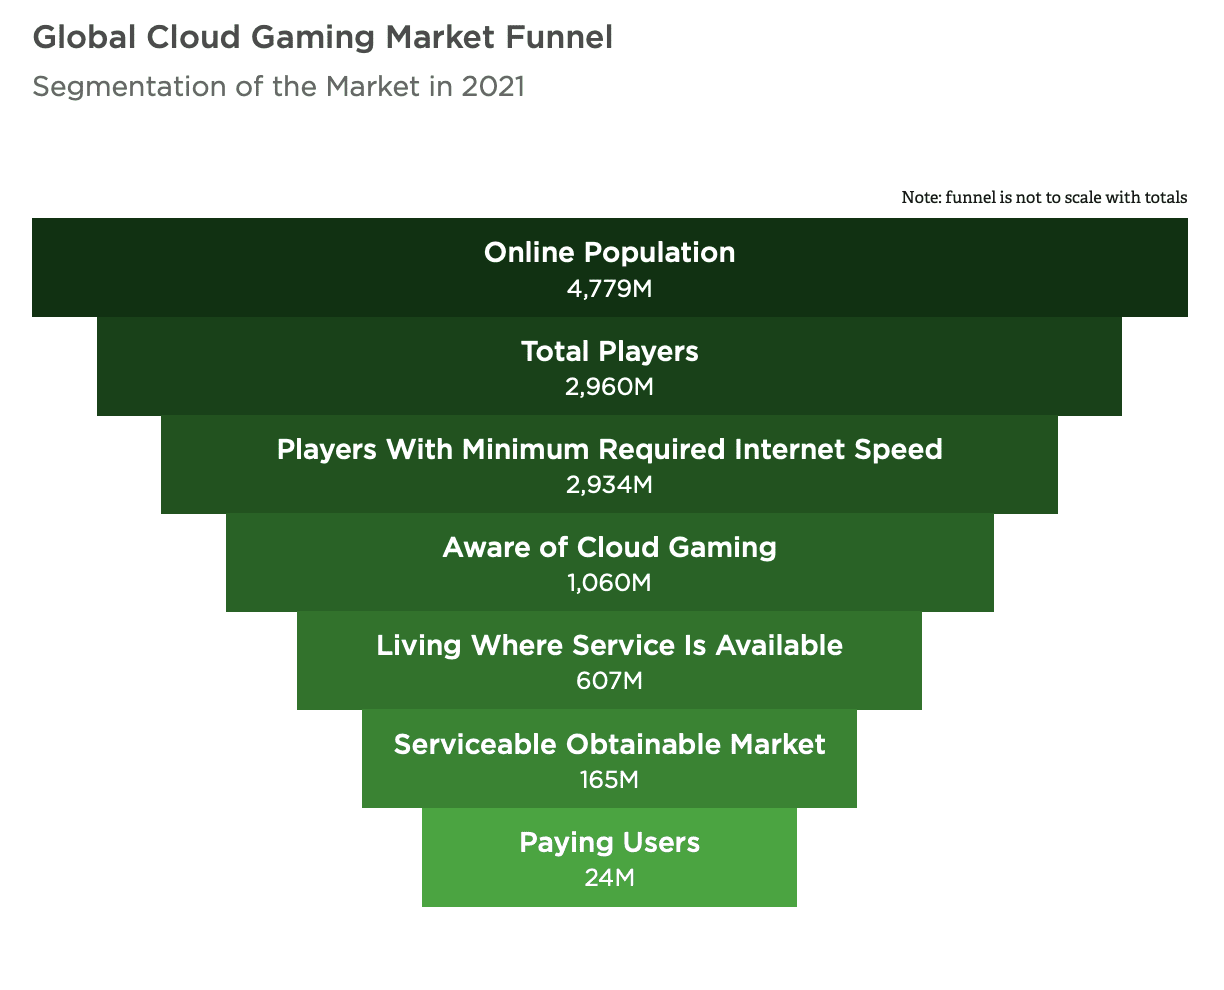
The number of paying users in the cloud gaming services in 2021 will reach 24M users.
-
There are 607M users living in places where such services are available. However, Newzoo analytics estimates the serviceable obtainable market as 165M users in 2021. This number will grow to 309.5M in 2024.
-
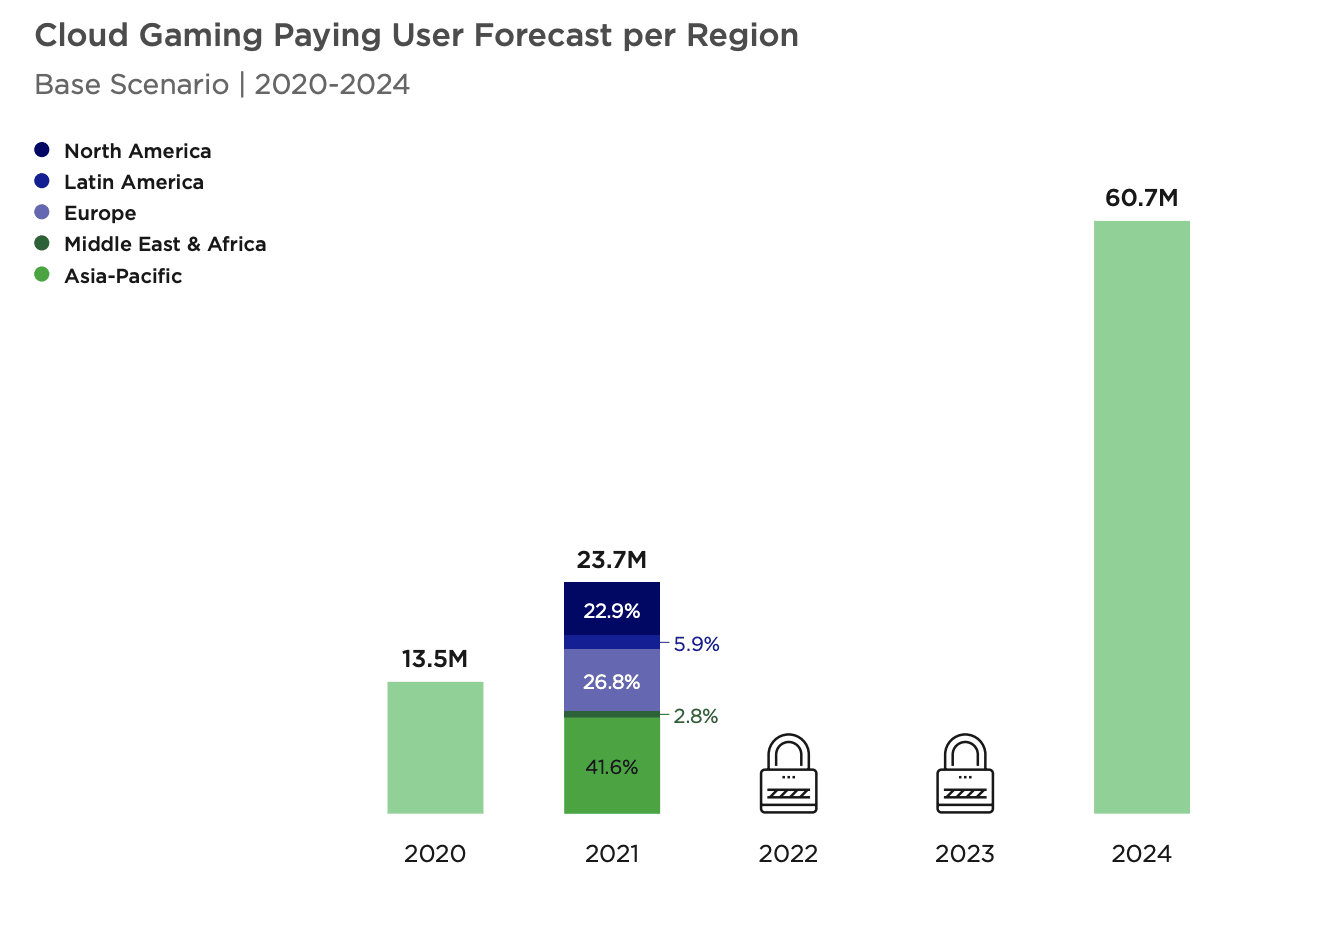
In 2024 the number of paying users will increase almost by 3 times - to 60.7M users.
- This year the cloud gaming market will reach $1.57B of revenue. By 2024 it is supposed to grow to $6.53 billion. Currently, China is leading in terms of revenue.
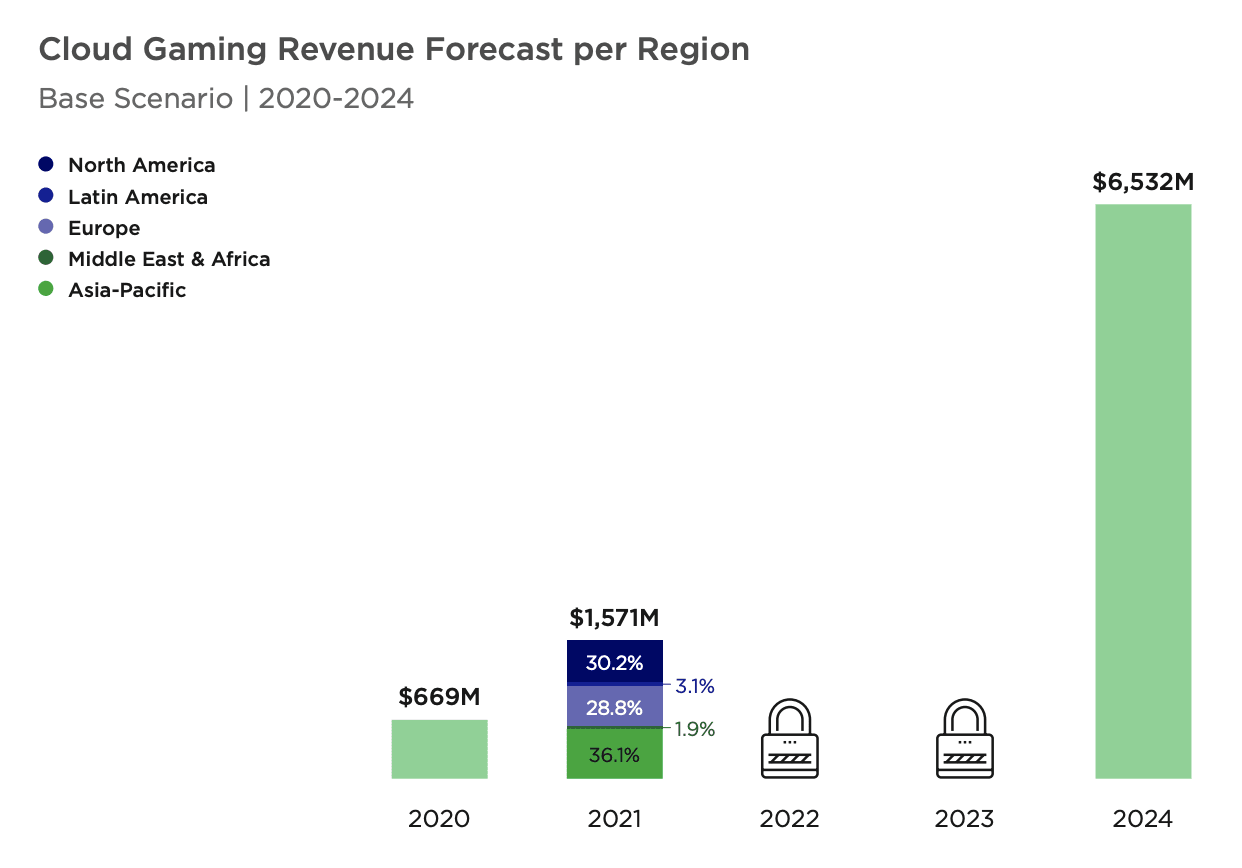
- Newzoo expects that by 2024 the ARPPU of Cloud Gaming services will be $107.6. Currently, it’s $66.3.
-
As for the regions, the North American and Western European markets are responsible for 59% of user spendings.
SocialPeta: Mobile Marketing Situation in H1 2021
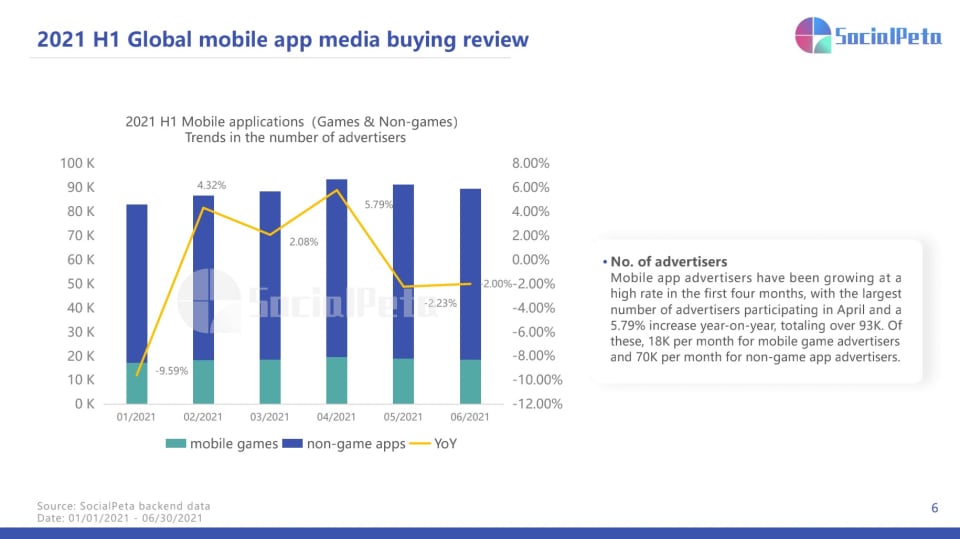
-
In April 2021 there were about 18,000 gaming advertisers. It’s 5.79% more than a year before.
-
Gaming advertisers constitute 23% of the overall number.
-
The number of both advertisers and creatives is higher on Android - 58.17% and 55.81% versus 41.83% and 44.19% respectively on iOS.
-
Gaming advertisers launched 19 million creatives in H1 2021 showed 108% growth.
- On average, there are 504 creatives for one advertiser in H1 2021. It’s 183% more than the year before.
-
The highest increase in ad spending is in North America and Oceania. Other regions increased insufficiently or fell down.
-
The video format is still the major part of the industry with 86.93% of all creatives.