
To make playthroughs easier or faster, gamers buy various boosters. These in-app purchases (IAP) that go under the general term “consumer basket” along with other metrics can be analyzed and mined for insights.
The ‘consumer basket’ term that refers to a set of consumer goods and services purchased by a single consumer or household over a certain time period is a very popular economic notion. Consumer basket data can be analyzed using the methods that best suit the objective and needs of the particular research.
Read more: Best Product Analytics Platform: devtodev vs Amplitude
In this article, we will look at the analysis of the consumer basket for a game project.
So, imagine that you have a cohort of 1,000 users who installed your game and over the first month purchased the following:
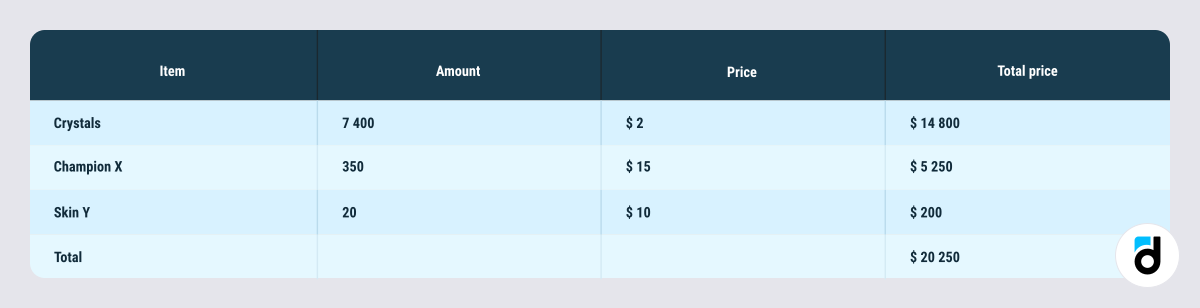
If you divide the total sales by the number of people in the cohort, you will see that the average user spends $20.25 and their consumer basket includes:
-
Crystals - 7.4 pcs;
-
Champions - 0.35 pcs;
-
Skins - 0.02 pcs.
These data are not enough. You need to break them down further to make sure that the content and cost of the consumer basket satisfies you enough, and if they don’t, then you can try to influence them e.g. promote the items you want to sell, make them more visually appealing, increase the number of times users see them, change the way they are arranged, increase or decrease prices, etc. Also, you need to assess your consumer basket over time because its content may change under the influence of many factors.
The devtodev analytical platform experience shows that it’s better to analyse in-game purchases in the breakdown by their demand, levels, and locations. You can start with a general assessment, i.e. list all items by their demand and figure out at what level they are purchased.
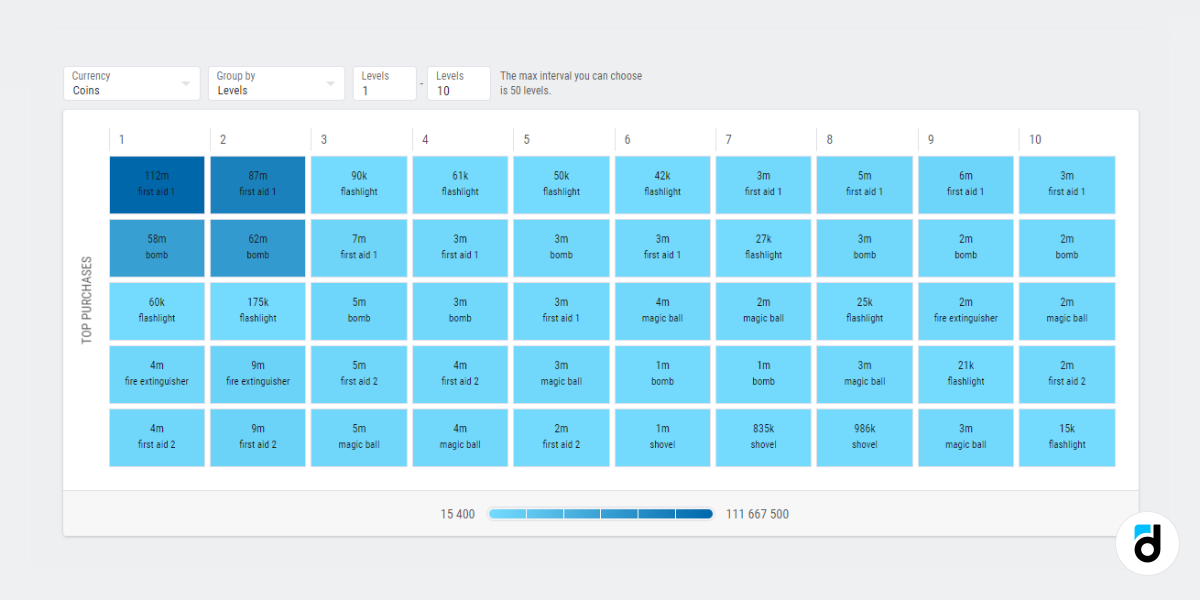
After that, assess the number of users at each level and calculate the number and type of items purchased by an average user at a certain level.
If you acquire these data and data about resources in users’ possession, you’ll get the full picture of what’s in demand at every level and what’s in surplus. After that, you can launch successful promotions, announce discounts and even create new sources of resources.
After the analysis, you are free the use the obtained information even further, e.g. you can overlap it with the churn data and find out that your users tend to fall off because they lack a certain resource at a particular level. If this is the case, you can run a promotion at the level in question and thus help your gamers and spark their interest in playing on.
Read more: Main Metrics. Installs
ABC/XYZ analysis
You can analyze the sales structure using classical methods like ABC/XYZ analysis. It identifies the most and the least popular and profitable items as well as ‘intermediate’ options. The method allows you to develop the right strategy for promoting certain products and even exclude/replace some of them.
Read more: Mobile App User Segmentation: Goals And Tips
Let's look at how this is done.
ABC and XYZ analyses are carried out on the entire group of items.
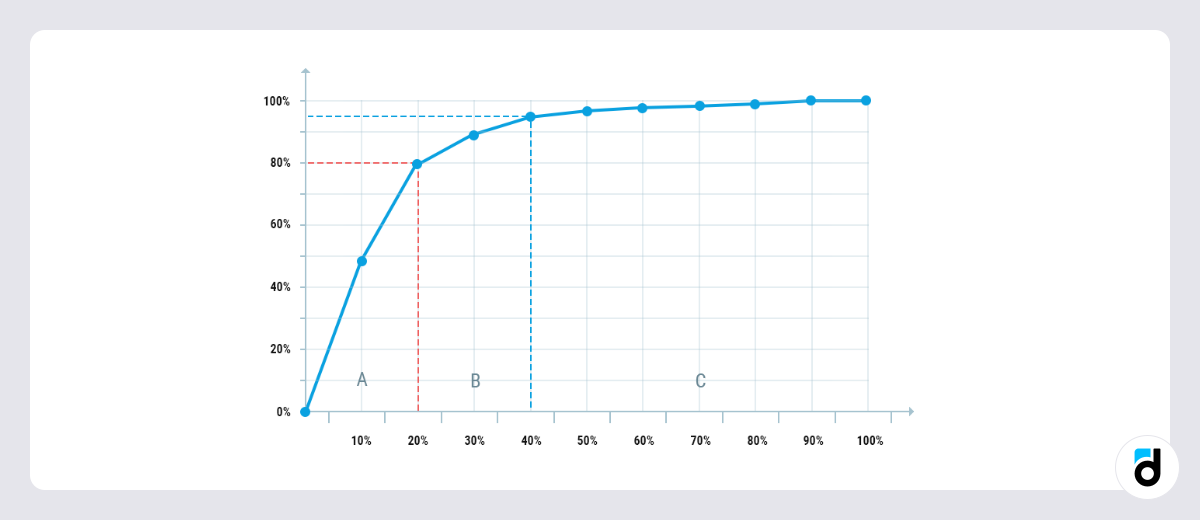
ABC analysis groups items depending on their contribution to the total income and the share of all purchased goods:
-
Group A items account for 80% of income and 20% of the total quantity;
-
Group B items account for 15% of revenue and 30% of total quantity;
-
Group C items account for 5% of revenue and 50% of total quantity.
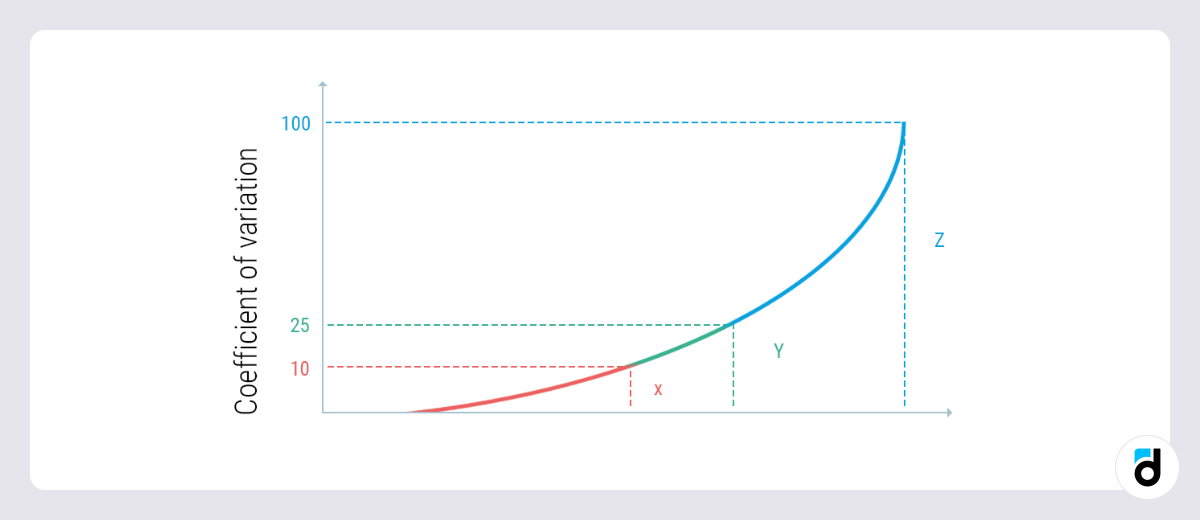
XYZ analysis identifies the stability of demand (by a coefficient of variation) and the accuracy of forecasting:
-
Group X items - goods with the most stable demand, that have a coefficient of variation of less than 10% and a highly reliable forecast;
-
Group Y items – goods with medium-stable demand, that have a coefficient of variation of 10% to 25% and an average degree of reliability of the forecast;
-
Group Z items – goods with unstable demand, that have a coefficient of variation of more than 25% and very low reliability of forecast.
Read more: Game Analytics Metrics Glossary
After splitting all products into ABC and XYZ groups, they are combined into one table:
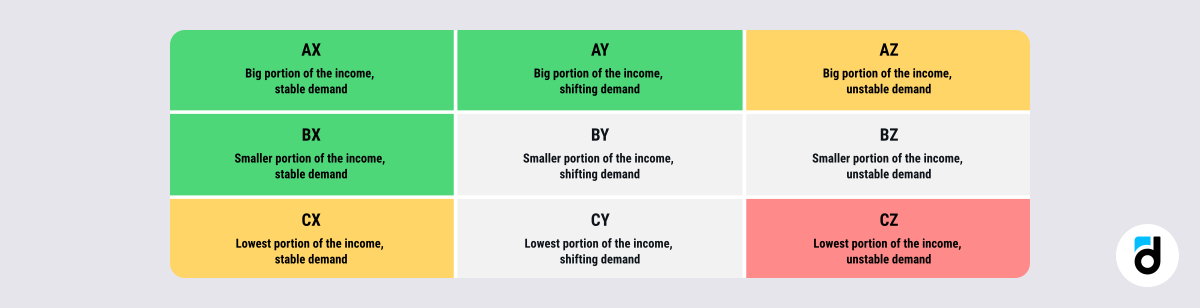
From this table, you can see that AX, AY, BX cell items are the most profitable because there is a stable demand for them and they make up a large share of income.
The most unprofitable items are in the CZ cell - users buy them rare and in small quantities. You need to carefully analyze them and, if they do not play some critical role, think about replacing them.
The CX and AZ cell items have one good and one bad indicator. You can try to fix their weaknesses and move at least some of them to the “green” category.
Read more: 5 Key Soft Skills of Game Analysts
You can apply the results of the ABC/XYZ analysis in different ways, for example, to increase sales. If you also analyze the exact goods purchased within a single purchase, then you can figure out which of them users most often buy together, find purchase patterns, calculate the probability of buying product B given buying product A and place them side by side ( in the first place, this applies to online and offline stores).
For example, in supermarkets, we often see that cheese and wine are placed together. This is exactly the result of the ABC/XYZ analysis because people who buy wine often have cheese on their receipts.
When you have data on purchased (many of us have bonus cards) and related products, you can run personalized promotions, send targeted push notifications and email newsletters, thereby driving sales and making users feel that you care about each and every one of them.