
Devtodev is helping you keep in touch with what’s happening in the game market. Every month we publish an overview of reports on the most popular games worldwide, top-grossing games, successful releases, favorite video game types, trends, etc. This overview is prepared by Dmitriy Byshonkov - the author of the GameDev Reports by devtodev Telegram channel. You can read the January and February reports.
Contents
- [Editorial] Mobile Gaming Market in 2023 - not as bad as you want it to be
- Circana: The US gaming market in January 2024 grew by 15%
- data.ai: Mobile Gaming Market in 2024
- game: Only 12% of German gaming companies are confident in the growth of the gaming market in 2024
- StreamElements & Rainmaker.gg - State of the streaming market in January 2024
- Shorooq Partners: State of the Gaming Market in MENAP and globally in Q4 2023
- The Game Hub Senegal: Video Games in Africa
- Newzoo: Top-selling PC/Console Games in the USA and UK in 2023
- Sensor Tower: IP Collaborations in the Japanese Mobile Market in 2023
- Famitsu: $2.7 billion was spent on physical gaming products in Japan in 2023
- Niko Partners: MENA-3 is expected to reach revenue of $2.65 billion by 2027
- AppMagic: Top Mobile games of February 2024 by Revenue and Downloads
- Game sales Round-up (21.02.2024 - 05.03.2024)
- SocialPeta: Trends in Mobile Gaming Marketing in 2023
- AppMagic: Lessons of 2023 for casual games
- GSD & GfK: The UK gaming market (PC & Console) declined in February 2024
- Famitsu: Persona 3 Reload tops Japanese retail chart in February 2024
- Monopoly GO! has earned over $2B
- StreamElements & Rainmaker.gg: State of the Streaming Market in February 2024
- 80 Level: 45.6% of the game industry workers are living from a paycheck to a paycheck
- Sensor Tower: Japan accounted for nearly 50% of the revenue from geolocation Mobile games in 2023
- Game sales Round-up (06.03.2024 - 19.03.2024)
- Adjust & AppLovin: Mobile Game Market Trends in 2024
- DDM: Gaming Investments in Q4 2023; 2023 Results and 2024 Forecasts
- GSD & GfK: The European Gaming Market Actually Grew in February 2024
- Circana: The US Gaming Market in February 2024
- Unity: Gaming in 2024 Report
- Mistplay: Paying Users in Mobile Games in 2024
[Editorial] Mobile Gaming Market in 2023 - not as bad as you want it to be
In 2023, we heard a lot about the gaming industry experiencing a crisis. In particular, many people talk about there being fewer new games, and those that do come out earn less. It became interesting to verify this with numbers to have a slightly more objective view of the situation.
Downloads
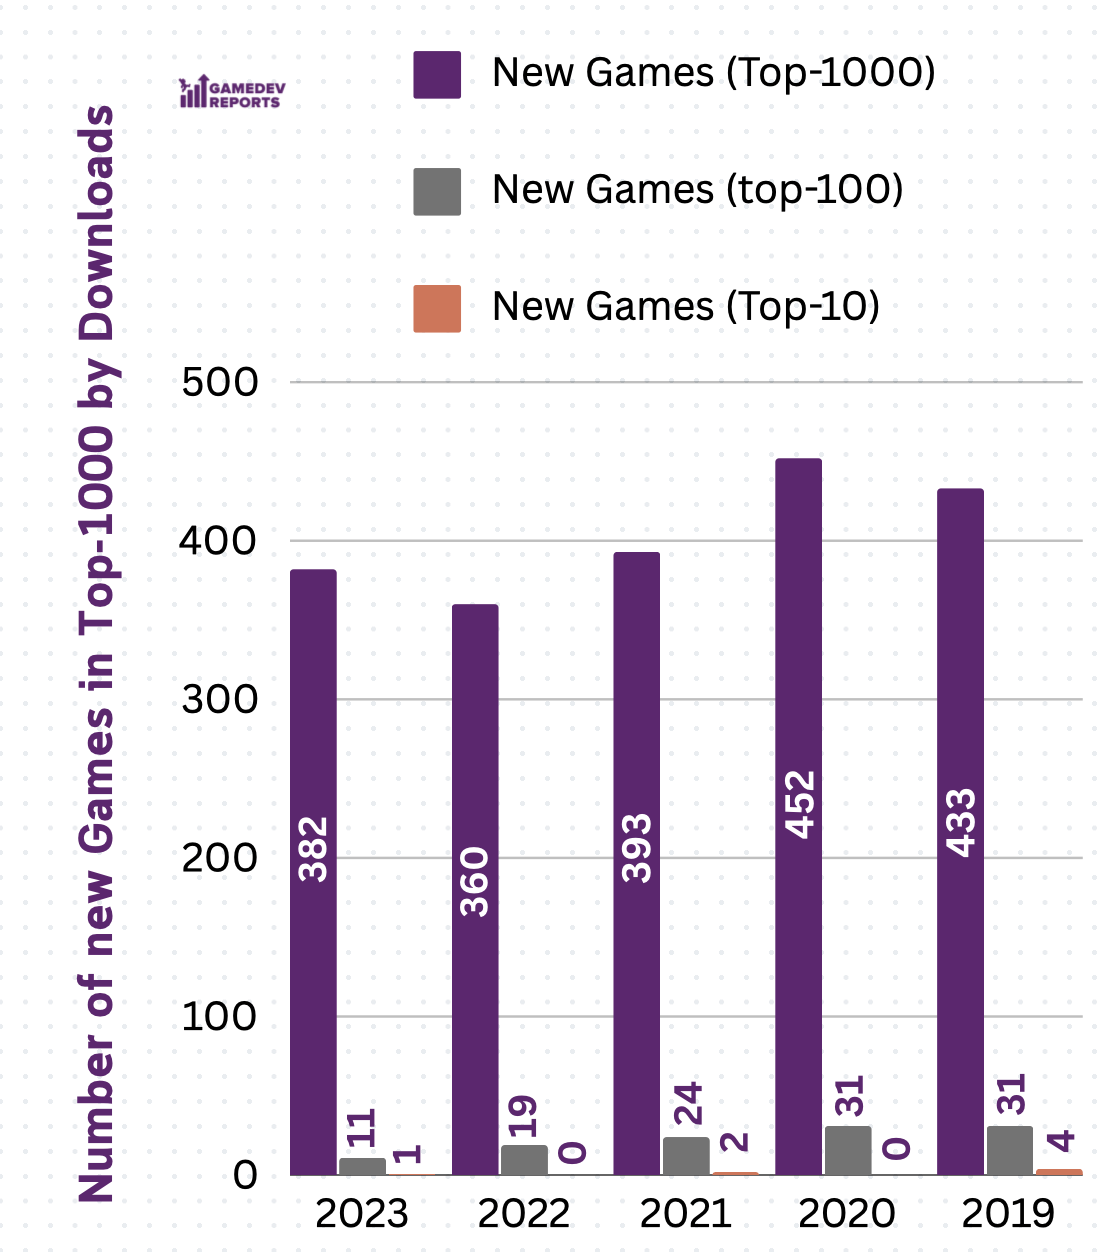
Source: AppMagic
-
The number of new projects in the top 1000 by downloads has remained roughly consistent since 2021. However, the number of new games by downloads falls short in the years 2021-2023 compared to the figures for 2019 and 2020.
-
The number of new projects in the top 100 by downloads has indeed decreased over the years. In 2023, there are three times fewer projects in the top 100 compared to 2020 and 2019. It's harder for new games to break into the top ranks.
-
The number of new projects in the top 10 by downloads has remained relatively unchanged since 2020. Becoming a global hit is very challenging - only three projects in four years can boast such an achievement.
Here are the new entries in the top 100 by downloads for the year 2023:
-
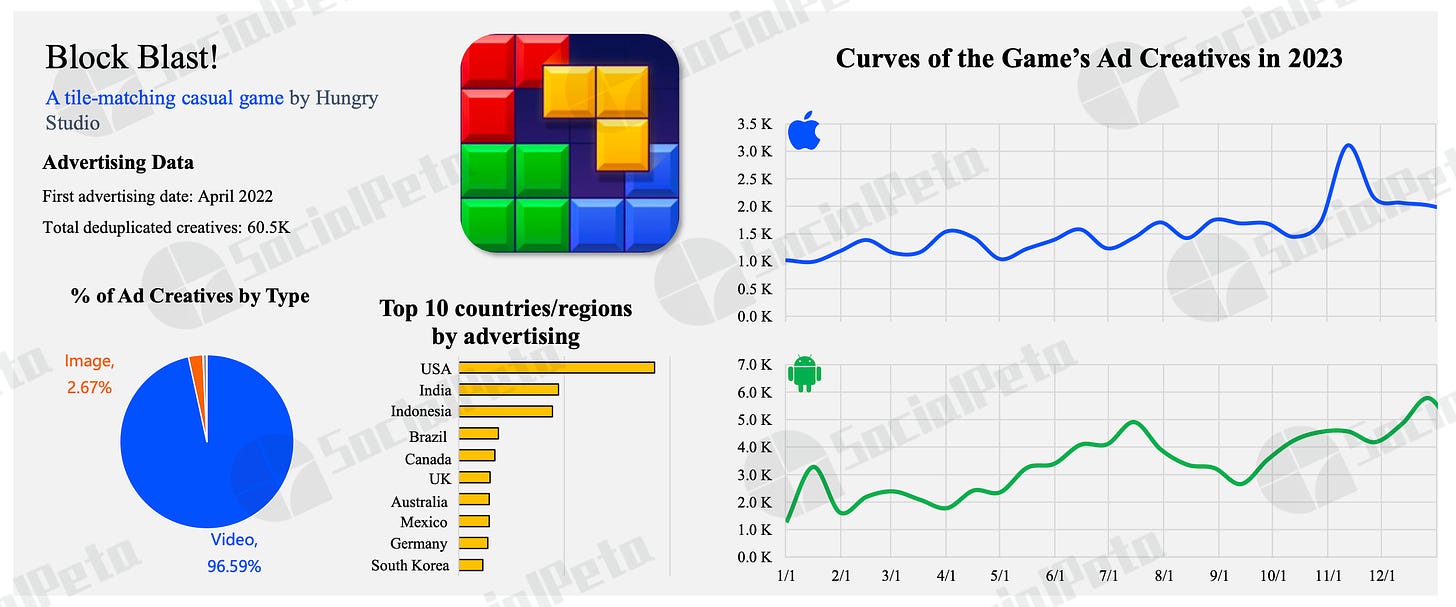
5th position (151.7 million downloads) - Block Blast! - a block puzzle game, a variation on the theme of Tetris. Hungry Studio developers have never released a game as popular as this before.
-
14th position (107.5 million downloads) - Monopoly GO! - a game that needs little introduction, a modern interpretation of the classic board game by Hasbro. Scopely, the developer has several world-class hits under its belt.
-
26th position (90.1 million downloads) - Attack Hole - an arcade game where you control a black hole and consume objects. Developed by Black Hole Games and published by Homa, a global leader in publishing hyper-casual and hybrid-casual games.
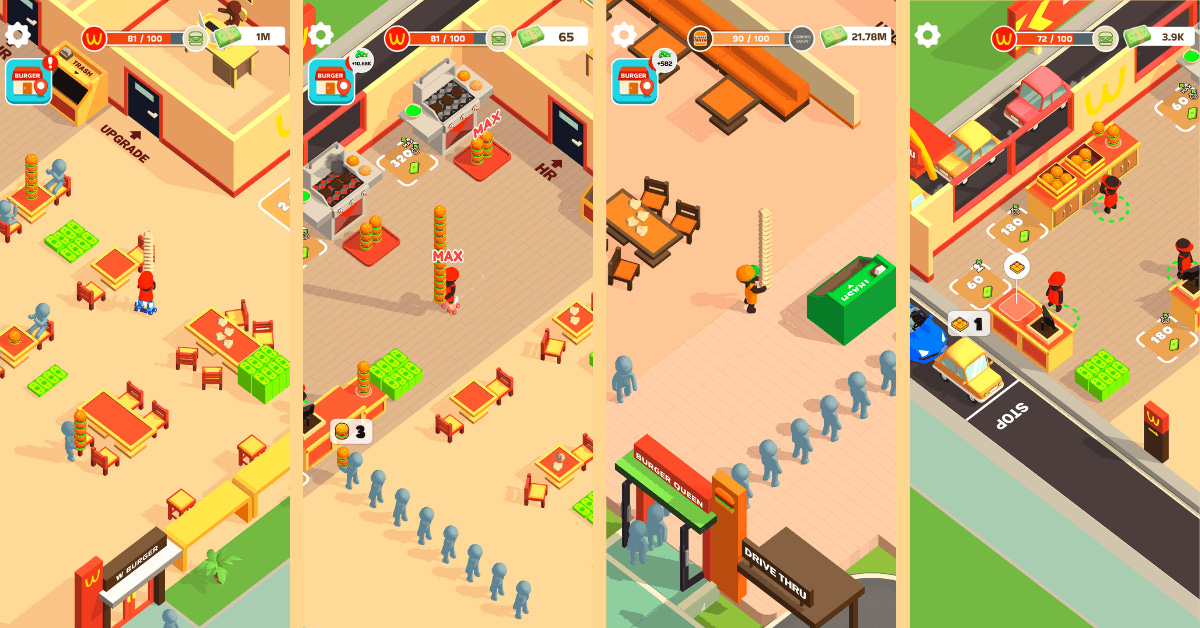
-
39th position (76.5 million downloads) - Burger Please! - a tycoon game about managing a burger restaurant. Released by Supercent, a successful hyper/hybrid-casual publisher.
-
45th position (72.3 million downloads) - Avatar World: City Life - a children's life simulation game developed by Israeli company Pazu Games, specializing in such games.
-
50th position (70.1 million downloads) - Real Car Driving: Race City 3D - an open-world racing game with various gameplay modes. Developed by Botanica Global, which has a dozen similar genre games under its belt.
-
74th position (57.9 million downloads) - Ramp Car Games: GT Car Stunts - a casual racing game about tracks with obstacles. Developed by Fun Drive Games, with 13 other racing genre games.
-
81st position (54 million downloads) - Build A Queen - a viral runner game by Supersonic Studios.
-
84th position (52 million downloads) - Snake Run Race・3D Running Game - another runner game, this time about a snake. Developed by Freeplay, a popular developer and publisher of hyper/hybrid-casual projects.
-
92nd position (49.4 million downloads) - Slow Mo Run - an arcade game where you overcome various obstacles by controlling a character's body parts. Developed by Supersonic.
-
100th position (47.5 million downloads) - Vehicle Masters - an arcade driving simulator. Developed by SayGames, another popular hyper/hybrid-casual publisher.
A few conclusions:
-
In 2023, only Hungry Studio, a relatively unknown developer, managed to enter the top 100 with a new game. All other projects were from market leaders.
-
Racing games and runners gather a large amount of viral traffic. In 2023, people were still interested in games in these genres. However, the value of this traffic is questionable - for example, Real Car Driving: Race City 3D received 35% of downloads from India and 8% from Brazil.
-
Hyper/hybrid-casual projects continue to dominate the top 100 by downloads.
Revenue
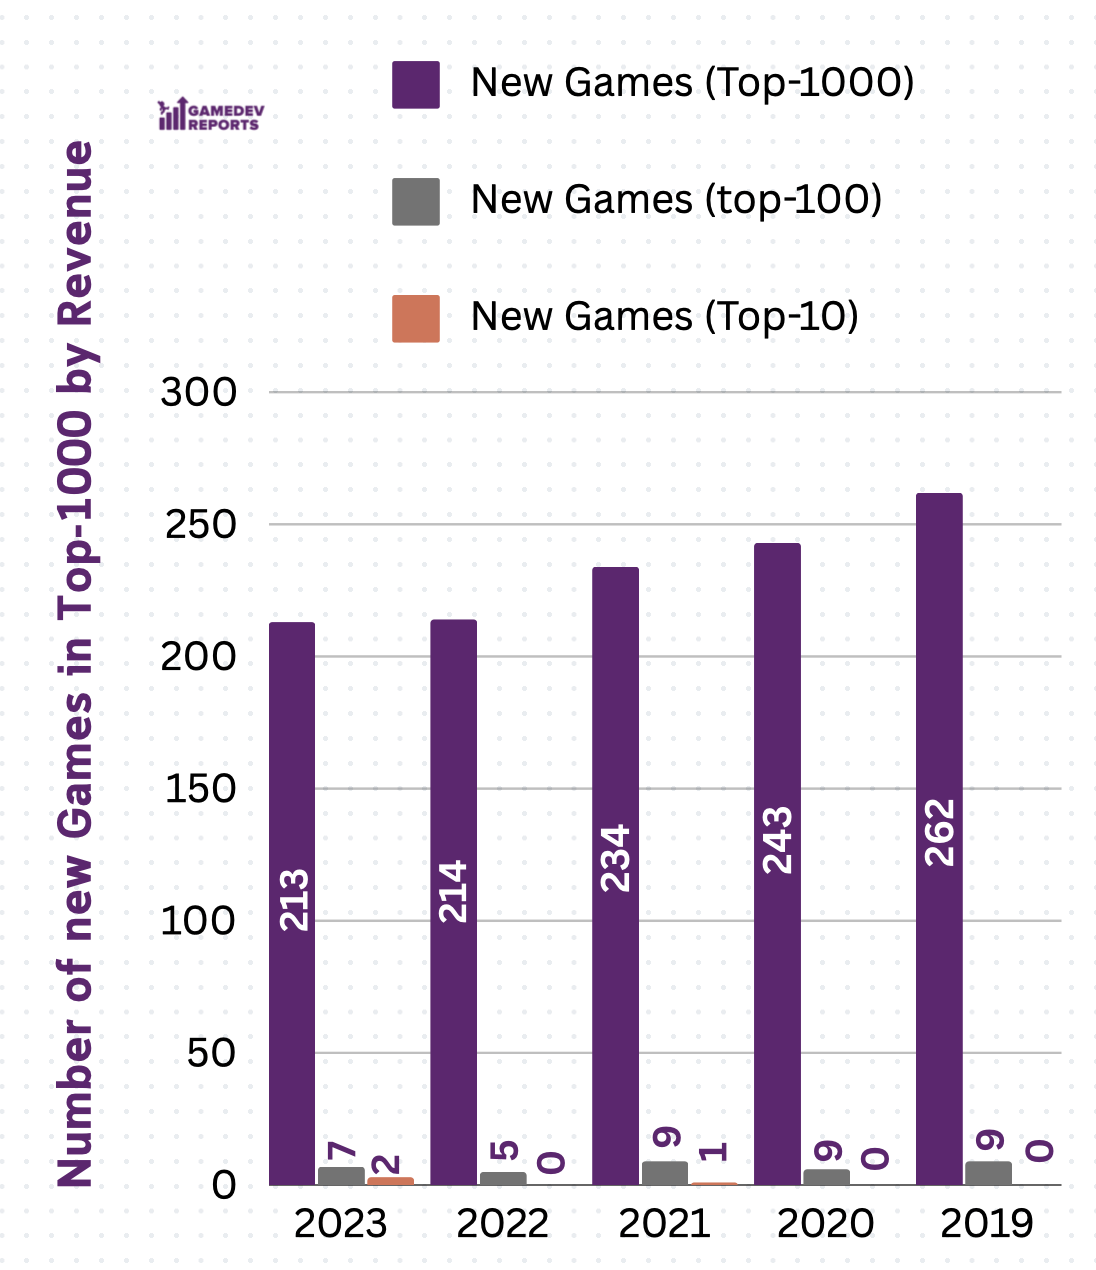
Source: AppMagic
Disclaimer:
-
Only calendar years are taken into account. For this reason, for example, in 2020, Genshin Impact did not make it into the top 10 by revenue. The game was released on September 28 and simply did not have enough time to earn sufficient money.
-
Only sales in Google Play and the App Store are considered. Sales in 3rd-party stores in China are not taken into account, nor are payments outside of platforms (top-ups on websites).
-
For games available only in China, information is only provided for iOS.
-
Some projects in the top 100 were released at the end of December 2022. I included them in 2023.
- The number of new projects by revenue in the top 1000 has been slowly declining since 2019, indicating increasing competition.
-
However, in 2023, there were 7 projects released that made it into the top 100 by revenue. An interesting point here is that 4 projects from the list in 2023 were not available outside of Asia.
-
Surprisingly, 2023 was a breakthrough year for the mobile industry in terms of global hits. Two projects made it into the top 10 - Monopoly GO! and Honkai: Star Rail. This hadn't happened in 5 years.
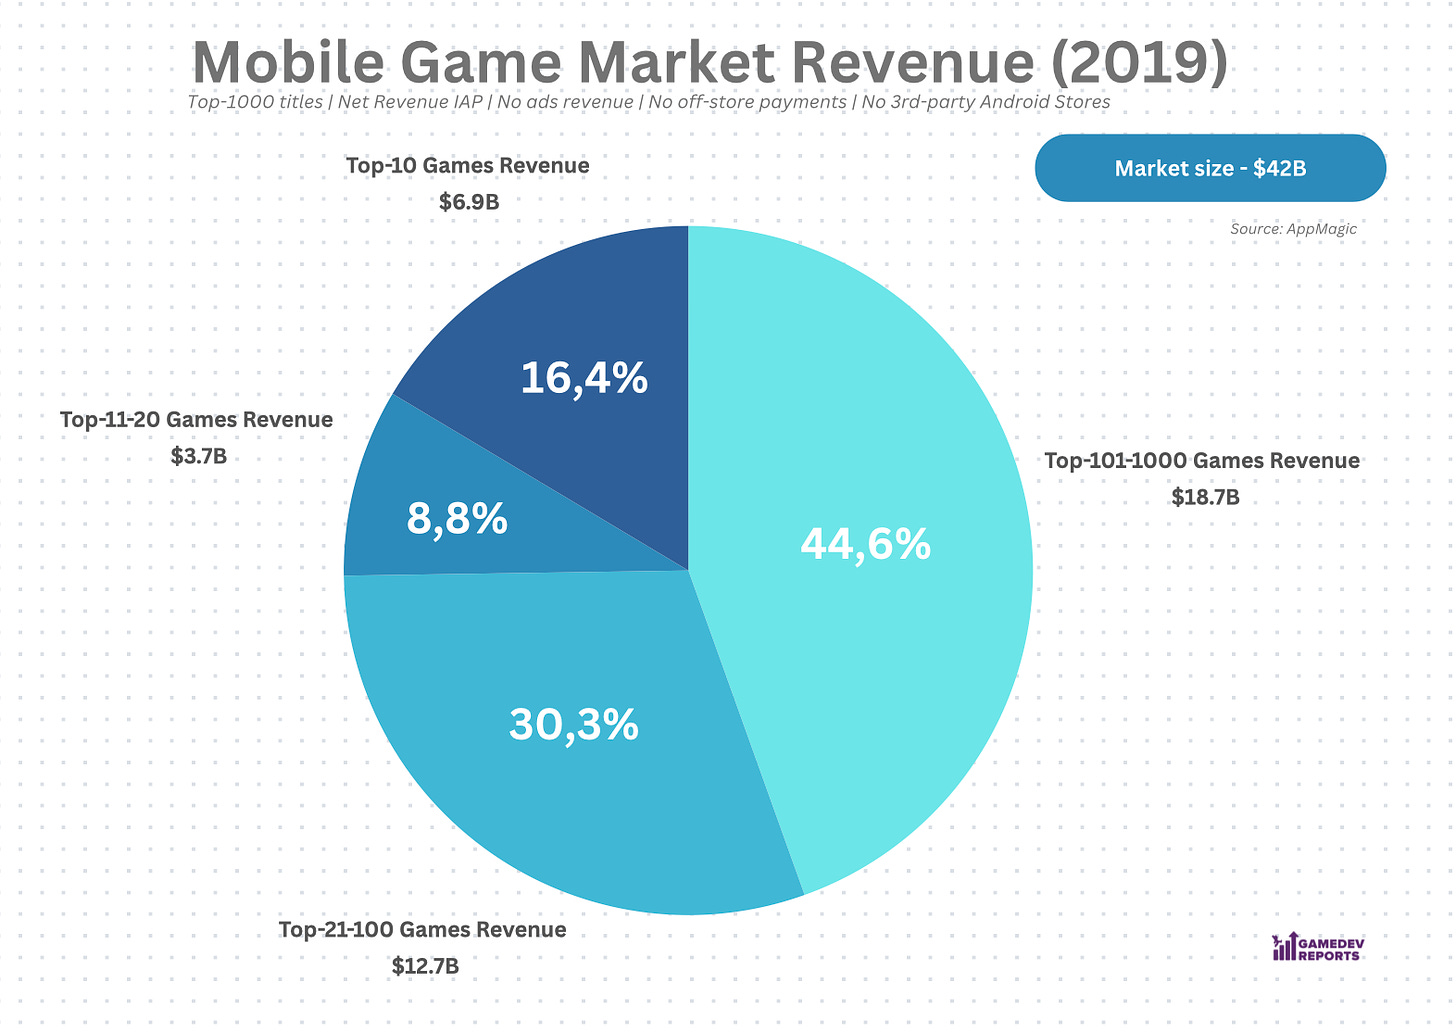
According to AppMagic data, the top 1000 games in the mobile market earned $47.6 billion in 2023. Have a look into how the absolute market volume has changed (from 2021 - based on the top 1000 highest-earning projects - it is decreasing), as well as how the revenue distribution has changed in different segments.
Source: AppMagic
Here are the newcomers of 2023 in the top 100 by revenue:
-
8th position ($659 million) - Honkai: Star Rail - a new RPG (jRPG?) from miHoYo, which applies the well-known gacha formula to a new core gameplay. All of this with stunning production quality.
-
9th position ($645 million) - Monopoly GO! - the game launched slightly later than Honkai: Star Rail, so it didn't manage to surpass it in revenue. Officially, Scopely announced that the game broke $1 billion in revenue (please note the disclaimer).
-
18th position ($358.2 million) - Justice Online (逆水寒) - an MMORPG from NetEase, currently only available in China. One of the project's features is the use of AI - it is used to simulate live players and dialogues with NPCs.

-
34th position ($260.1 million) - Whiteout Survival - a 4X strategy game from Century Games, launched in combination with Frozen City. One of the most interesting cases in the market recently, where one company releases two products in the same setting with the same assets but in different genres - and for different audiences - with a gap of a couple of months.
-
67th position ($148.9 million) - Changa Fantasy (长安幻想-送周年宠) - another MMORPG only for the Chinese market, based on the manga series of the same name.
-
95th position ($102.8 million) - Night Crows (나이트 크로우) - an MMORPG released only in the South Korean market. The game will be launched on the Western market in early 2024, with an unusual feature - integration with Web3.
-
100th position ($96.5 million) - Crystal of Atlan (晶核) - the third MMORPG in the list for the Chinese market. The game closely resembles Genshin Impact in appearance and is currently undergoing closed beta testing for Western markets.
Source: AppMagic
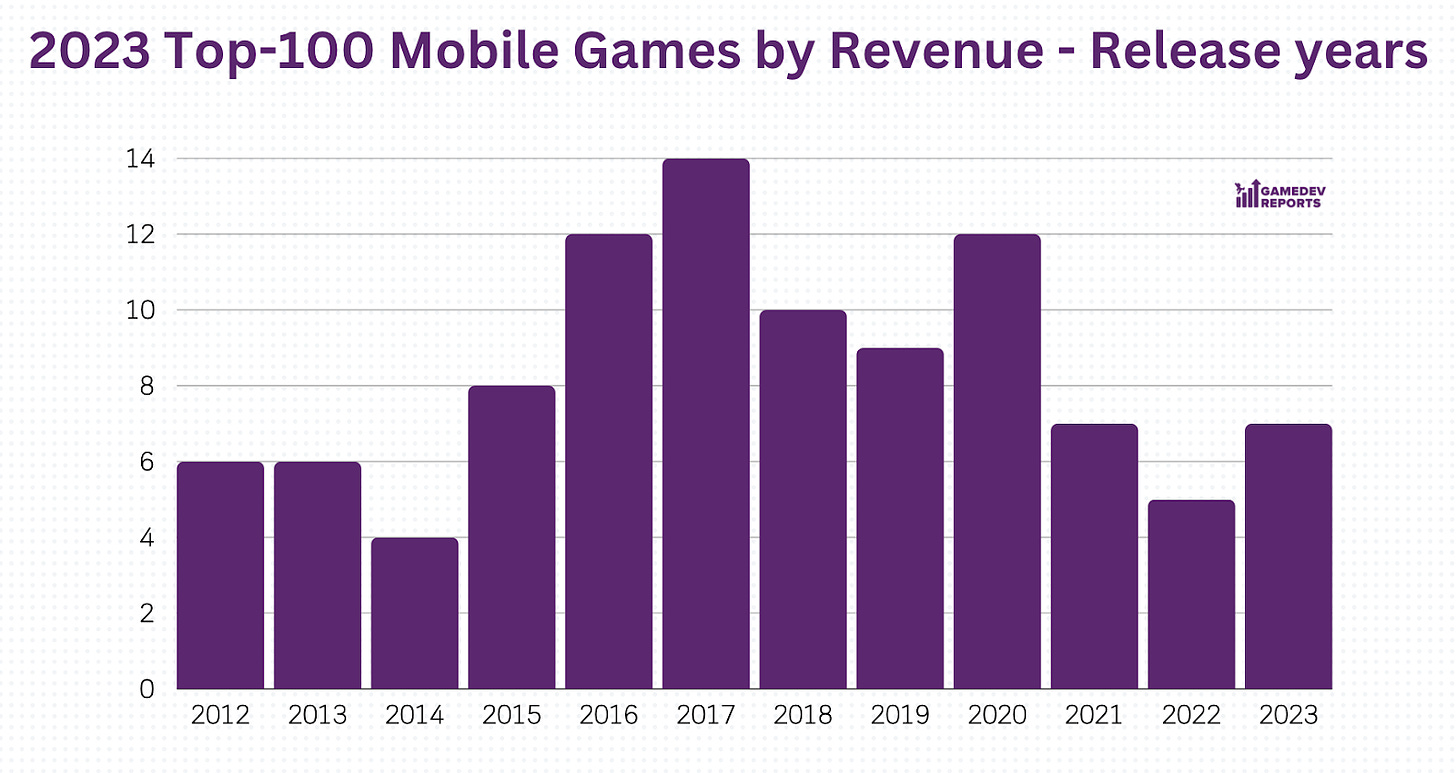
Based on the dynamics of new products appearing in the top 100, it's evident that 2023 wasn't as bad as initially perceived. However, it would be appropriate to conduct a retrospective comparison, which I'll leave for future issues.
Out of the top 100 by revenue in 2023, 23 projects were earned exclusively in Asia. These projects are either from China (like Justice Online), Japan (Monster Strike), or South Korea (Night Crows).
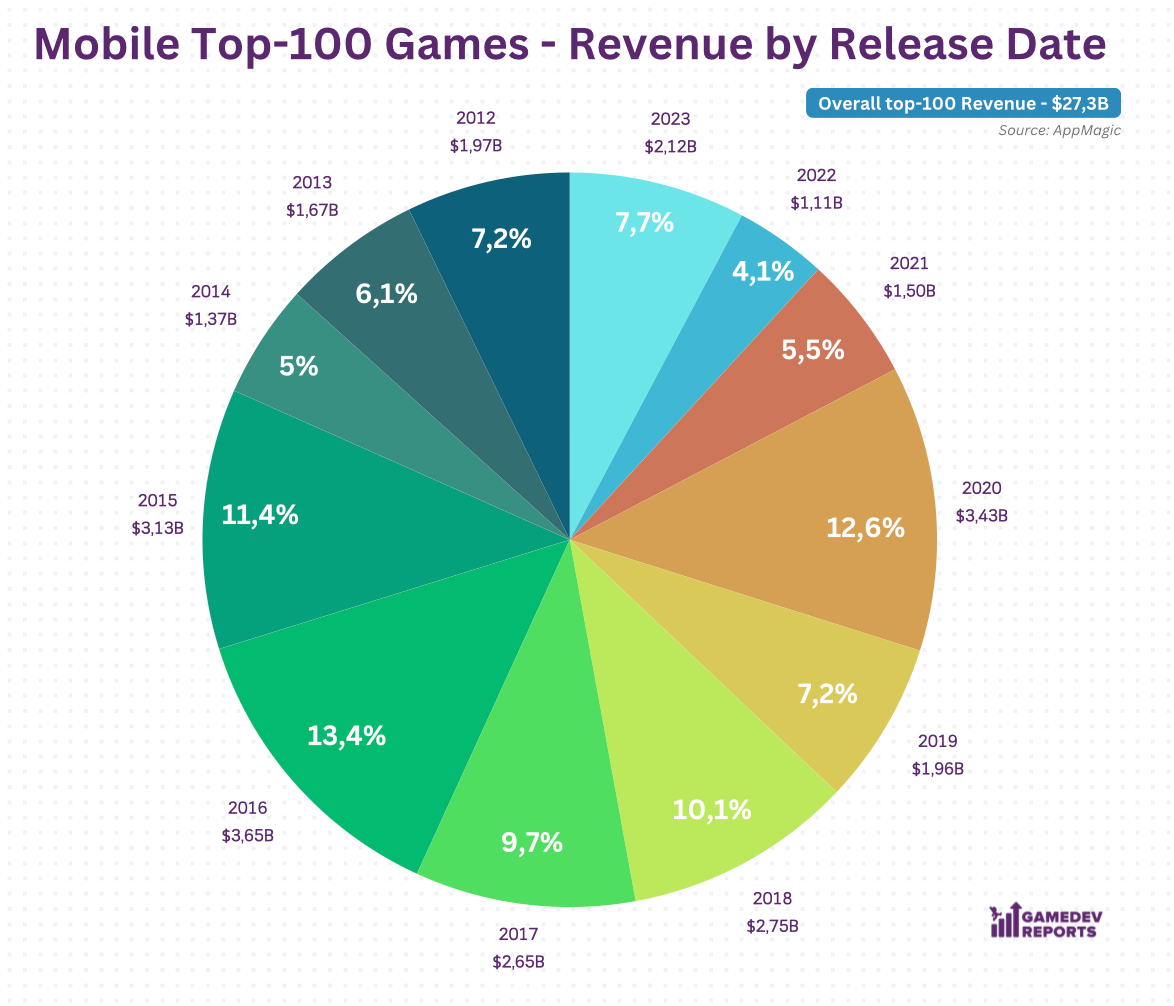
This graph shows the revenue share of projects from different years. The share of older projects is very large. Projects released since 2020 represent only 29.9% of the market. However, it is noticeable that the share of projects released in 2023 is the highest in the past couple of years. This is attributed to the breakthroughs of Honkai: Star Rail and Monopoly GO!.
Not long ago, Michail Katkoff from Deconstructor of Fun released an essay on the future of the mobile gaming industry. I recommend reading this article, and I also want to publish a graph from data.ai on the number of new mobile games released and the total number of mobile games on iOS.
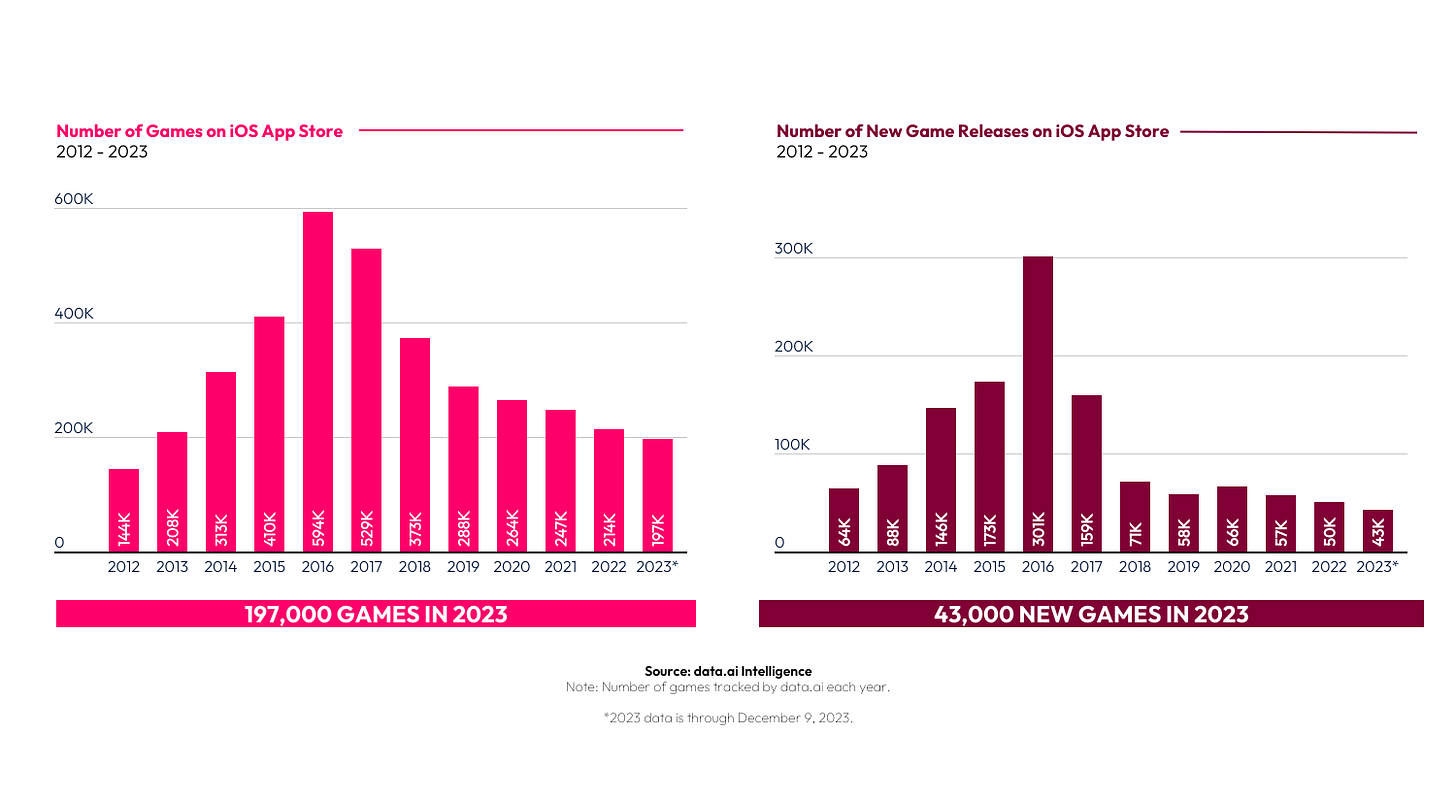
It's an interesting situation. If we compare the numbers of new games in the top 1000 with the total number of releases, it turns out that in 2023, the Success Rate of mobile games was higher than, for example, in 2022. However, there might be a calculation issue as I accounted for games on Google Play and iOS, while data.ai provides only figures for iOS.
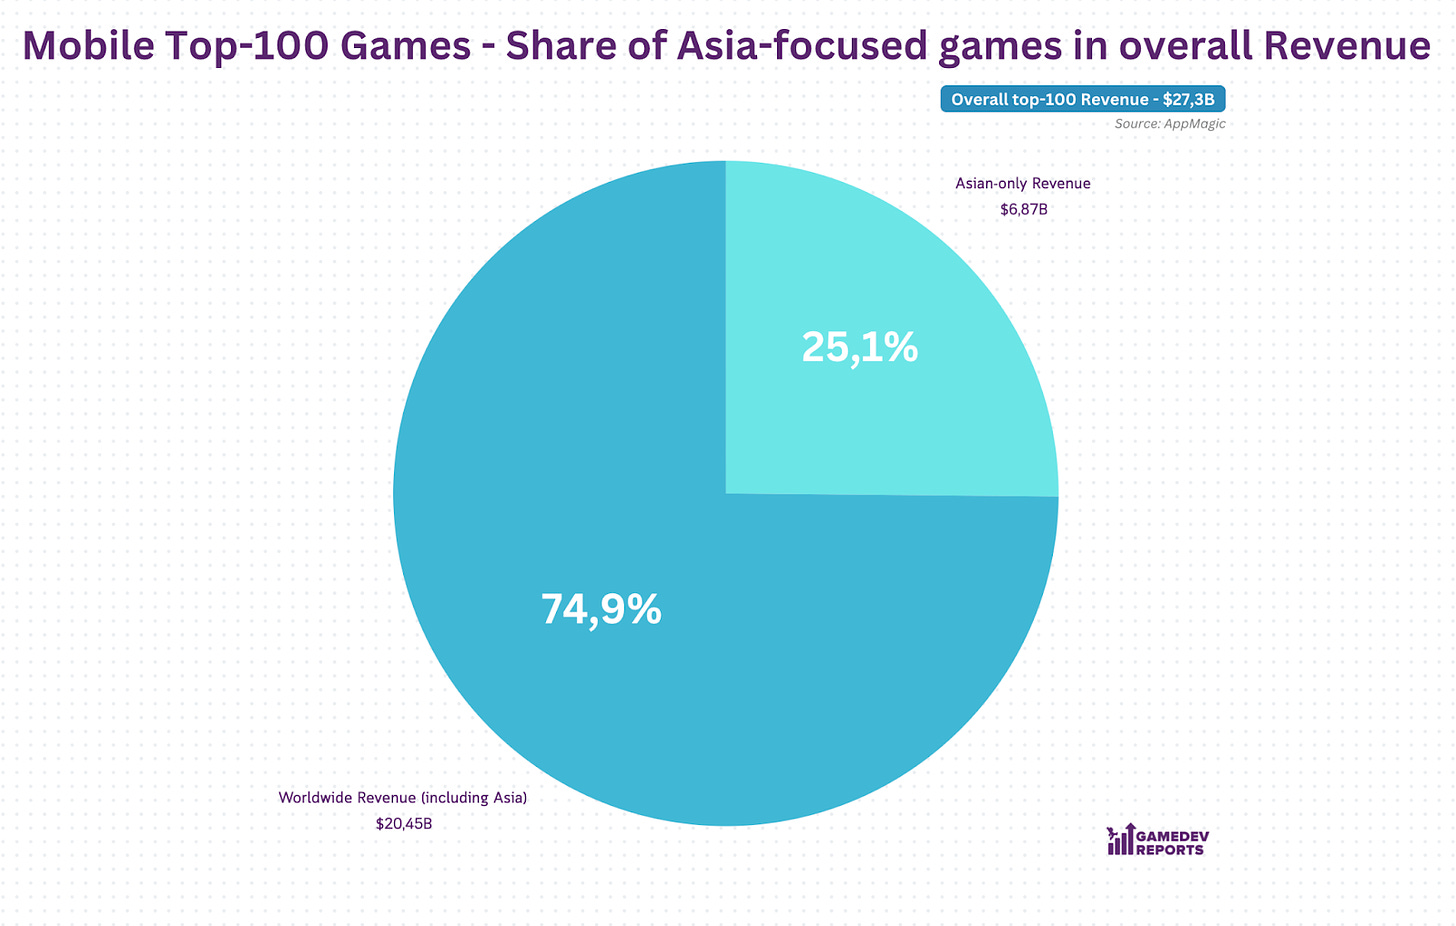
In 2023, projects for Asian markets account for 25.1% of the revenue in the top 100 - $6.87 billion. Many of them, probably, will never reach international markets and will only cater to local audiences. However, out of the 7 top projects released in 2023, 4 launched exclusively in Asia. Some of them, as mentioned earlier, will soon enter international markets. We'll be waiting for their results.
Separately, I was interested in examining how much games based on intellectual property (IP) earn. I wanted to note projects based on non-gaming IP (movies, anime, manga), as well as all of them combined.
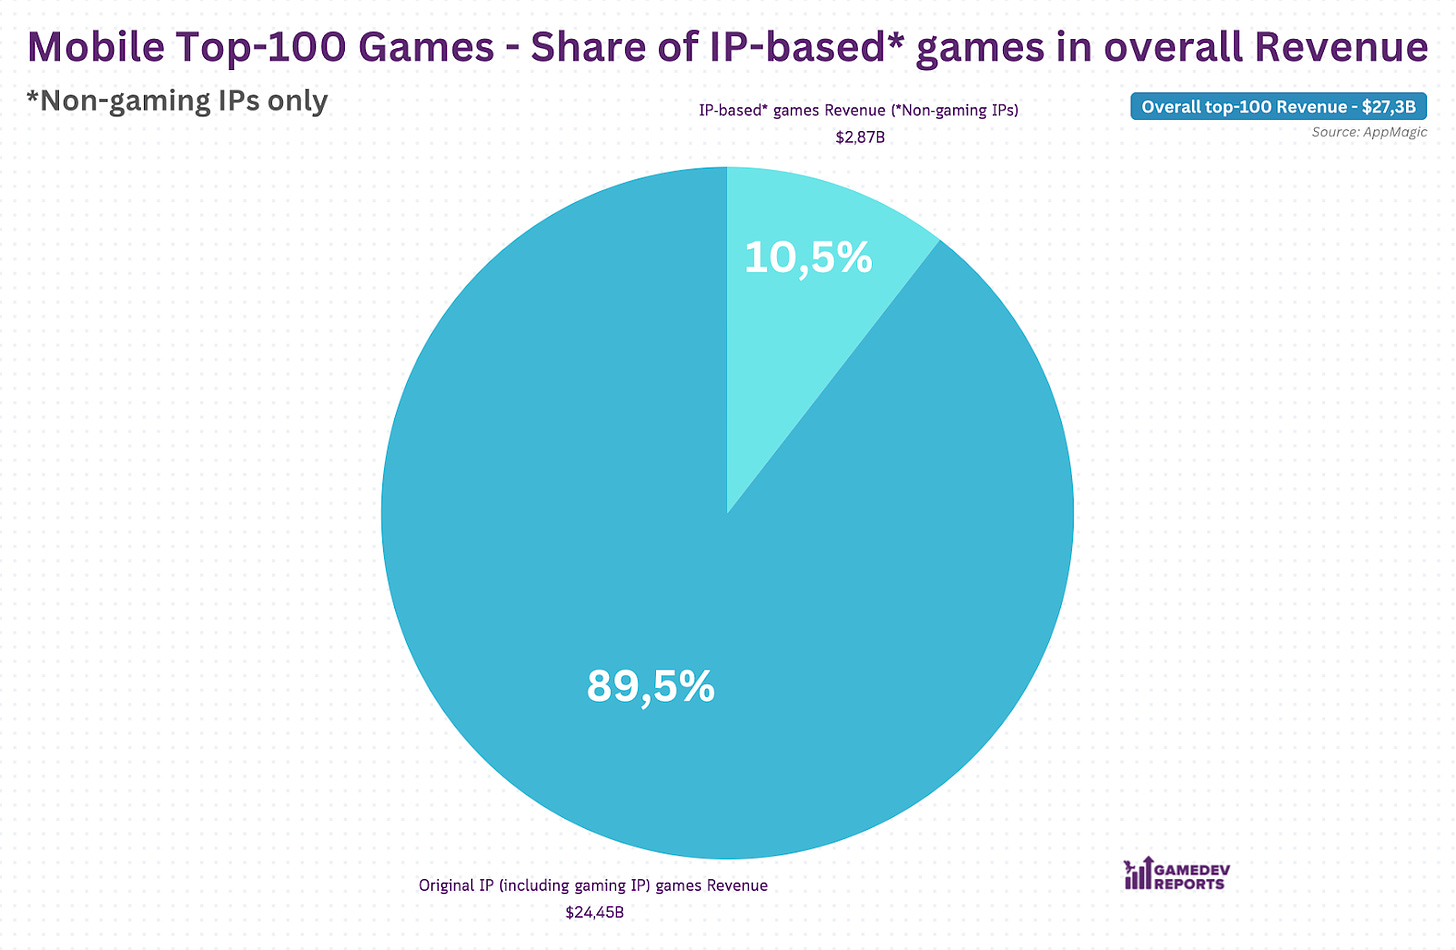
There's a subjective feeling that the number of new projects based on intellectual property (IP) in the mobile market is increasing. The trend of major PC/console IPs coming to mobile devices is particularly noticeable. Just in 2024, a mobile game based on Devil May Cry has already been released; several projects from Ubisoft are expected to be released soon; the EA Sports FC franchise is expanding with a new project; Warframe is coming to mobile devices; and Bethesda is preparing The Elder Scrolls: Castles. Just recently, Age of Empires was announced for mobile devices.
Utilizing popular IPs allows developers to reduce traffic costs, attract organic audiences, and engage existing fan bases. In conditions of limited user tracking possibilities, I believe that there will be more and more IP-based projects in the gaming mobile market over time.
Overall, the mobile gaming market has become more competitive. Releasing a popular new game is becoming increasingly difficult. There's a trend of decreasing new games by downloads (perhaps fewer hyper-casual games?), and it's noticeable that the share of new projects in the overall revenue composition isn't that significant.
Devtodev is dedicated to helping gaming companies grow by offering free access to the analytics platform for projects with up to 10K MAU. Feel free to try out the free demo or book a tour with our manager.
It would also be fair to note that analytical platforms only allow us to see the revenue part of the equation. It's important to consider that in the post-IDFA era, the problem has become acquiring the right users, and user acquisition itself has become more expensive, which has overall reduced marketing effectiveness. This has impacted profitability. Many companies expanded their teams during market growth, which also led to increased expenses. Furthermore, heightened product quality requirements necessitate more resources for development.
However, speaking about the market as a whole, I disagree that 2023 was the worst year for the mobile market in a long time. Rather, in 2023, many postponed risks materialized. Market correction continued; companies that raised funds in 2020-2021 ran out of money; studios began adjusting their P&L and removing unprofitable divisions; the global recession has compelled users to pay more attention to even cheaper forms of entertainment (videos and short videos).
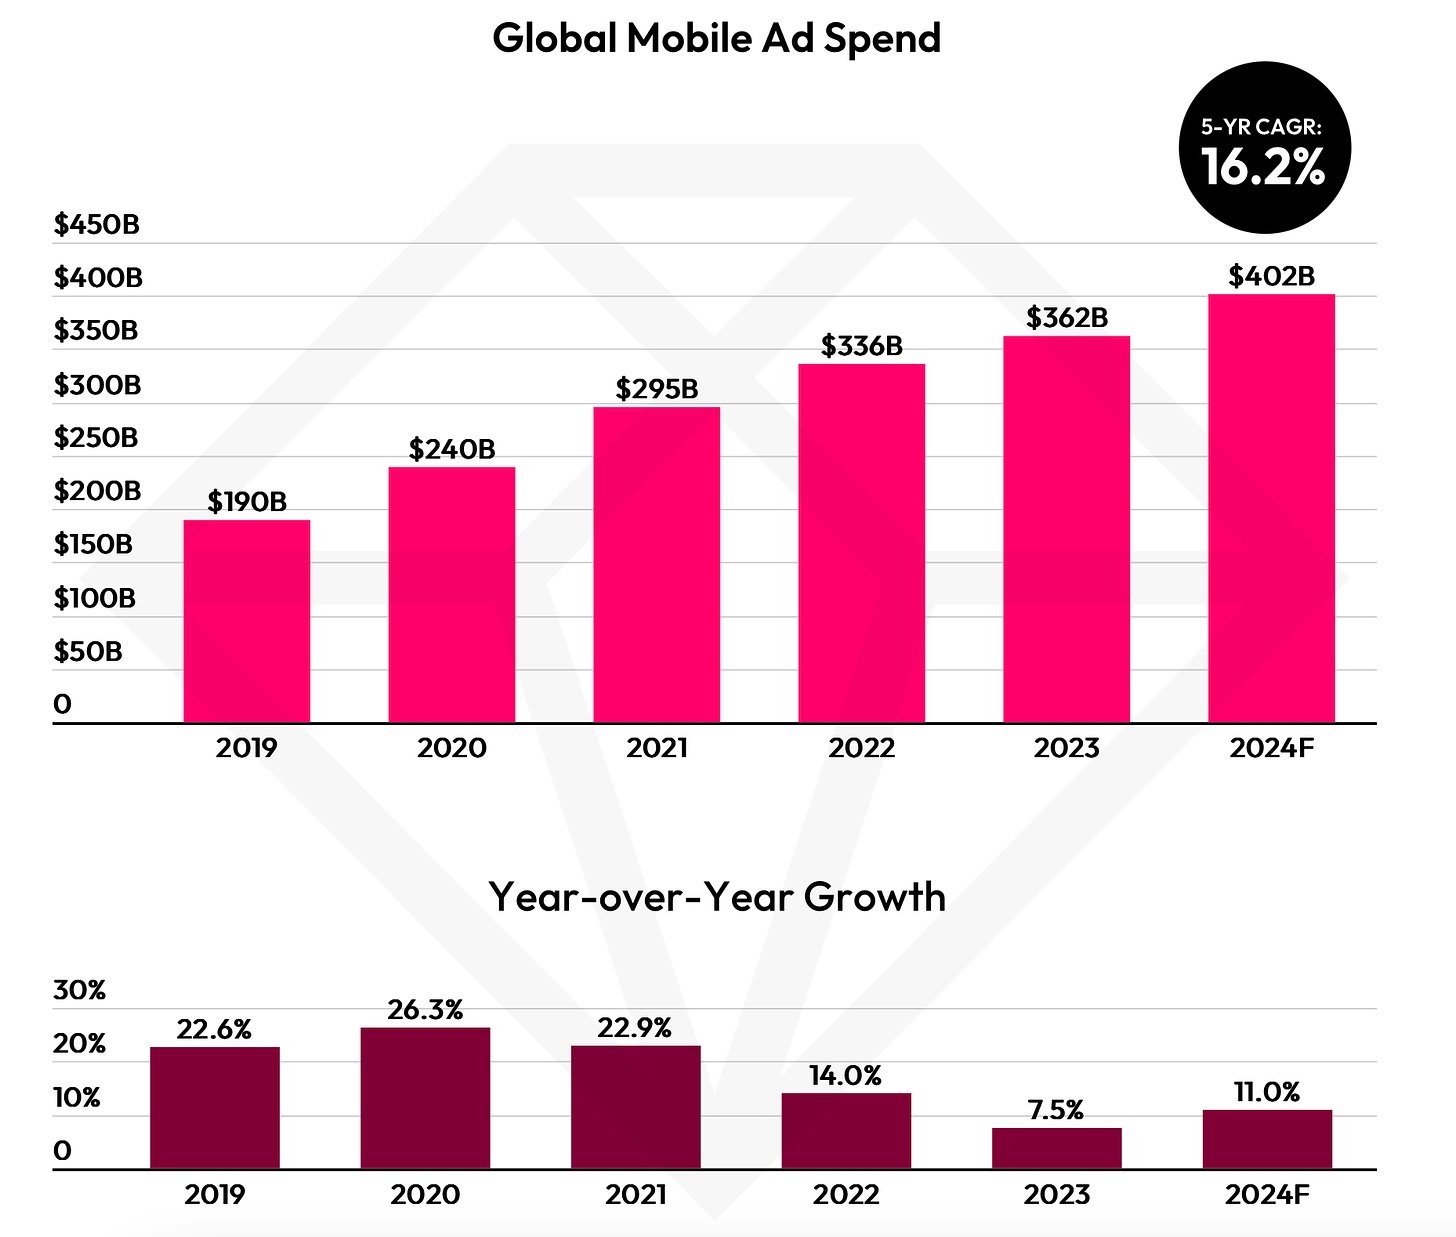
In terms of volume, the mobile market in 2023 exceeded the figures of 2019. Additionally, we don't consider advertising revenue, and the recent report from data.ai indicates another increase in mobile ad spending. Companies will pay more attention to optimization and smart planning. Both AI and painful experiences from the previous (and current, for that matter) year should help with this. All of this should lead to a healthier overall situation.

data.ai - Global Mobile Ad Spend
There's still a huge problem with launching new projects in the mobile market. Organic reach is almost dead, and mobile platforms are not in a hurry to address the situation. This leads to the situation where it's practically impossible for small developers without big budgets to launch any successful product on mobile devices. The level of hits in 2023 makes one ponder the requirements for successful projects. It seems that marketing departments of large companies have to adapt and learn (or return to?) classical marketing - using not only Performance tools but also less predictable channels.
Creating successful mobile games has always been challenging, and the situation has somewhat worsened recently. However, - and examples prove it - new major projects are being released, finding their audience, and earning their millions. This means that anything is possible.
In short, the main conclusions are:
-
In 2023, entering the market without an expensive and high-quality product is challenging. All new projects on the list are the result of many years of work by large and already successful teams. However, the situation hasn't changed much over the past few years. Therefore, saying that "it was better before" would be unfair.
-
In 2024, Asian hits from 2023 will enter the Western market. It will be interesting to see how they perform.
-
The majority of new games on the revenue list are in the RPG genre. However, the high monetization potential is offset by the high cost of development and increasing competition. It's possible to spend a lot of money and "miss the audience."
-
Games based on IP licenses and collaborations are something to learn from. This is one way to solve user acquisition problems.
-
The market crisis everyone talks about is largely the result of the overheated market during the coronavirus pandemic. 2023 turned out to be heterogeneous - there was both a general decline in new revenue-generating projects in the top 1000 and the emergence of global hits in the highest quantity in the last 5 years.
Circana: The US gaming market in January 2024 grew by 15%
Overall market condition
-
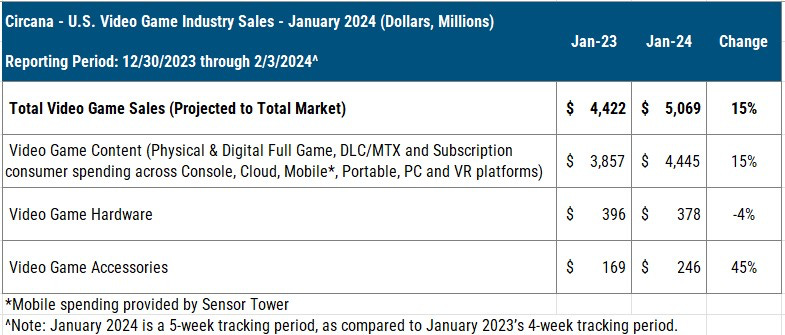
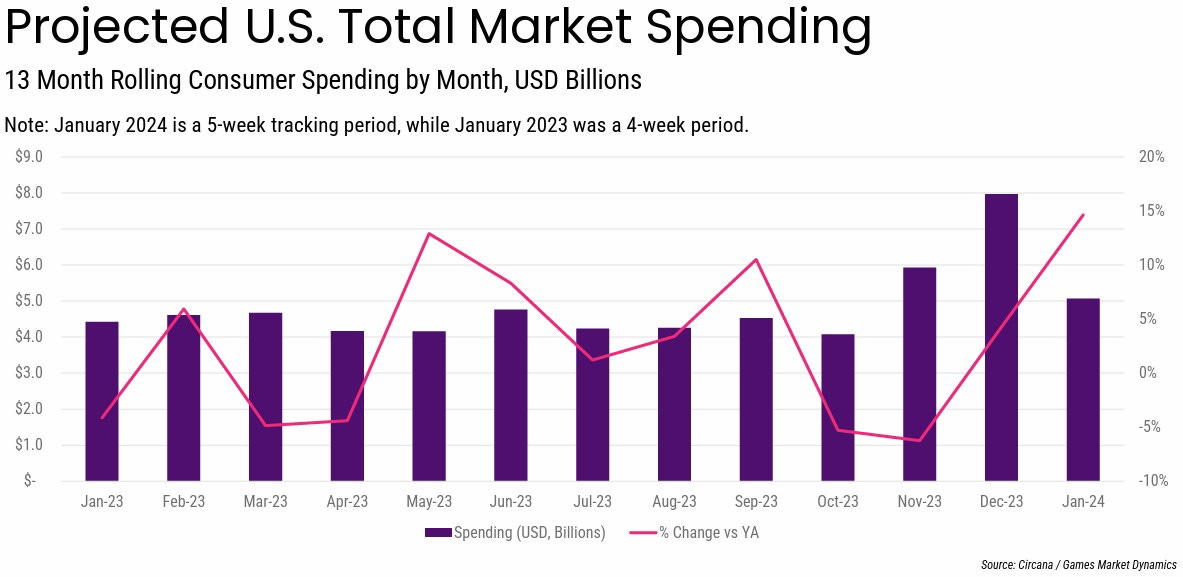
American users spent $5.069 billion on games in January 2024. This is 15% more than the previous year, but there is a nuance - in 2023 there were 4 weeks in the month, and in 2024 there were 5.
-
Users spent more on games on consoles, PC, and VR in January 2024. Revenue from mobile games grew by 5%.
-
Console sales in the USA in January 2024 amounted to $378 million. A decrease compared to January 2023 was 4%.
-
PlayStation 5 was the best-selling console in January 2024; Nintendo Switch came in second. Xbox Series increased its dollar sales but remained in third place.
-
After 39 weeks of sales, PS5 in the USA sells 7% better than PS4 and 68% better than PS3.
-
Accessory sales in January amounted to $246 million - 45% more than the previous year. Spending on gamepads grew the most (by 50%), with DualSense Edge being the best-selling accessory.
-
PlayStation Portal continues to sell actively, but Matt Piscatella notes that production volumes are not very high.
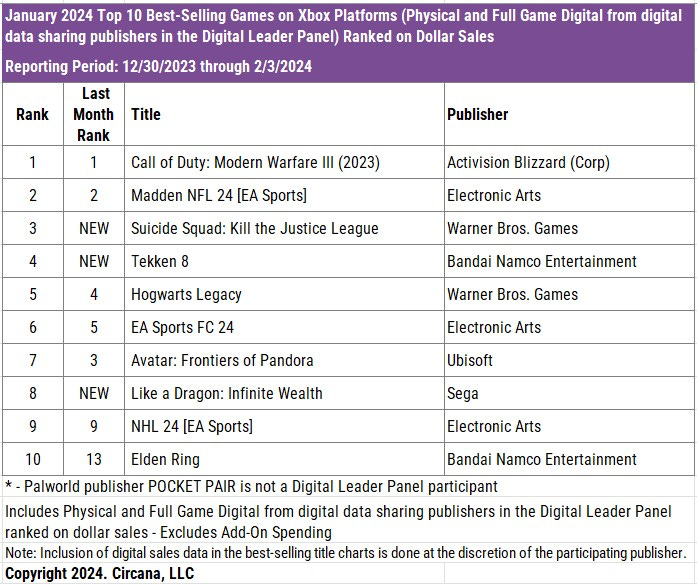
Game sales
-
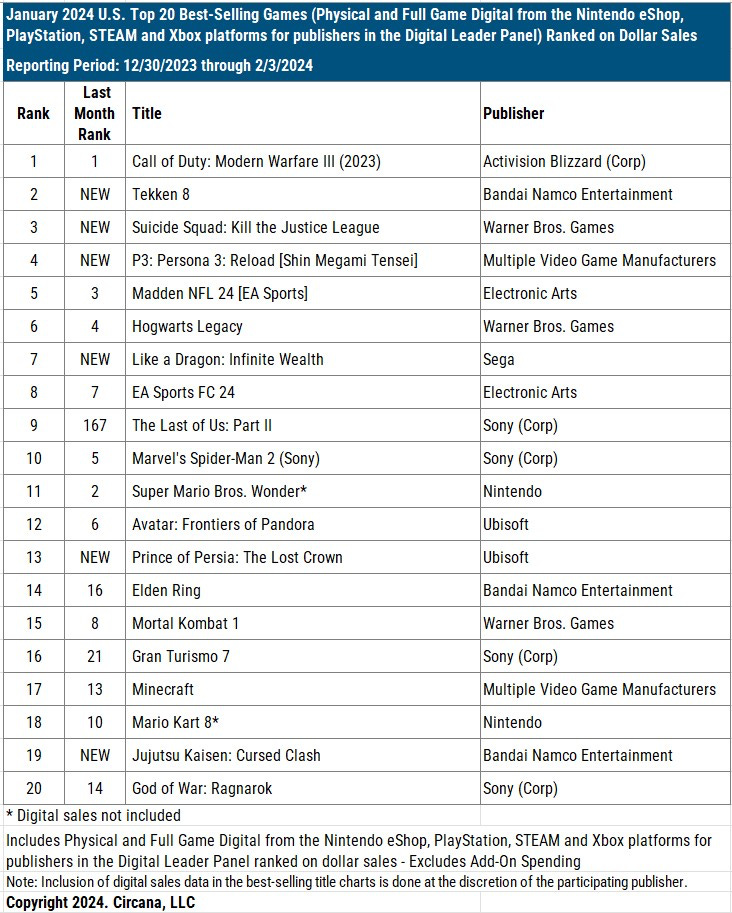
5 new projects appeared in the top 20 by sales in January. Tekken 8 ranked second; Suicide Squad: Kill the Justice League ranked third; Persona 3: Reload ranked fourth; Like a Dragon: Infinite Wealth ranked 7th; Prince of Persia: The Lost Crown ranked 13th; Juijutsu Kaiden: Cursed Clash ranked 19th.
-
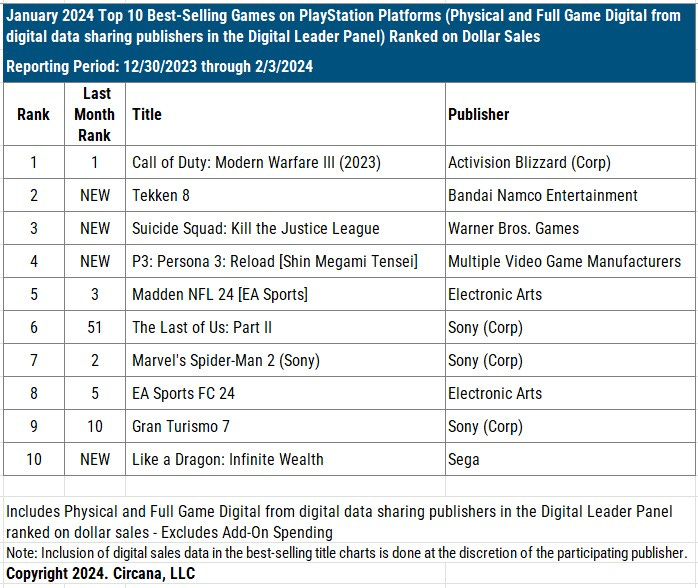
On PlayStation, Call of Duty: Modern Warfare III topped the sales chart. Tekken 8 came in second; Suicide Squad: Kill the Justice League came in third.
-
Gran Turismo 7 became the second best-selling game in the series in the USA. Currently, it is only surpassed by Gran Turismo 3: A-Spec.
-
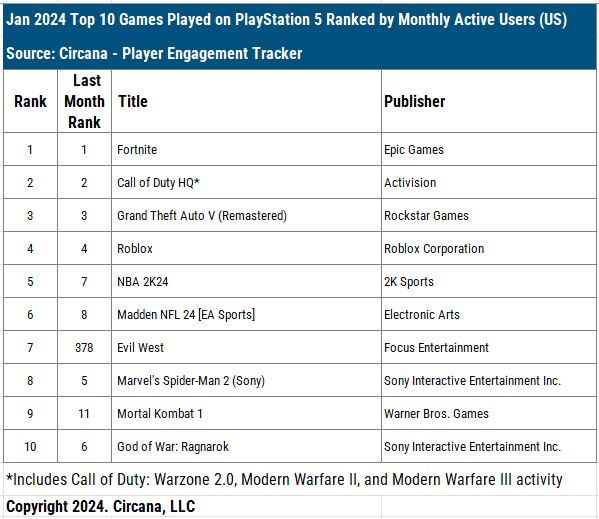
In January, the unchanged leaders in MAU on PS5 are Fortnite; games from the Call of Duty series and GTA V.
-
Evil West, thanks to being added to PlayStation Plus, took the 7th position in MAU.
-
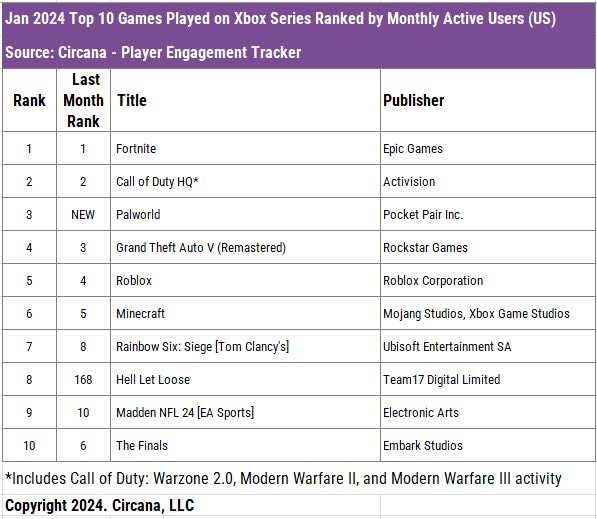
On Xbox, the picture is similar, with Palworld taking third place.
-
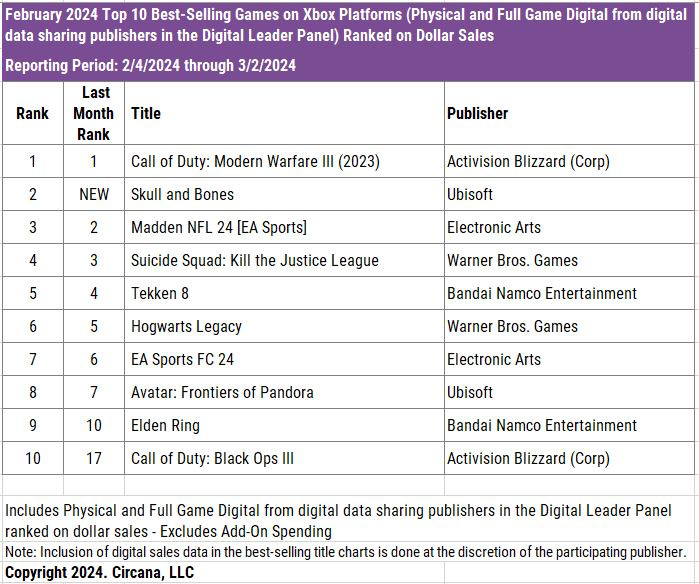
Interestingly, Palworld is not in the sales charts on Xbox - apparently, a large portion of people took the game in Game Pass. Call of Duty: Modern Warfare III is at the top of the sales chart, Madden NFL 24 is second, Suicide Squad: Kill the Justice League is third.
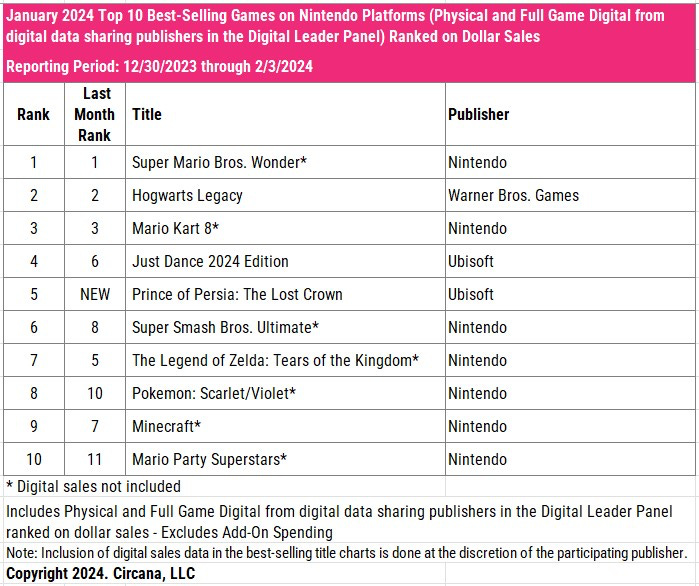
-
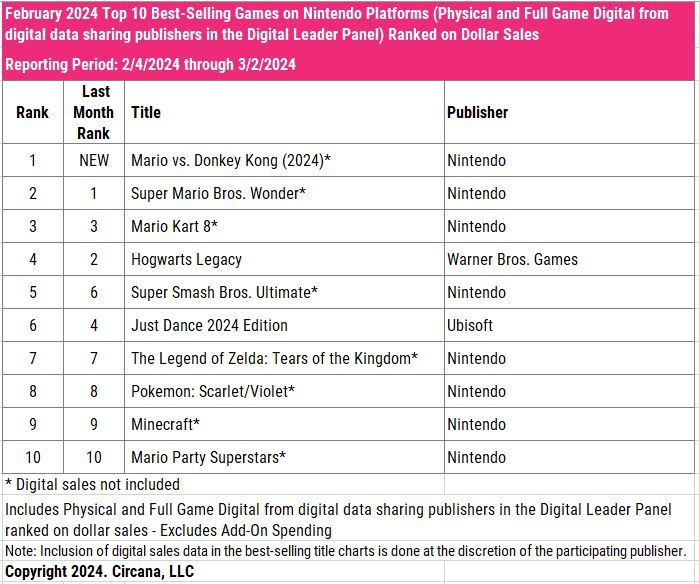
Sales on Nintendo remain stable. Super Mario Bros. Wonder leads, Hogwarts Legacy is in second place, and Mario Kart 8 is in third.
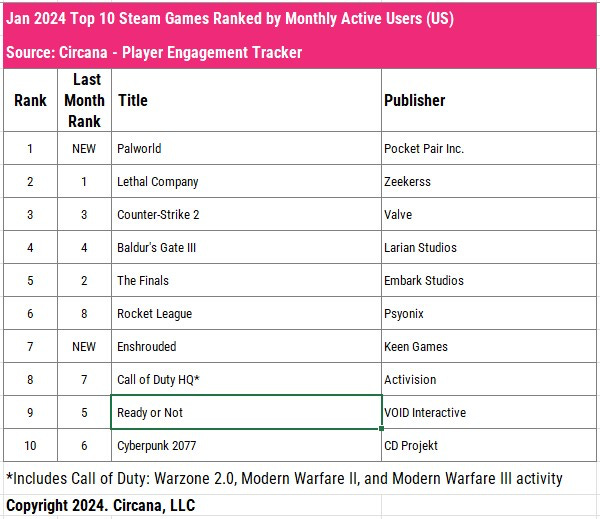
-
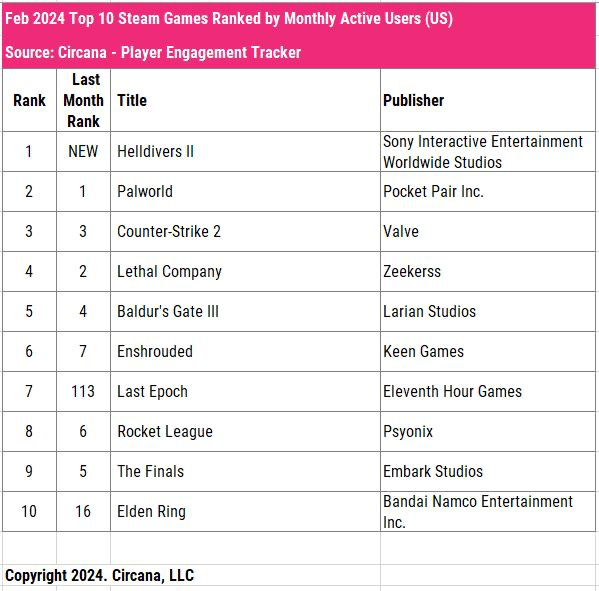
On Steam, Palworld is in first place in MAU. Lethal Company is in second place, Counter-Strike 2 is third. It's surprising that Baldur’s Gate III - without multiplayer functionality - maintains the fourth position.
-
Sensor Tower notes that MONOPOLY GO!, Royal Match, and Roblox continue to lead in revenue in the USA. Among the newcomers to the top 10 in January are Township and Whiteout Survival.
data.ai: Mobile Gaming Market in 2024
data.ai presents revenue in Gross.
Revenue
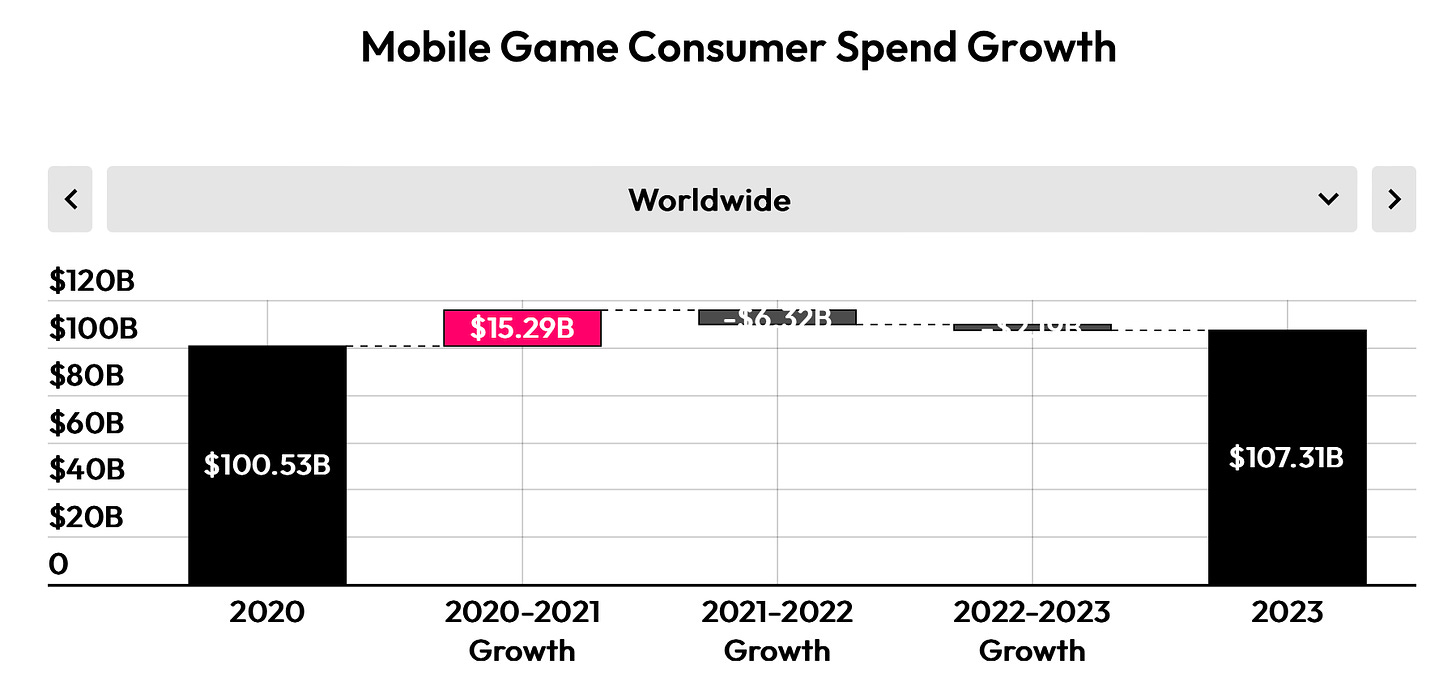
- In total, games earned $107.3 billion - 2% less than in 2022. Here, data.ai takes into account third-party Android stores in China.
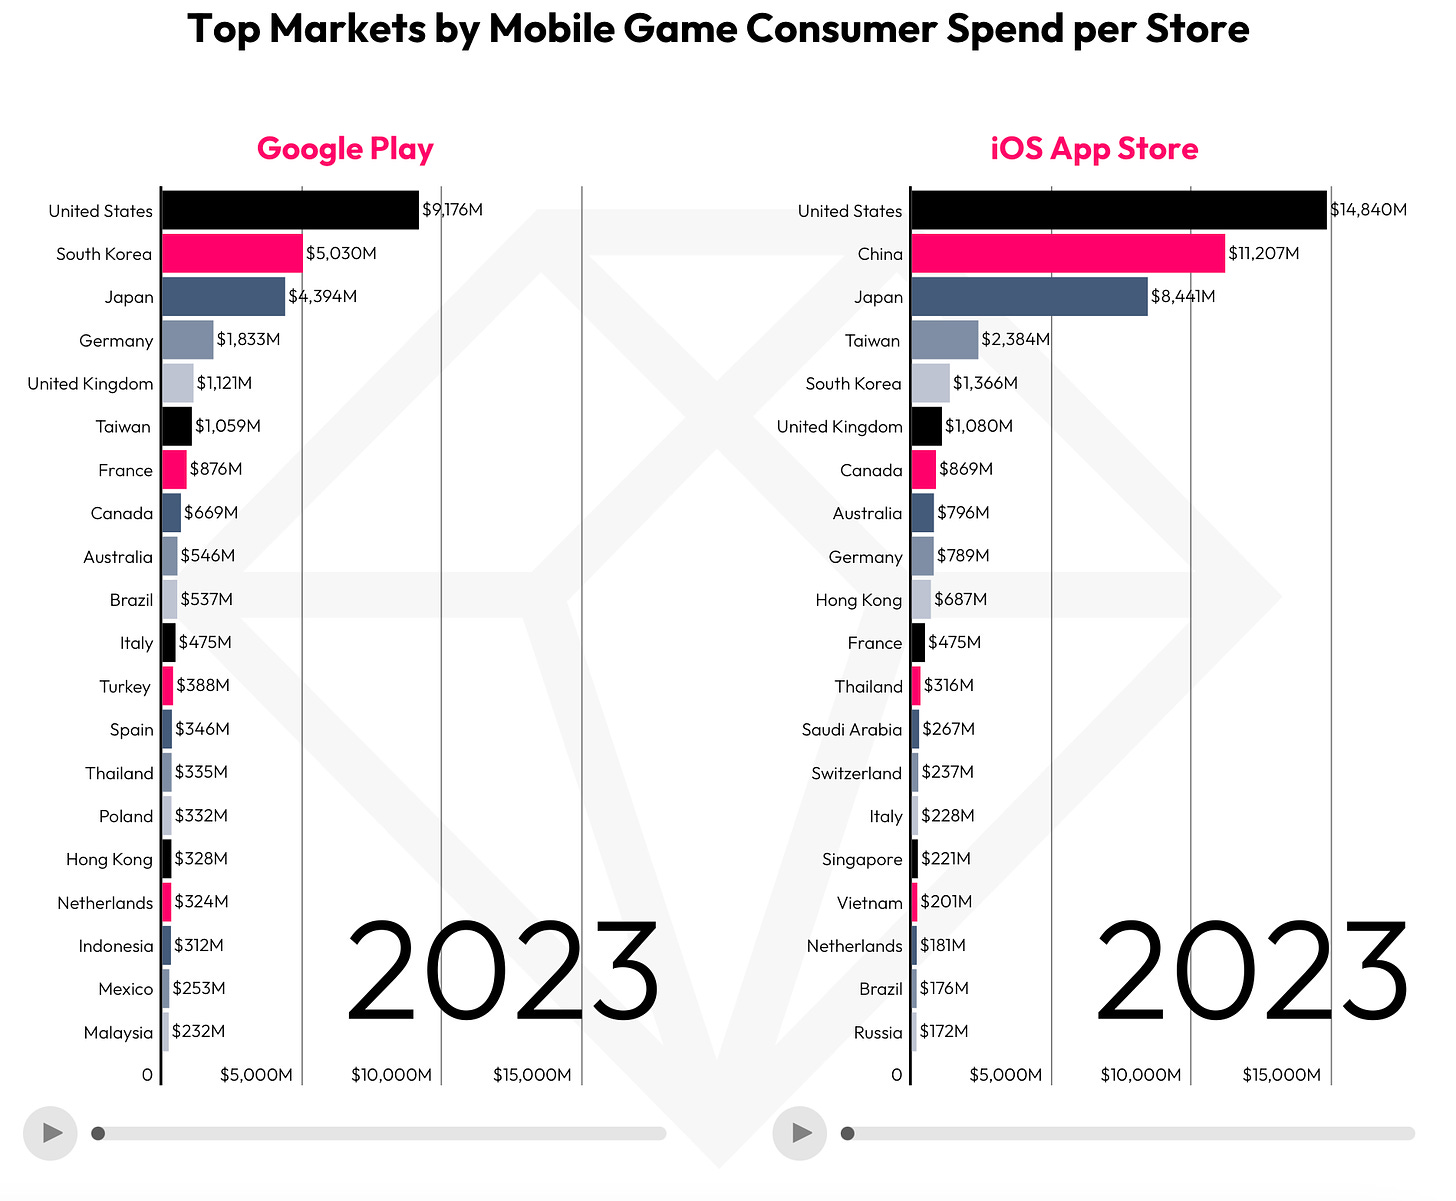
- The United States ($9.2 billion), South Korea ($5 billion), and Japan ($4.4 billion) are the largest countries in terms of revenue on Android. On iOS, the leadership belongs to the United States ($14.8 billion), China ($11.2 billion), and Japan ($8.4 billion).
-
The North American market saw a decrease in revenue by approximately 1% in 2023. The share of the APAC region decreased from 51% in 2022 to 49% in 2023. South Korea saw a revenue increase of 21% in 2023.
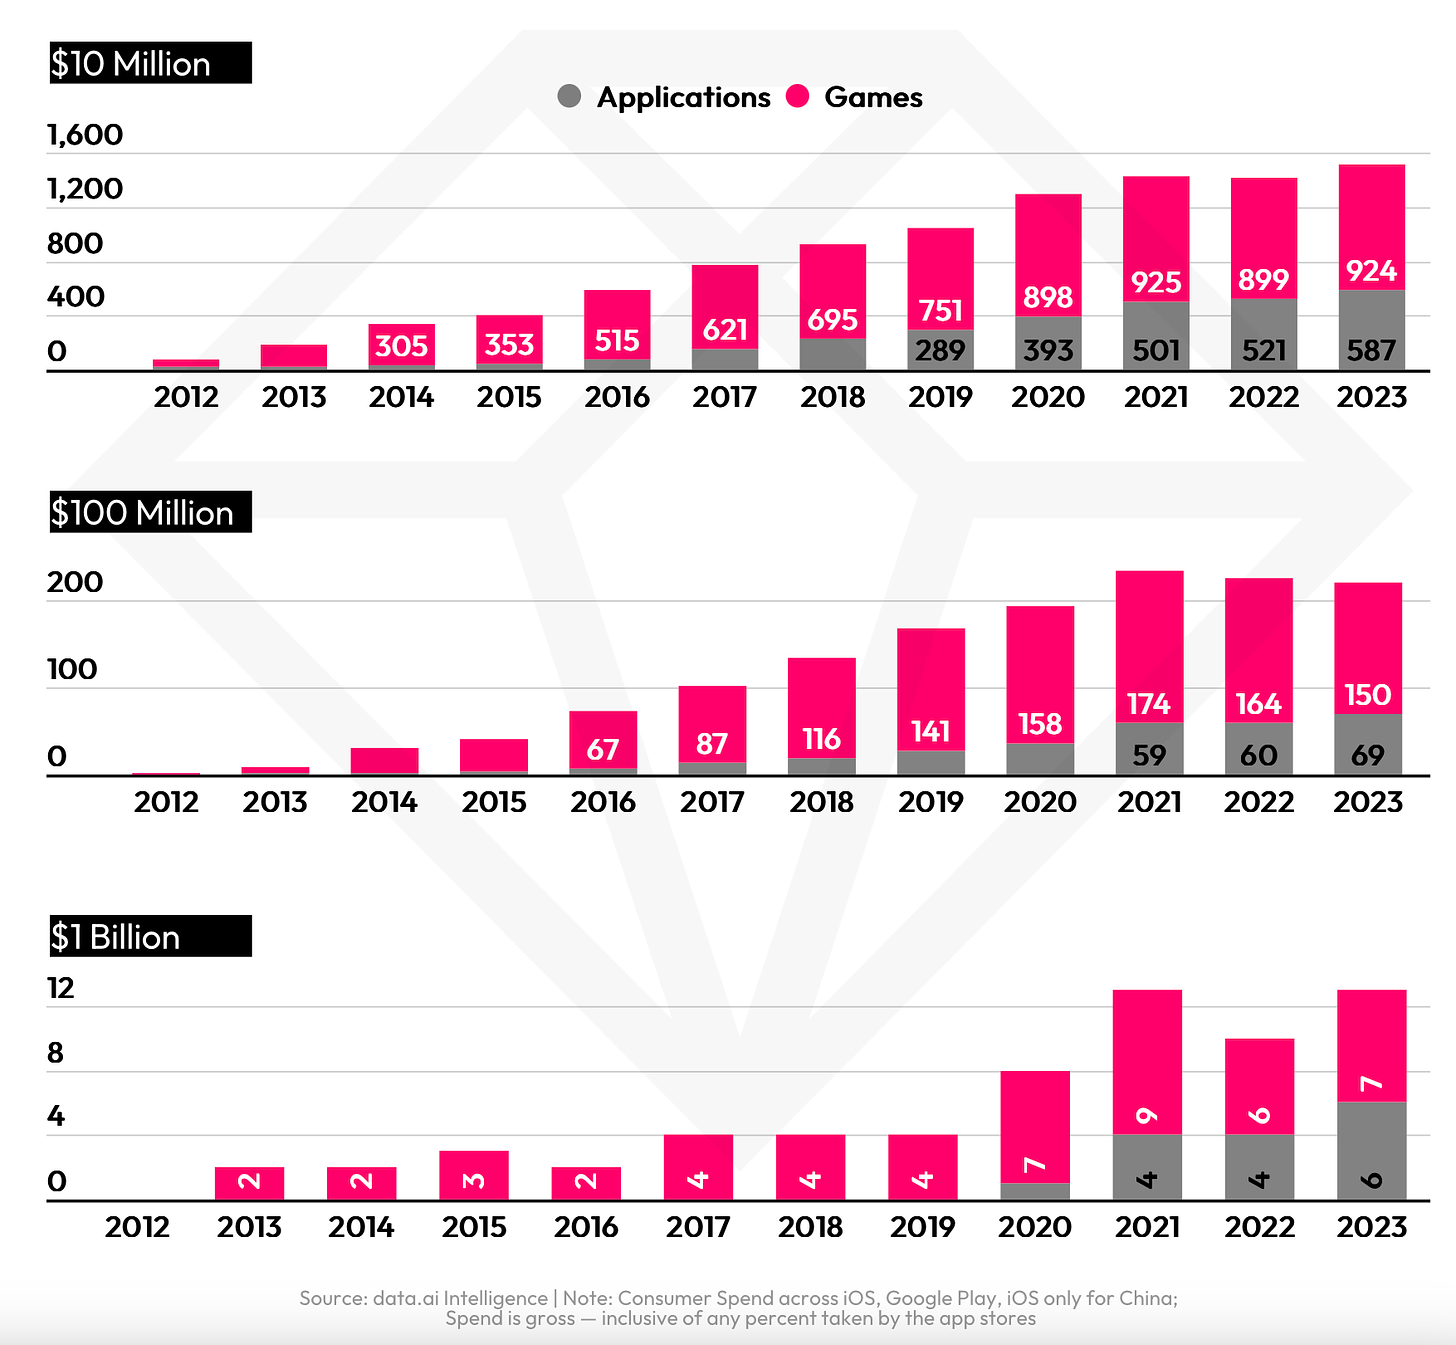
-
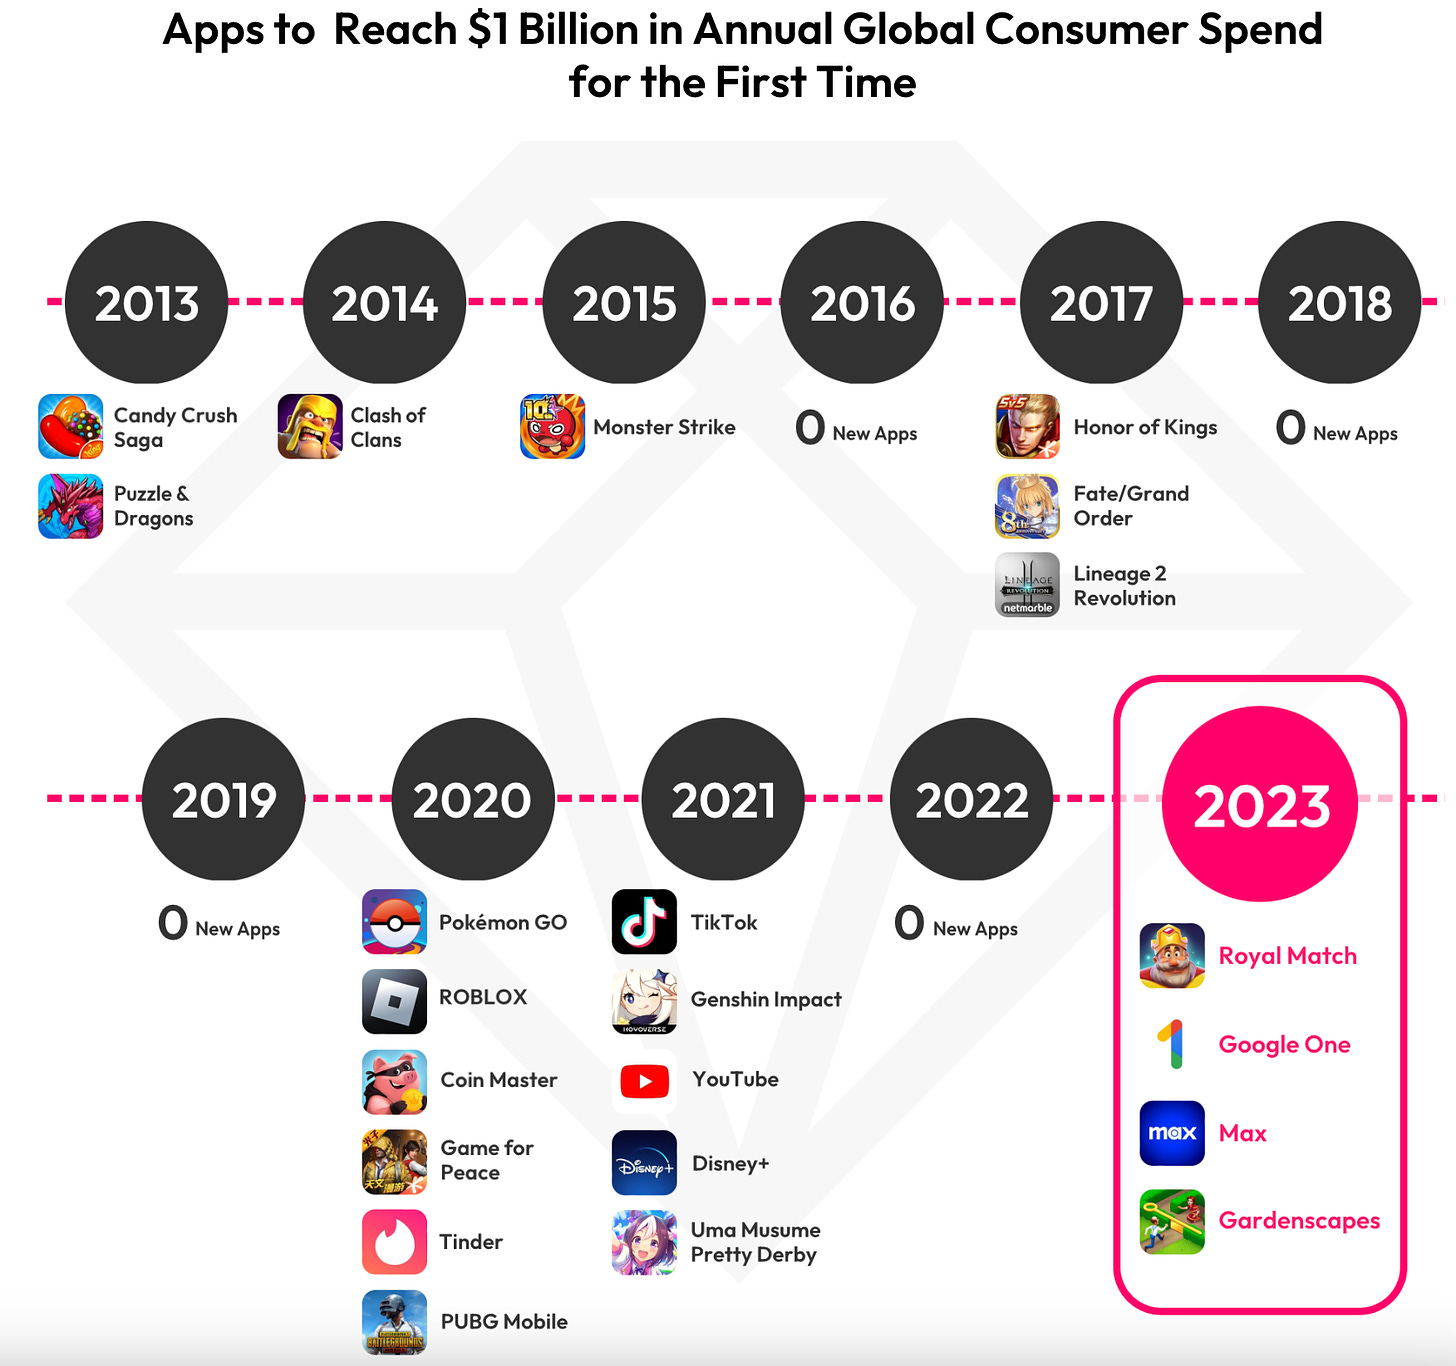
In 2023, there were 924 projects with annual revenue exceeding $10 million. 150 games surpassed the $100 million mark. Finally, 7 projects earned over $1 billion in 2023. 2021 remains the best year in terms of revenue in the market.
-
Royal Match and Gardenscapes earned over $1 billion annually for the first time.
-
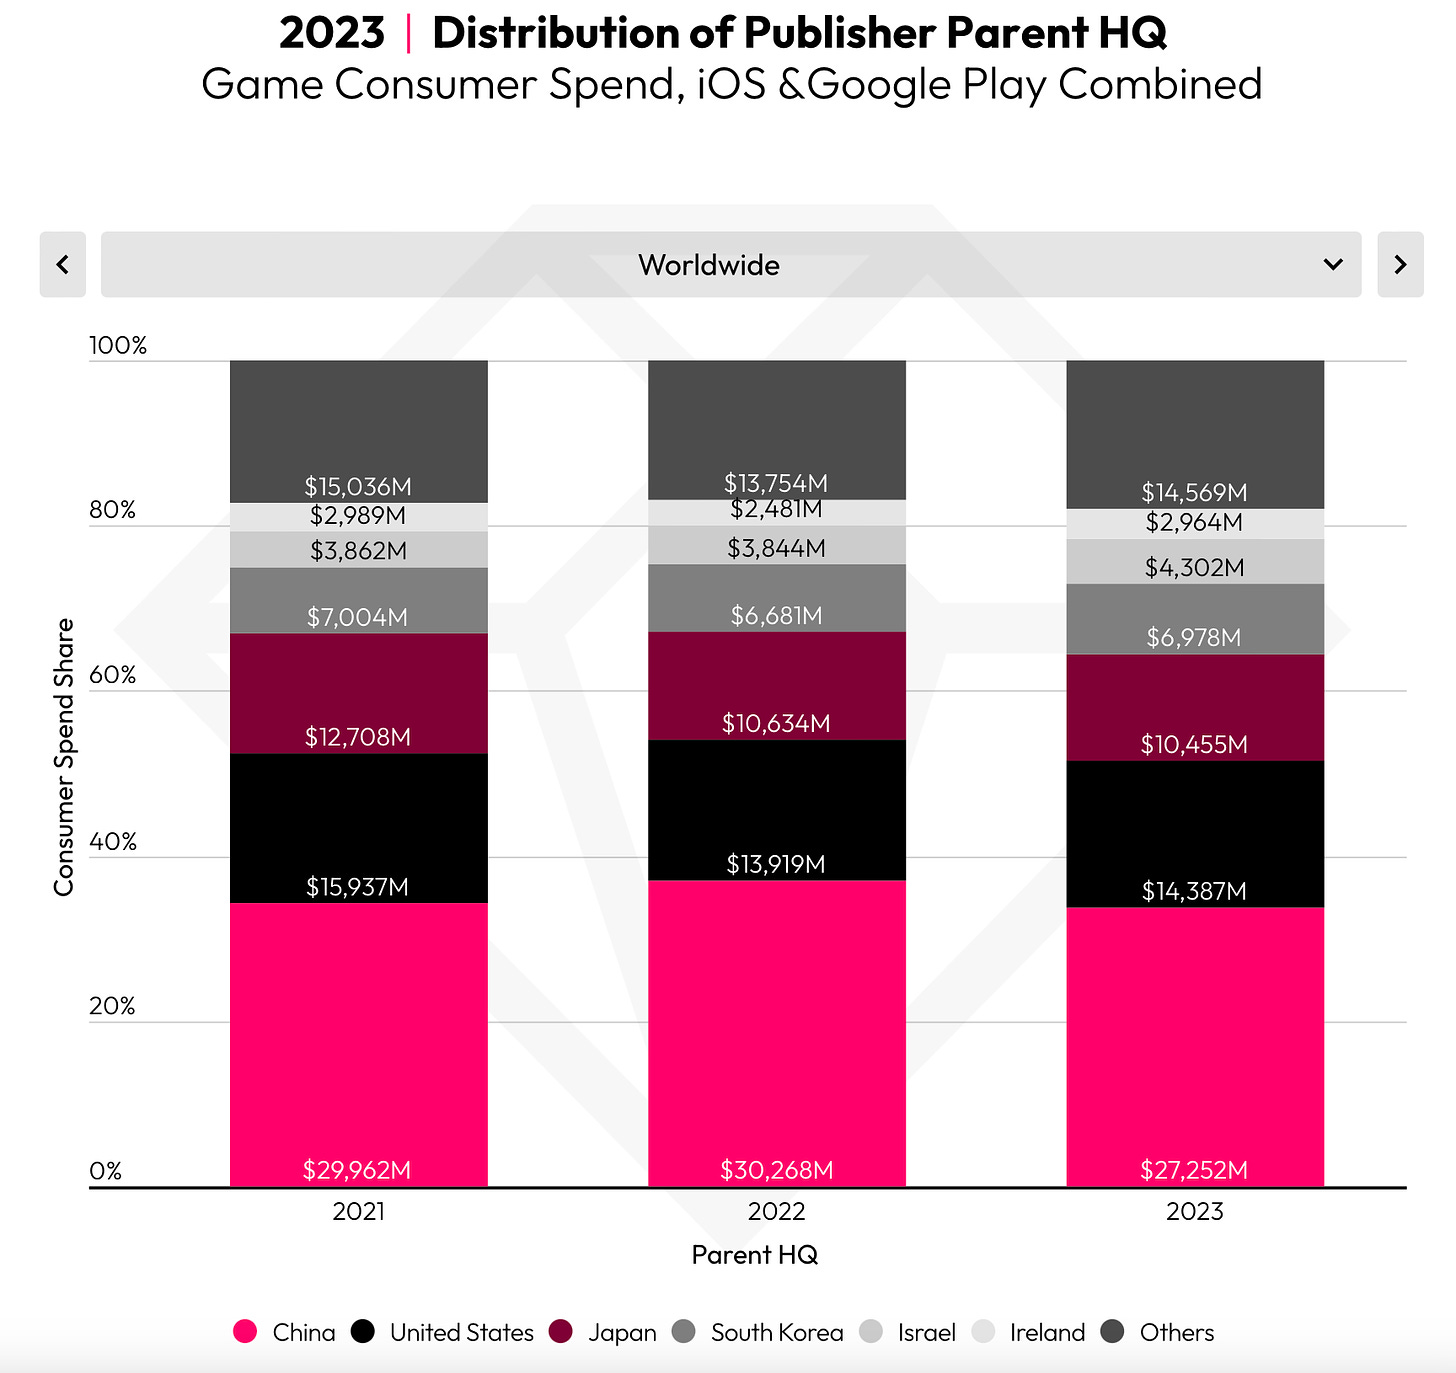
Mobile companies headquartered in China earned $27.3 billion in 2023. This constitutes a quarter of the entire gaming industry volume.
Player Behavior
-
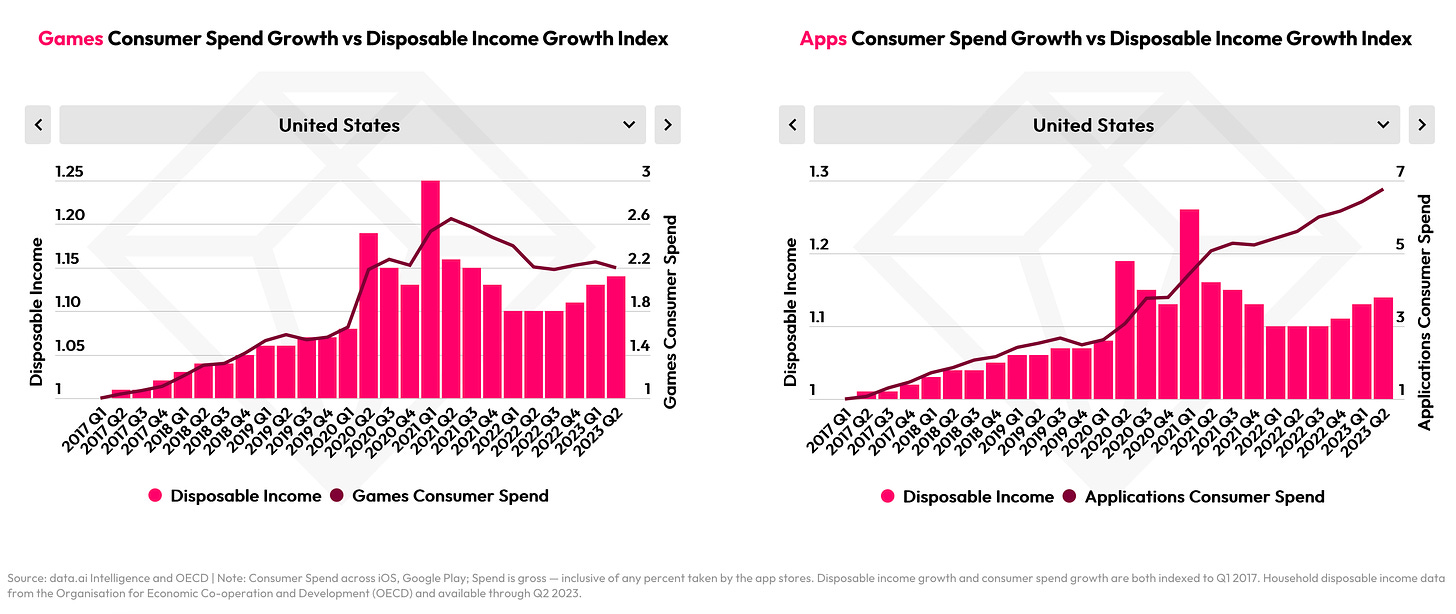
User spending on games in Tier 1 countries correlates with real income levels. People are willing to reduce game spending when their income decreases.
-
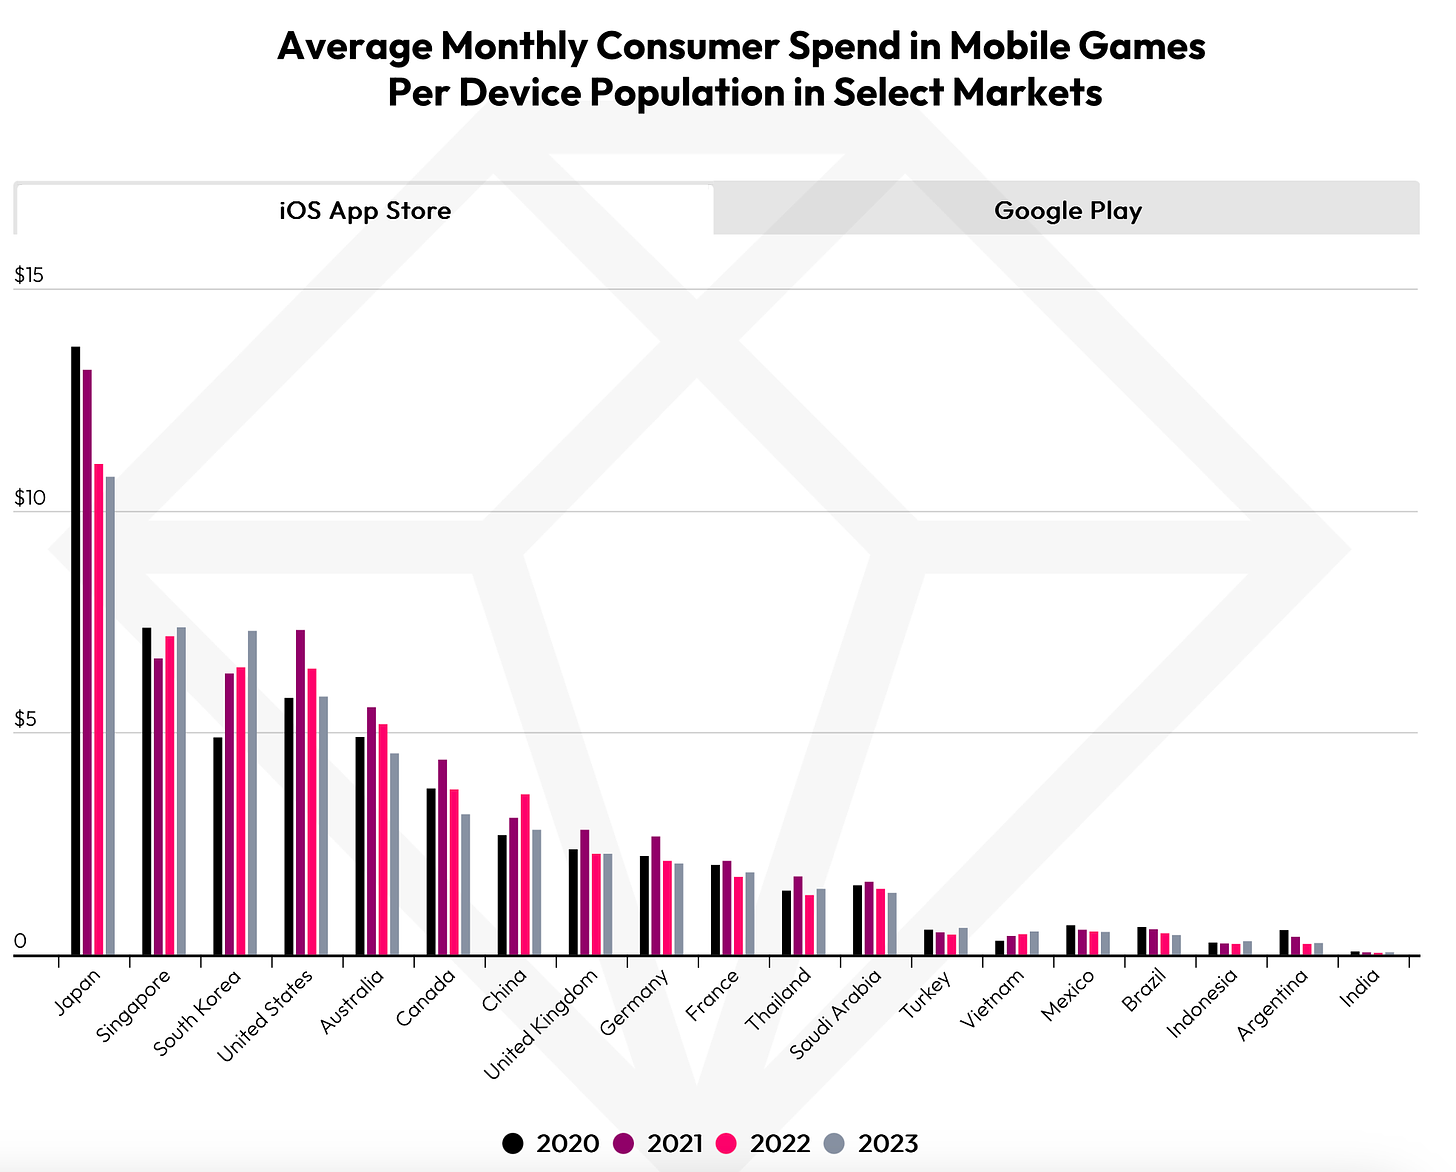
Japan leads in monthly spending on iOS games - $10.76. South Korea leads in Google Play figures - people spend $11.38 on games per month. However, data.ai notes that monthly spending across almost all regions has returned to pre-pandemic levels.
-
In 2024, many people are considering optimizing their budgets.
-
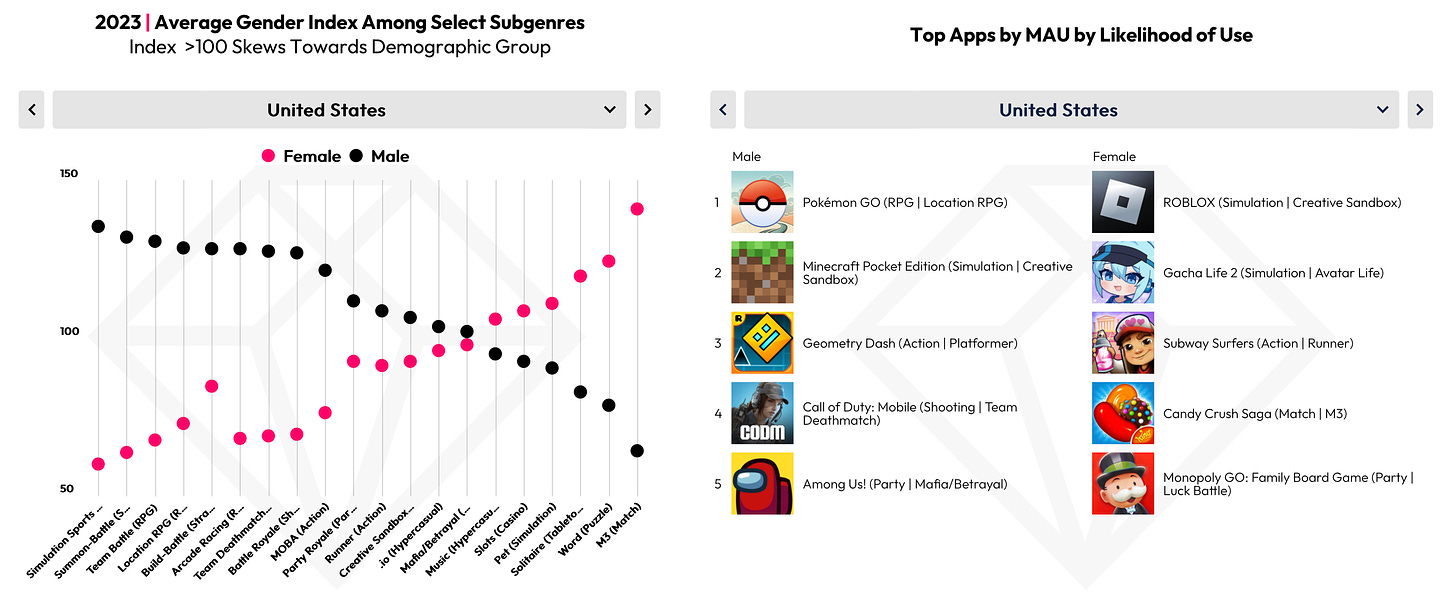
Younger generations prefer sandboxes, racing, and RPGs. Older players prefer Match 3, solitaire, and slots.
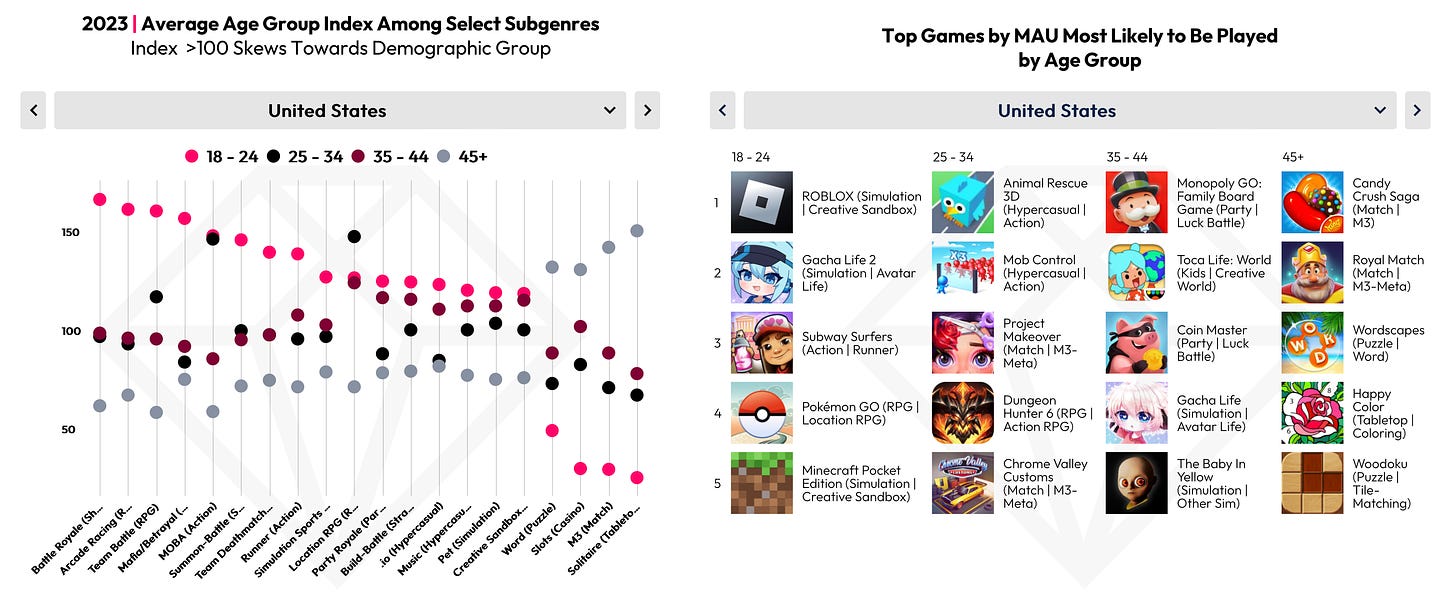
-
Female are more likely to play Match 3 and word games, while men are more inclined towards Team Battle RPGs, MOBAs, and sports games.
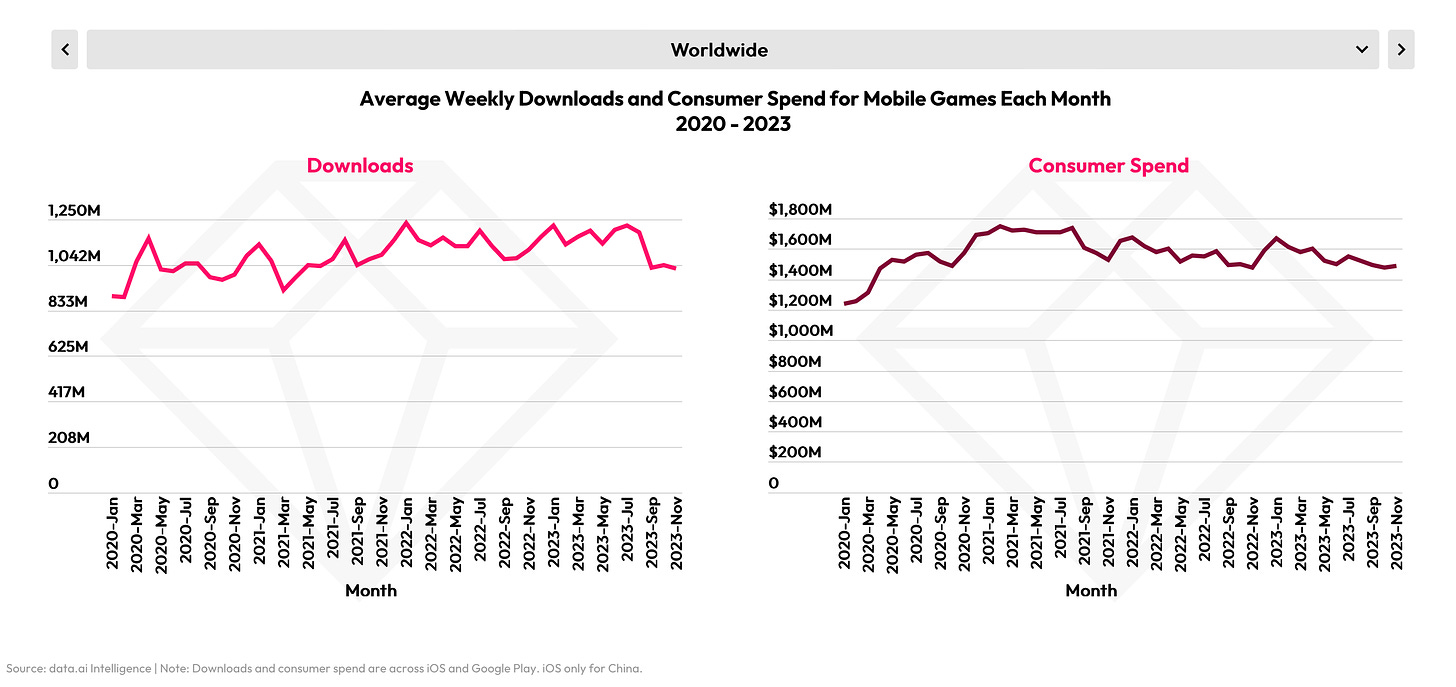
Downloads
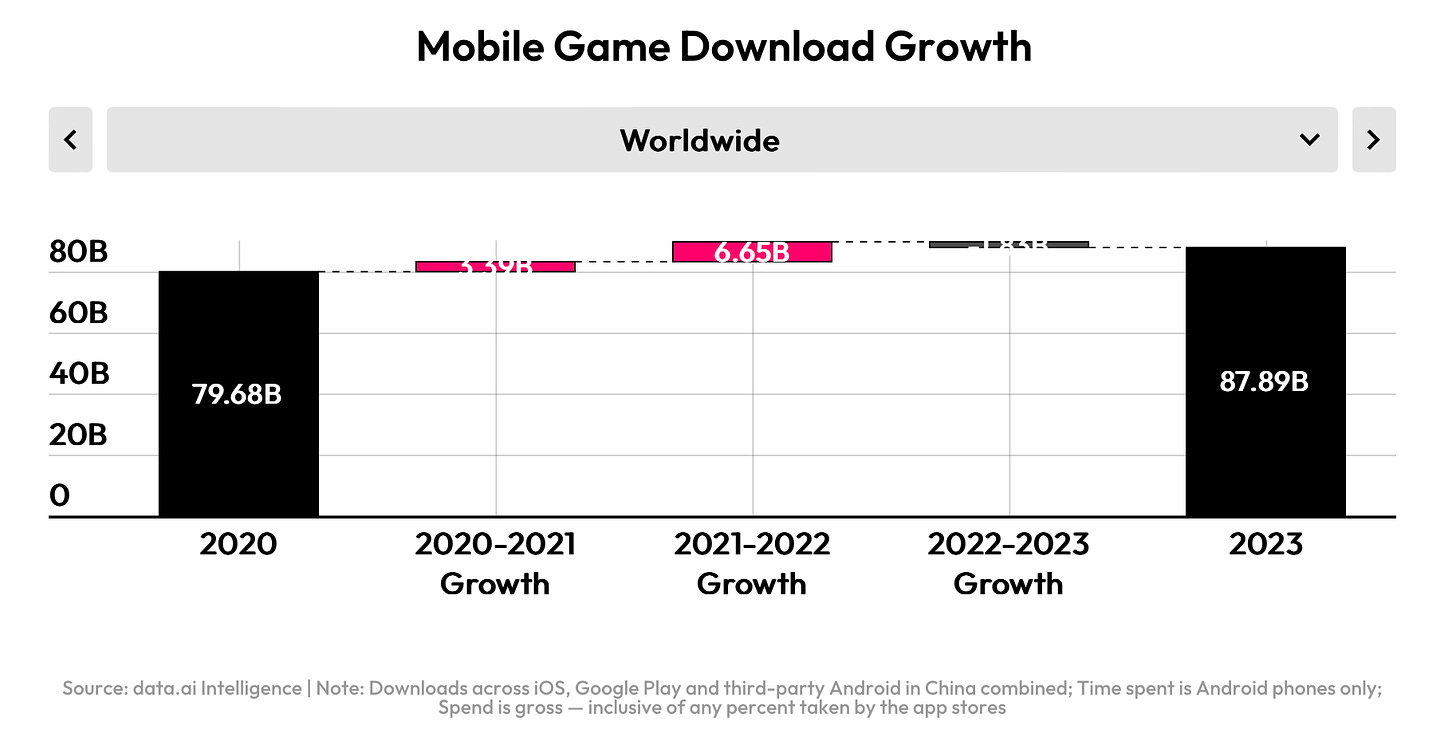
-
The number of game downloads decreased by 2% compared to the previous year, totaling 88 billion. This is the first decline since 2020.
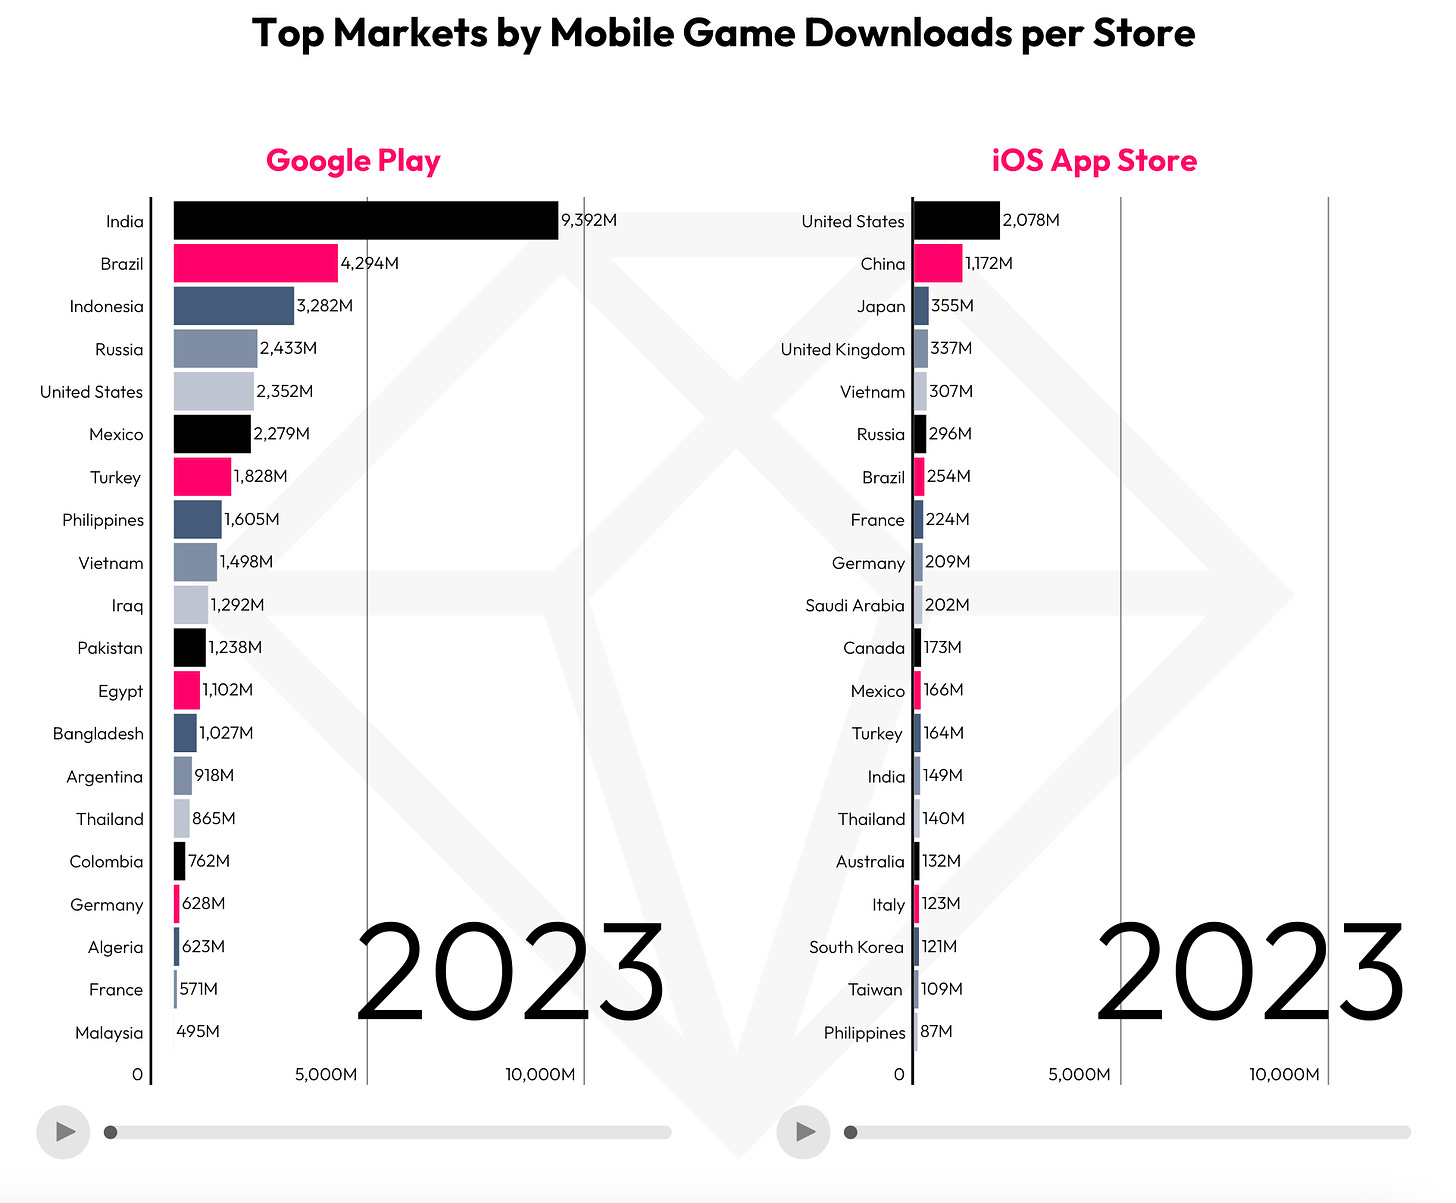
-
India (9.4 billion), Brazil (4.3 billion), and Indonesia (3.3 billion) lead in downloads on Google Play. On iOS, the leaders are the United States (2.1 billion), China (1.2 billion), and Japan (355 million). However, iOS downloads in the United States have been declining for the third consecutive year.
Advertising Market
-
Spending on mobile advertising in 2023 amounted to $362 billion. data.ai predicts that in 2024, spending will increase to $402 billion. This indicates that the influence of advertising revenue on mobile devices is growing.
Gaming Market Situation
-
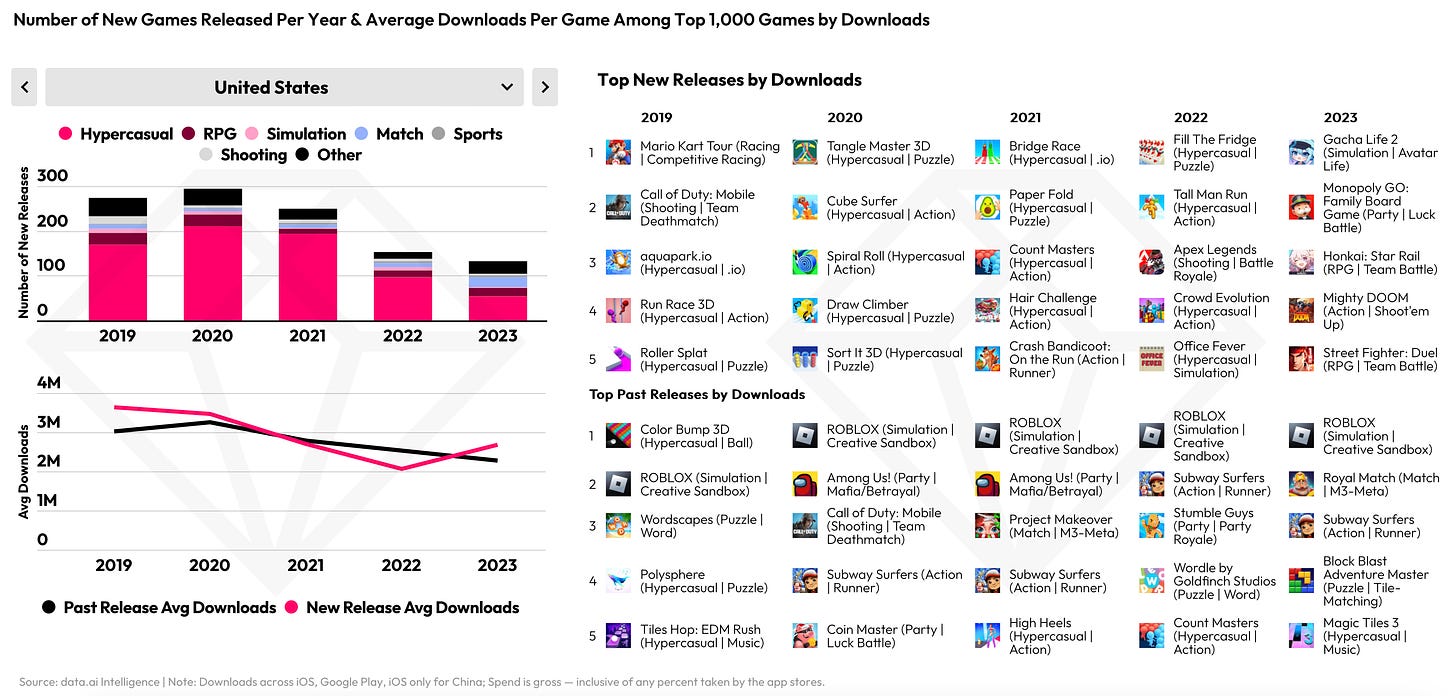
data.ai notes that the number of new games in the top 1000 by downloads has been decreasing since 2020. In some Asian markets (such as the United States and South Korea), there was a slight increase in 2023. However, in most cases, new projects receive fewer downloads.
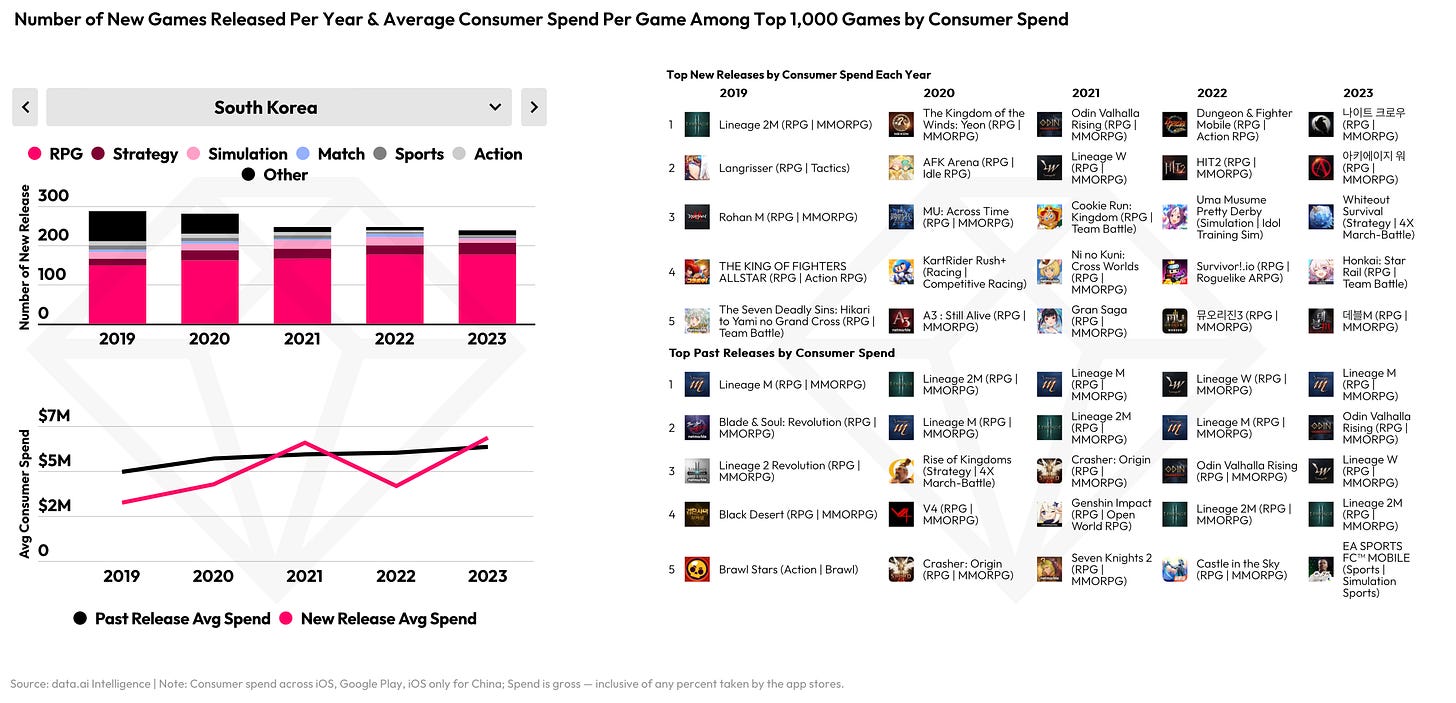
-
Revenue from old projects continues to dominate a large part of the gaming market, and user spending on new projects has not yet exceeded expenses on old ones in any of the data.ai markets listed, except for South Korea and Singapore.
However, positive changes are visible in several markets - Canada, China, Vietnam, and the United Kingdom. The ratio of revenue from new games to old ones has begun to change in favor of the former.
Trends by genre from data.ai have been already covered here.
game: Only 12% of German gaming companies are confident in the growth of the gaming market in 2024
-
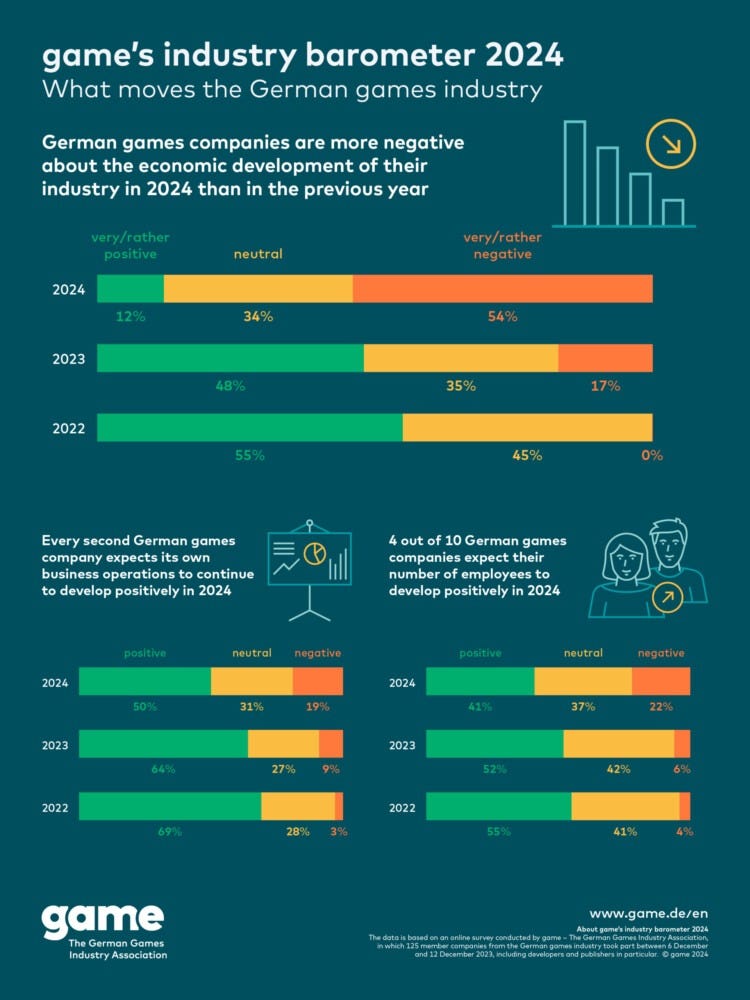
12% of those surveyed believe that the gaming market will grow. 34% are neutral, and 54% are confident that the situation in the gaming market will worsen. In 2023, there were four times as many positively inclined respondents.
-
At the same time, half of those surveyed are confident that their business will grow in 2024. 19% are skeptical about this prospect, while the rest are neutral. The percentage of negatively inclined respondents doubled since 2023.
-
In 2024, 41% of respondents plan to hire people. 22% believe they will have to downsize their staff (almost four times more than in 2023). 37% remain neutral for now.
StreamElements & Rainmaker.gg - State of the streaming market in January 2024
-
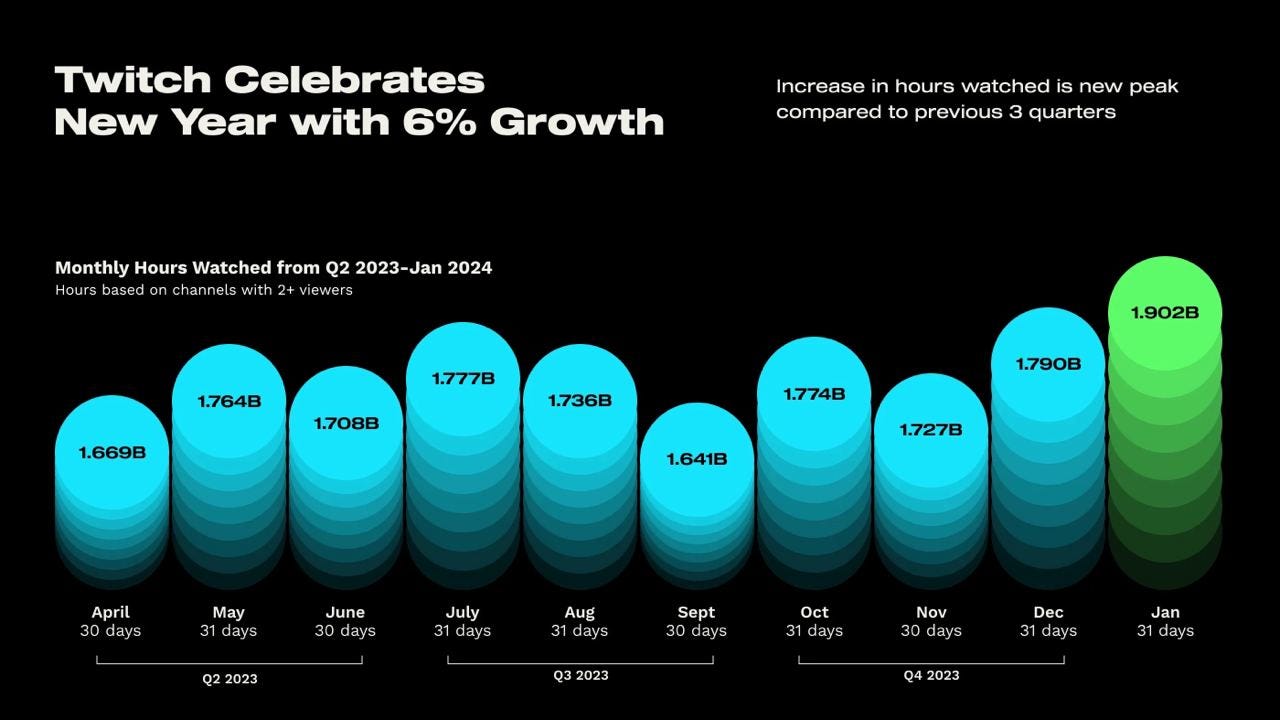
Twitch grew by 6% in terms of viewership in January 2024 compared to the previous month, reaching 1.902 billion hours watched. This is a record for the past 3 quarters.
-
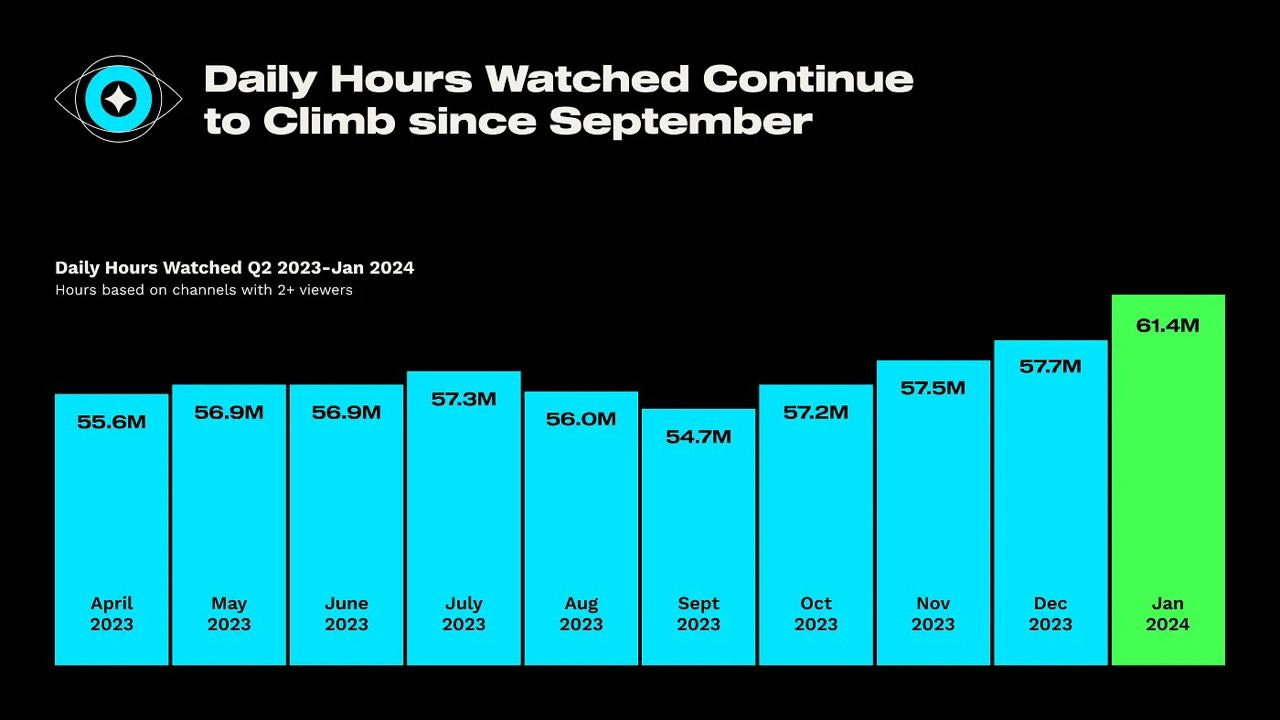
The number of hours watched per day has been increasing since September 2023. In January 2024, people watched 61.4 million hours of content per day.
-
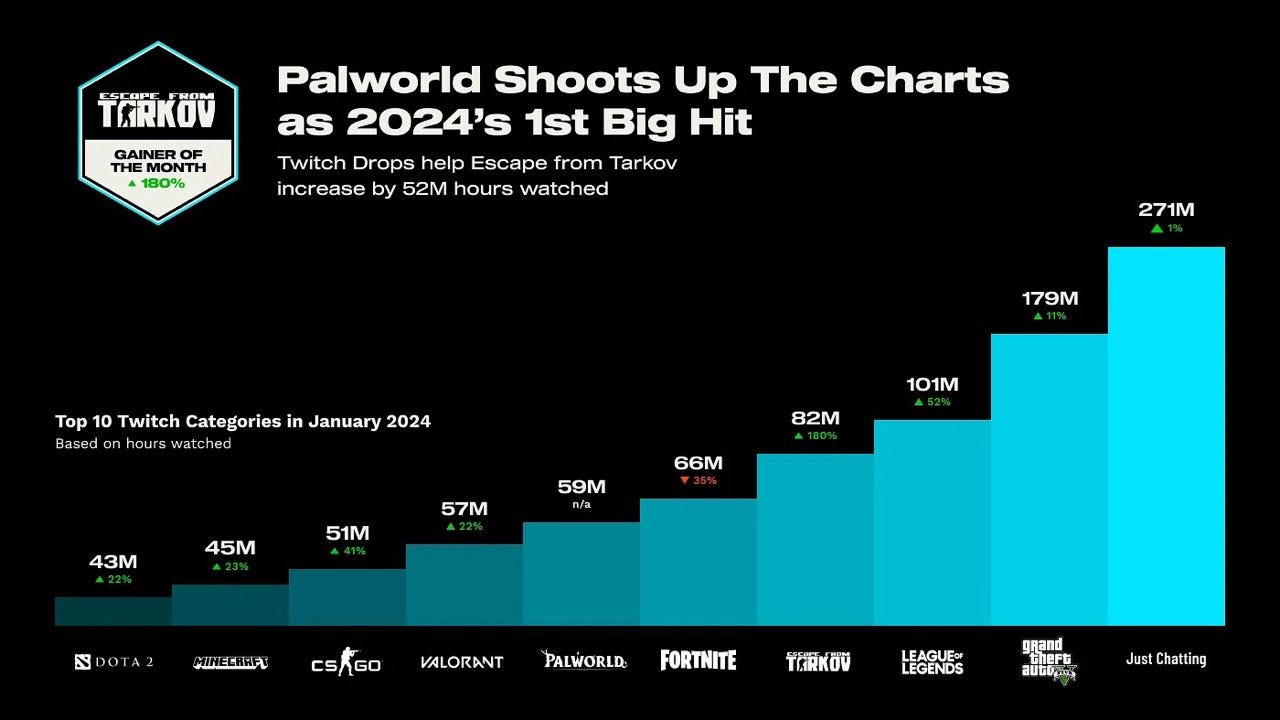
Palworld - the first hit of 2024 - received 59 million hours of views in January 2024.
-
Grand Theft Auto V - the most viewed game in January. It had 179 million hours (+11% compared to the previous month); in second place - League of Legends - 101 million hours (+52%); in third place - Escape from Tarkov - 82 million hours (+180%).
-
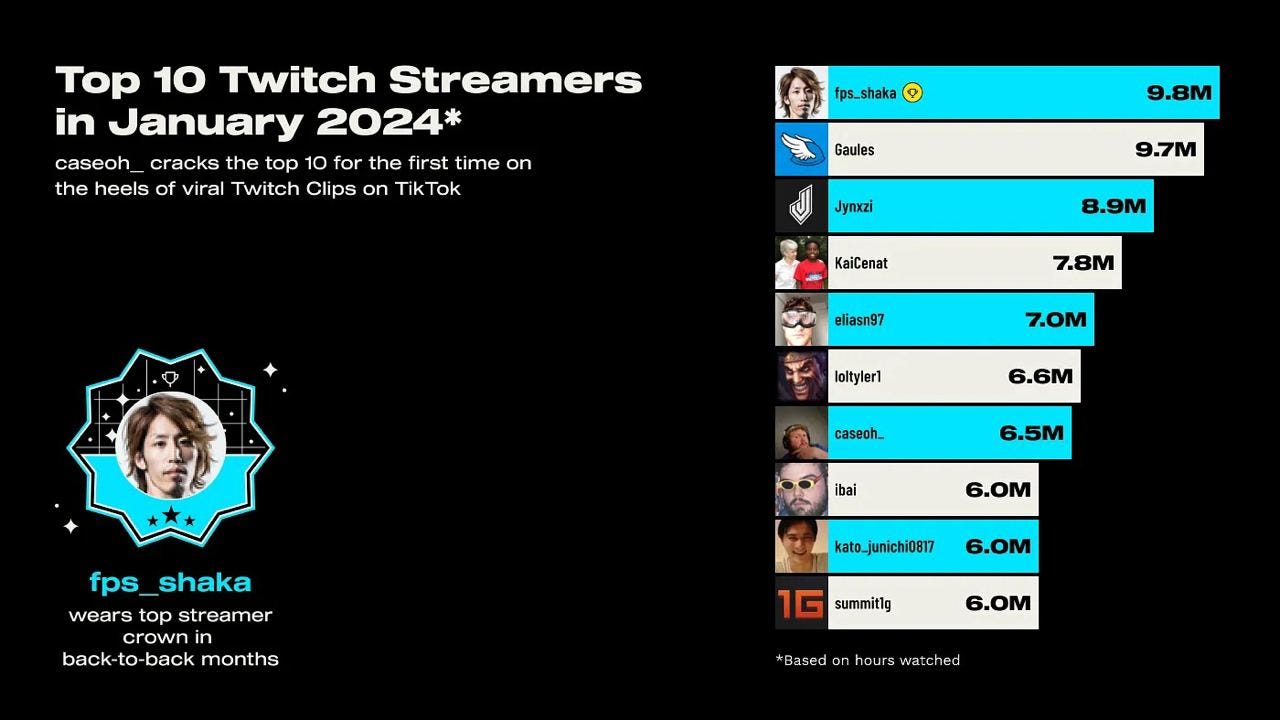
fps_shaka from Japan - the top streamer of the month. He specialized in GTA V (209 hours); but also played Palworld (50 hours) and Street Fighter 6 (50 hours).
Shorooq Partners: State of the Gaming Market in MENAP and globally in Q4 2023

Global Market Trends
-
In Q4 2023, the number of lawsuits increased by 15%. Epic Games continues to battle against tech giants; Nexon was fined $8.9 million for misleading information about item drop rates.
-
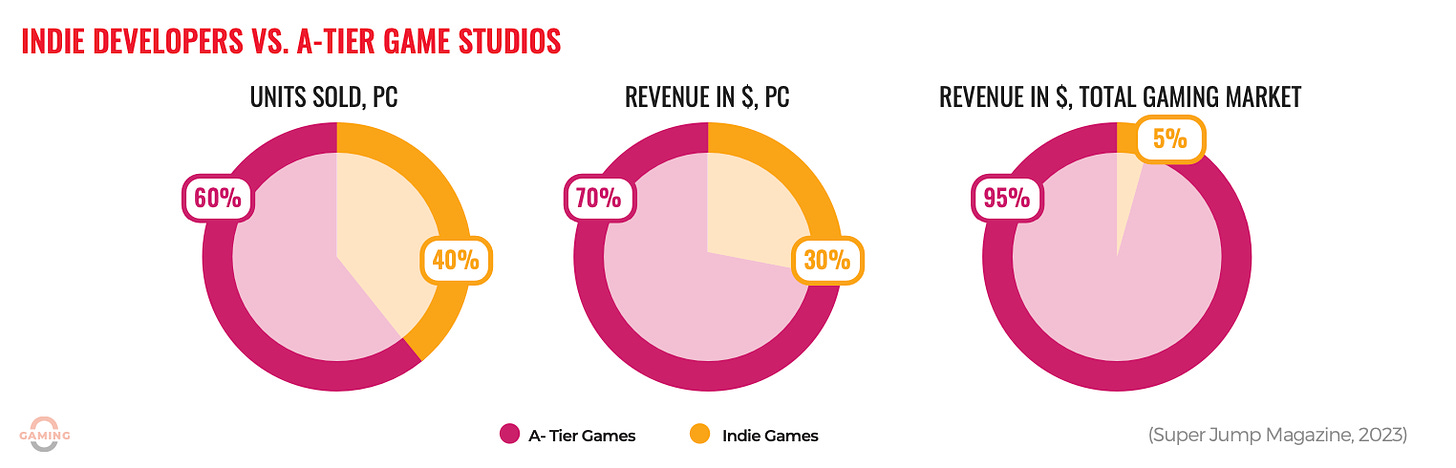
Indie developers thrive on PC. They account for 40% of all copies sold and 30% of total revenue. When considering the entire market with other platforms, indie developers only hold 5%.
-
Movies based on gaming IP earned over $1.4 billion in 2023. The main success was The Super Mario Movie; Uncharted and Gran Turismo also performed well.
MENAP Market Trends
-
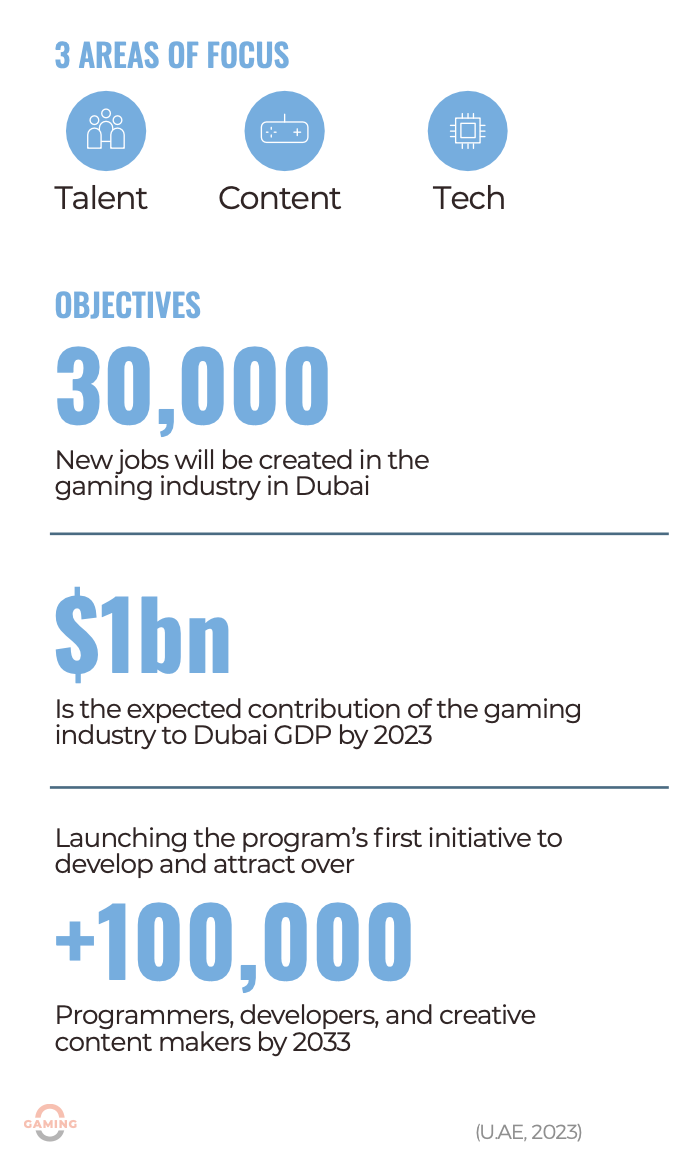
The UAE aims to become a global gaming hub by 2033. The plan includes creating over 30,000 jobs in Dubai alone, and gaming companies' contribution to the emirate's GDP should exceed $1 billion.
-
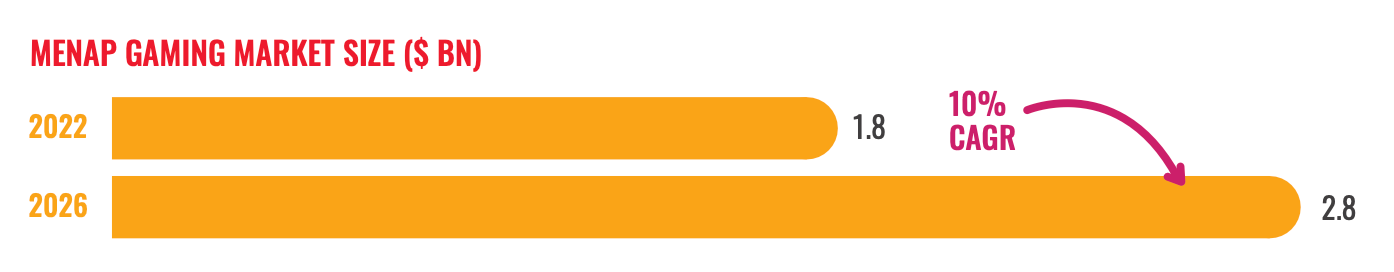
It is expected that the MENAP region will reach $2.8 billion in revenue by 2026. As of 2022, the market size was $1.8 billion.
-
The user base is forecasted to grow from 67.4 million to 87.3 million by 2026.
-
The Kingdom of Saudi Arabia is actively investing in the gaming industry. By 2030, the country aims to create over 40,000 jobs; the Savvy Games Fund has over $30 billion of unallocated budget. The country is building the futuristic city of Qiddiya City, where 30 gaming companies and 25 esports teams are expected to be located.

-
In Q4’23, there was increased activity from venture investors in the MENAP region. The most notable deals were Farcana ($10 million - developing a Web3 shooter); Rize.gg ($430,000 - an e-gaming platform); GAM3S.GG ($2 million - a Web3 platform).
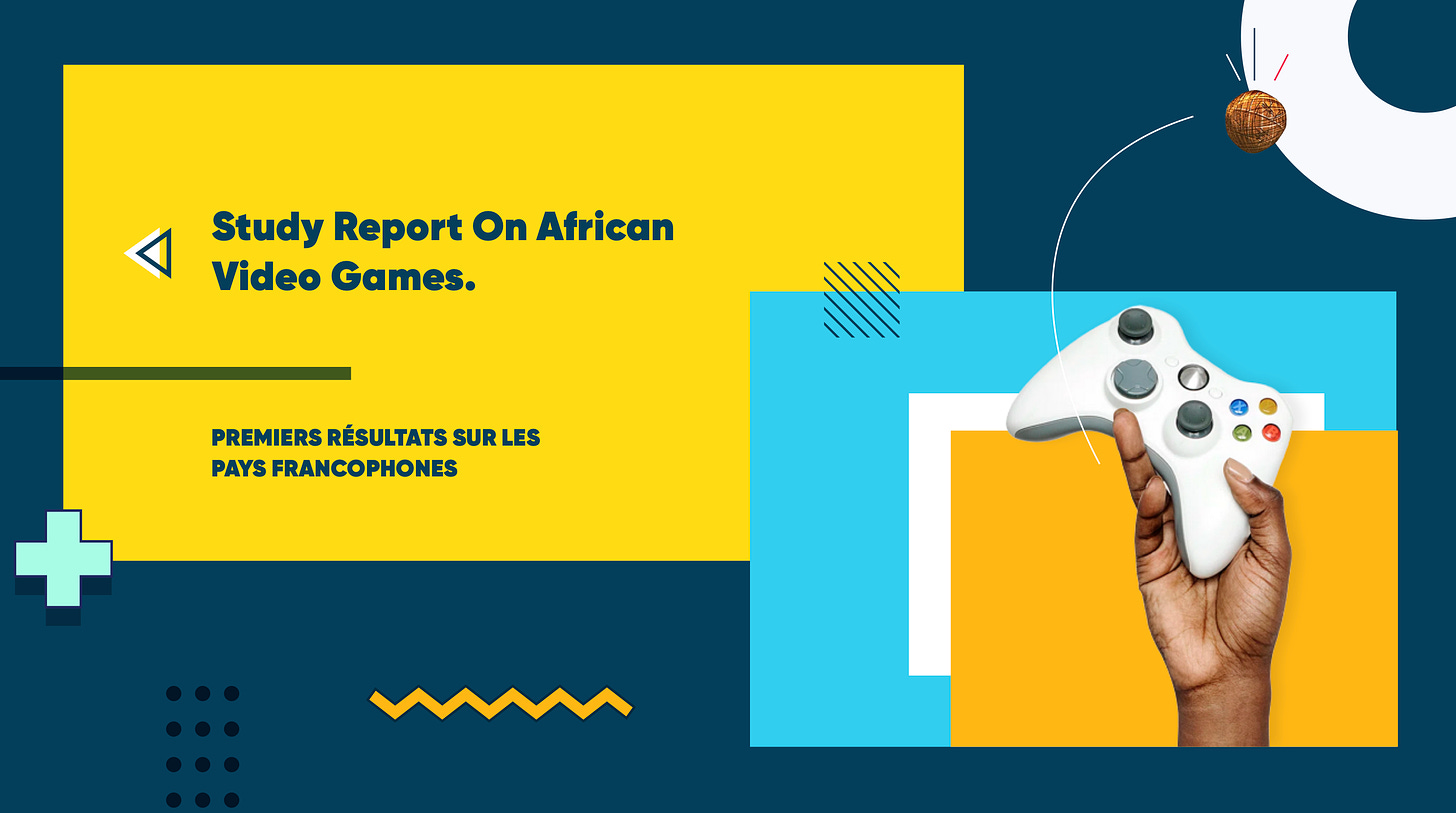
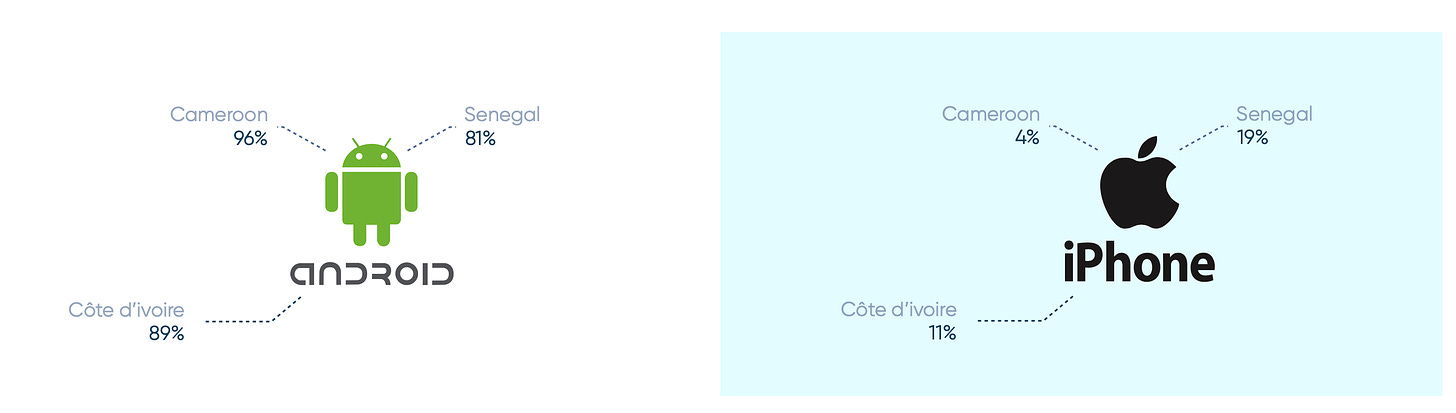
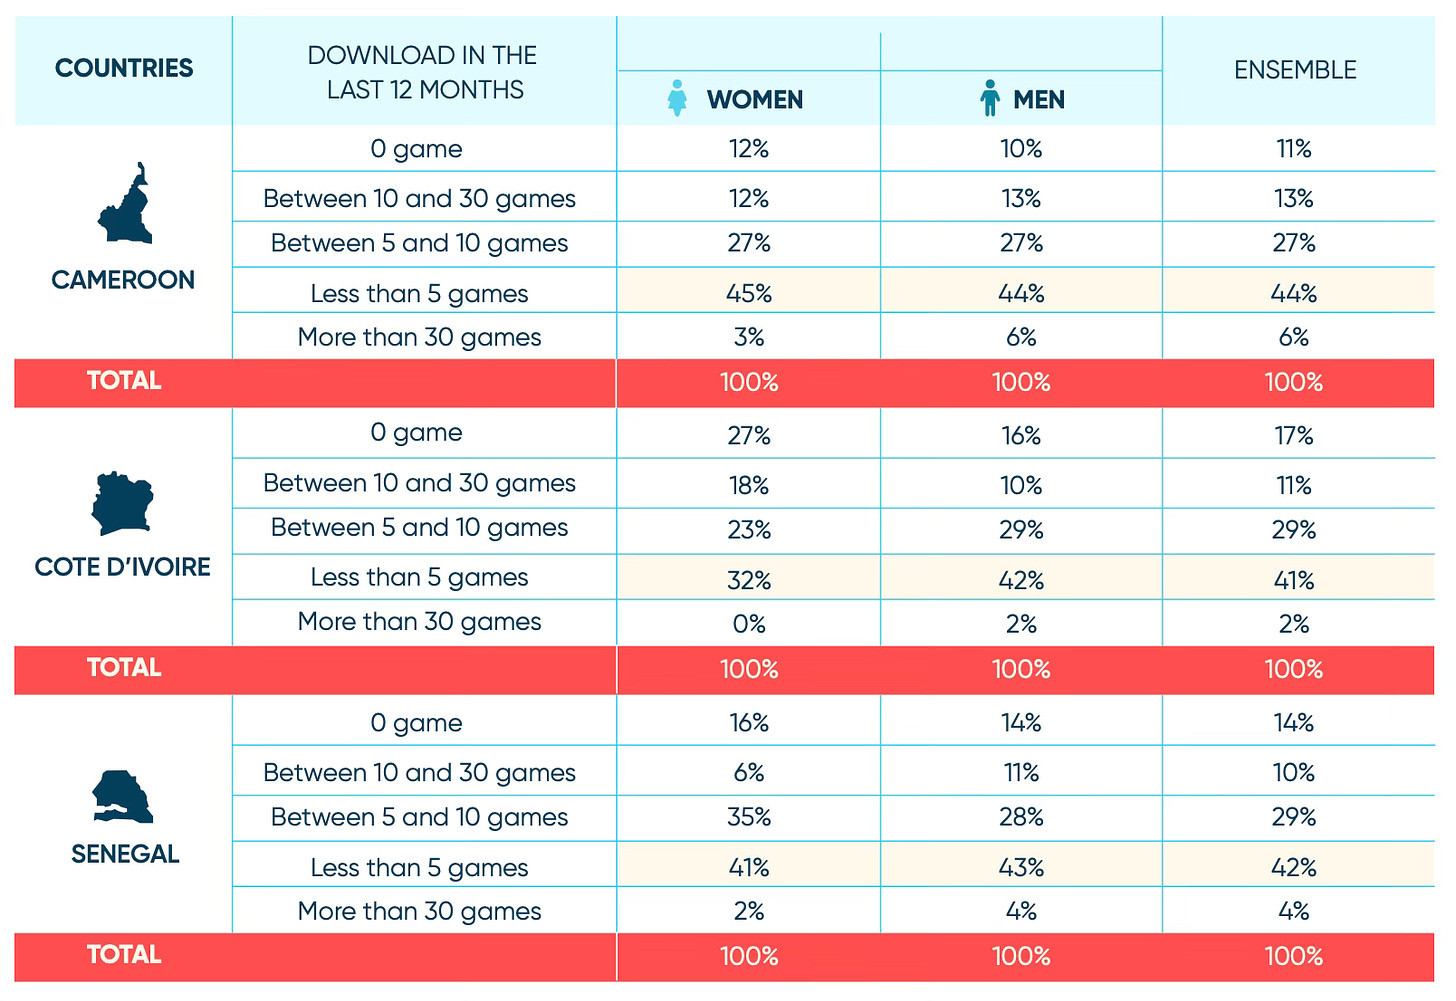
The Game Hub Senegal: Video Games in Africa
The survey was conducted in Senegal, Ivory Coast, and Cameroon. Interviews were conducted with 785 people from July 21, 2023, to August 28, 2023. The majority of respondents (over 80%) were male.
-
Android is the main platform in Senegal (81%), Ivory Coast (89%), and Cameroon (96%).
-
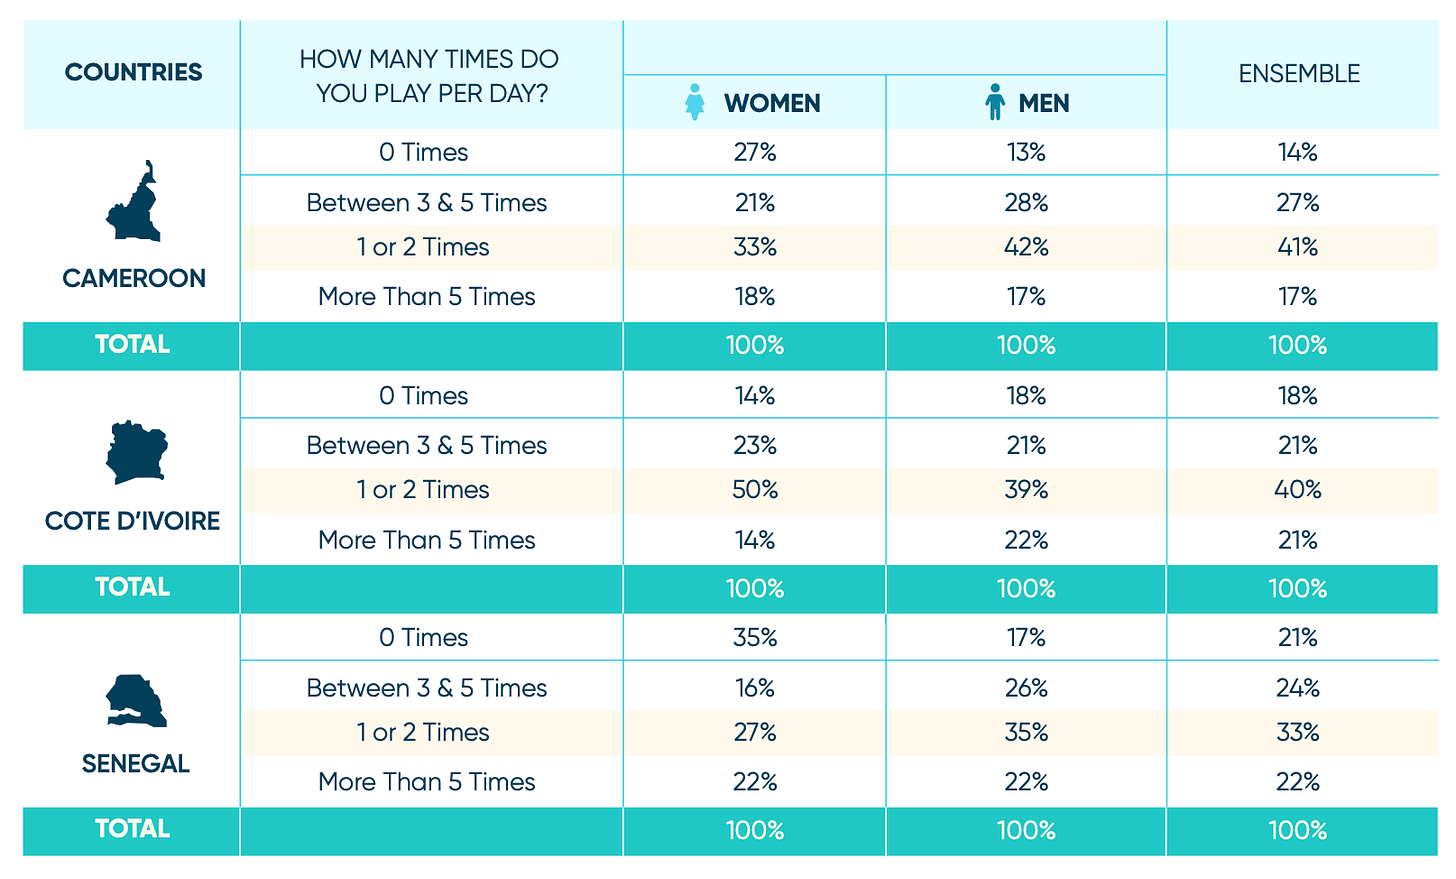
Around 80% of residents of the surveyed countries play games at least a couple of times a day. For example, 22% of Senegalese residents play more than 5 times a day.
-
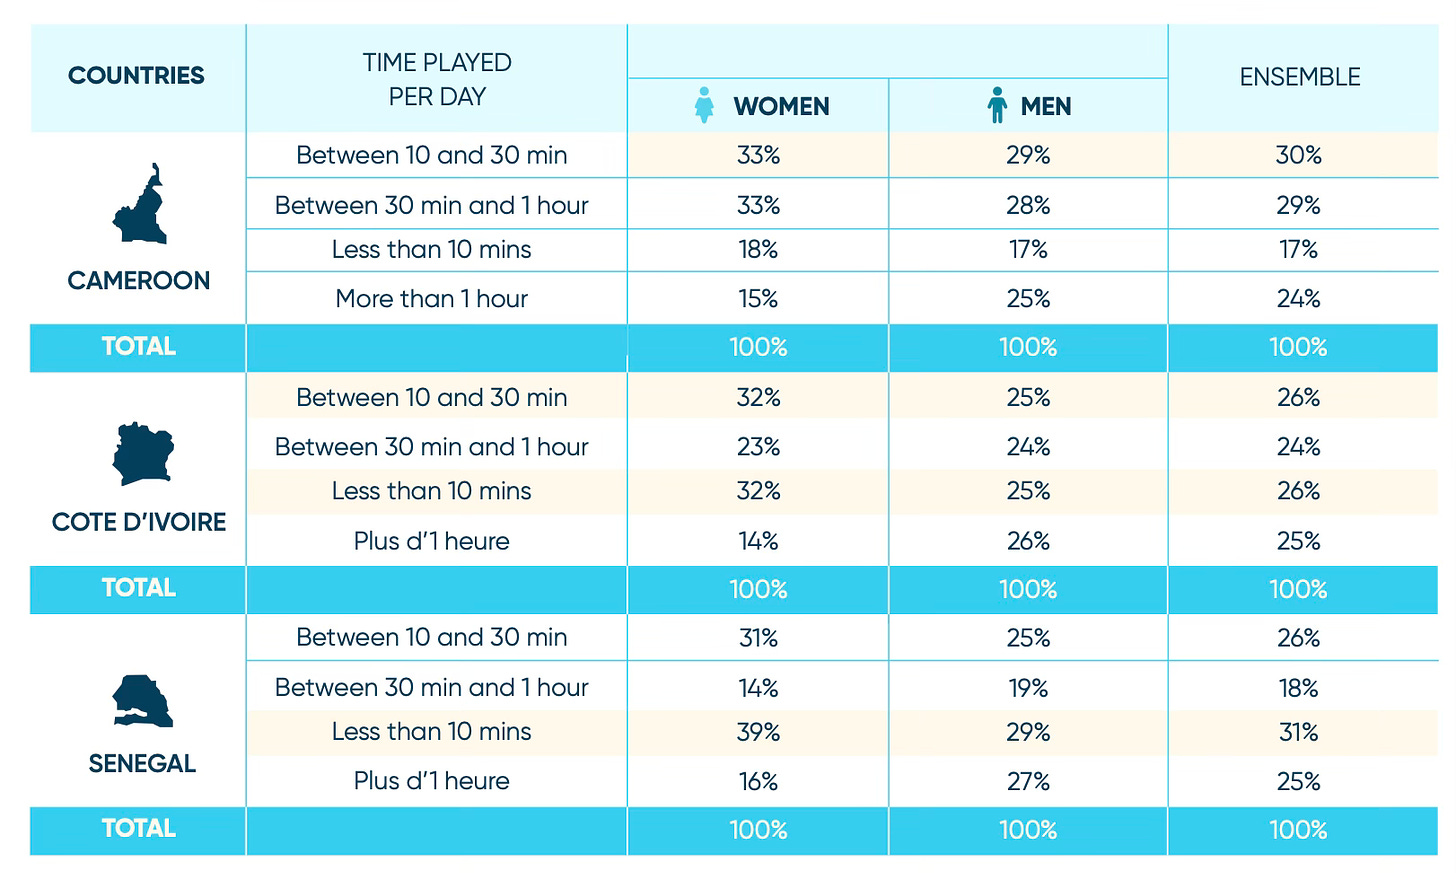
Only 24-25% of residents of the listed countries play games for more than one hour a day. The majority play for up to 30 minutes a day.
-
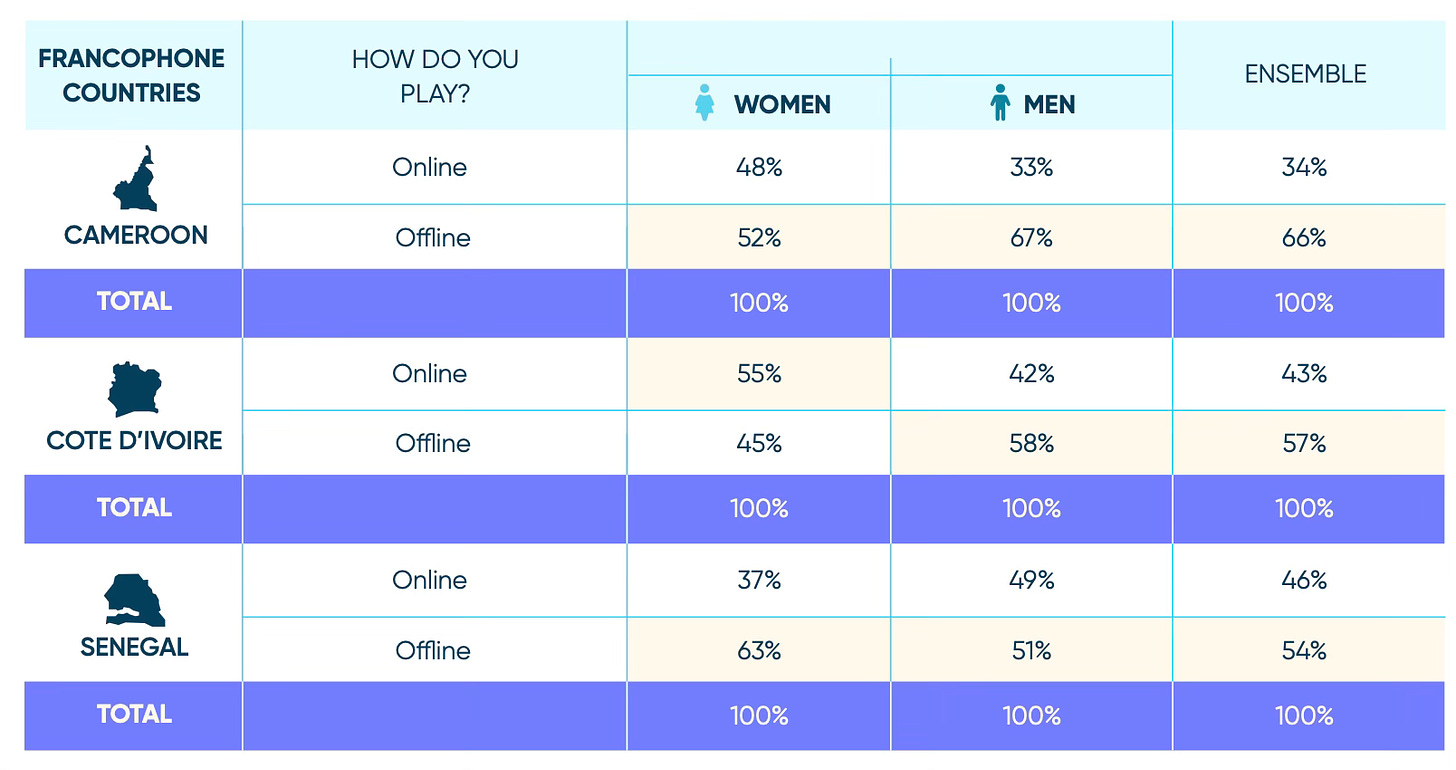
The majority of players play offline (66% in Cameroon; 57% in Ivory Coast; 54% in Senegal).
-
Almost half of the residents of Cameroon, Ivory Coast, and Senegal download fewer than 5 games per year.
-
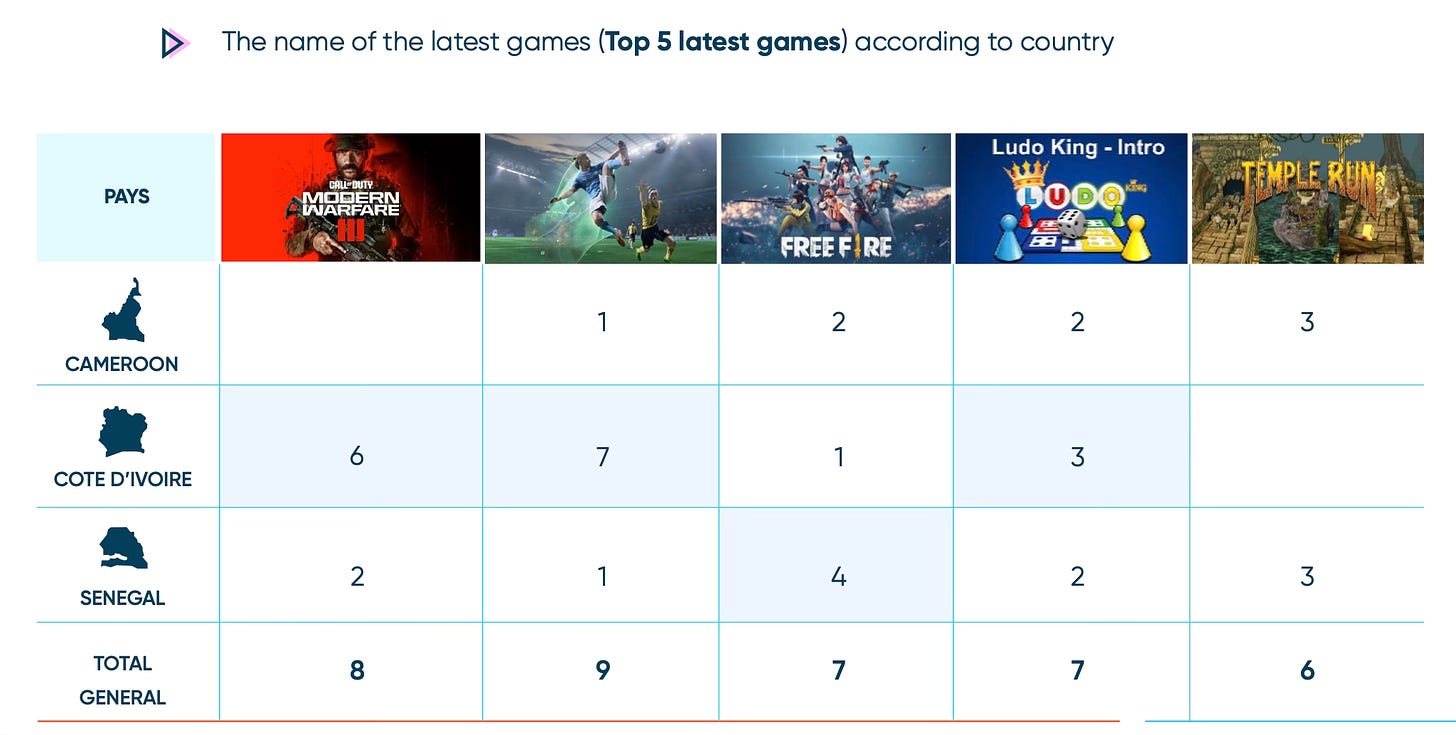
Call of Duty, "soccer," Garena Free Fire, Ludo, and Temple Run are the games mentioned by residents when asked about the last game they downloaded.
-
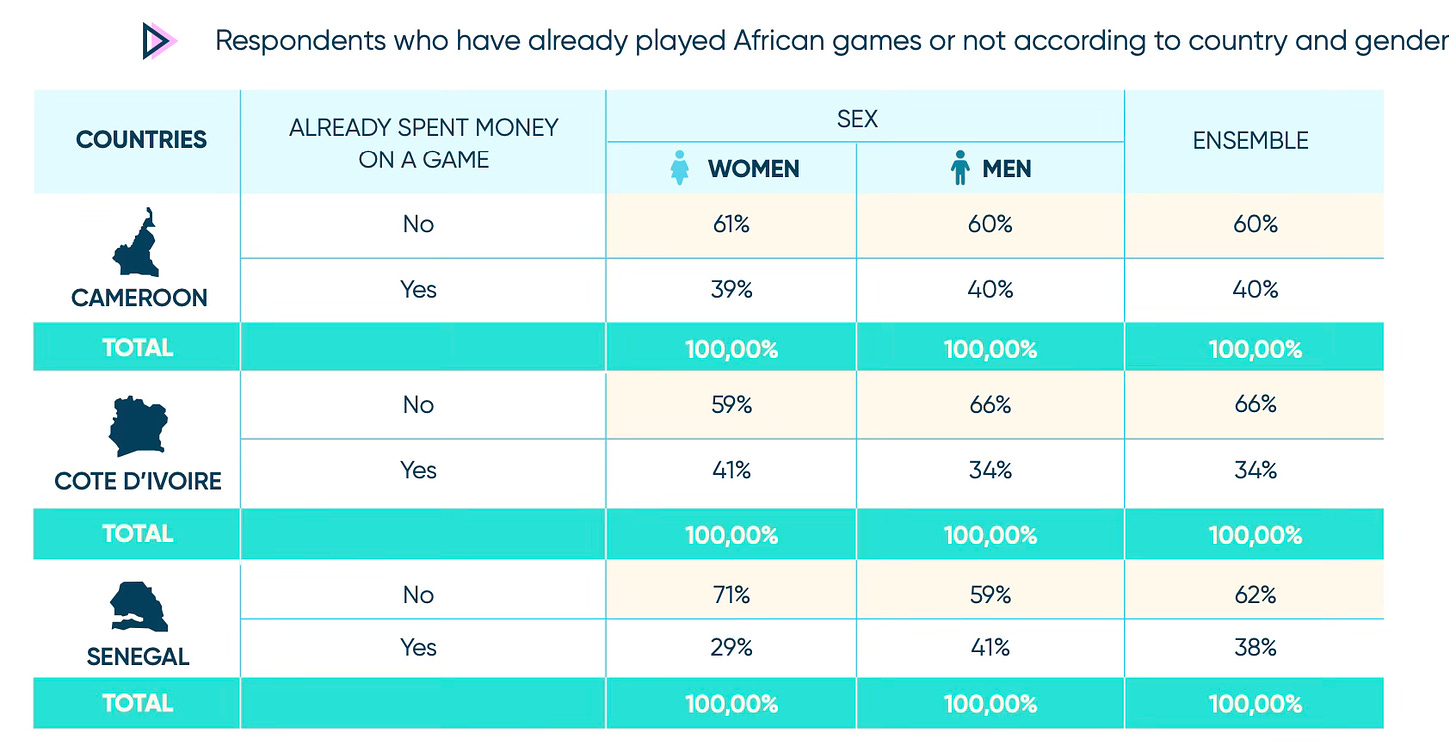
More than 60% of the local population have never played games by African developers. The main reason is that they have never heard of them.
-
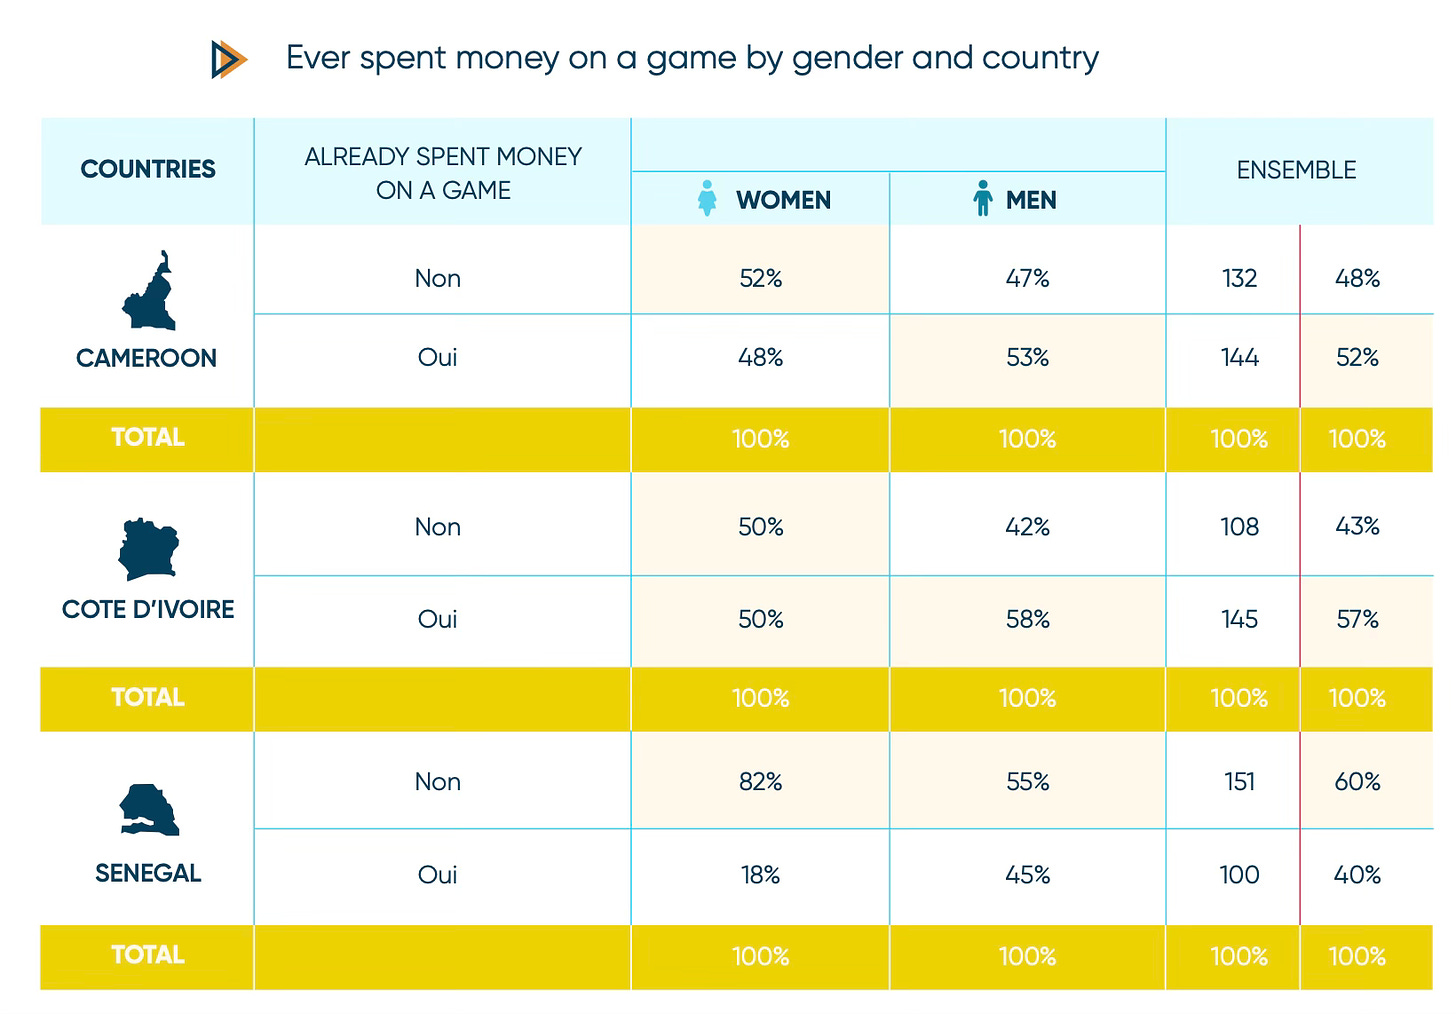
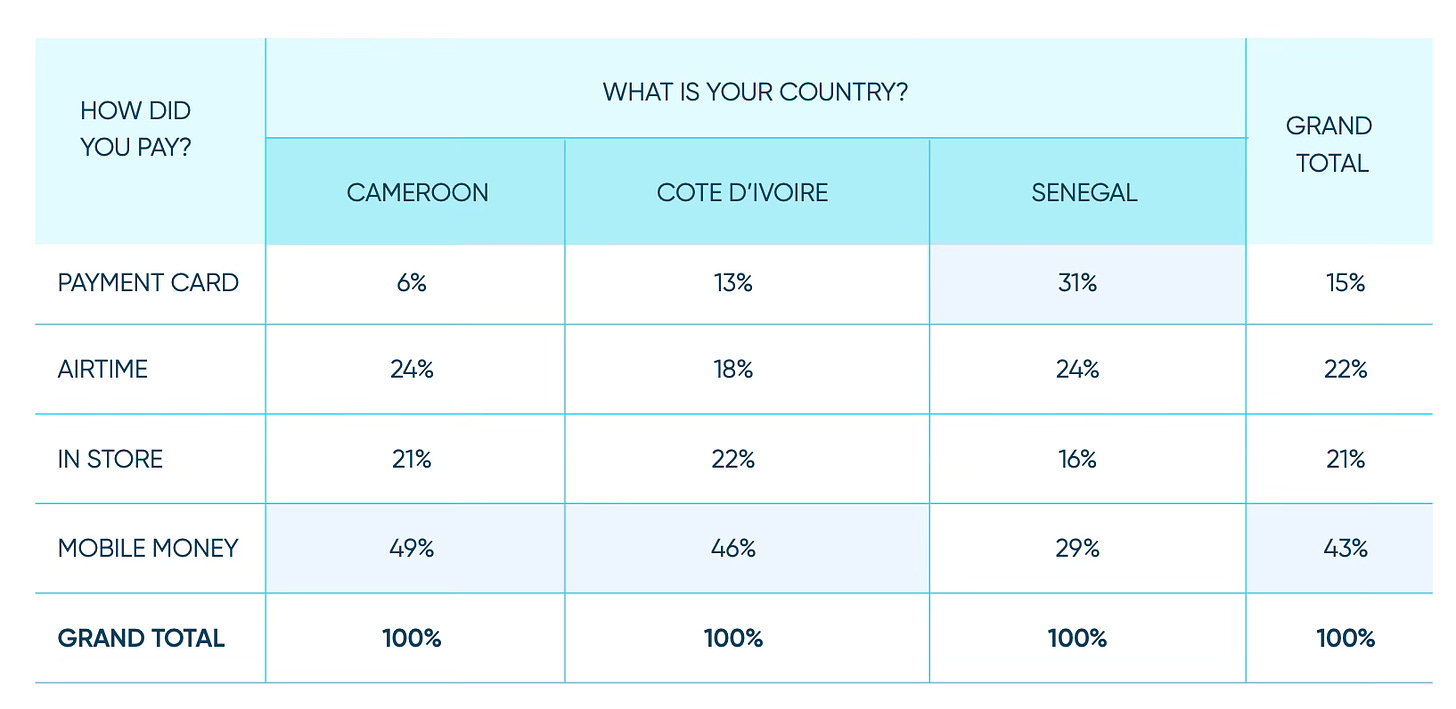
52% of Cameroonians, 57% of Ivorians, and 40% of Senegalese residents spend money on games.
-
Interestingly, only 15% of users paid with a credit card. The most popular payment method is through mobile money (43%). Next is Airtime Money Transfer (22%) and buying a top-up card in a store (21%).
Mobile Airtime Money Transfer is a prepaid phone balance top-up.
-
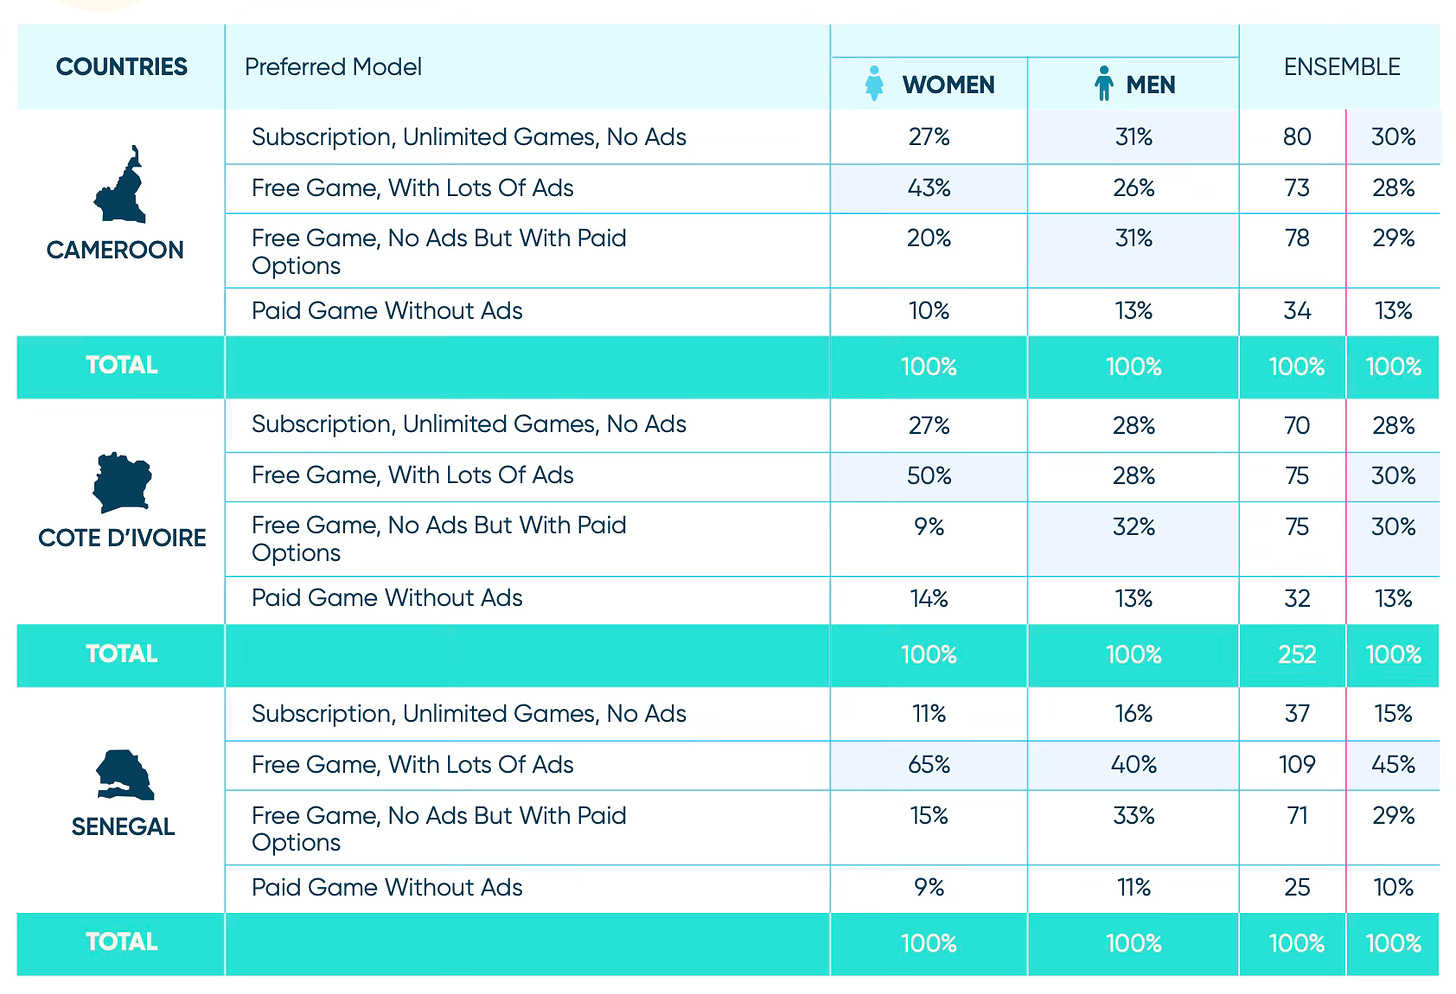
Residents of Cameroon, Ivory Coast, and Senegal are united in their preference for F2P (Free-to-Play) games and reluctance to pay for games. However, in Senegal and Ivory Coast, a large percentage of respondents (30% and 28% respectively) said they were willing to pay for games on a subscription basis.
-
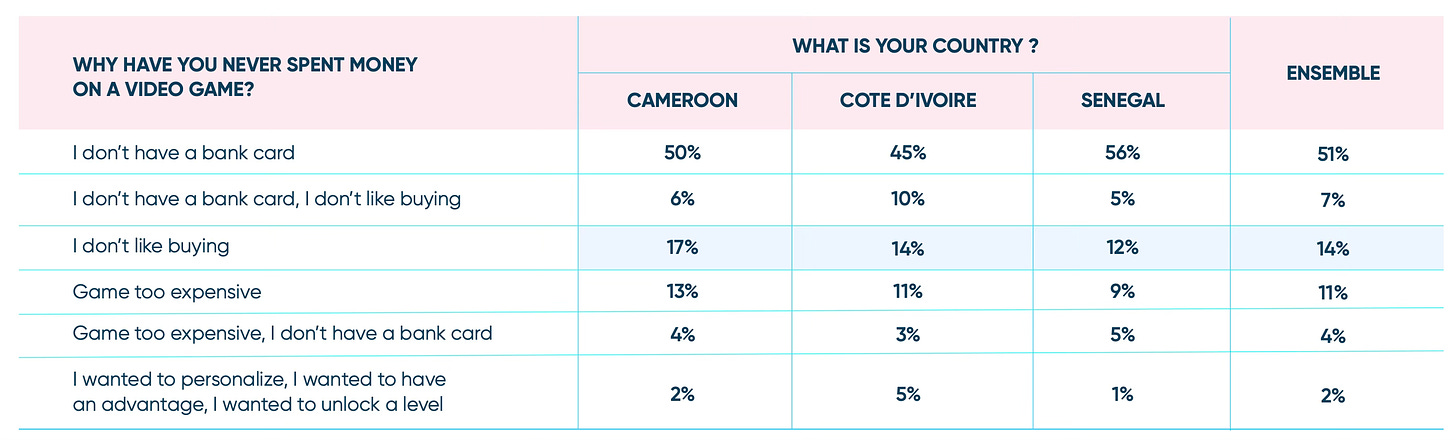
51% of residents of these countries noted that they did not pay for games because they did not have a credit card. The next most popular response (14% of respondents) was "I don't like to buy."
-
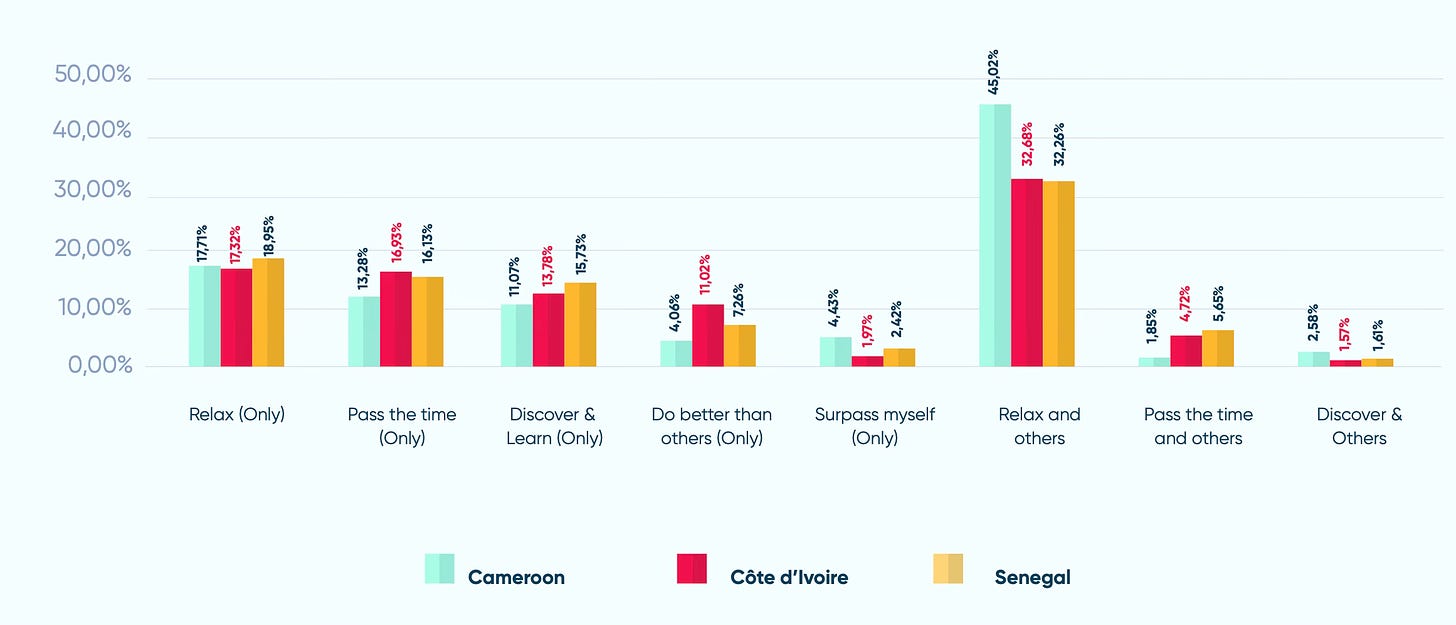
Regarding motivation, the majority of players from these countries play to relax and unwind.
Newzoo: Top-selling PC/Console Games in the USA and UK in 2023
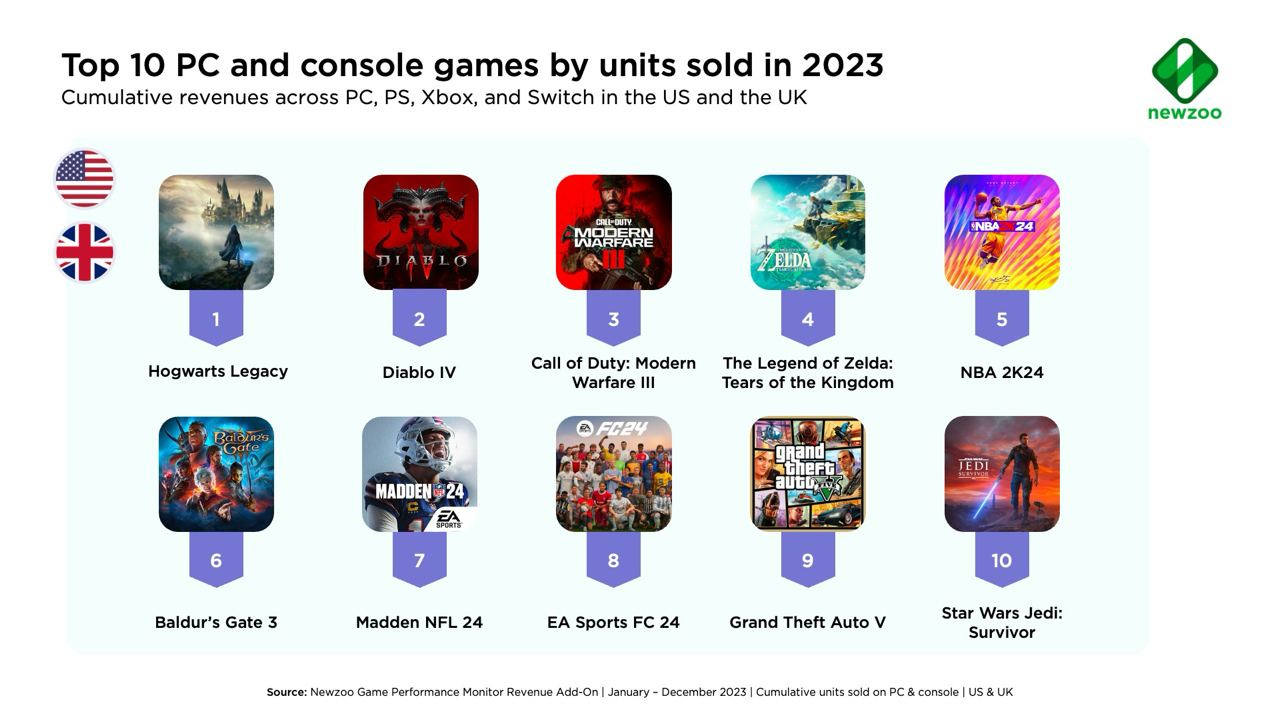
-
In terms of the number of copies sold, the top three leaders are Hogwarts Legacy, Diablo IV, and Call of Duty: Modern Warfare III. Grand Theft Auto V, an evergreen, is in 9th place.
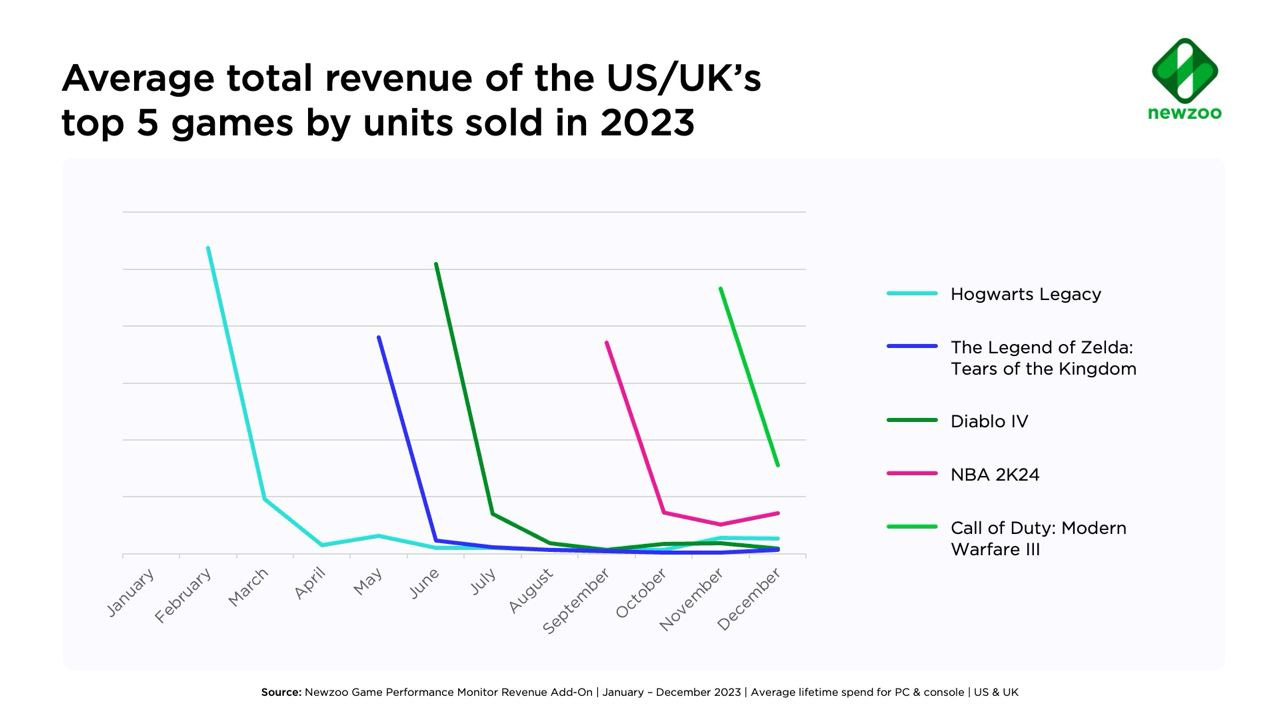
-
Newzoo provides interesting statistics on the revenue dynamics of the top five best-selling games. It can be seen that NBA 2K24 started slightly worse than its competitors, but its tale sales are better.
It is important to note that Newzoo aggregates revenue data for Call of Duty: Modern Warfare III together with Call of Duty: Modern Warfare II and Warzone 2.0 due to the consolidation of all games in the series into one distribution.
-
Sports games sell differently in the USA and the UK. In the USA, the 5th and 6th places in sales belong to NBA 2K24 and Madden NFL 24. In the UK, however, EA Sports FC 24 topped the sales chart.
-
Only one console exclusive made it into the top 10 in both the USA and the UK. This was achieved by The Legend of Zelda: Tears of the Kingdom.
-
Fortnite became the largest game in the USA and UK in terms of revenue from microtransactions. Following were Call of Duty: Modern Warfare III, FIFA 23, NBA 2K23, and EA Sports FC 24. Moreover, Fortnite earned 39% more than FIFA 23 in these markets.
-
The Sims 4 became the leader in revenue from DLC in the mentioned markets.
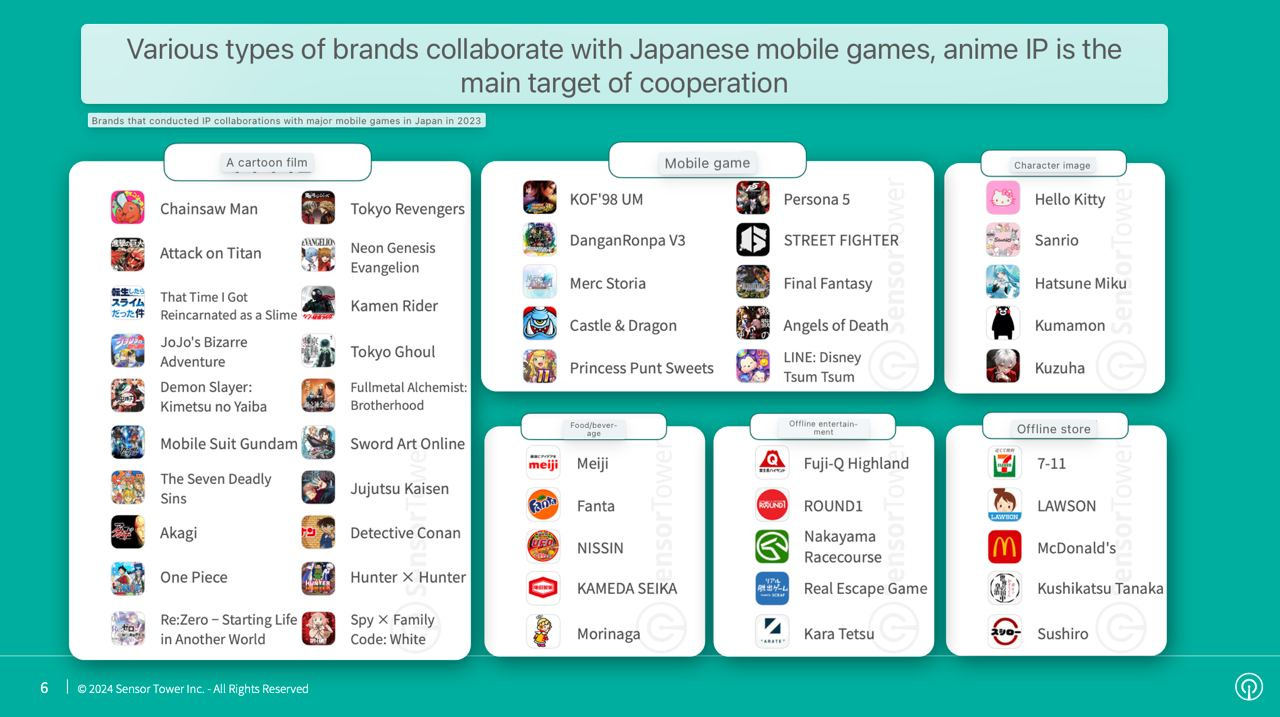
Sensor Tower: IP Collaborations in the Japanese Mobile Market in 2023
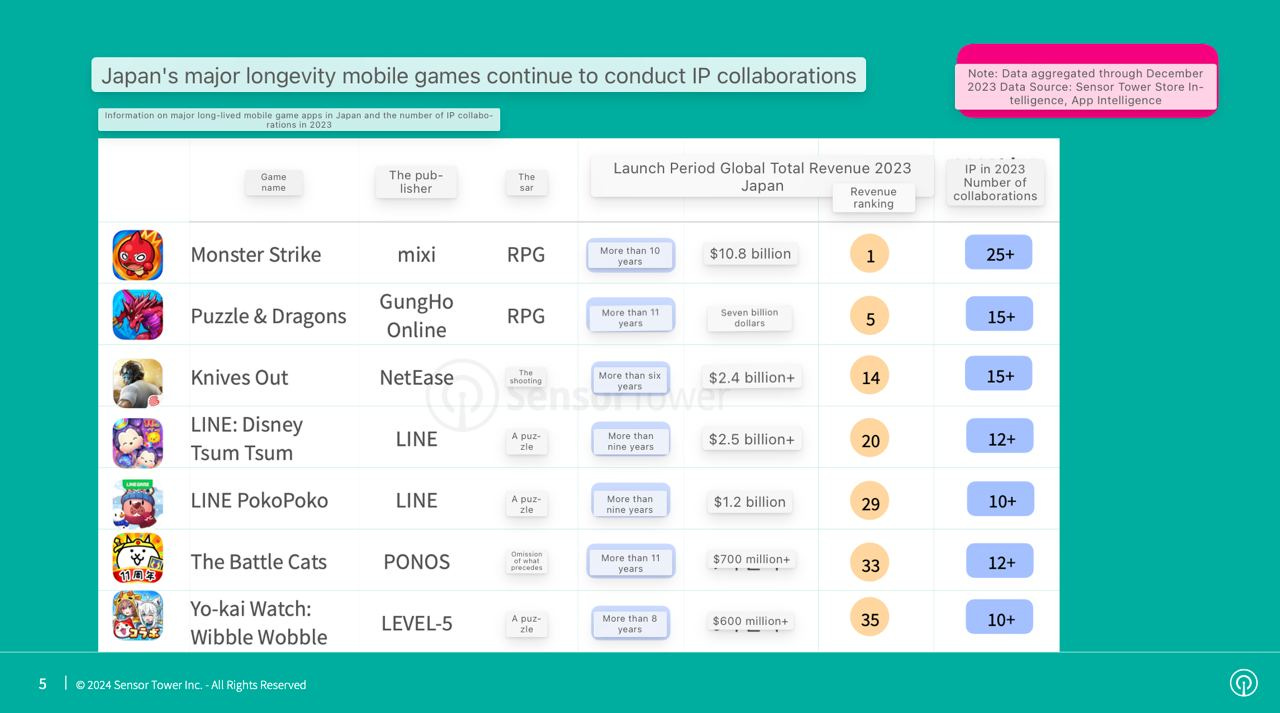
-
Major games in the Japanese market actively engage in IP collaborations. For example, Monster Strike alone had more than 25 collaborations in 2023.
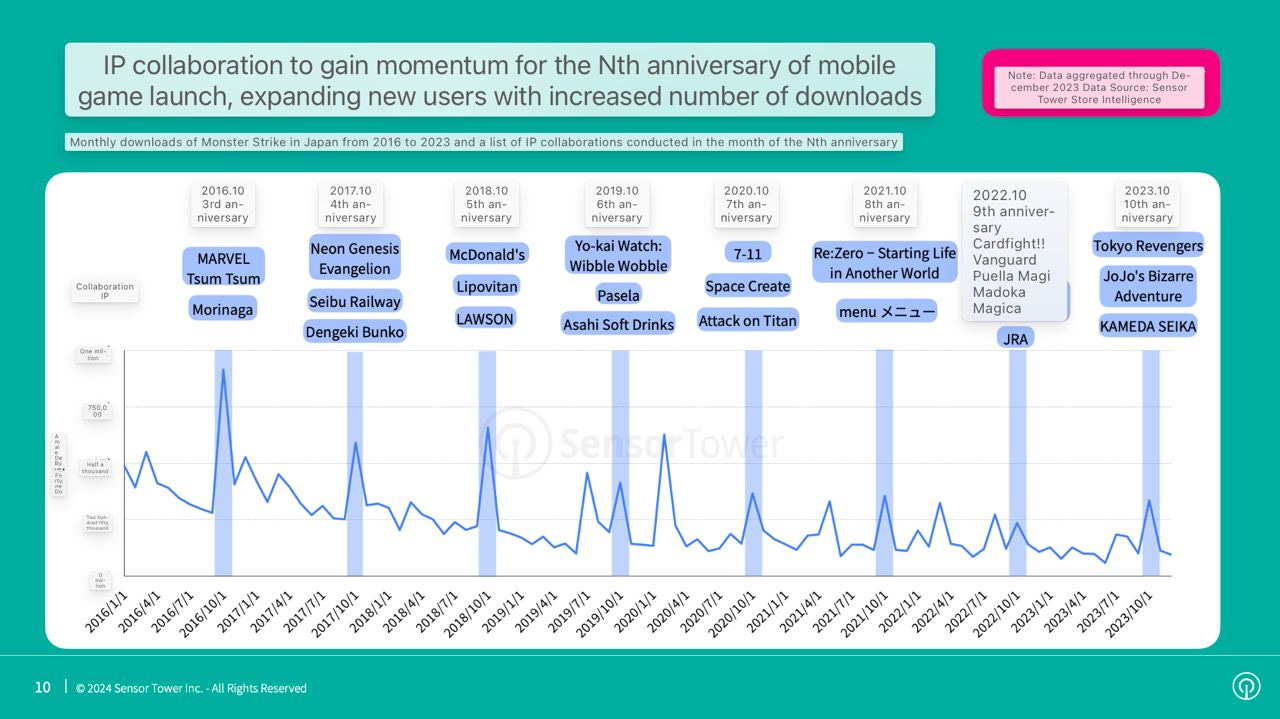
-
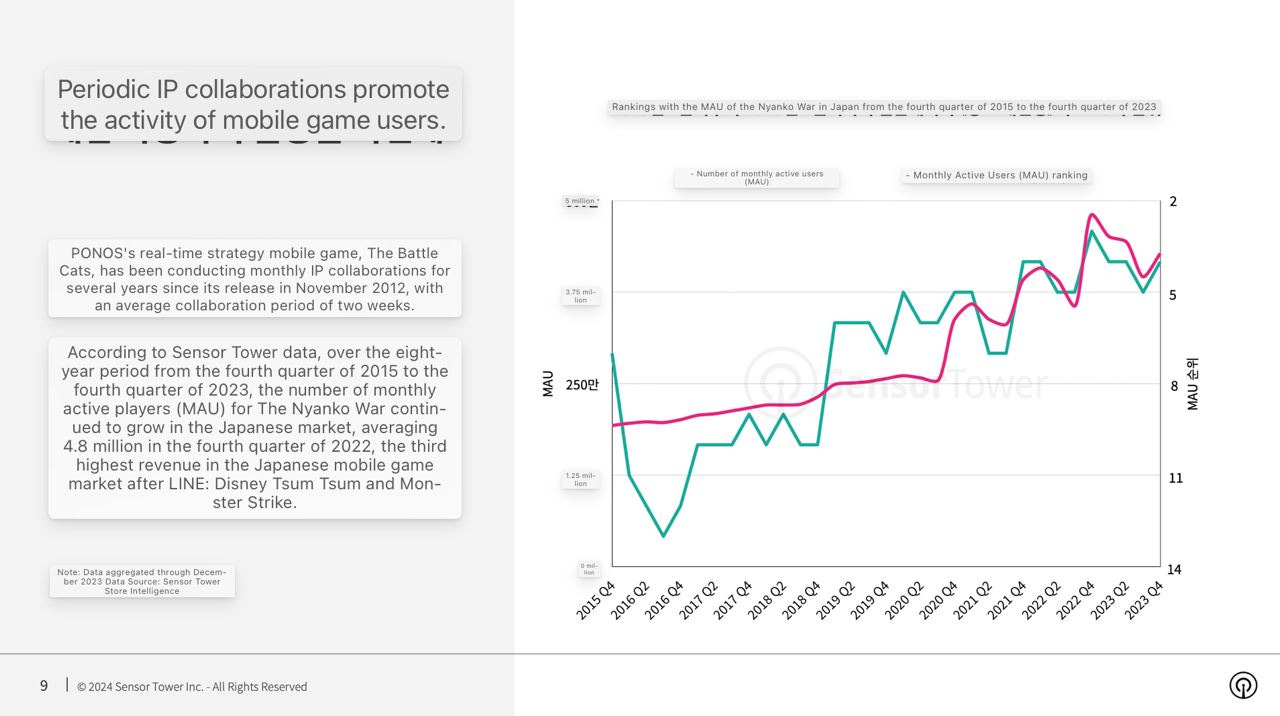
Since 2014, Monster Strike has celebrated its birthdays together with other brands. The graph shows how such collaborations are reflected in downloads.
-
Japanese games mainly collaborate with anime. Popular IPs include Chainsaw Man, Attack on Titan, and Evangelion.
-
The Battle Cats from PONOS Studio has been actively collaborating with IPs since its release in November 2012. This helps the game steadily increase its MAU (Monthly Active Users) - in the fourth quarter of 2023, the game reached 4.8 million MAU in Japan alone.
-
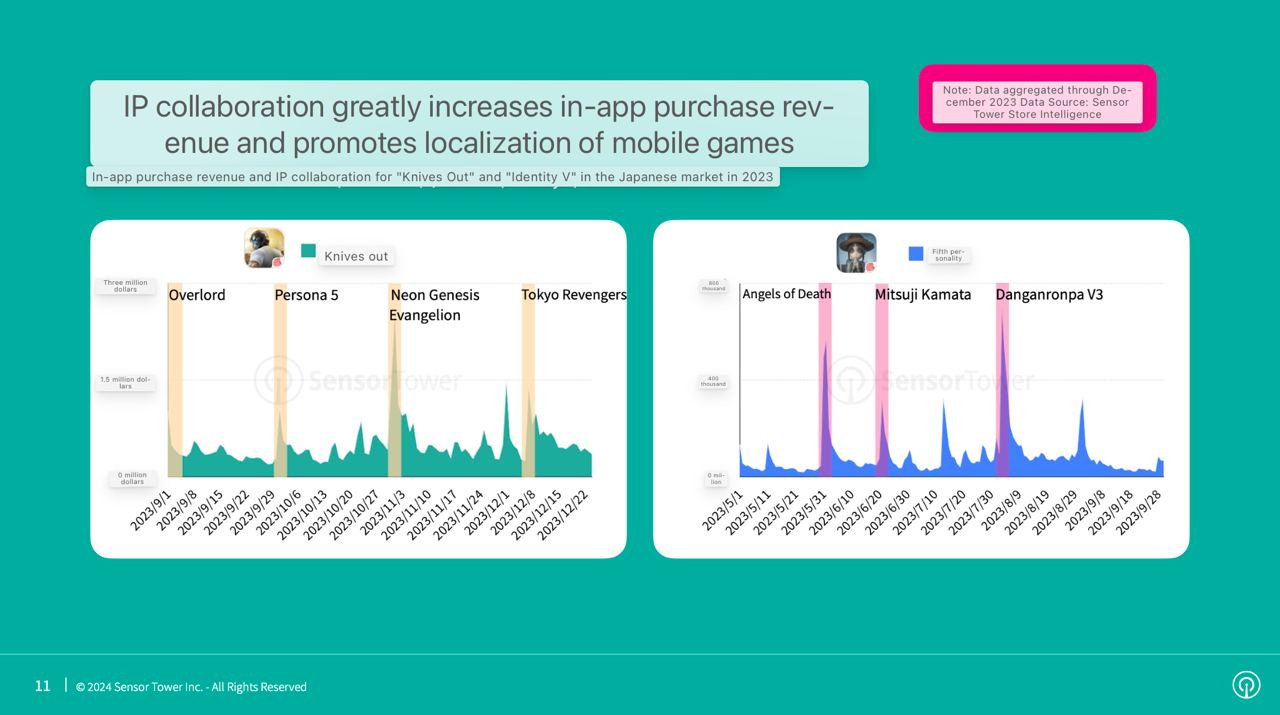
IP collaborations help foreign games earn more in the Japanese market. In particular, Sensor Tower cites examples like Knives Out and Identity V from NetEase.
The full report is available in Korean here
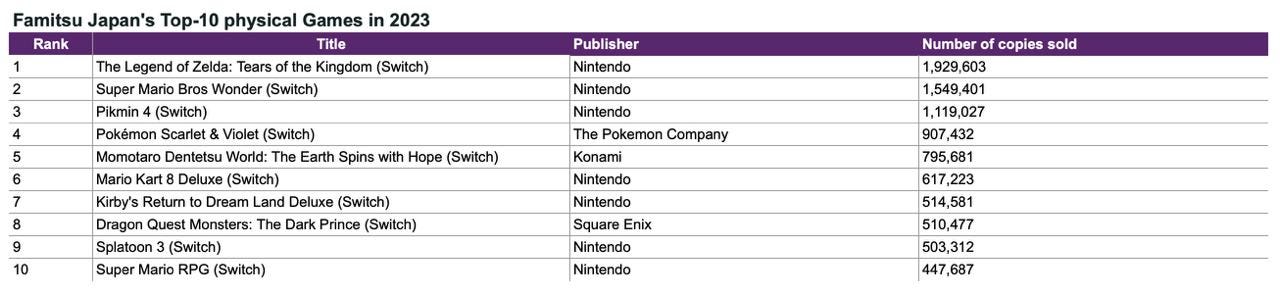
Famitsu: $2.7 billion was spent on physical gaming products in Japan in 2023
-
Total sales reached $2.7 billion (¥403.8 billion), which is 7.8% higher than in 2022 ($2.5 billion - ¥384.6 billion).
-
The Legend of Zelda: Tears of the Kingdom became the best-selling game of the year with 1.9 million physical copies sold. In second place is Super Mario Bros. Wonder (1.5 million physical copies).
-
All games in the top 10 for sales were released on Nintendo Switch. 7 of them were published by Nintendo. If you consider The Pokémon Company, then 8 out of the 10 best-selling games in Japan on physical media are from Nintendo.
-
Nintendo Switch became the best-selling console in Japan in 2023; more than 2.8 million Nintendo Switch OLED units were sold alone.
-
In second place is the PlayStation 5 (2.587 million units sold); in third place is the Xbox Series S|X (141 thousand units).
Sales of PS5 in the region more than doubled, yet there are no PS5 games in the chart. Possibly, the increase in sales in the country is related to increased demand from China. Simon Carless wrote about this in his article last year.
Niko Partners: MENA-3 is expected to reach revenue of $2.65 billion by 2027
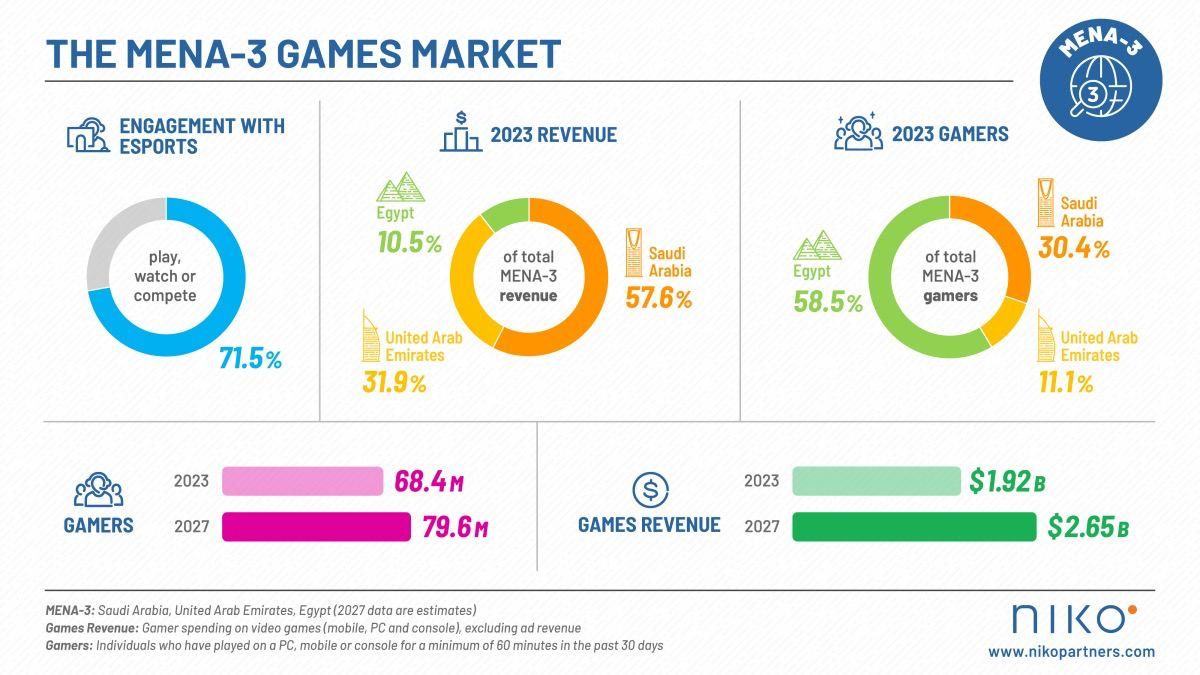
MENA-3, as defined by Niko Partners, includes KSA, UAE, and Egypt.
-
The total revenue of the three markets in 2023 amounted to $1.92 billion, which is 7.8% higher than the previous year.
-
It is expected that by the end of 2027, revenue will reach $2.65 billion. The cumulative growth rate is 8.2%.
-
The number of players in KSA, UAE, and Egypt in 2023 was 68.4 million people (+2.9% compared to the previous year). It is expected that by 2027, this number will increase to 79.6 million.
-
71.5% of residents in MENA-3 countries interact with esports. They either play esports disciplines or watch tournaments.
-
KSA is the largest gaming market among the mentioned countries, accounting for 57.6% of total revenue. Next are UAE (31.9%) and Egypt (10.5%).
-
However, in terms of population, Egypt leads (58.5%); followed by KSA (30.4%) and UAE (11.1%).
-
Smartphones are the most popular device for gaming in MENA-3 countries. 87.2% of players use them. On average, people play for 8.7 hours per week.
-
PUBG, EA Sports FC, and Call of Duty are the most popular franchises in the listed markets.
AppMagic: Top Mobile games of February 2024 by Revenue and Downloads
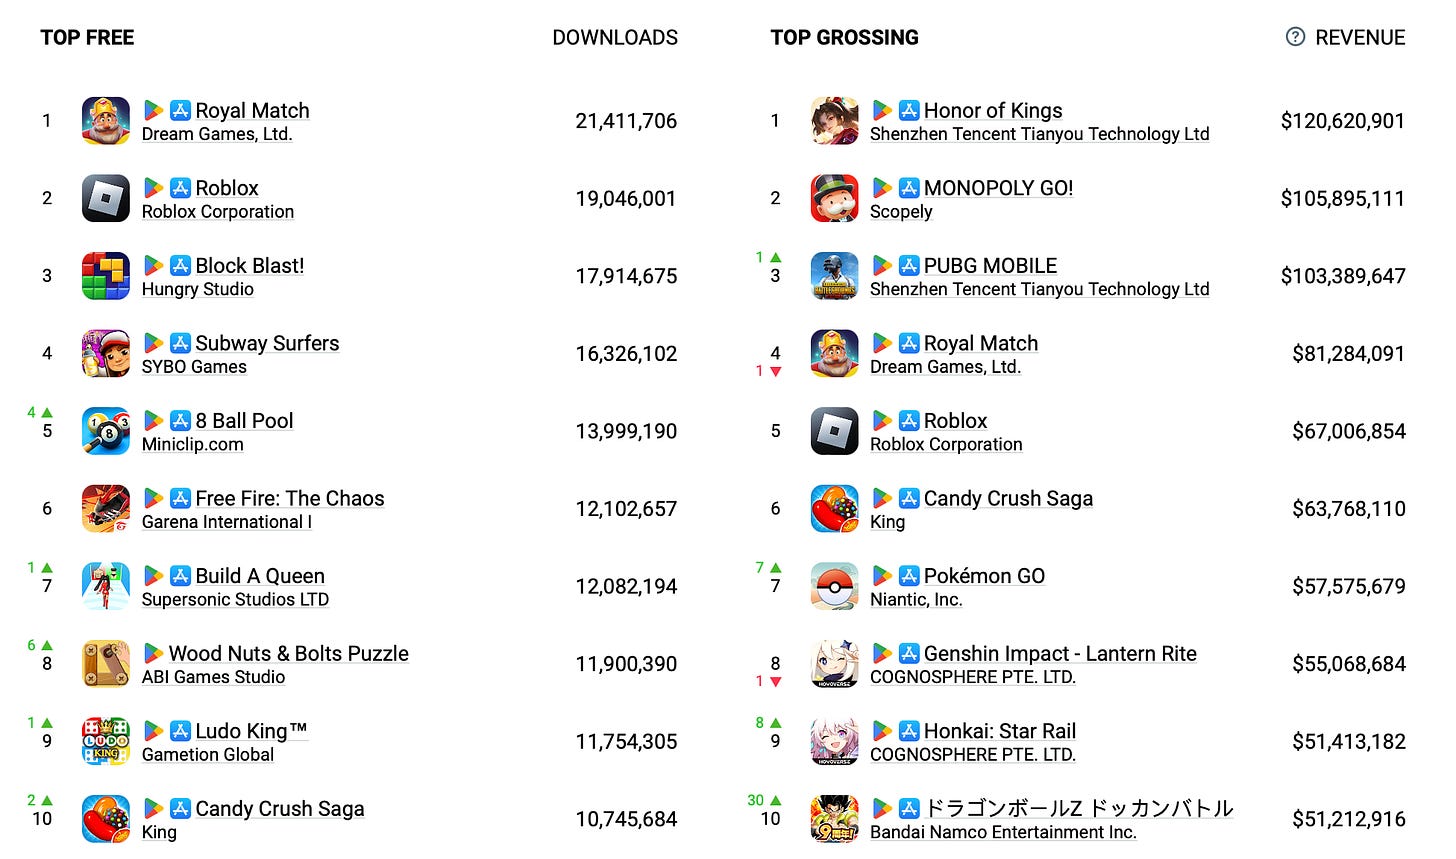
AppMagic provides revenue data net of store commissions and taxes.
Revenue
-
Honor of Kings ($120.6 million), MONOPOLY GO! ($105.9 million), and PUBG Mobile ($103.4 million) were the highest-earning mobile games in February.
-
Pokemon GO jumped up 7 positions in the ranking. The game earned $57.6 million in February compared to $35.6 million in January.
-
Honkai: Star Rail also showed significant growth, climbing 8 positions. In February, the game earned $51.4 million, up from $32.8 million in January.
-
The most interesting project in the top 10 is Dragon Ball Z Dokkan Battle. The game earned $51.2 million in February, jumping up 30 positions (from $19.7 million in January). February coincided with the project's anniversary celebration. The majority of the project's revenue comes from Japan (around 80%), and the game itself was released in early 2015. Everyone wishes for such longevity.
Downloads
-
There are no significant changes in the download charts. Royal Match (21.4 million downloads), Roblox (19 million downloads), and Block Blast! (17.9 million downloads) are the leaders.
-
Wood Nuts & Bolts Puzzle by the Vietnamese ABI Games Studio entered the top 10 for downloads. It had 11.9 million installations in February.
Game sales Round-up (21.02.2024 - 05.03.2024)
-
Sifu has surpassed the mark of 3 million copies sold. It took the game just over 2 years to achieve this.
-
Owlcat Games announced that sales of Warhammer 40,000: Rogue Trader have reached 500 thousand copies.
-
Tales of Arise by Bandai Namco has also reached 3 million copies sold. The game has been released in 2021.
-
Enshrouded reached 2 million players in Early Access within 3 weeks of release. Even Palworld didn't stop it.
-
Elden Ring - a super hit. The game has been purchased 23 million times, and this is probably not the limit. The Shadow of the Erdtree expansion will be released on June 21st, which should boost sales even further. The original game was released on February 25, 2022, and by mid-March it already had 12 million copies sold.
-
NieR: Automata, released in 2017, sold 8 million copies.
-
Palworld continues to hype. The number of players in the project has reached 25 million. The developers are, of course, very pleased with this fact.
-
Deep Rock Galactic: Survivor was bought over half a million times in the first week after release. Sales dynamics are faster than the original Deep Rock Galactic.
-
Baldur’s Gate III sales are "significantly more than 10 million copies", said the publishing director of Larian Studios.
-
Tekken 8 sold 2 million copies in the first month. This is better than all previous games in the series.
-
Stardew Valley turned 8 years old, so the game's creator (Eric Barone) shared sales. Over 30 million copies, not bad for a game made by one person.
-
Black Desert Online has earned over €2 billion lifetime since 2014. A solid amount.
-
The number of registrations in Eggy Party has exceeded 500 million users. The game was released in the Western markets on February 23rd.
SocialPeta: Trends in Mobile Gaming Marketing in 2023
General figures
-
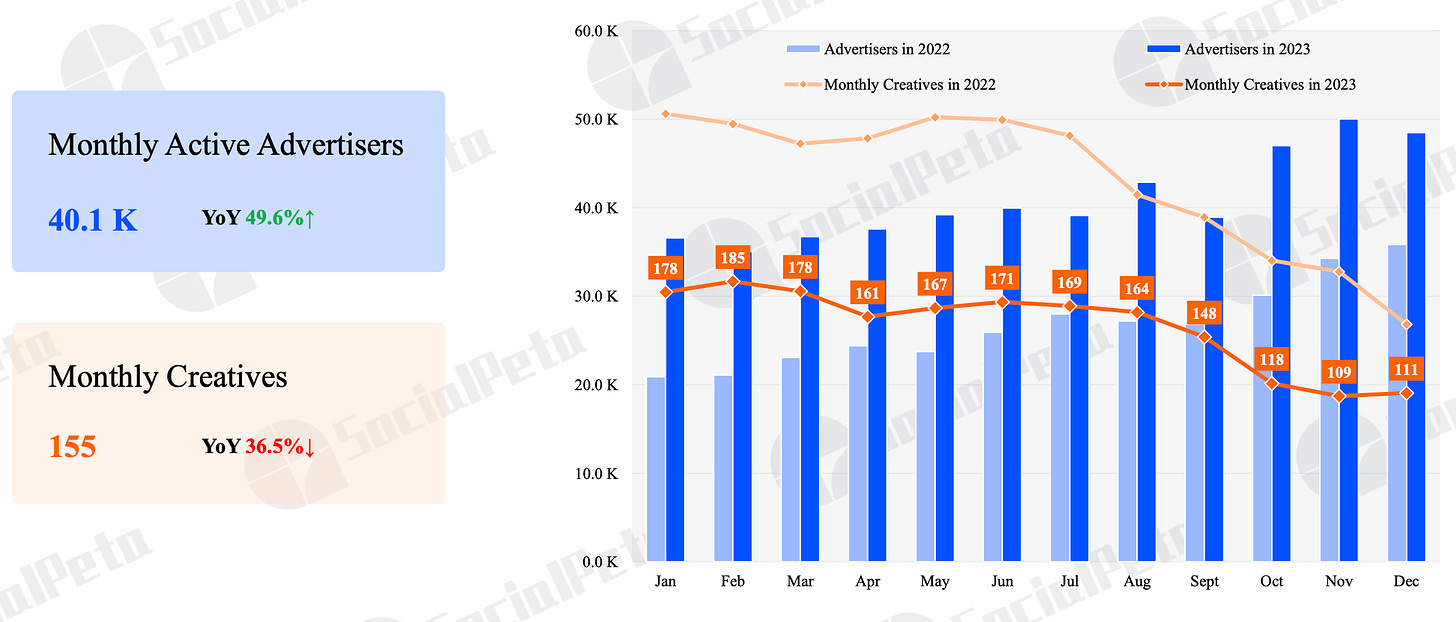
In 2023, there were about 40 thousand active advertisers in the gaming market per month. This is 49.6% more than in 2022.
-
The average number of creatives per month in 2023 decreased by 36.5% - to 155 per advertiser.
-
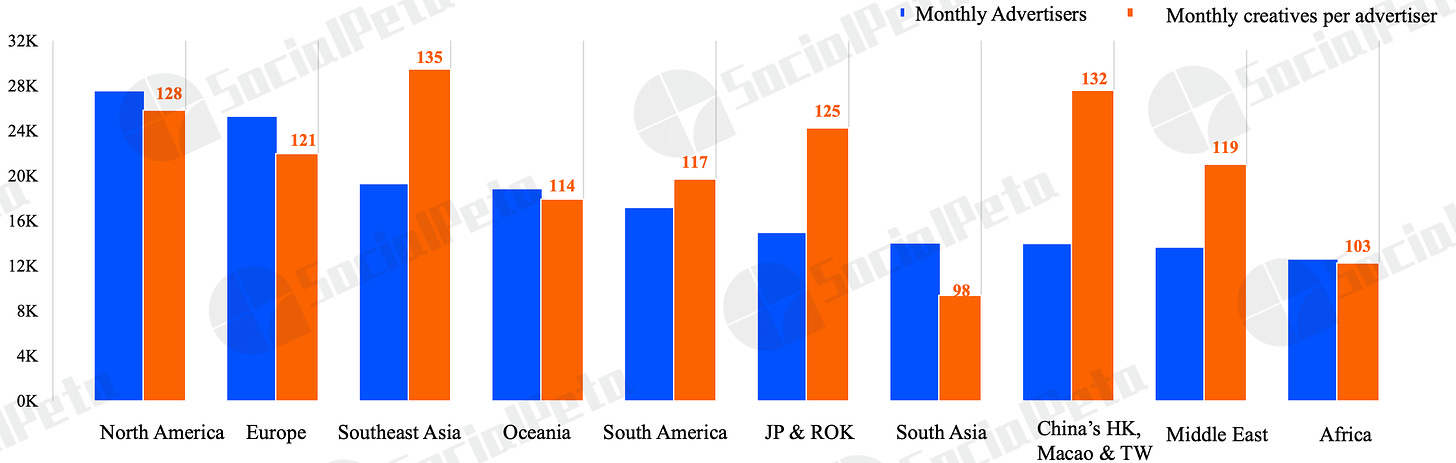
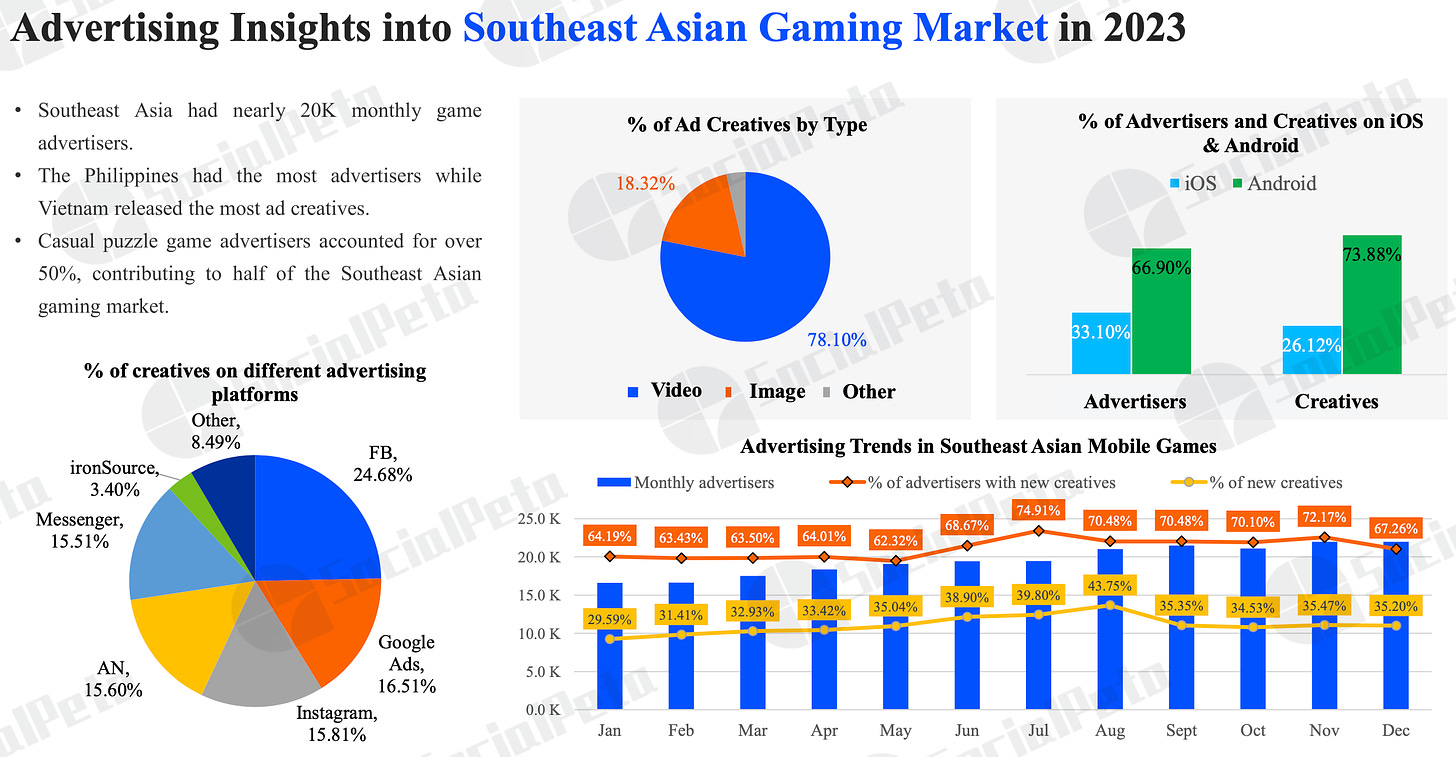
Southeast Asia has become the most competitive region in terms of marketing. On average, in this region, there are 135 creatives per advertiser per month.
However, it's not very clear what SocialPeta means here because according to the general statistics (above), the average number of monthly creatives per advertiser is higher.
-
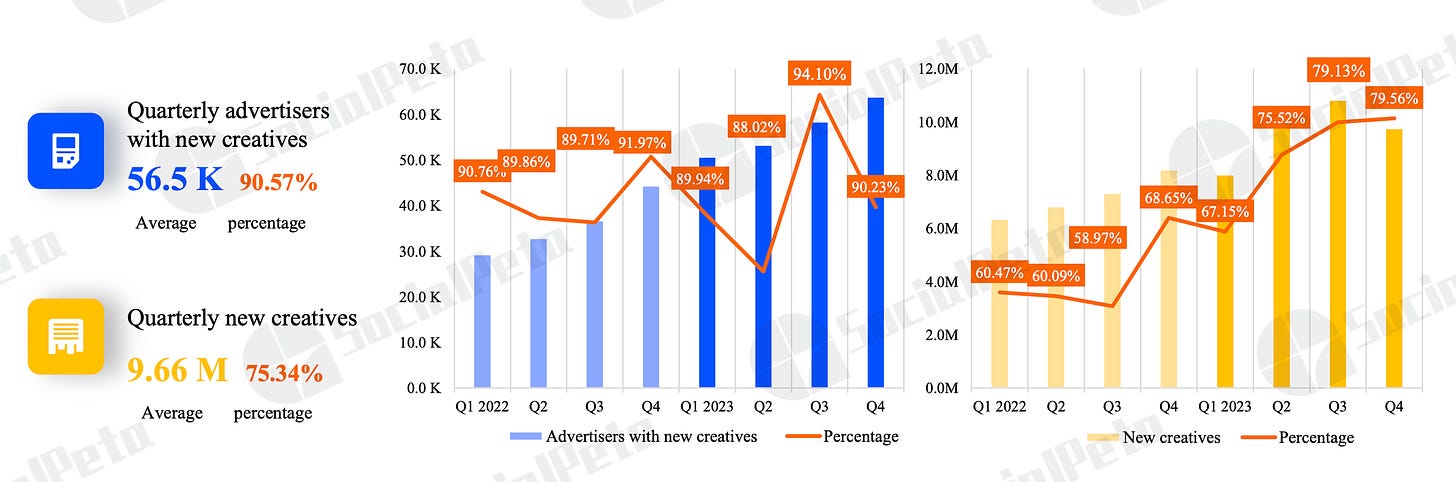
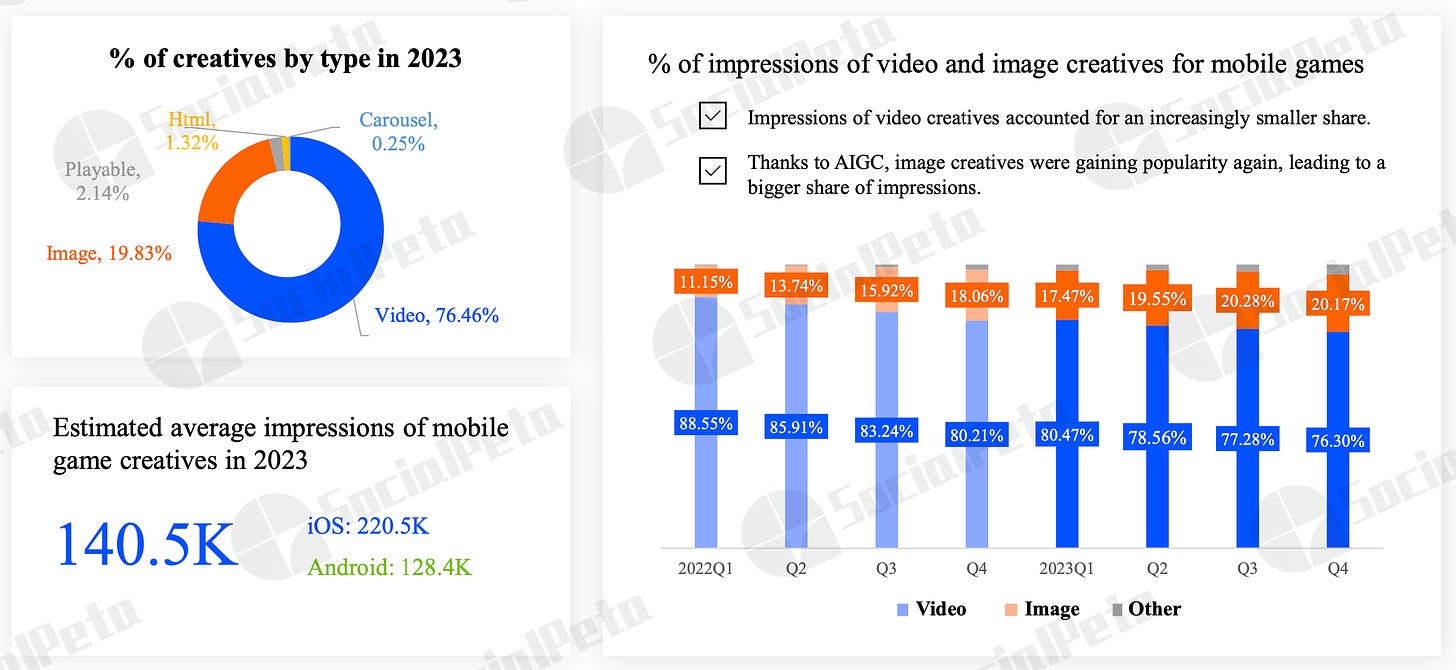
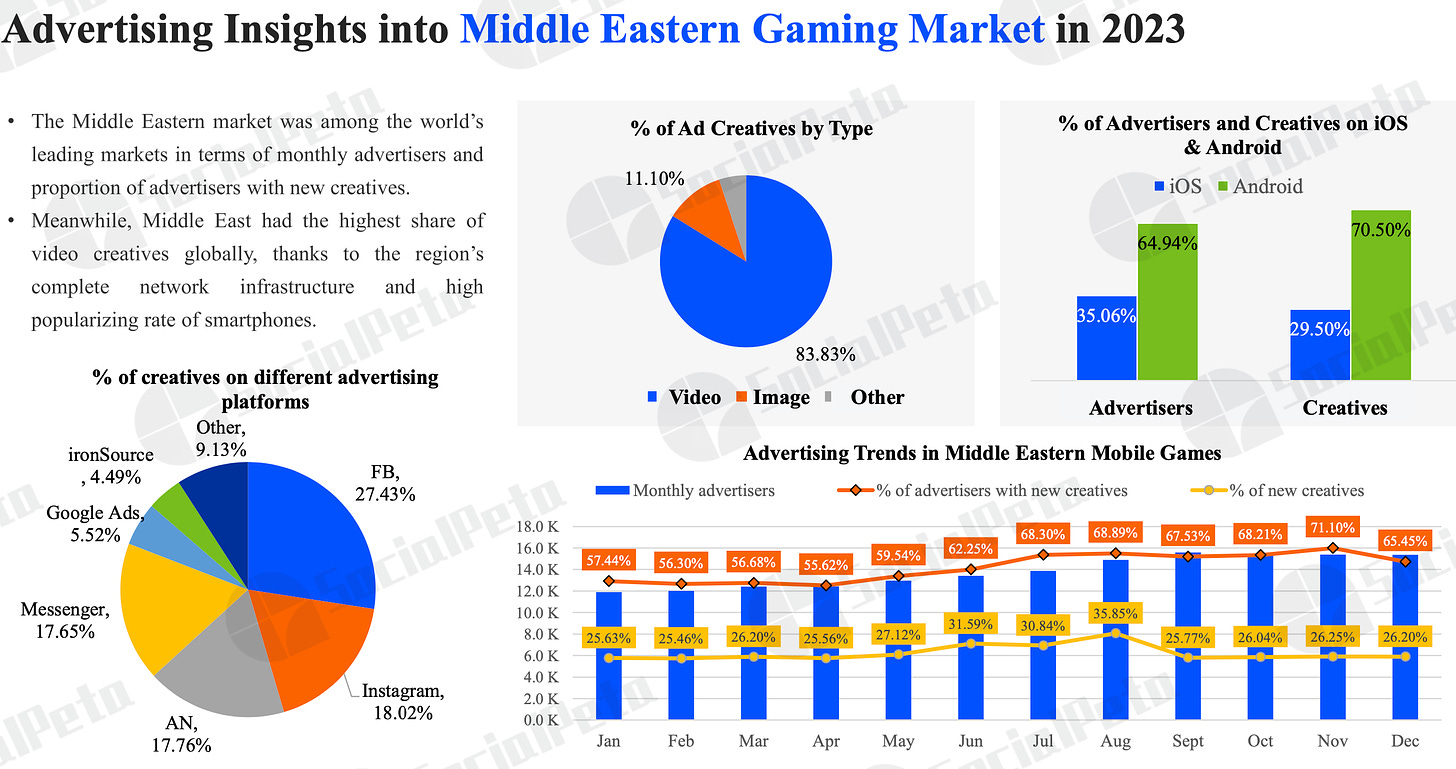
The percentage of new creatives (as well as their quantity) significantly increased in the 2nd-4th quarters of 2023. From 75 to 79% of all creatives were new. The average for 2022 was 62%.
-
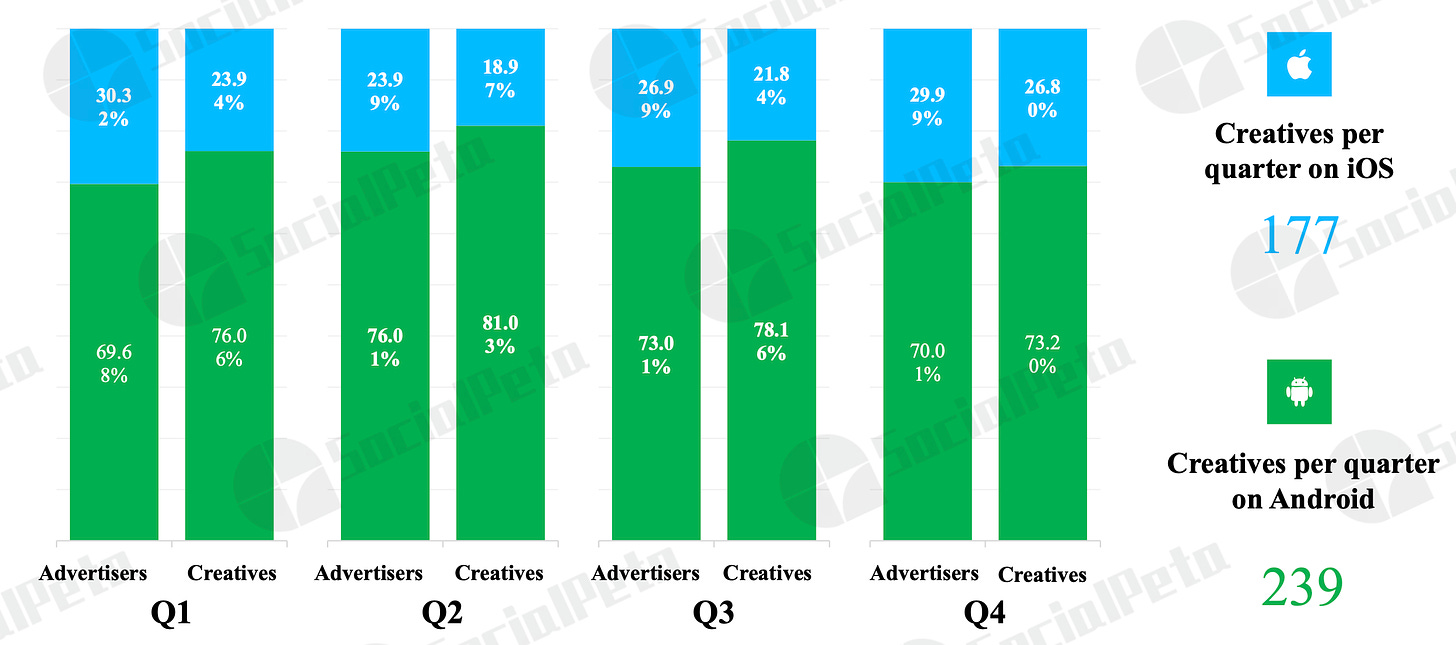
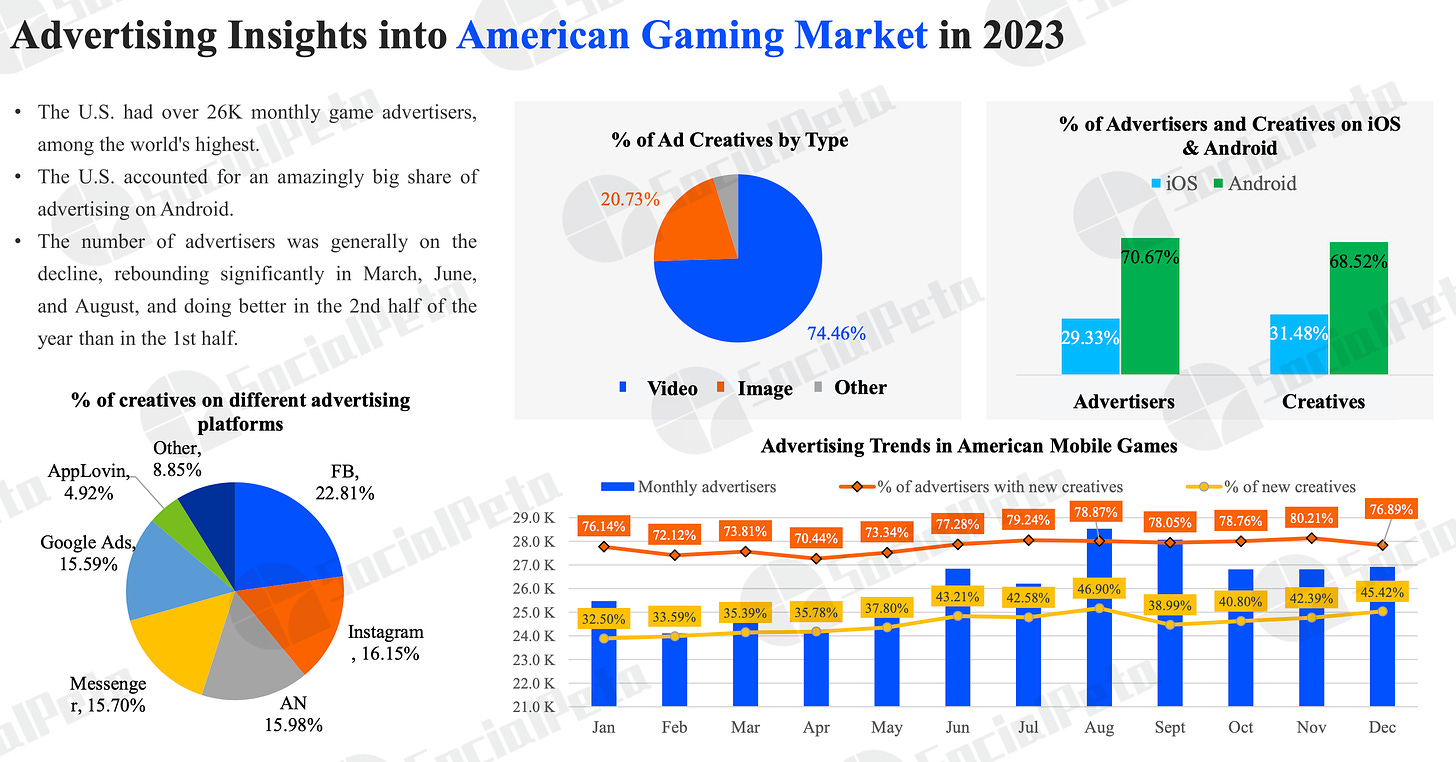
The average number of creatives on Android is higher than on iOS (239 versus 177).
-
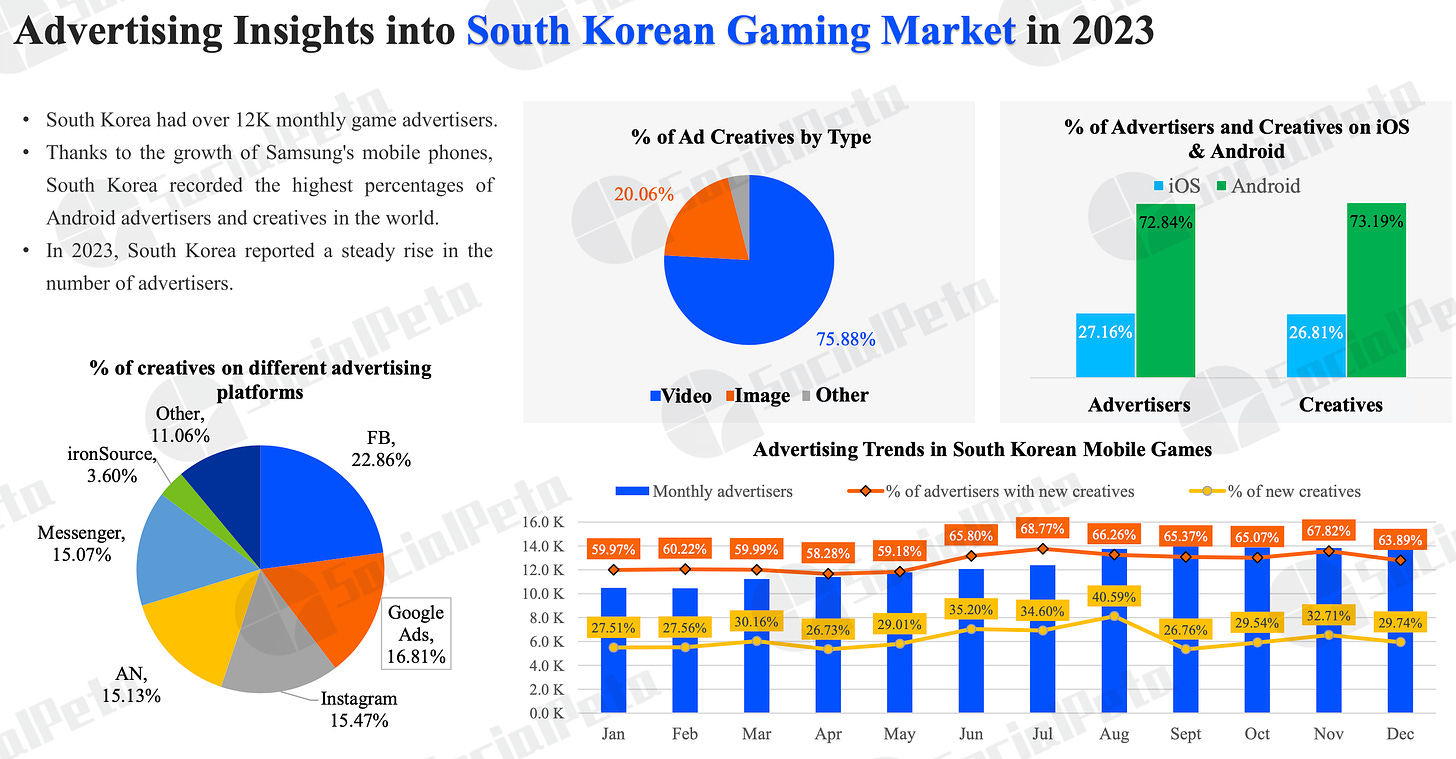
76,46% of all creatives on mobile devices are videos. 19,83% are static images; 2,14% are Playable; 1,32% are HTML creatives (it's not entirely clear what the difference is from Playable); 0,25% are carousels (it's not very clear why it's highlighted as a separate segment, as it's still static images).
-
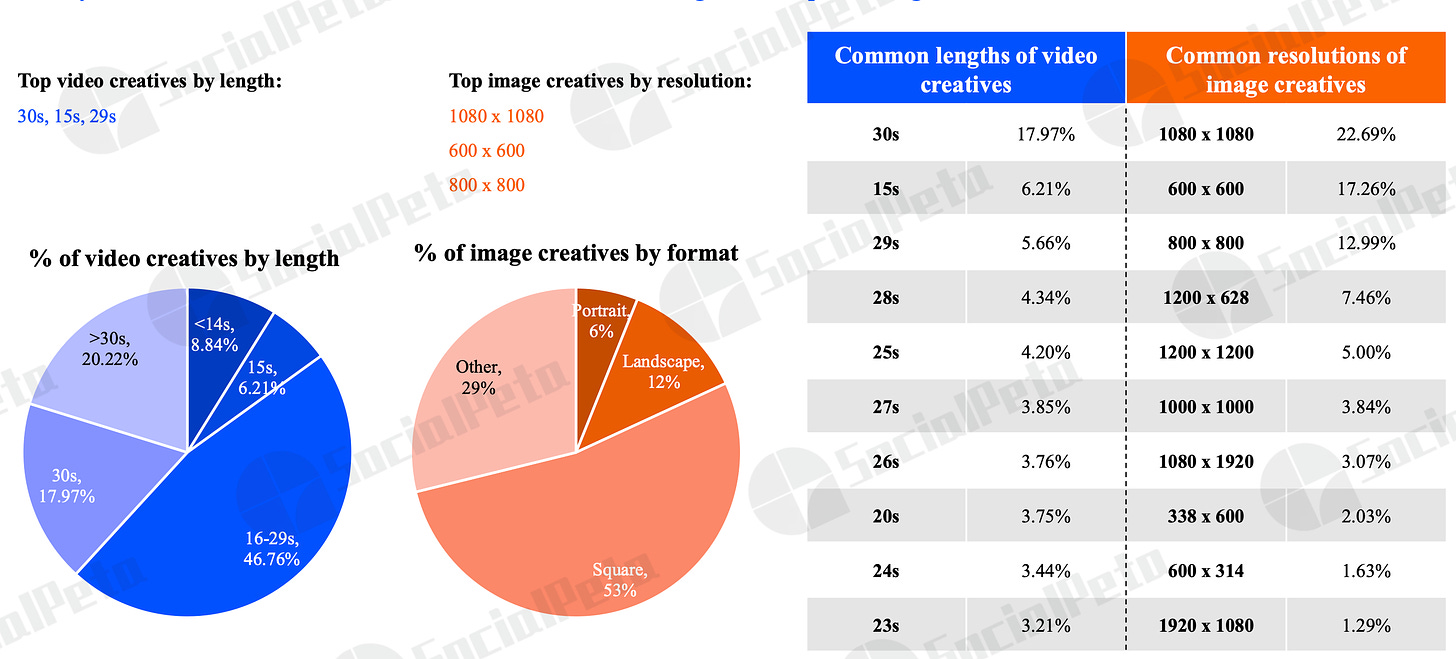
80% of video creatives were 30 seconds or shorter. The most popular (17.97%) are 30-second videos.
-
As for static images, square creatives account for 53% of the total number.
Genre Overview

-
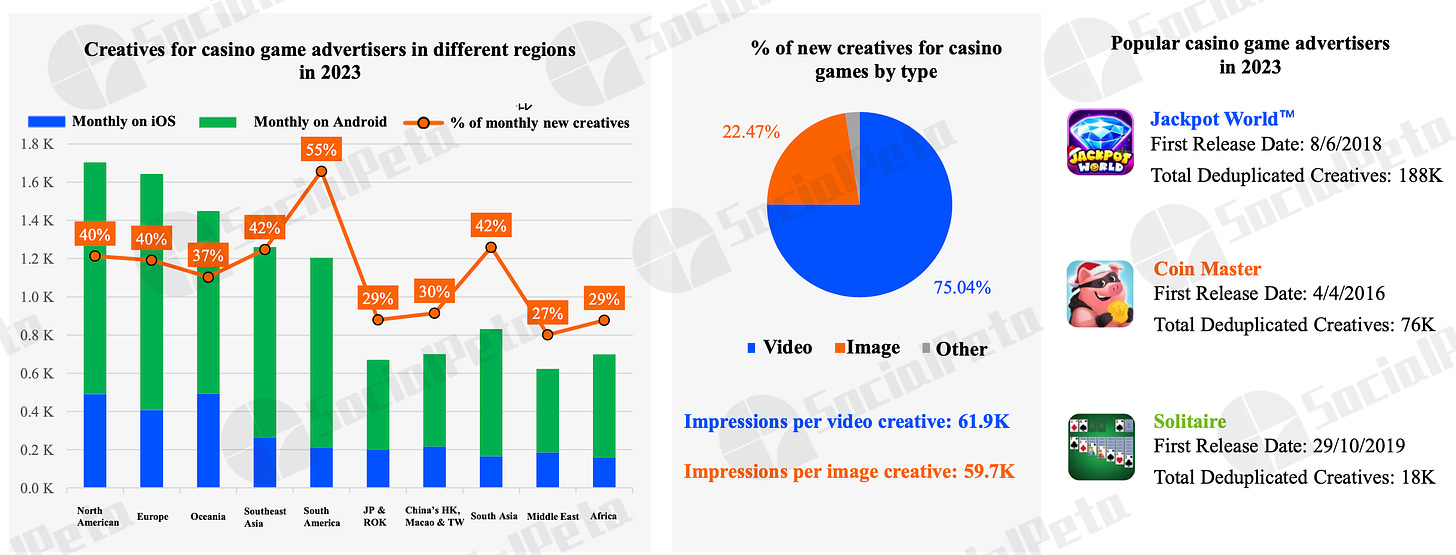
In 2023, 29.38% of all advertisers worked with casual projects (+0.94% YoY); 12.52% - with puzzles (+0.8% YoY); 9.18% - with simulators (+0.03%). Casinos showed the largest growth in advertisers (+1.9% YoY); arcade projects experienced the largest decline (-0.97% YoY).
-
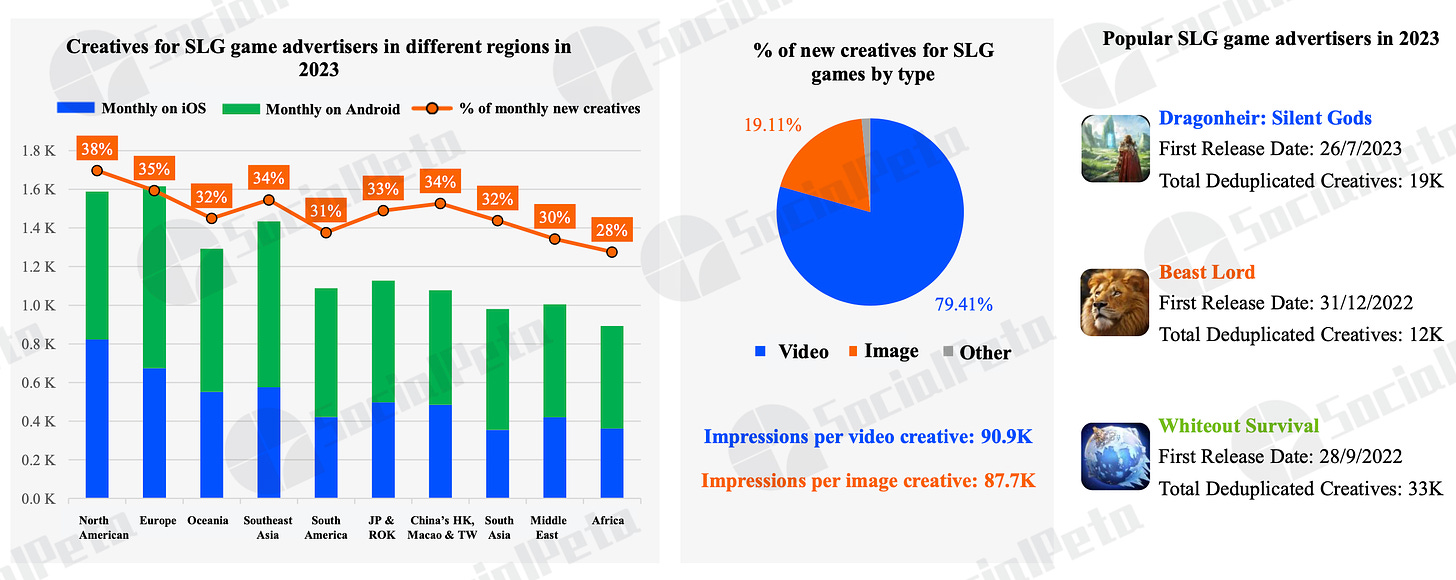
In the case of creatives, the situation is similar. Casual games account for 32.51% of all creatives (+9.5% YoY - record growth); puzzles - 11.18% (-1.18% YoY); RPGs - 10.2% (-1.23% YoY). SLG games saw the most significant drop in creatives (-2.08% YoY).
Market Details
-
In the USA, there are over 26 thousand monthly advertisers. This is the largest market by this component.
-
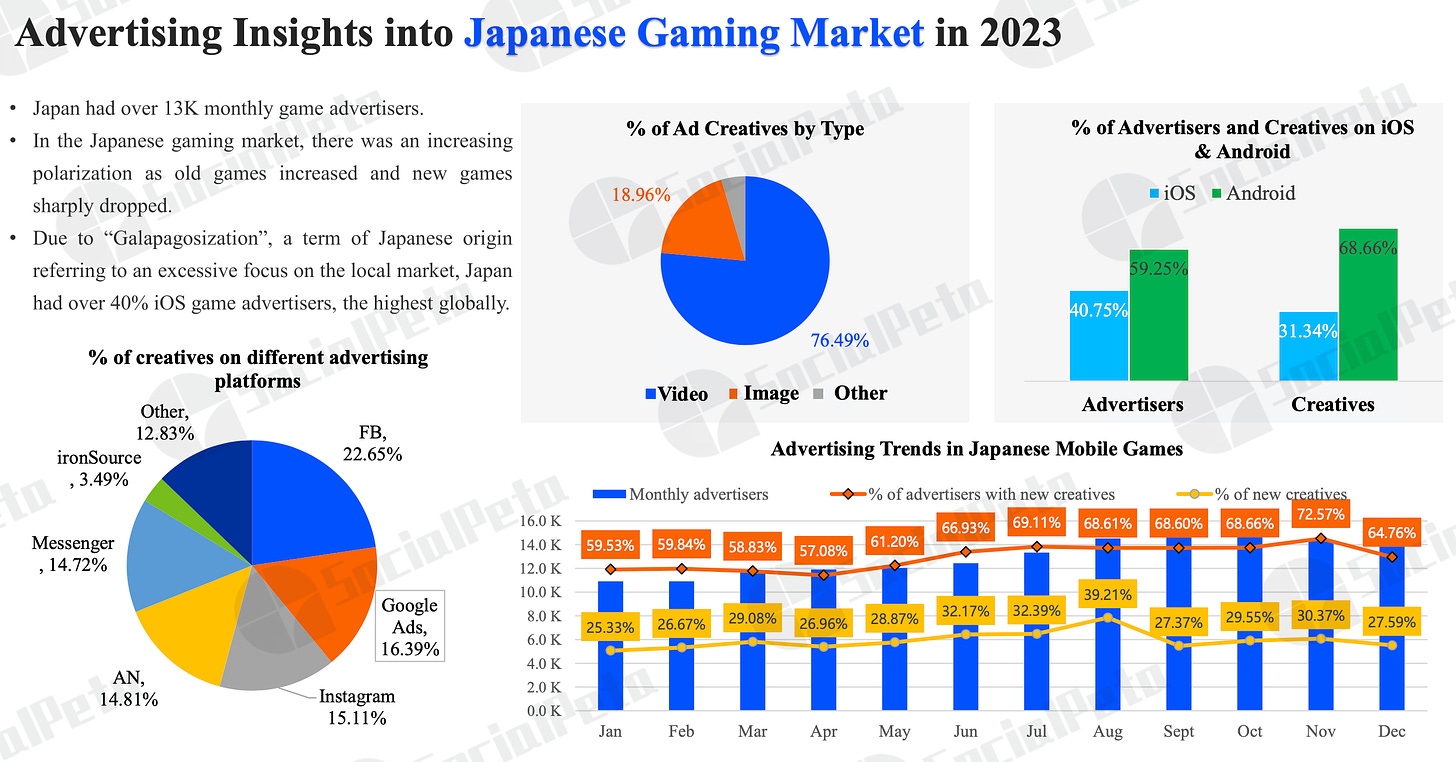
In Japan, the largest share of advertising is on iOS (about 40%), due to the focus of many companies on the local market.
-
In South Korea, on the contrary, the share of Android advertisers and creatives is higher (around 73%). This is due to Samsung's significant presence in the country. The number of advertisers in the country increased throughout 2023.
-
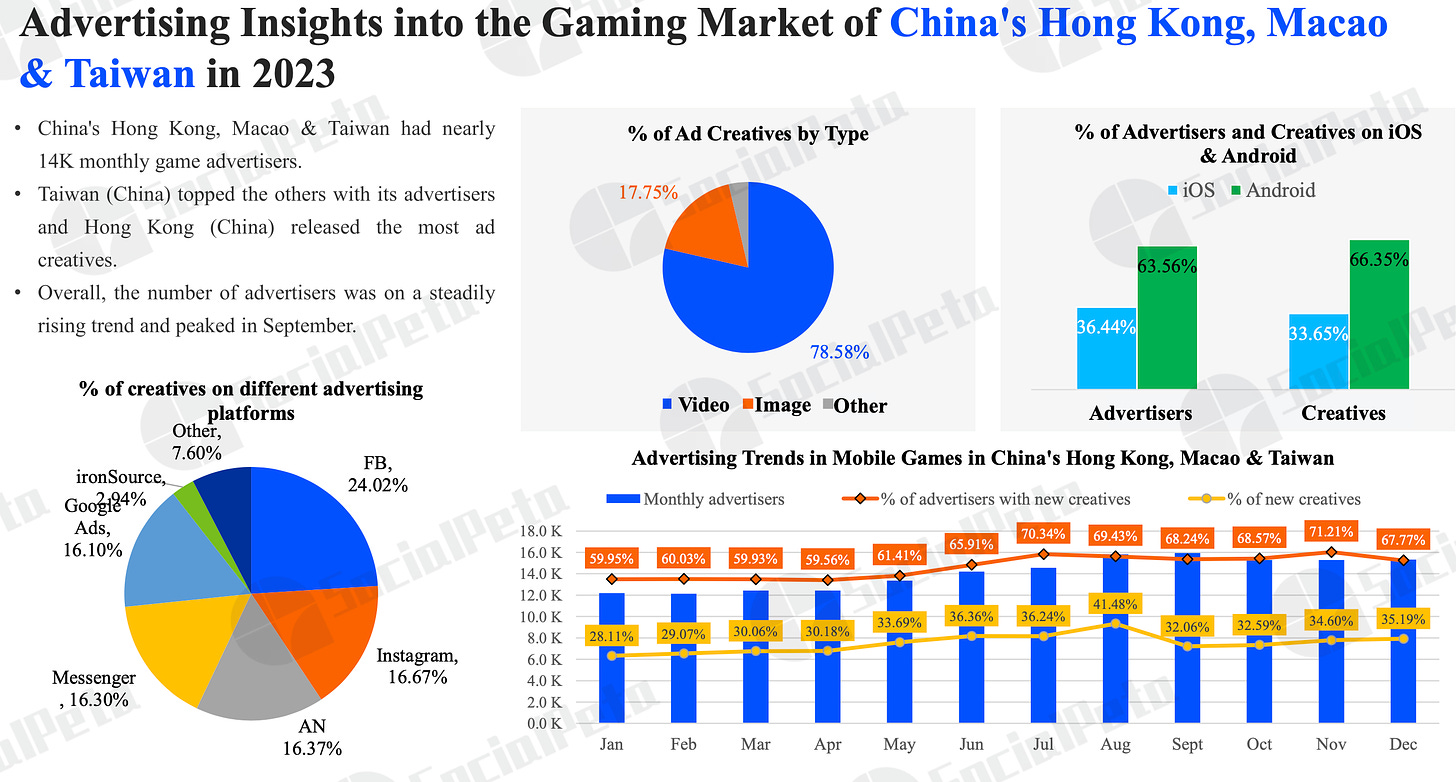
Taiwan and Hong Kong lead in the average number of creatives per advertiser.
-
In Southeast Asia, there are about 20 thousand advertisers. Interestingly, more than 50% of advertisers released ads for puzzles.
-
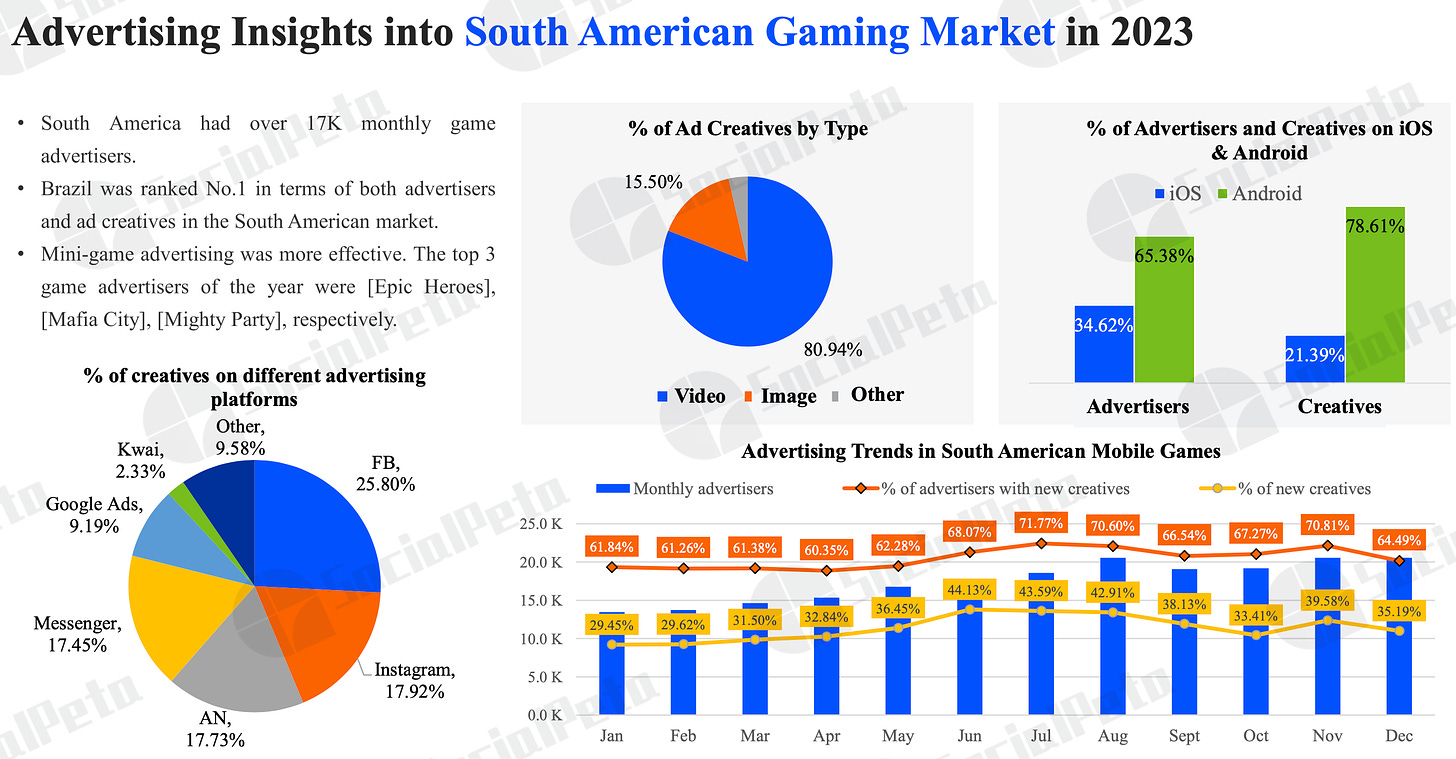
In South America, Brazil is the largest market both in terms of the number of creatives and advertisers. SocialPeta notes that Playables are very effective in the region.
-
The MENA region is the leading region in terms of the percentage of video creatives.
Genre Details
-
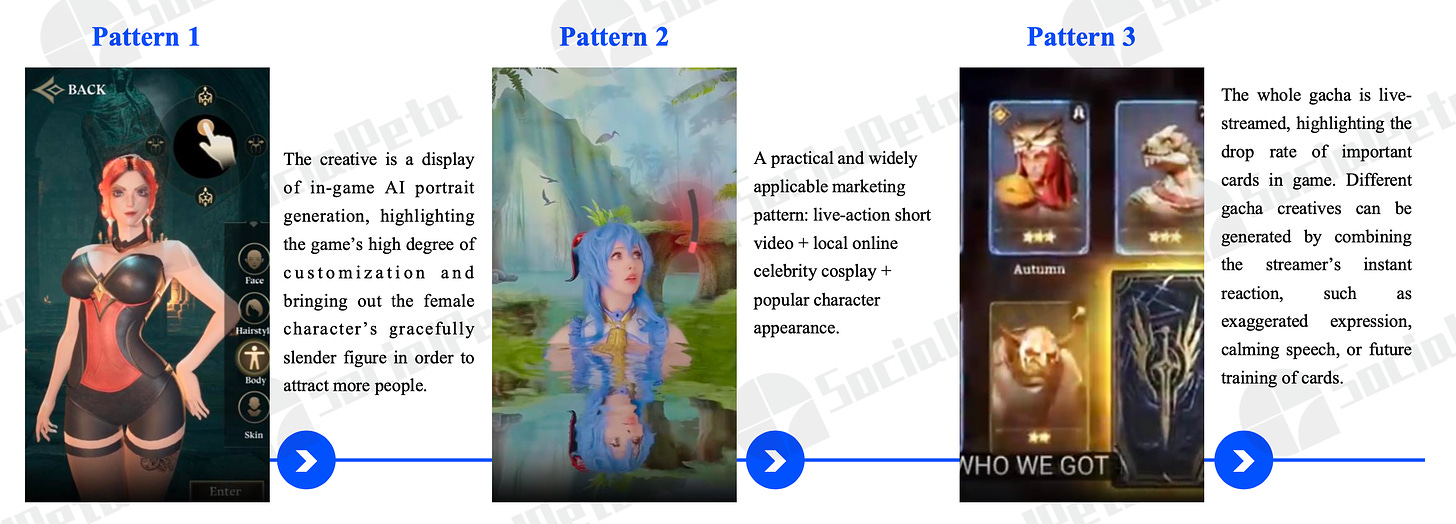
SLG games have the highest growth potential in Southeast Asia and the MENA region. Fake advertising, focusing on mini-games or sexualization of characters, leads to results.
-
Simulators (where SocialPeta includes idle games, life simulators, etc.) attract users through drama, guided by the fact that the majority of the audience are women.

-
In the case of RPGs, unlike SLG projects, creatives demonstrating character creation are popular; UGC creatives; map demonstration; gacha, and other game features.
-
Board games are particularly popular in North America (largely due to MONOPOLY GO!) and Africa. Successful creatives focus heavily on social interaction & problem-solving creatives.

-
In the advertising structure of casino games, Android dominates. SocialPeta notes that old projects maintain their positions in this category for years. And successful creatives actively demonstrate money and the opportunity to win a big prize.
Hit Game Cases of 2023
-
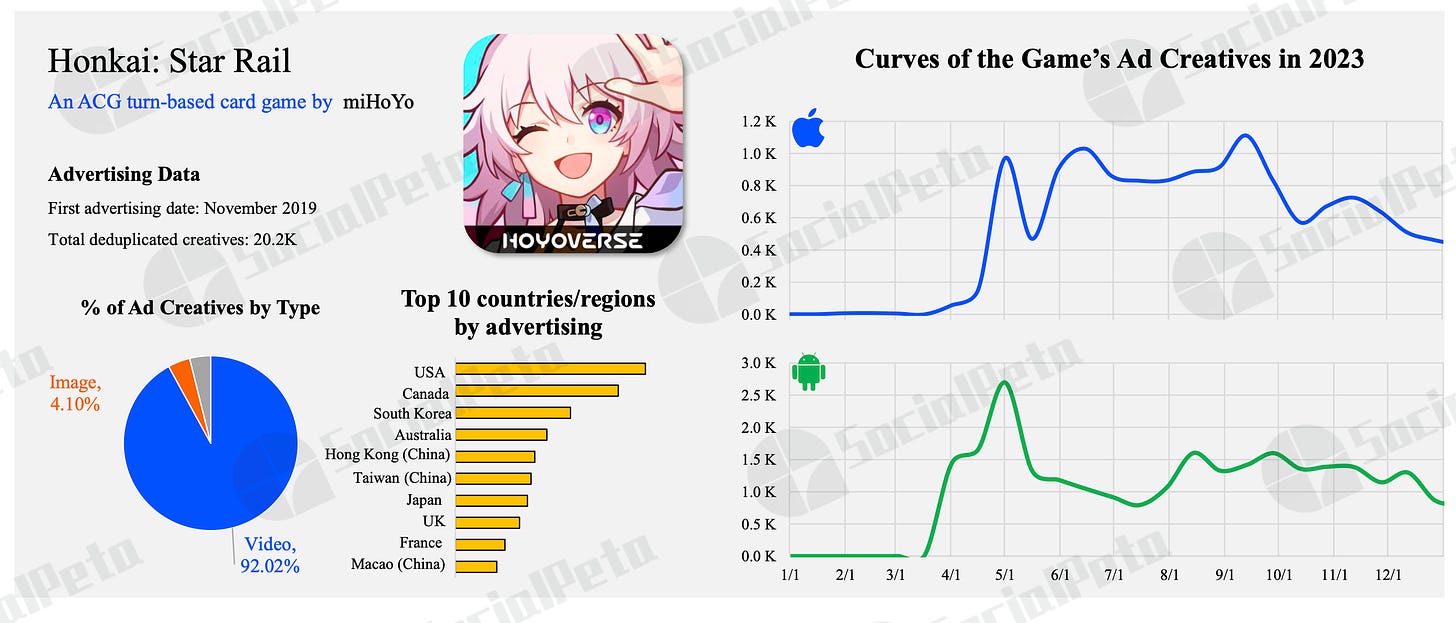
For Honkai Star Rail, the main markets are the USA, Canada, and South Korea. 92.02% of all creatives are videos. Developers have released over 20 thousand creatives since the release.
-
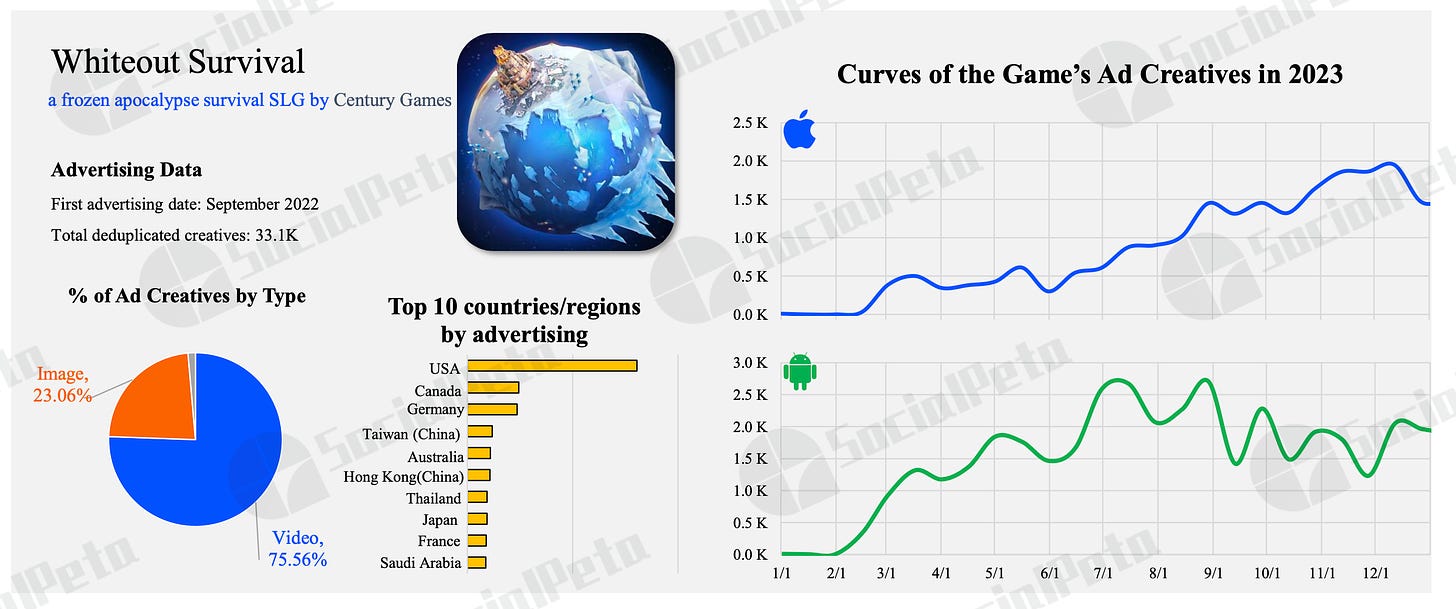
For Whiteout Survival, the main focus is on the USA. In second and third places (with a large gap) are Canada and Germany. 75.56% of all creatives are videos, and it can be seen that the company increased the number of creatives (and probably spending) on iOS throughout the year. In total, over 33.1 thousand creatives were released.
-
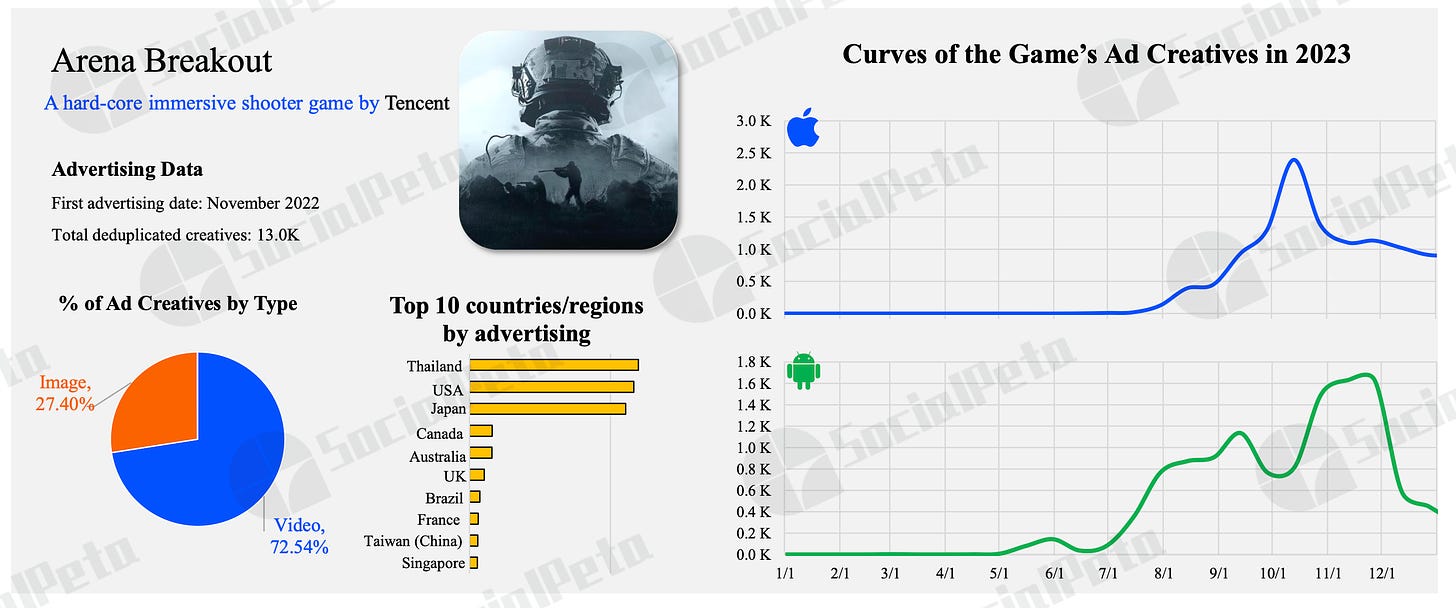
For Arena Breakout, the main markets are Thailand, the USA, and Japan. The company actively worked with creatives and advertising in October-November 2023, but then reduced volumes. In total, over 13 thousand creatives were released.
-
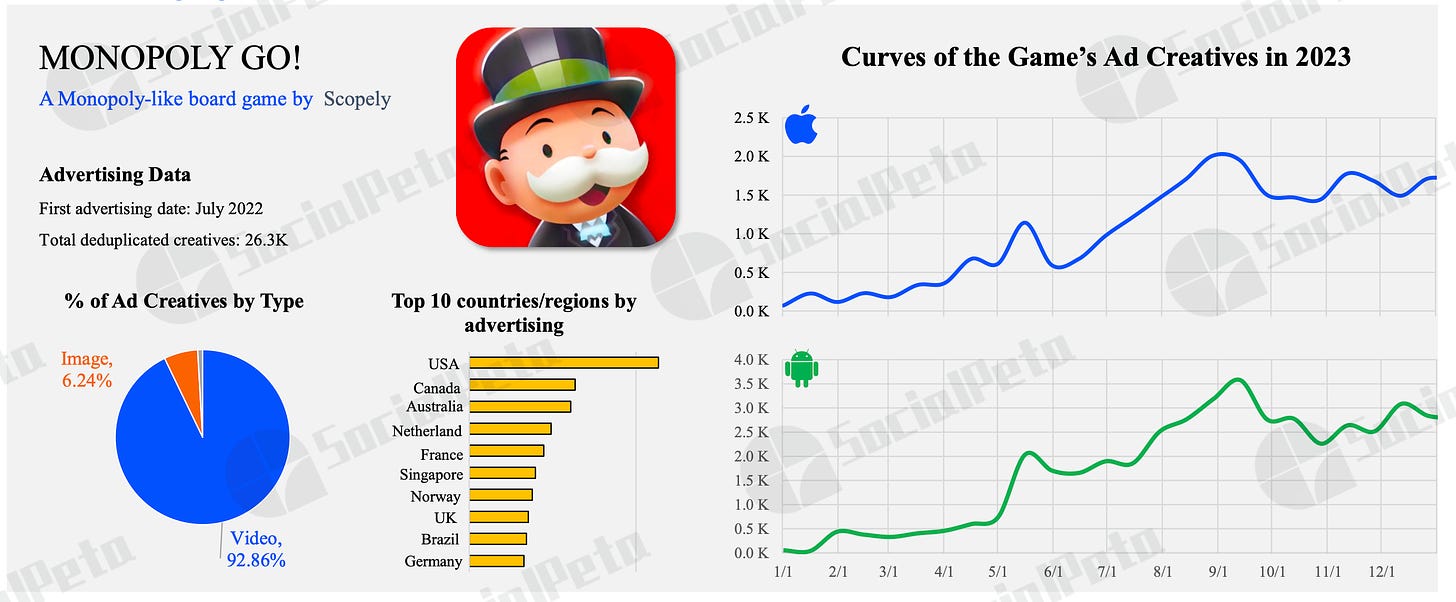
MONOPOLY GO! - a project with a fairly evenly distributed advertising across countries. In first place, with a large margin, is the USA; but then followed by Canada, Australia, the Netherlands, France, Singapore. In total, Scopely released 26.3 thousand creatives for the project, 92.86% of which are videos.
-
Block Blast! - another notable release of 2023. Since the launch of the project, the company has made 60.5 thousand creatives, focusing on the USA, India, and Indonesia. 96.59% of these creatives are videos.
Mobile Marketing Trends in 2023
-
The most marketing budgets in 2023 were allocated to advertising with mini-games.
-
AI content began to be widely used in creative production. This is especially noticeable in the RPG genre, particularly MMORPG projects.
AppMagic: Lessons of 2023 for casual games
The analytical platform studied genres based on their performance in Tier-1 Western markets (USA, UK, Australia, Canada, France, Germany). Projects were considered successful if they earned over $50,000 per month in these markets (after deducting commissions and taxes).
-
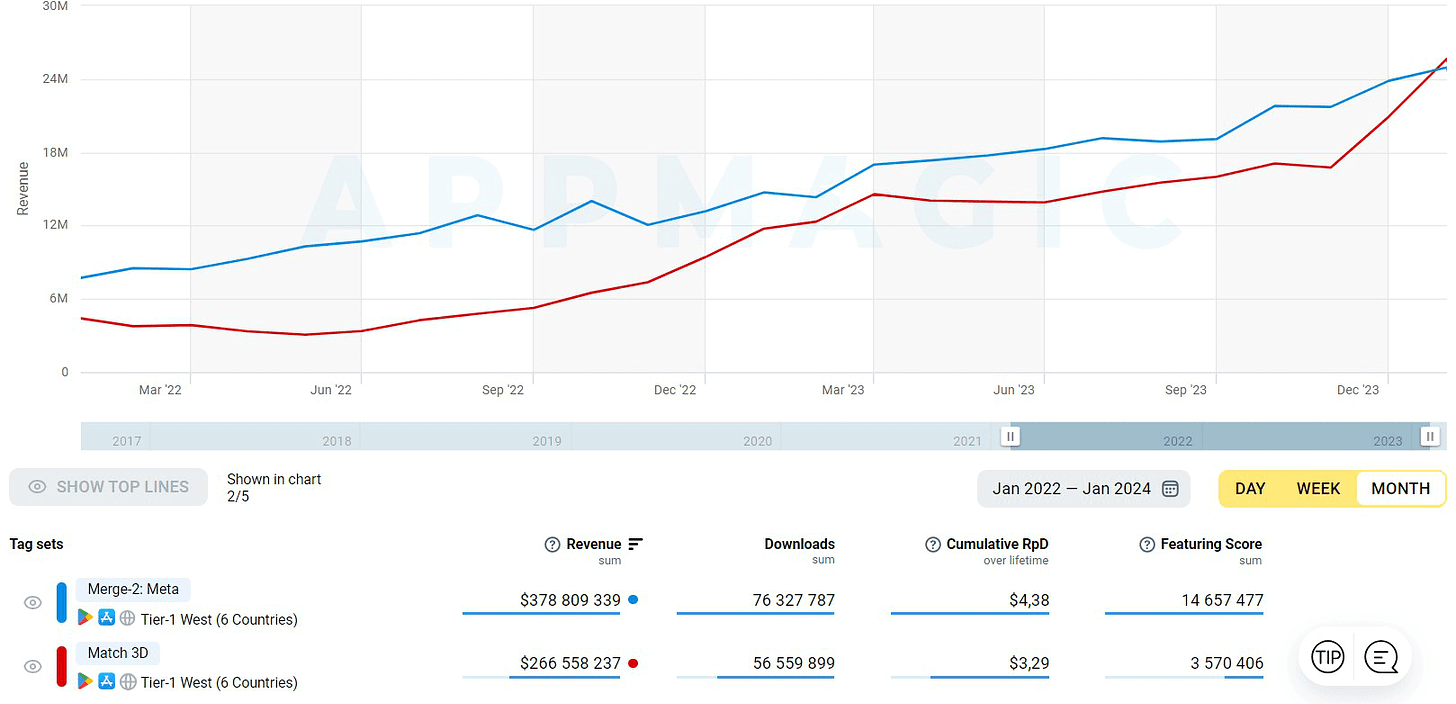
AppMagic highlighted 5 genres for detailed study: Merge-2 and Merge-3 with a meta; Match 3D; Match-3 with a meta; and Idle Tycoon.

Merge-2 with a meta
-
In 2023, 101 projects were released in this genre. None of them reached the $50,000 revenue mark per month or more on the selected markets. 0% Success Rate.
-
However, the genre itself grew by 73% compared to the previous year, fueled by existing projects. My Hamster Story started earning in Asia, but it's not considered in this study.
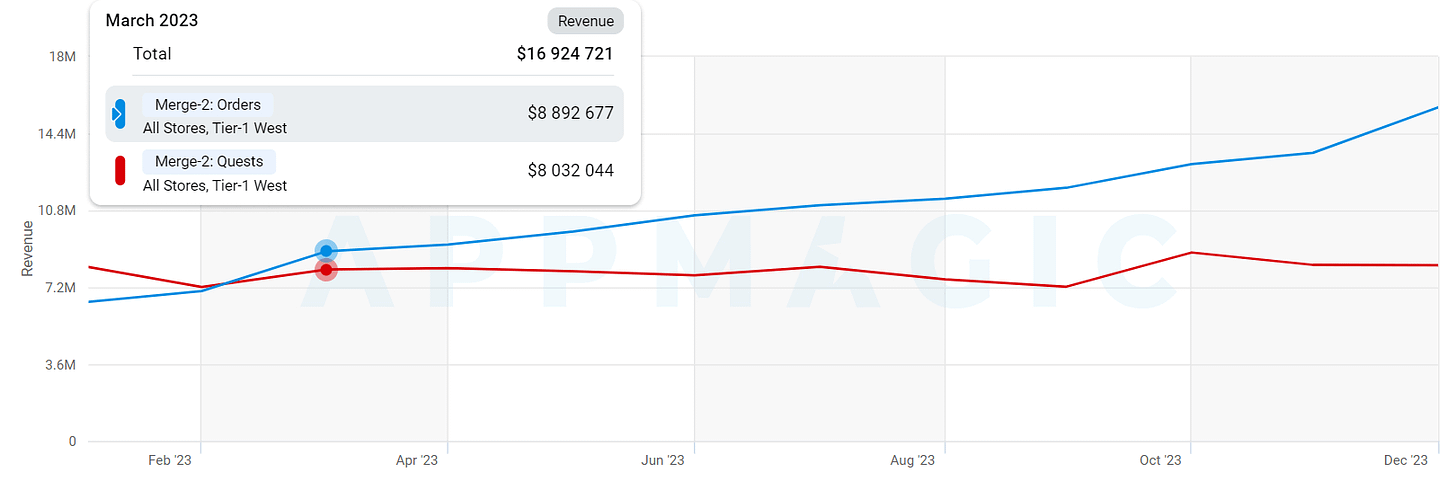
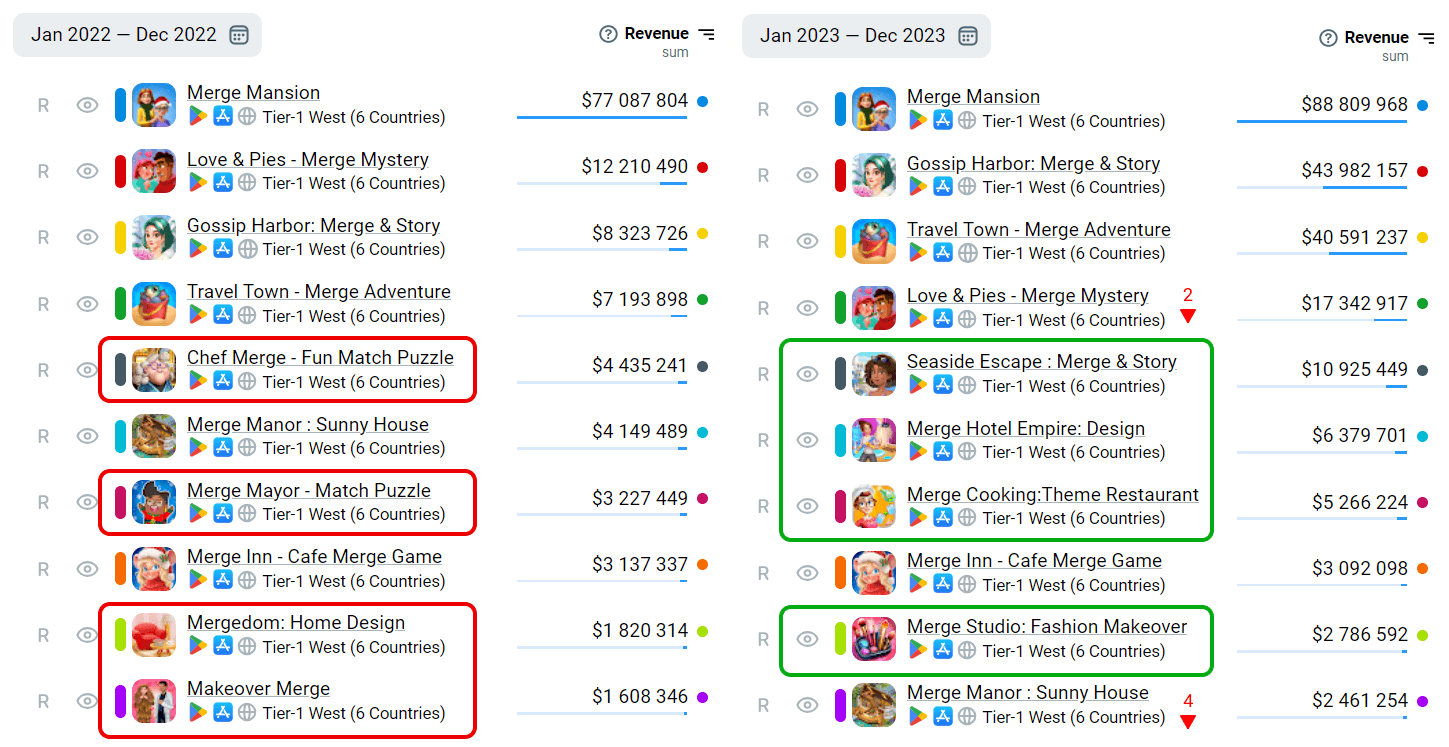
- AppMagic categorizes projects within the genre into those based on quests (like Merge Mansion) and those based on orders (like Travel Town). The first category isn't doing well; only two projects were released in 2023, and Merge Mansion downloads dropped by 25%.
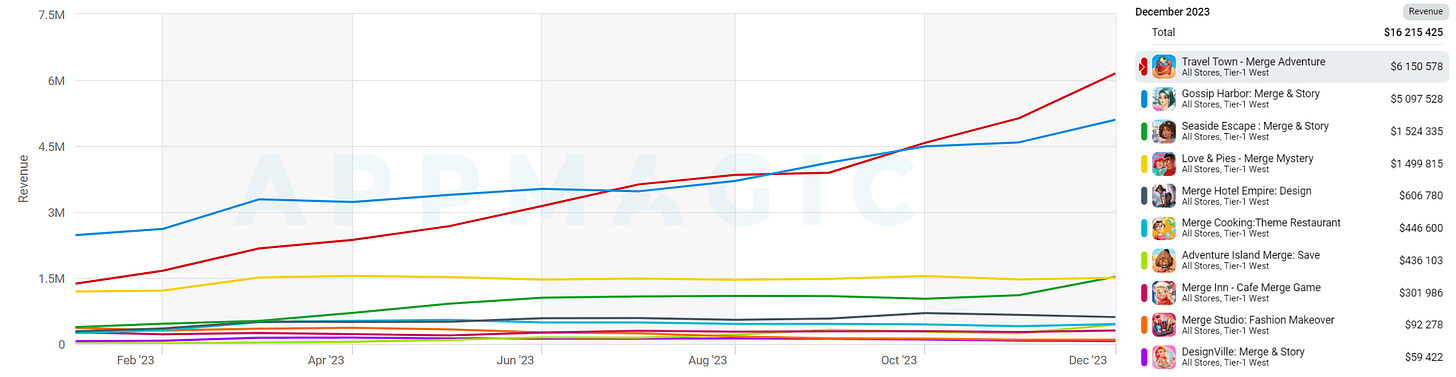
- However, this didn't prevent Merge Mansion from leading the revenue chart by a large margin. The game earned $88.8 million in 2023. The closest follower, Gossip Harbor: Merge & Story, earned $43.9 million.
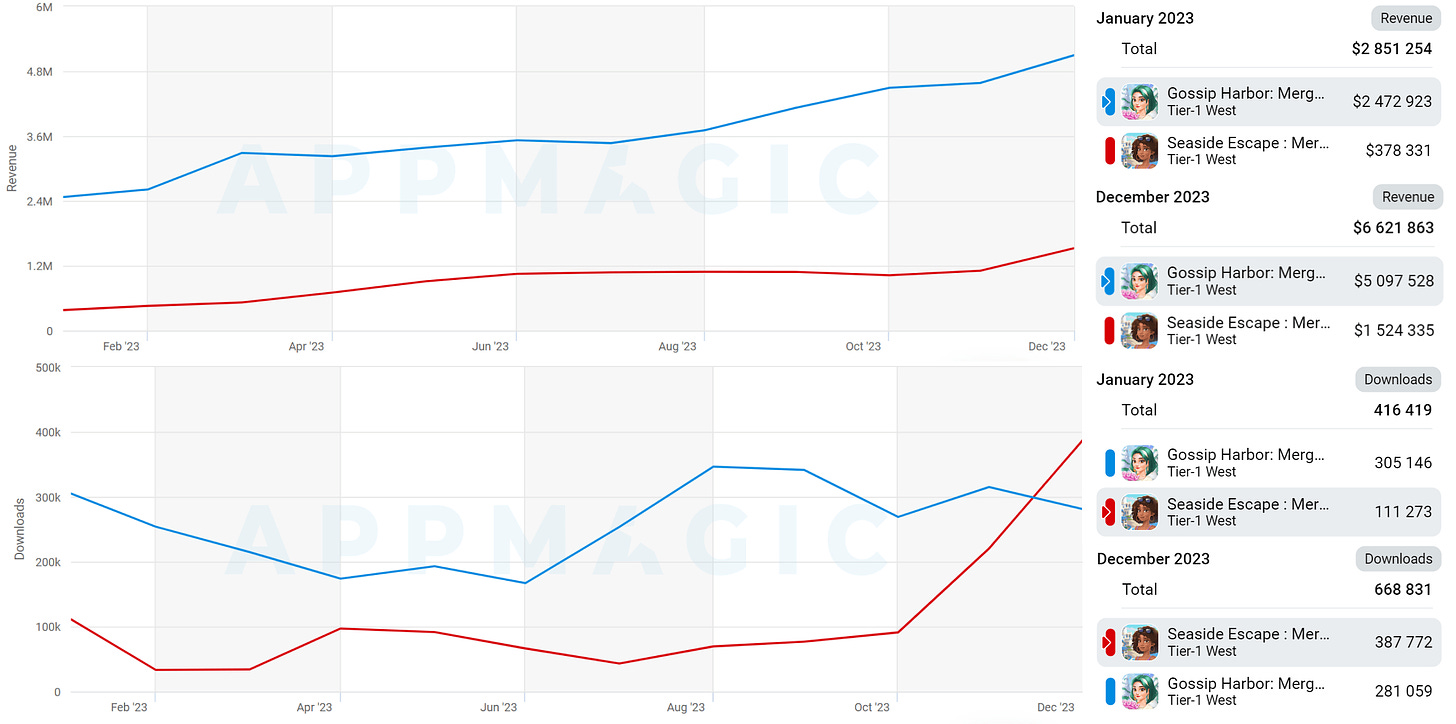
- Despite no successful releases in 2023, the top 10 revenue-wise saw significant changes. Three new projects released in 2022 entered it. It's possible that projects in this genre require more time to demonstrate significant results.
Match 3D
-
65 games in this genre were released in 2023. 5 projects were marked as successful, with a success rate of 8%.
-
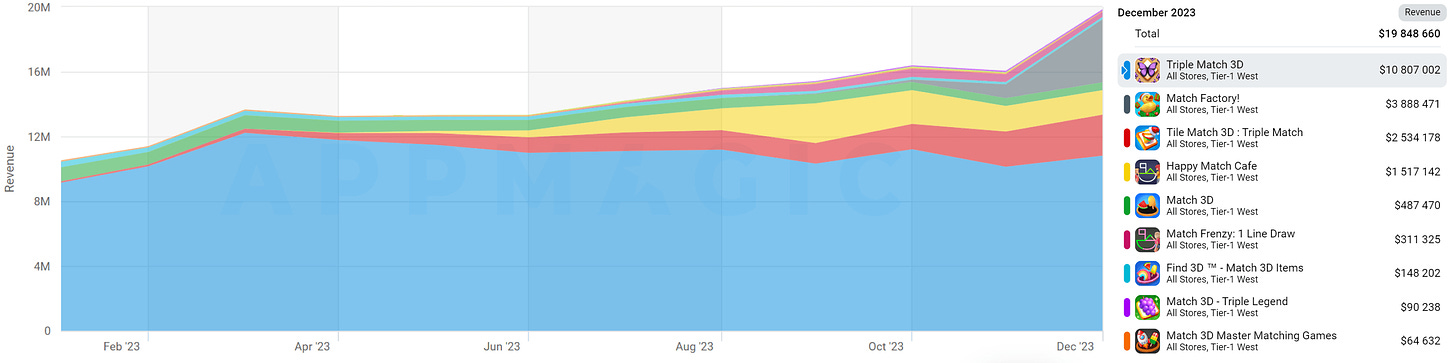
Immediately, 4 projects released in 2023 earned over $1 million in December 2023. And Triple Match 3D crossed the $10 million mark.
-
Despite the niche's growth, AppMagic fears that the window of opportunity may soon close. Standing out among competitors may help by releasing games with more complex goals.
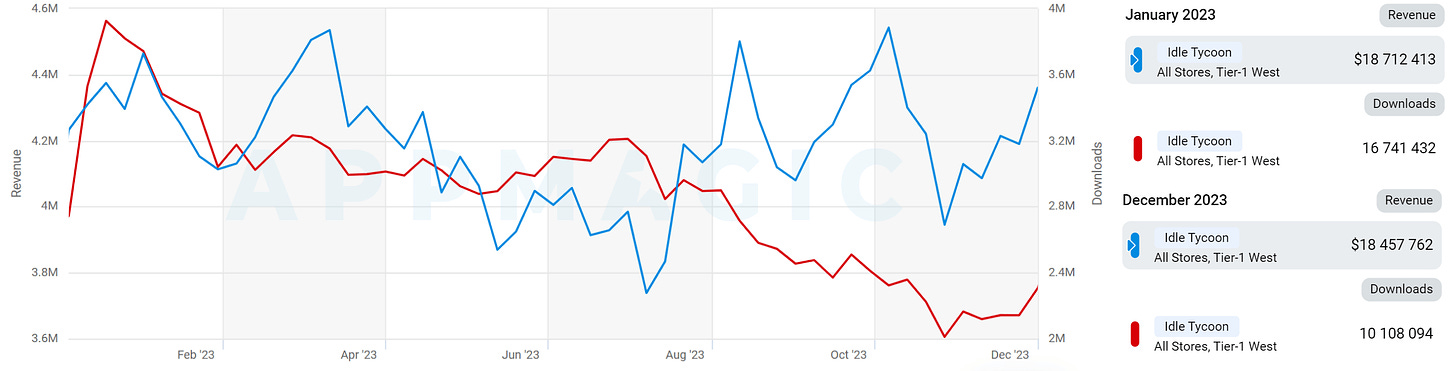
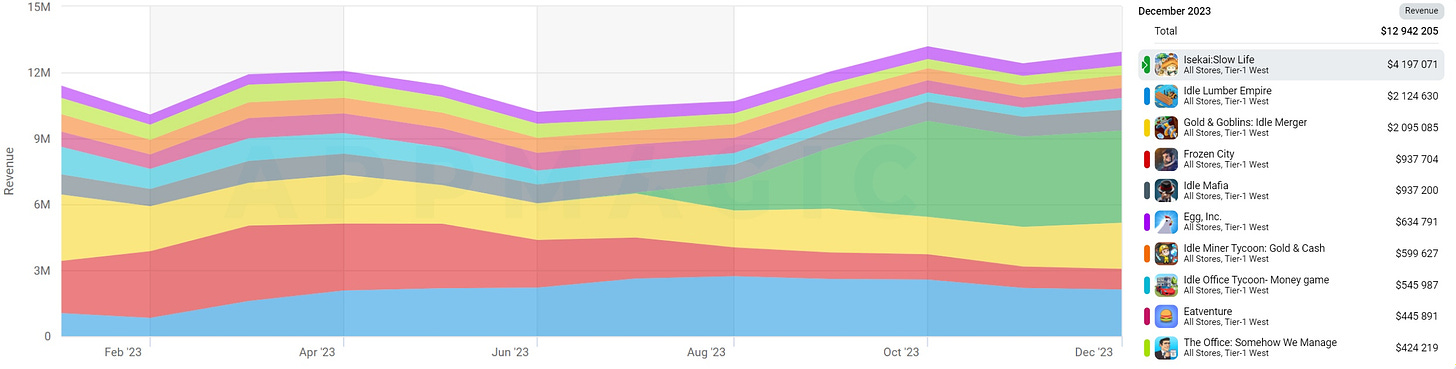
Idle Tycoon
-
412 games were released in 2023; 3 of them were successful. Success Rate - 0.7%.
-
Isekai: Slow Life earned 25% of the genre's total revenue in December 2023.
-
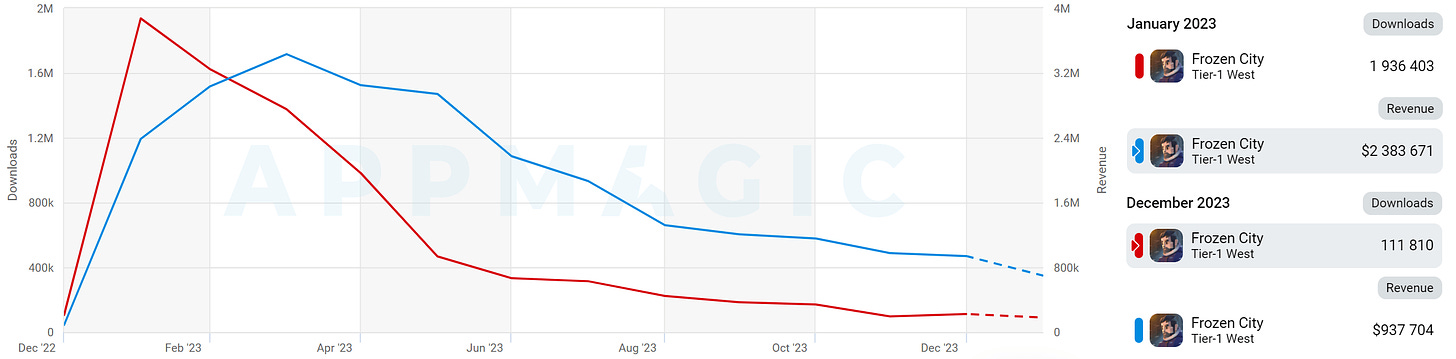
Frozen City reached its revenue peak in January 2023 and peak downloads in March. After that, the project declined, presumably because developers switched to more efficiently monetized Whiteout Survival.
-
The genre, overall, is very competitive. Besides constant game improvements, attention to LiveOps and monetization is required.
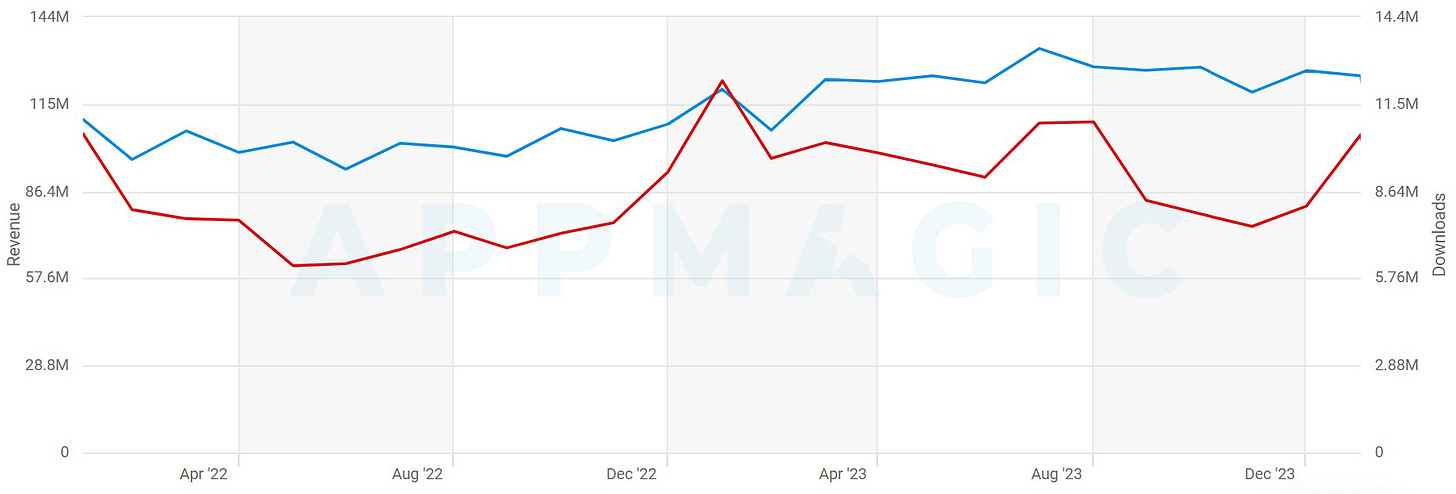
Match-3 with a meta
-
162 projects were released in 2023. 4 successful projects (6 if counting Asian markets). Success Rate - 2.5%.
-
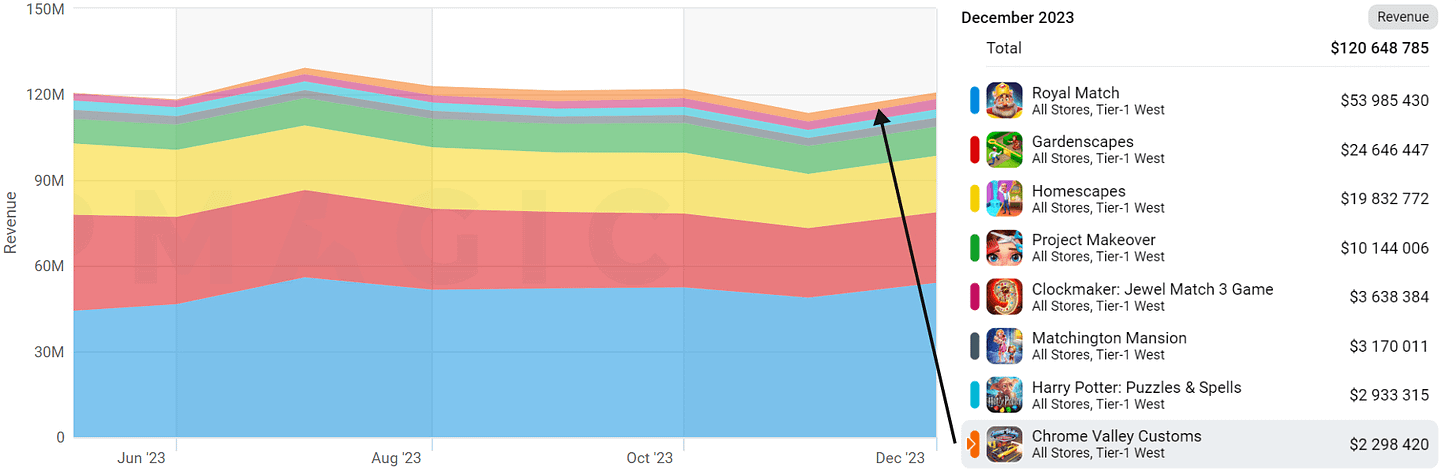
Contrary to the market's general state, Match-3 with a meta grew in revenue in 2023, largely thanks to Royal Match and Gardenscapes.
-
Chrome Valley Customs is the only project in the genre that managed to enter the top 10 revenue-wise. Interestingly, another similar project - Forza Customs - Restore Cars - is attempting to target a male audience with Match-3, a genre historically considered female-oriented.
Merge-3 with a meta
-
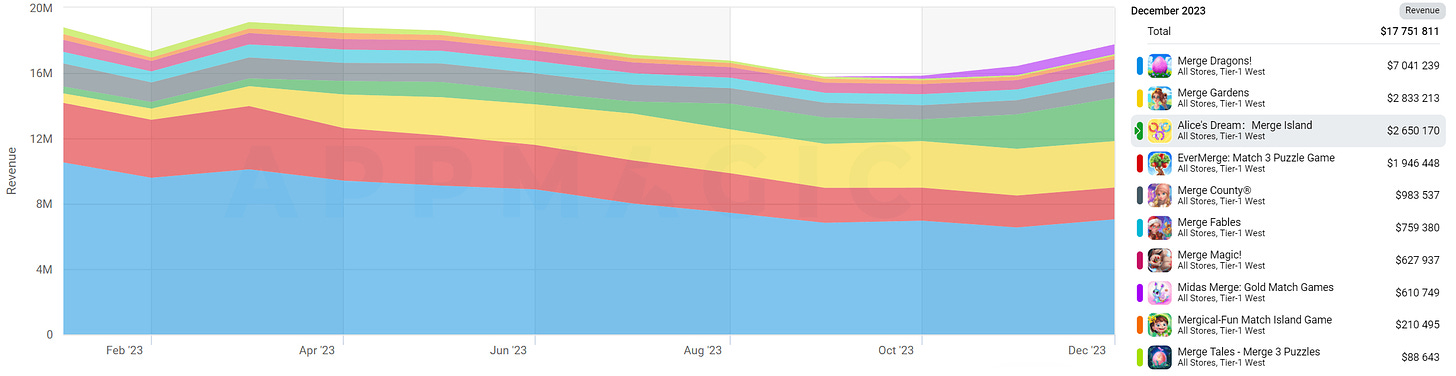
41 projects were released in 2023; 3 of them were successful. Success Rate - 7.3%.
-
AppMagic notes that the genre has a very high entry barrier - expensive and complex in development.
-
None of the successful projects in the genre released in 2023 came close financially to EverMerge and Merge Dragons.
GSD & GfK: The UK gaming market (PC & Console) declined in February 2024
Analytical platforms report only actual sales figures obtained directly from partners. The mobile segment is also not taken into account.
Game Sales
-
2.77 million games were sold on PC and consoles in the UK in February 2024. This is 5.5% less than in February of the previous year.
Important note: Palworld was not taken into account in the calculation.
-
Analysts note that the 5.5% decline is actually a good result because Hogwarts Legacy was released in February last year.
-
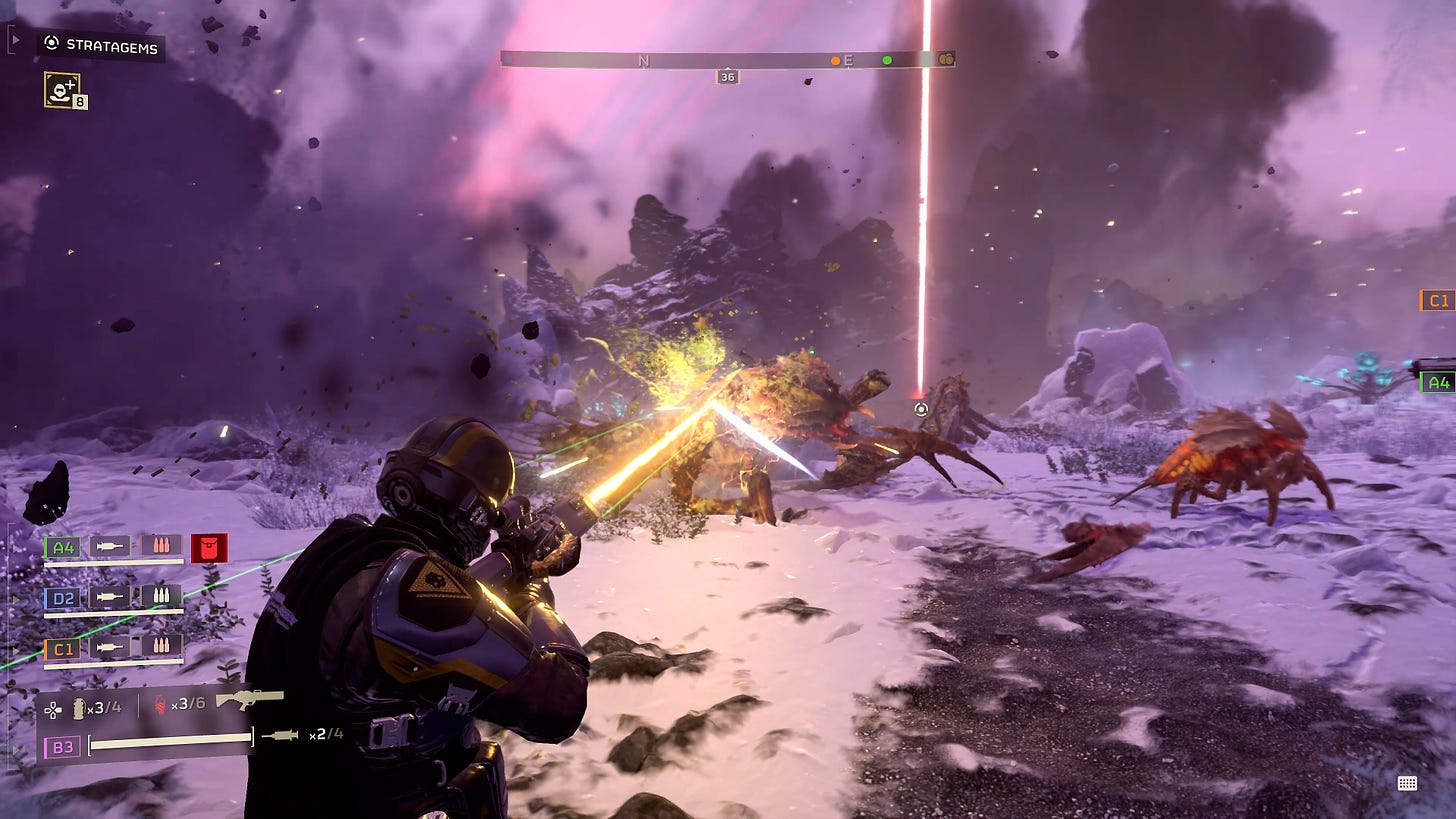
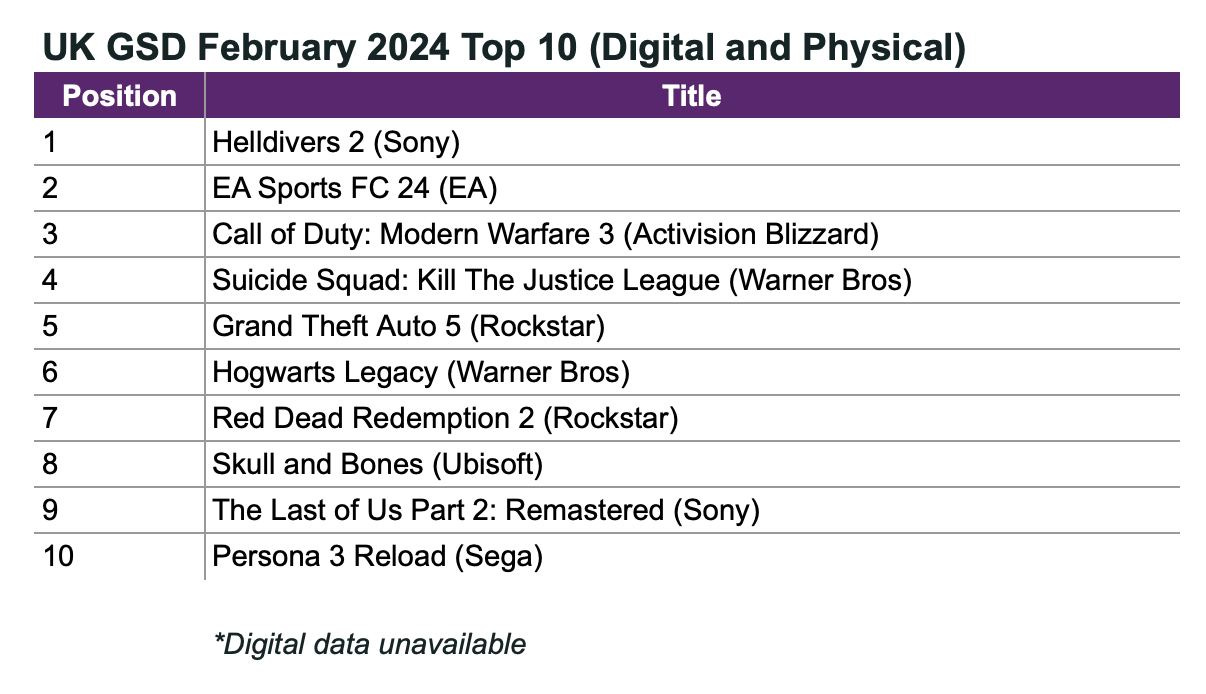
Replacing the wizards, Helldivers II emerged as the sales leader by a significant margin. Moreover, in the second week, the game sold 115% better than in the first week, and in the third week, it sold 21% better than in the second week. 57% of the project's sales were for the PlayStation 5 version.
- The sales of Helldivers II for the first 3 weeks are only 28% lower than those of Marvel’s Spider-Man 2 in the UK.
-
Suicide Squad: Kill the Justice League debuted at the 4th position on the chart. Sales after the first 4 weeks were 20% lower than those of Gotham Knights and Marvel’s Guardians of the Galaxy. The publisher is dissatisfied.
-
Skull and Bones debuted at the 8th position. The sales of Ubisoft's AAAA game after the first two weeks were 75% lower than those of Sea of Thieves in March 2018.
Hardware Sales
-
95,855 consoles were sold in the UK in February. This is 33% less than the previous year and 13% less than January.
-
PS5 is the sales leader. However, the trend is negative, with sales being 2% lower than January and 28% worse than the previous year.
-
Nintendo Switch takes the second place; Xbox Series S|X is third.
-
Overall, console sales in the UK at the end of February are 29% worse than the previous year. However, this is more likely due to deferred demand realized in 2023.
-
609.4 thousand accessories were sold in February. This is 12% less than January but 16% higher than February 2023. DualSense is the most successful accessory.
Famitsu: Persona 3 Reload tops Japanese retail chart in February 2024

Famitsu only takes physical sales into account.
Game Sales
-
For the first time in 8 months, a PlayStation game topped the Japanese chart - Persona 3 Reload. The game sold 95 thousand (physical) copies on PS5, with the PS4 version selling 52 thousand copies.
-
Second in sales was Mario vs. Donkey Kong (89k copies).
-
In third place is Cygames with their Granblue Fantasy: Relink - 63 thousand copies.
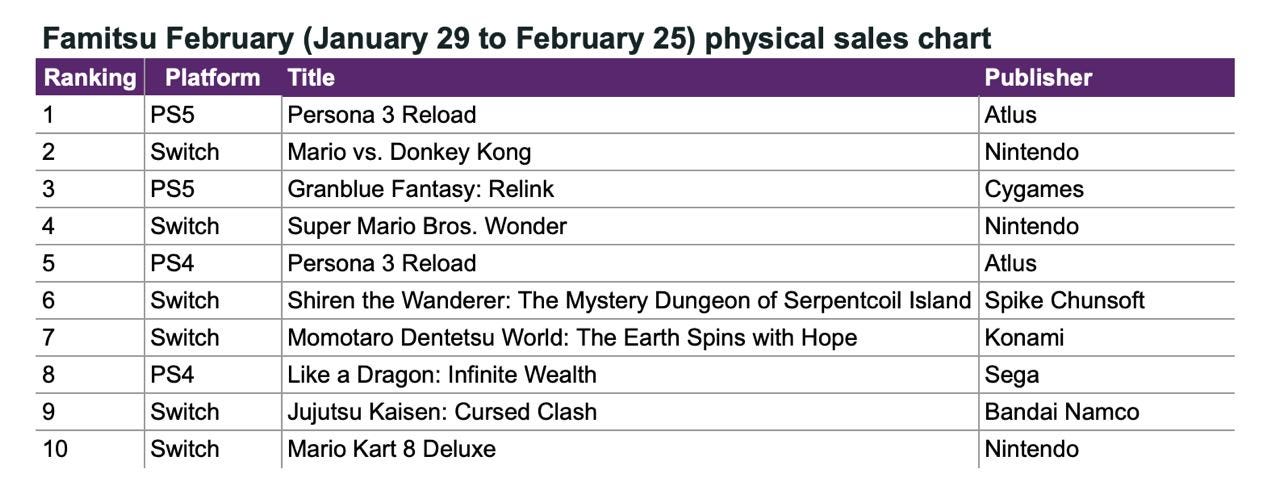
-
However, this did not prevent Nintendo from leading the chart of the most successful publishers by a large margin. Nintendo's physical games were bought 399 thousand times in February (30% of the total market); Atlus - 153 thousand times (12%); Cygames - 93 thousand times (7%).
Console Sales
-
The success of Persona 3 Reload did not help to move Nintendo Switch from the top position. The console was bought by 191 thousand people in February.
-
PlayStation 5 sold 147k systems in February.
Monopoly GO! has earned over $2B
-
It took the game 10 months to reach this milestone.
-
Analytical services do not see a significant portion of the project's revenue. For example, according to AppMagic data, the game earned $919.6 million after deducting platform fees and taxes. Similar figures, around $897 million, are shown by data.ai.
-
SVP Scopely, Jamie Berger, noted at last week's Think Games conference in Istanbul that Monopoly GO! is a very profitable game.
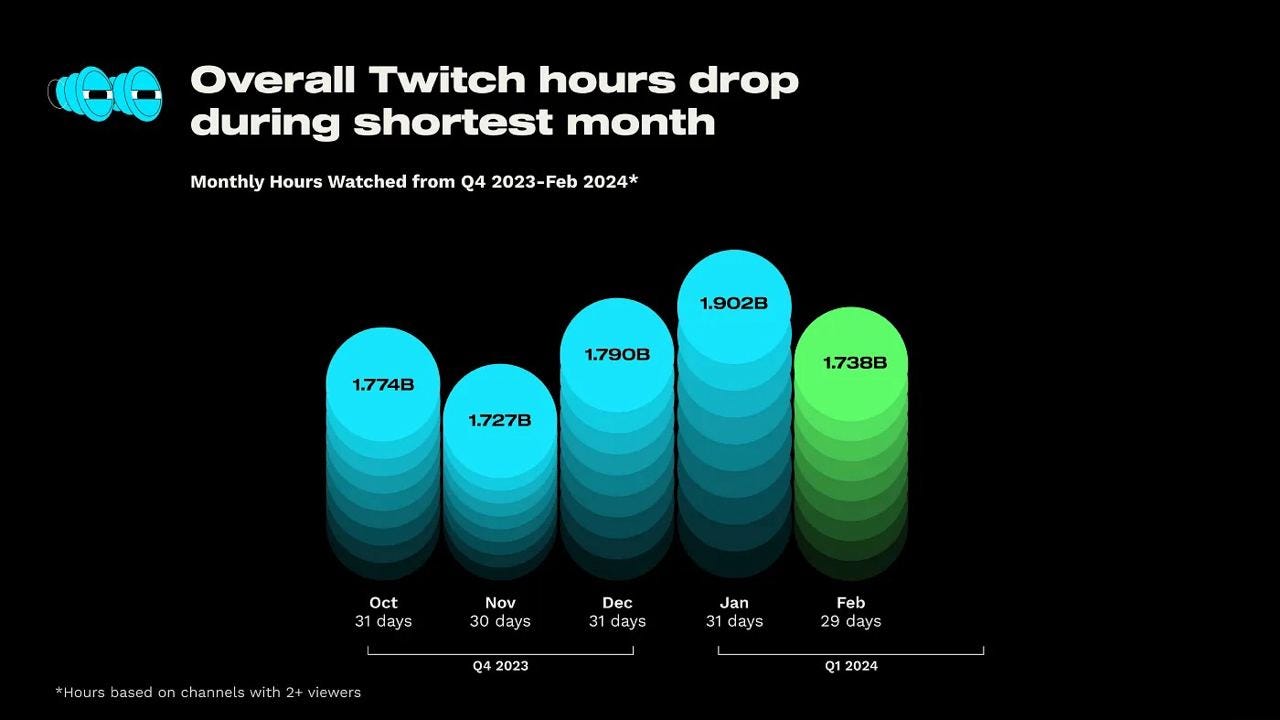
StreamElements & Rainmaker.gg: State of the Streaming Market in February 2024
-
The total number of watched hours in February 2024 amounted to 1.73 billion. This is less than December and January, but the month is shorter. Moreover, the figure is higher than in November 2023.
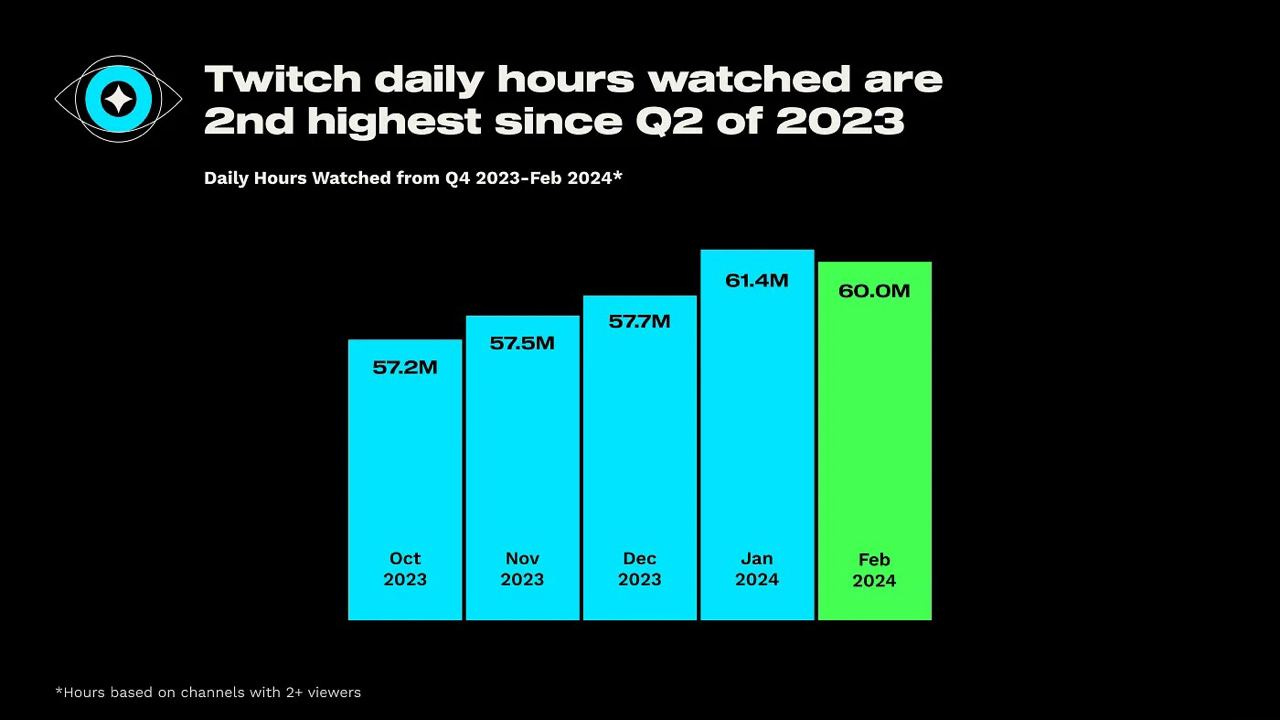
- The average number of watched hours per day - 60 million - is the second highest since the second quarter of 2023. Only January 2024 had more.
-
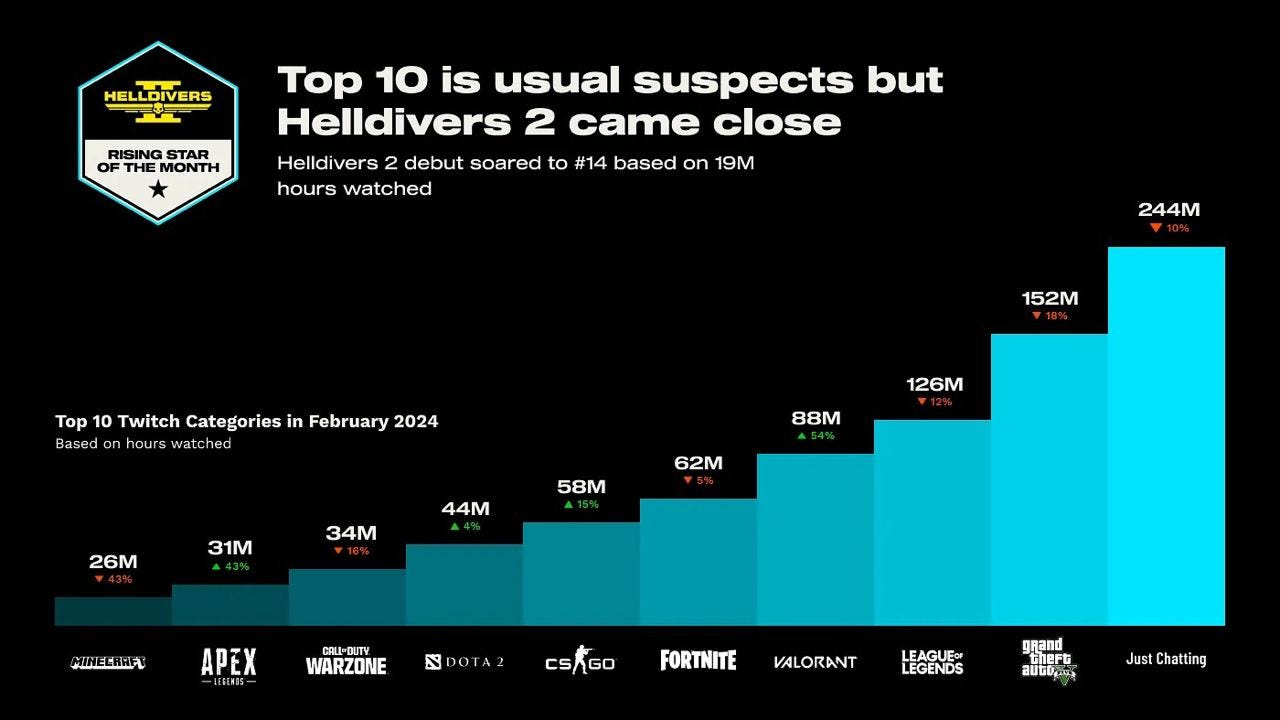
Helldivers II failed to make it into the top 10 in terms of views. The game took the 14th position with 19 million watched hours.
-
The leaders are Grand Theft Auto V (152 million hours), League of Legends (126 million hours), and Valorant (88 million hours).
80 Level: 45.6% of the game industry workers are living from a paycheck to a paycheck
The company surveyed over 1000 employees in various positions within the gaming industry.
❗️Given the portals audience, the survey sample predominantly included programmers, artists, and animators. There might have been a smaller sample among marketers, service department employees, business development personnel, and management.
-
39.6% of gaming industry employees earn less than $40,000 per year. 19.7% earn less than $20,000 per year.
-
34% earn between $40,000 and $80,000 per year.
-
15% have salaries ranging from $80,000 to $150,000 per year.
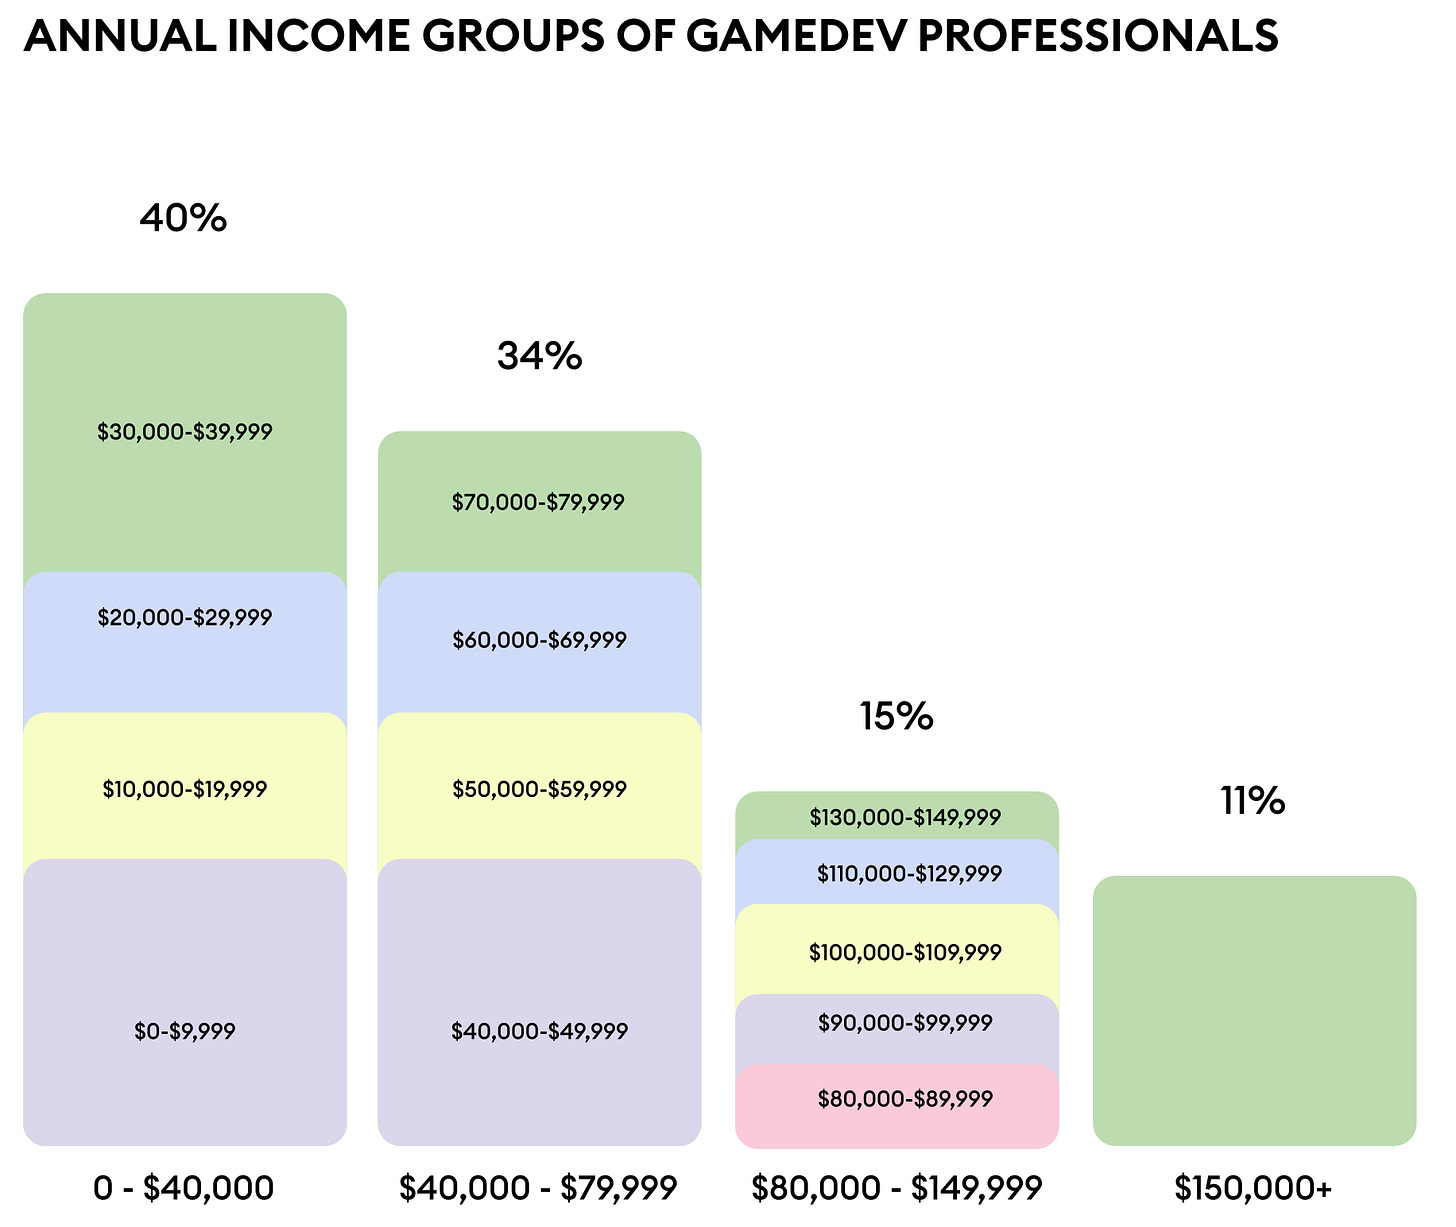
- 11% of gaming industry employees earn over $150,000 per year.
Costs of Living
-
7.7% of developers noted difficulties in meeting basic needs (such as buying food and paying bills).
-
6.2% have their basic needs covered but cannot afford clothing.
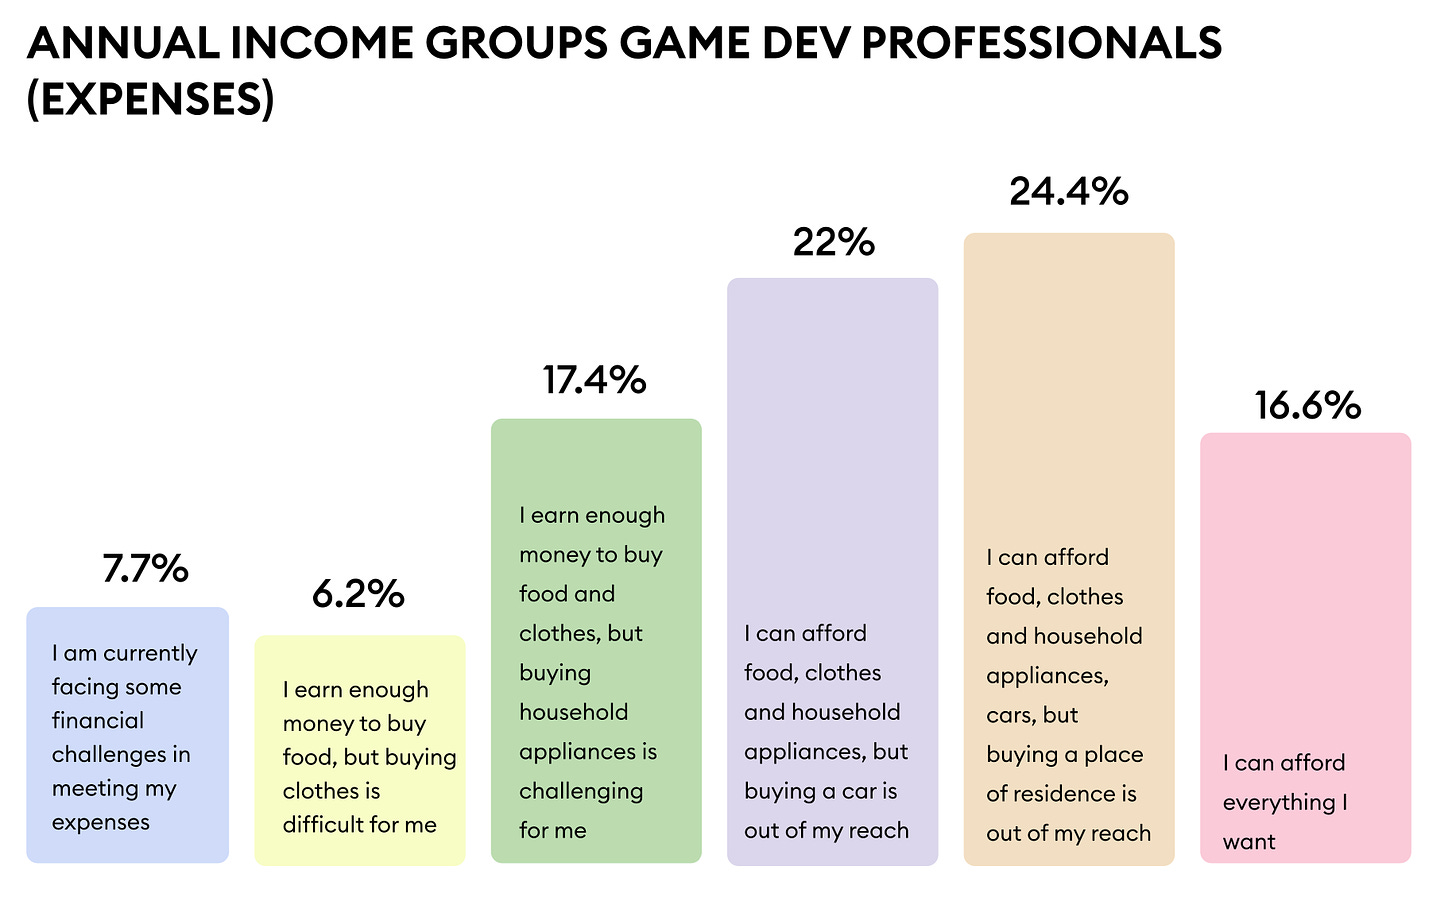
- 17.4% have these needs covered but struggle with purchasing more expensive household items.
-
The next category - 22% - can afford all of the above, but buying a car is out of reach for them.
-
24.4% of employees (who do not fall into the previous groups) have problems buying housing.
-
Only 16.6% can afford everything they want. The remaining percentage had difficulty answering.
-
This means that 45.6% of gaming industry employees are working "paycheck to paycheck." They can afford food, clothing, and housing expenses, but purchasing anything more significant is challenging for them.
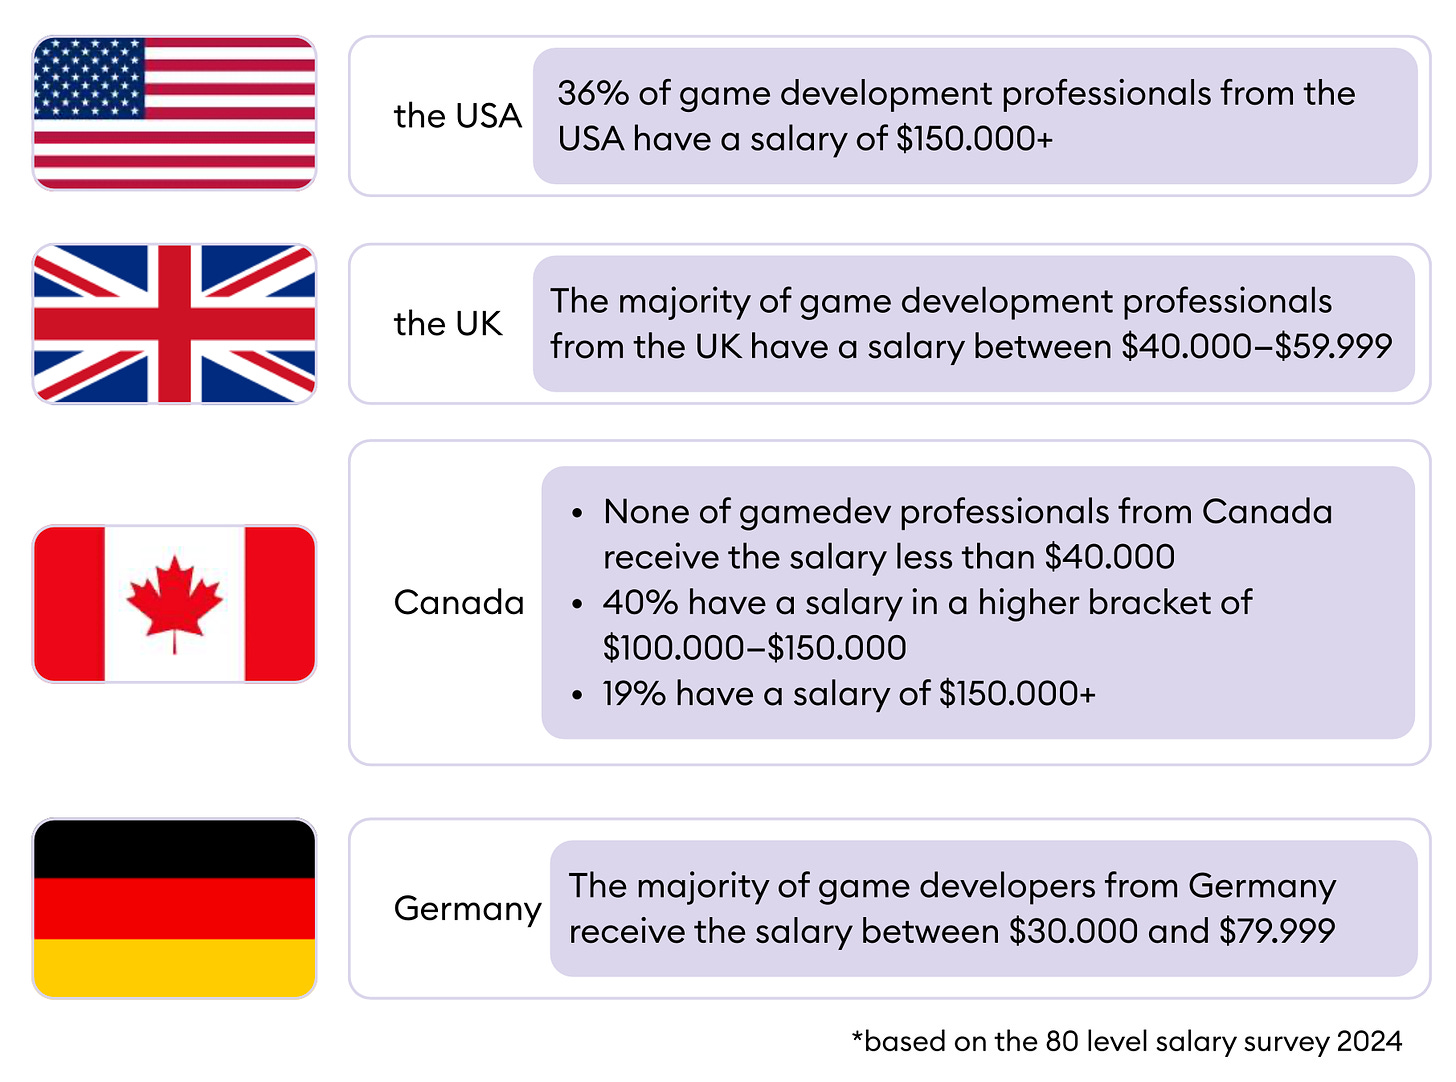
Regional Differences
-
A large number of respondents from North America (USA and Canada) earn salaries of $100,000 and above.
-
In Western Europe (including the UK), the salary range is between $30,000 and $80,000. In France, for example, most industry workers have annual salaries ranging from $20,000 to $49,000.
-
Salaries in Spain and Poland are lower than the European average.
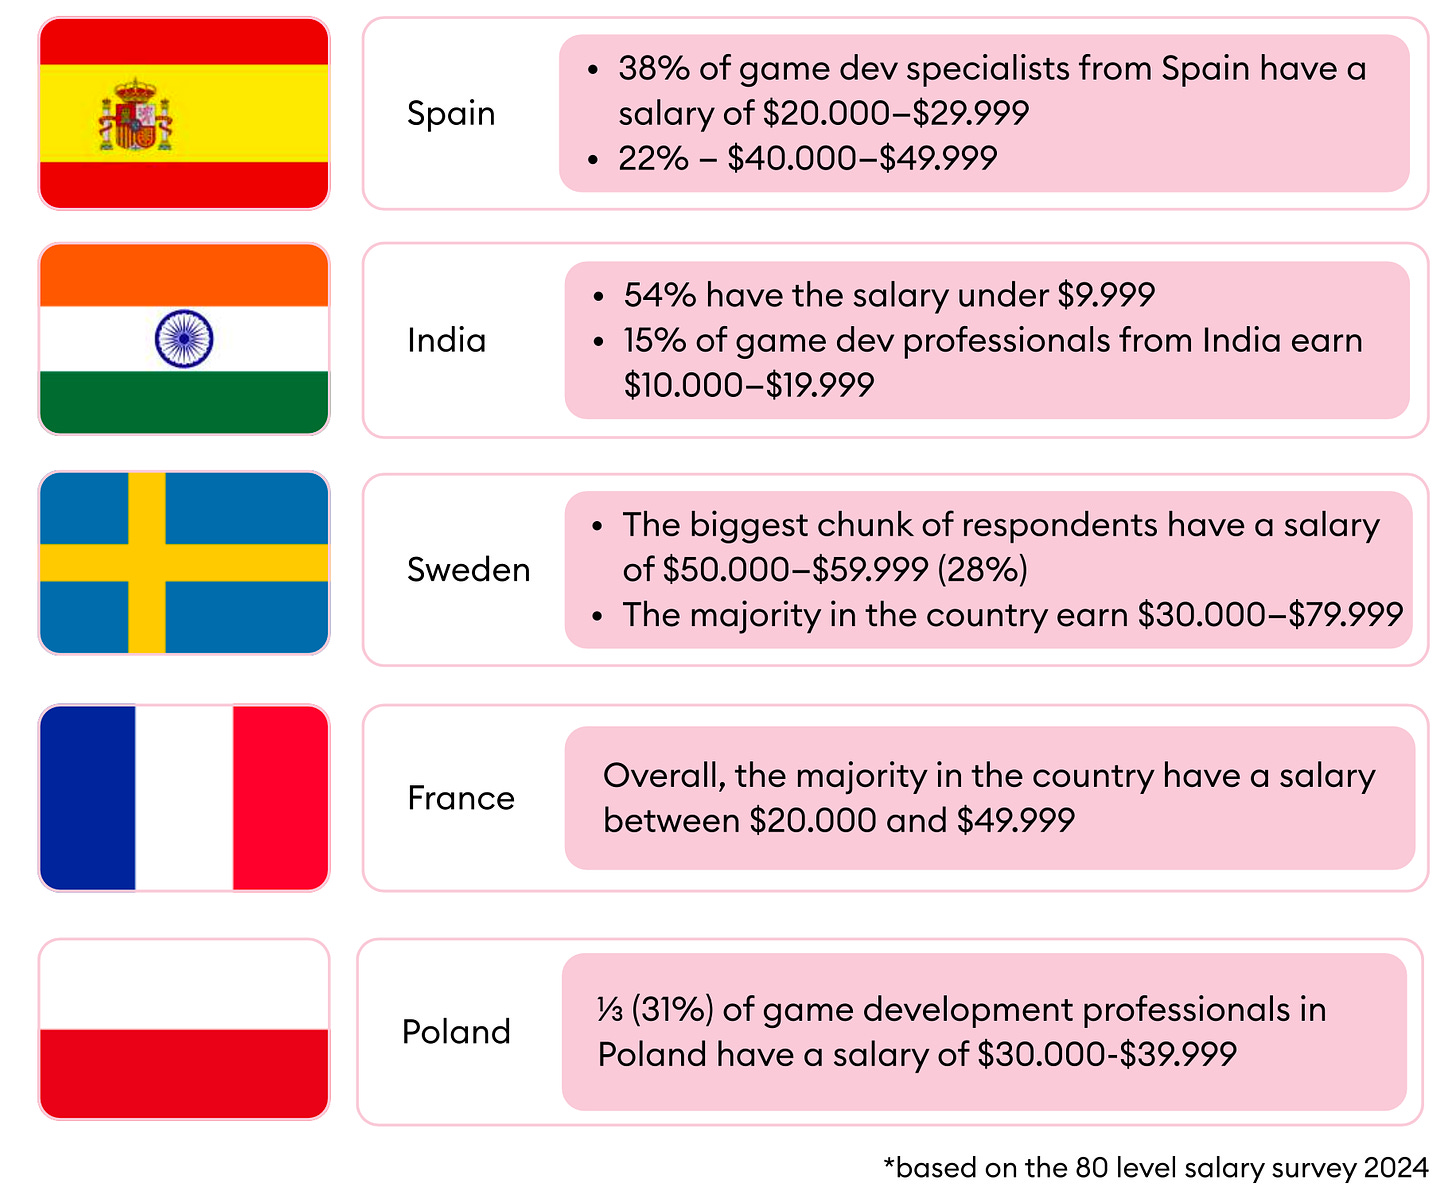
- 54% of game developers from India earn less than $10,000 per year.
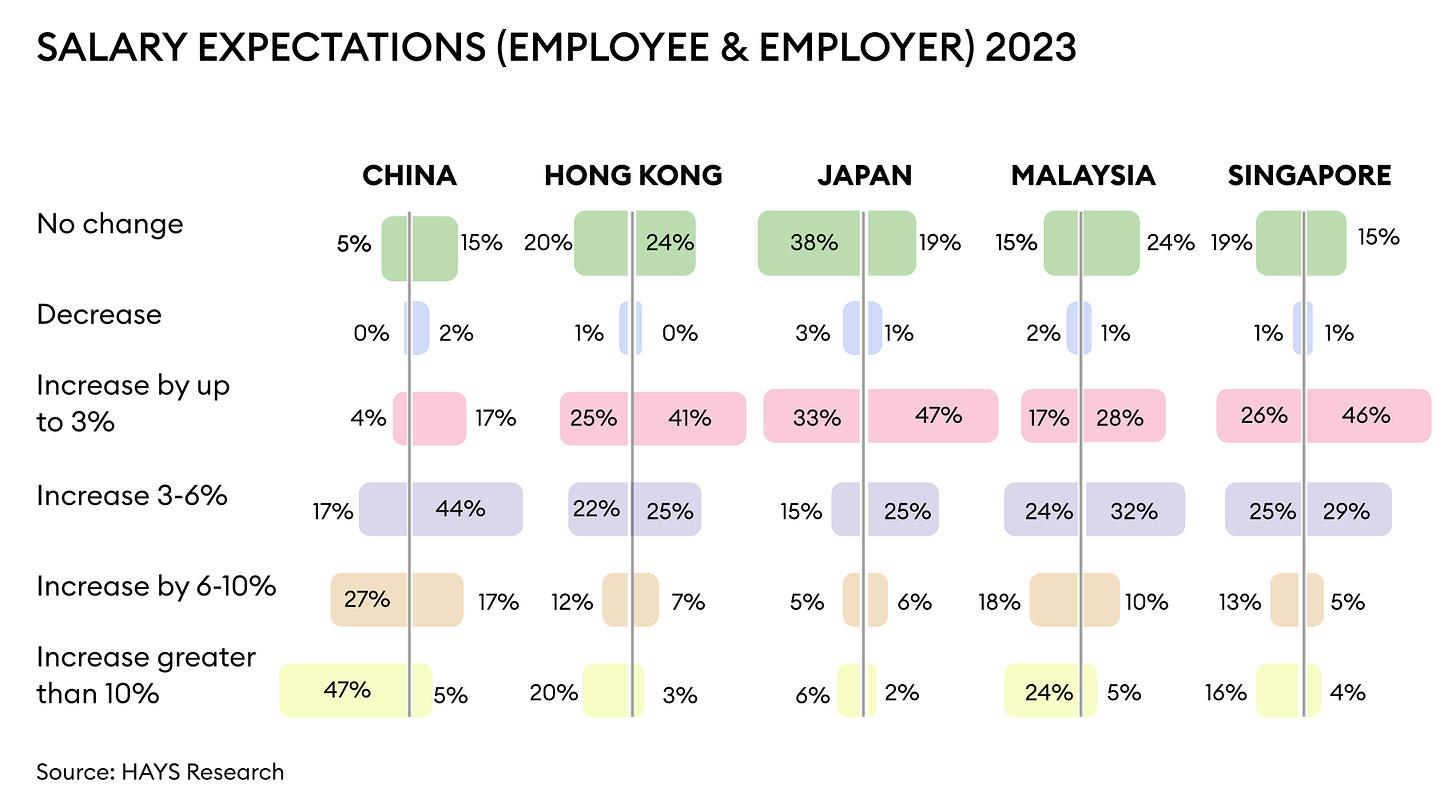
Salary Expectations in Asia
-
Quite a few workers and employers from Asia do not expect salary changes in 2024.
-
The majority of employers believe that salaries should be increased by up to 6% in 2024.
-
However, employees' expectations are somewhat higher - they would like to see a greater increase.
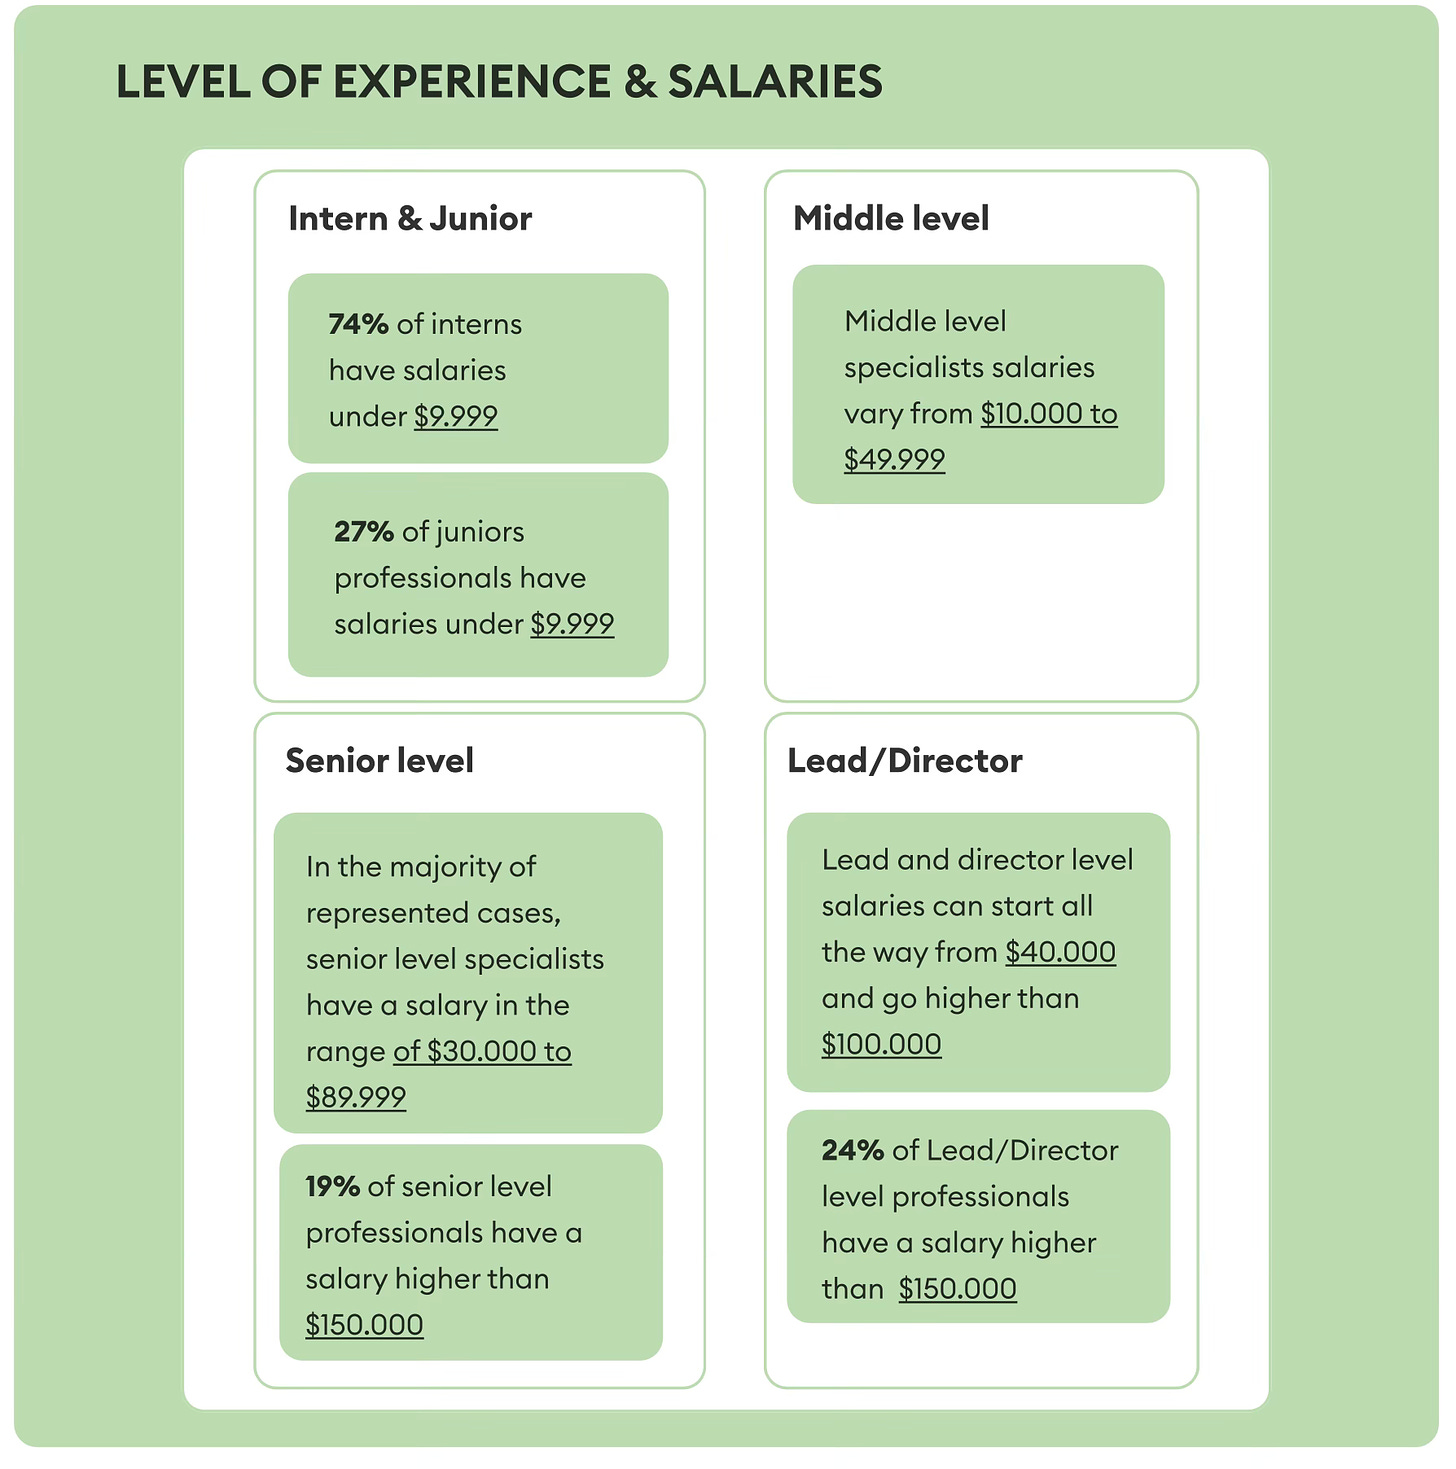
Salaries and Experience
-
74% of interns and 27% of young professionals earn less than $10,000 per year.
-
Mid-level specialists earn between $10,000 and $50,000 per year.
-
In most cases, Senior-level employees earn between $30,000 and $90,000 per year. 19% of such specialists earn salaries above $150,000.
-
Team leads and managers earn between $40,000 and $100,000. 24% of them earn above $150,000.

- 41% of C-level specialists earn more than $150,000 per year. Surprisingly, even among specialists of this level, 19% noted that they struggle to make ends meet. 22% cannot afford to buy a house or apartment.
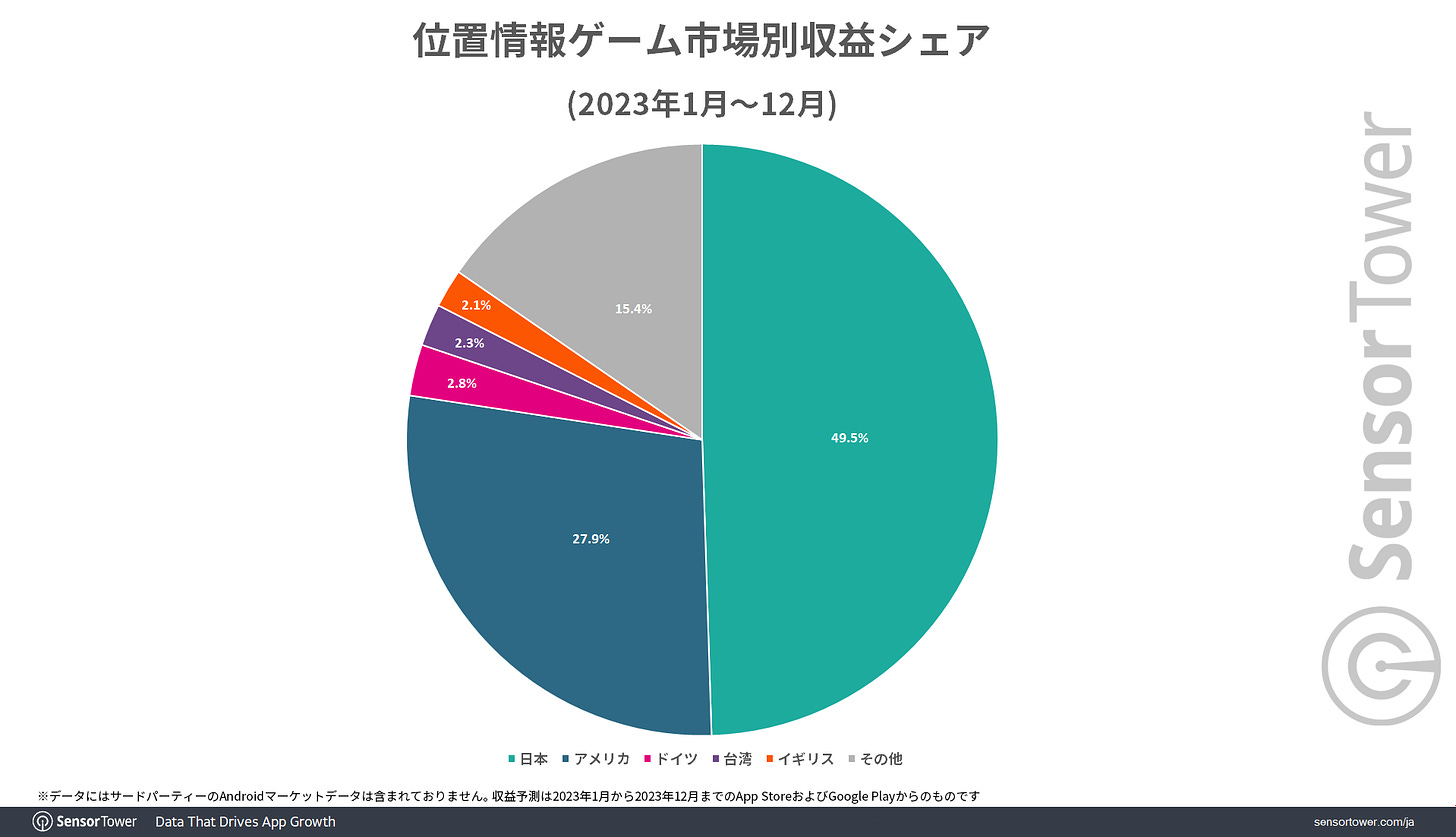
Sensor Tower: Japan accounted for nearly 50% of the revenue from geolocation Mobile games in 2023

-
Revenue from location-based games in Japan exceeded $620 million in 2023. This accounts for 49.5% of the global market. The second-place, with 27.9%, is the United States.
-
Dragon Quest Walk is the highest-earning location-based game in Japan; users spent over $300 million on it in 2023. In second place is Pokemon GO (about $220 million).
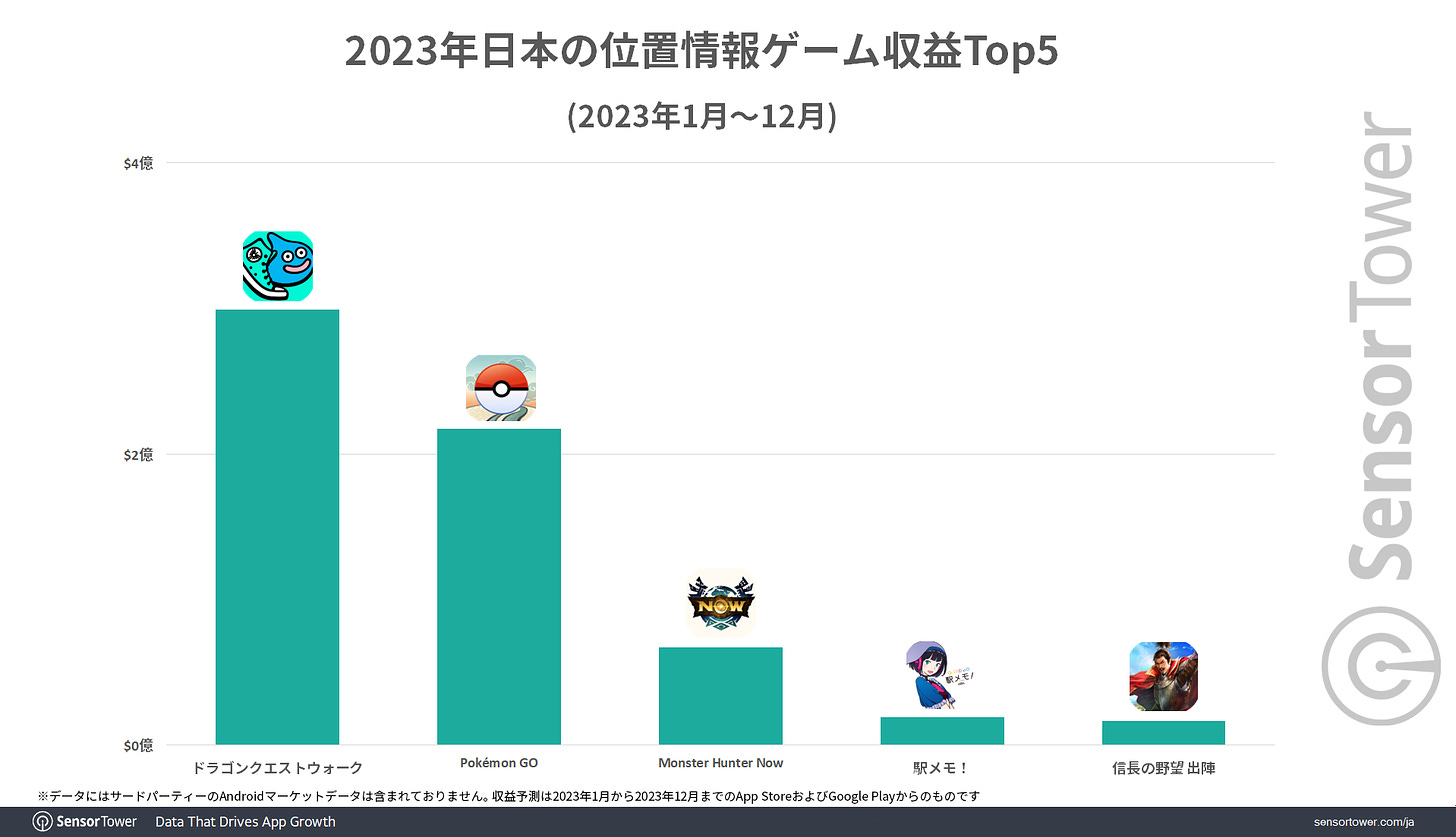
- In the United States, Pokemon GO performs significantly better. The game earned $300 million in the American market in 2023. An additional $14 million came from South Korea.
-
Location-based games account for 5% of all mobile game revenue in Japan.
-
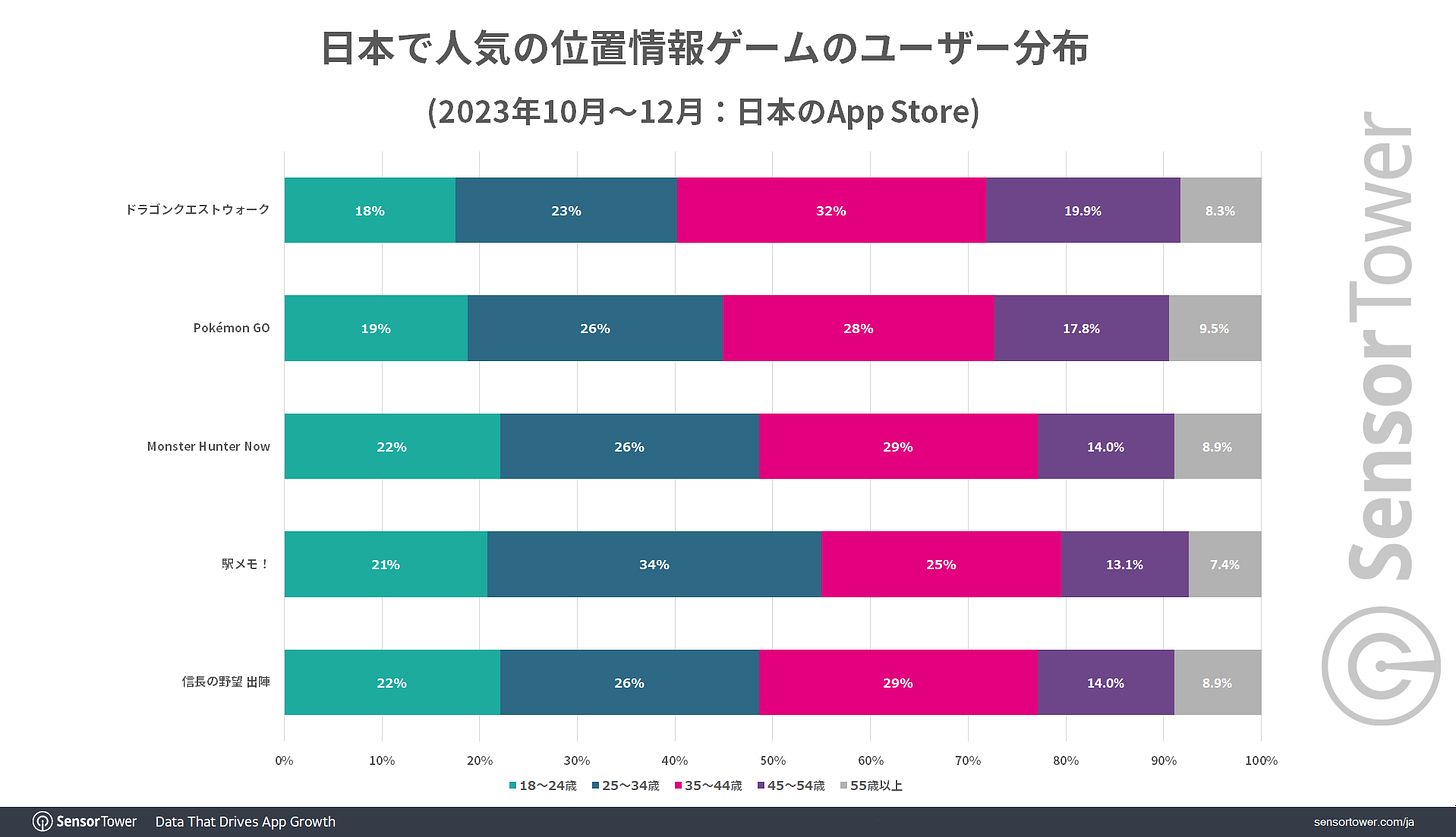
The genre in Japan has about 40% female audience. The average age is 35 years.
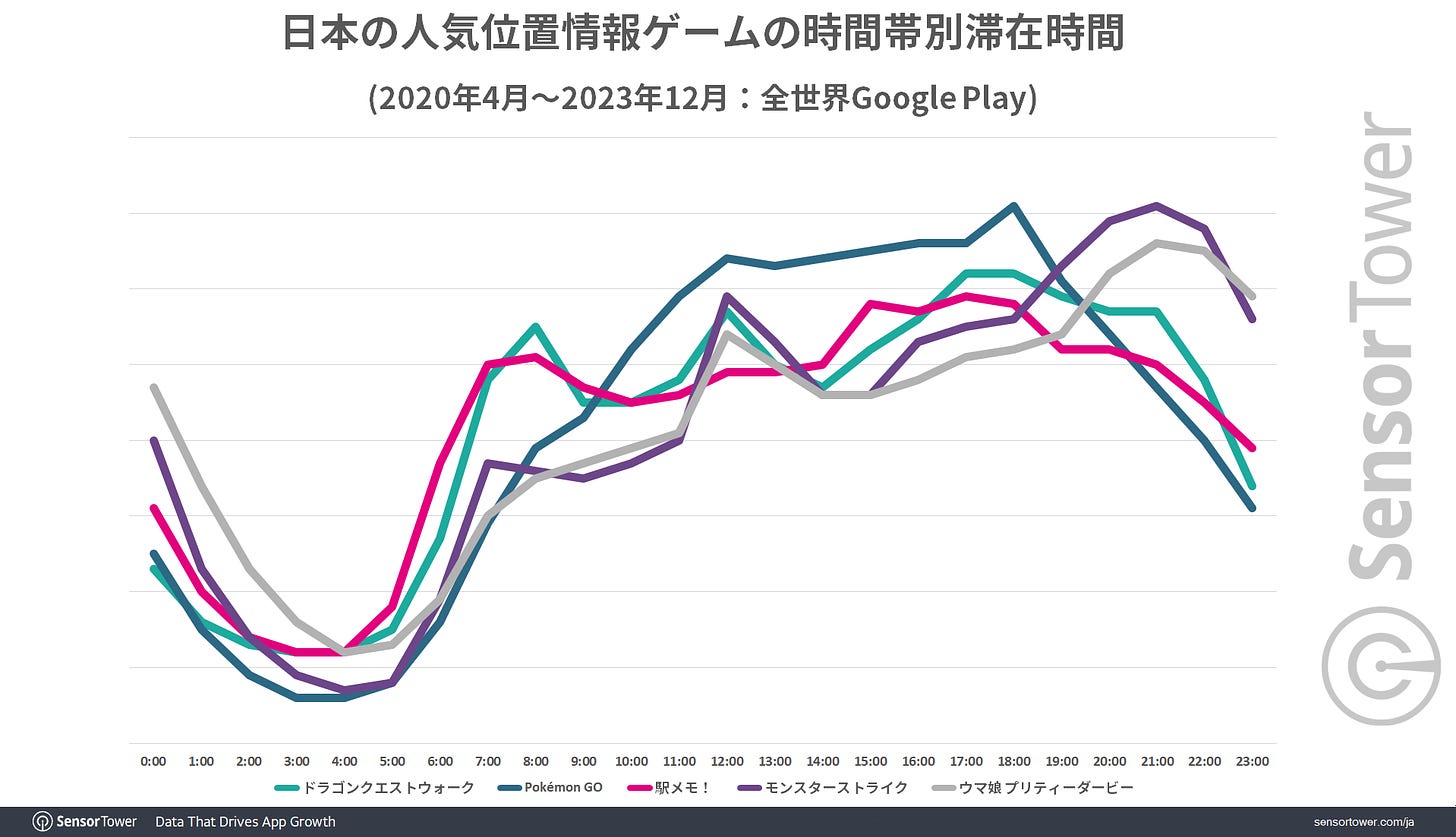
- Sensor Tower believes that location-based games fit well into the lifestyle of the Japanese, who actively use public transportation. This is indirectly confirmed by the peaks of activity in location-based games - in the morning and evening when people return from work. In contrast, the peak for "traditional" games is at 9 p.m.
Game sales Round-up (06.03.2024 - 19.03.2024)
-
Total sales of the Persona series have reached 22.6 million copies. Of this number, more than 10 million belong to Persona 5 and its spin-offs. The first part of the series was released in 1996.
-
Balatro, released on February 20th of this year, has already sold over a million copies. It took 10 days to reach the first half-million. Currently, the developers are working on a mobile version of the project.
-
Supersonic Studios' games have been downloaded over 5 billion times. Over four years, the studio has released more than 100 projects. The most popular among them is Bridge Race.
-
The CEO of Moon Studios, the developer of the Ori duology, reported on the cumulative sales of the series. The projects have over 10 million sales across all platforms.
-
Capcom reported 25 million copies sold of Monster Hunter World. This figure includes sales of the Iceborne expansion (about 4.5 million copies sold by the end of December). In total, the series has nearly 100 million sales.
-
The number of players in Sea of Stars has exceeded 5 million. These are not sales, as the game was distributed for free on PlayStation Plus. In celebration of this milestone, the developers announced a cooperative mode.
-
It took just over a year for Wo Long: Fallen Dynasty to reach 5 million players. The game was on Xbox Game Pass, so the figure doesn't equate to sales.
-
Deep Rock Galactic: Survivor surpassed 1 million copies sold in a month. The original Deep Rock Galactic took 3 years to sell 2 million copies.
-
Analyst Doug Creutz believes that sales of Helldivers II have exceeded 8 million copies. He stated this in an interview with Bloomberg.
Adjust & AppLovin: Mobile Game Market Trends in 2024

Adjust and AppLovin analyzed over 5,000 applications from January 2022 to January 2024 from various countries.
The report examines apps in general. I will focus on the gaming aspect.
-
Mobile advertising spending in 2023 increased by 8% to $362 billion.
Mobile Games Results in 2023
-
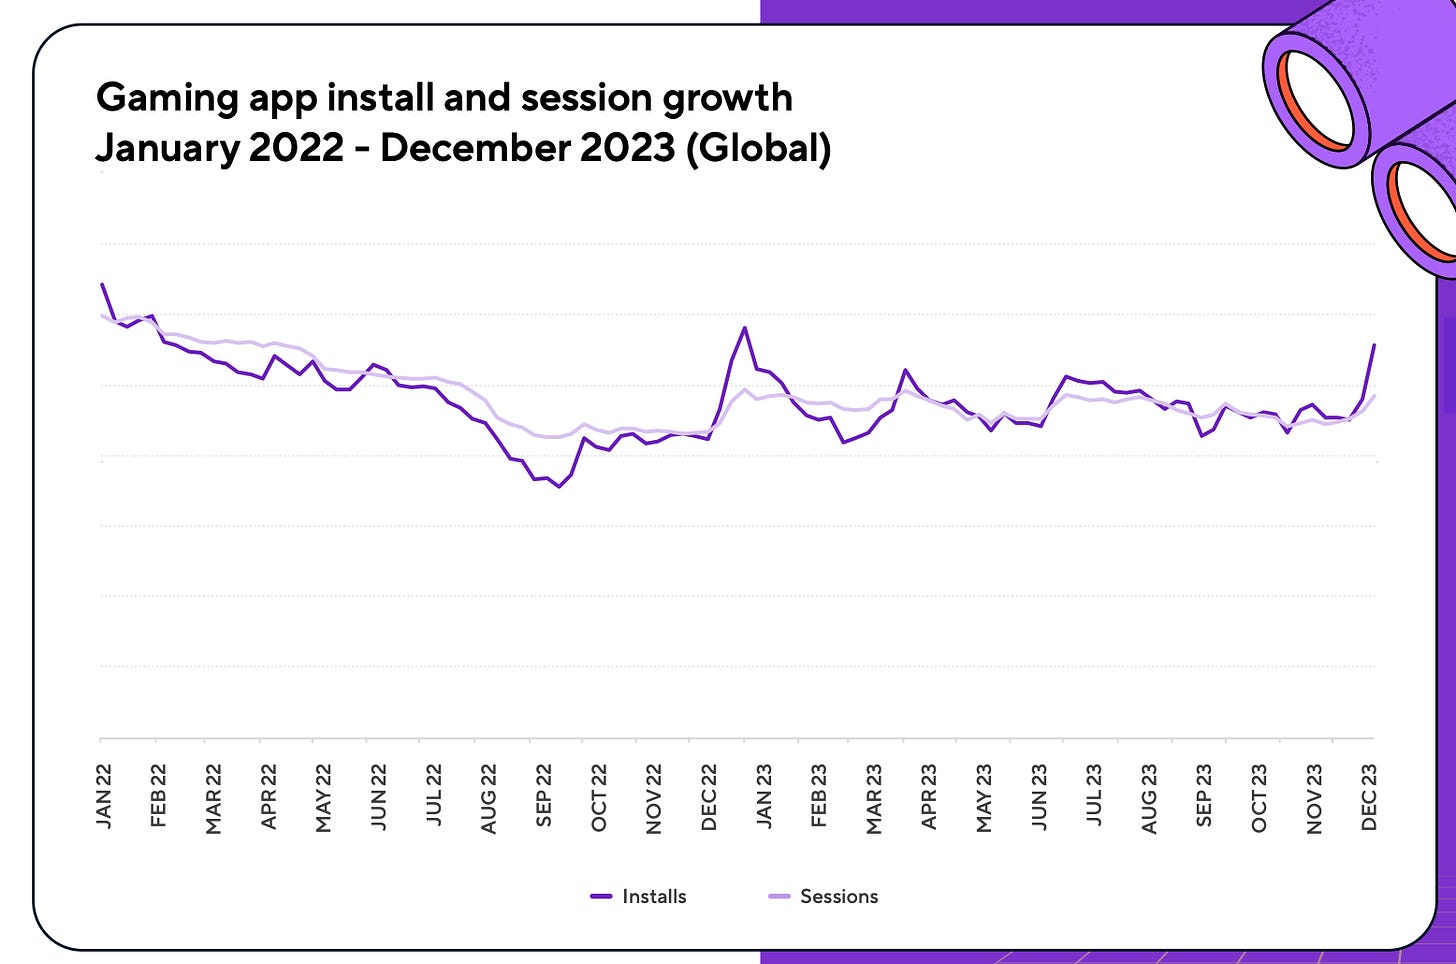
Overall, downloads decreased by 2% throughout the year; the number of sessions decreased by 7%.
-
However, in the fourth quarter of 2023, there was a 7% increase in downloads YoY. Adjust and AppLovin believe this signals a return to market growth.
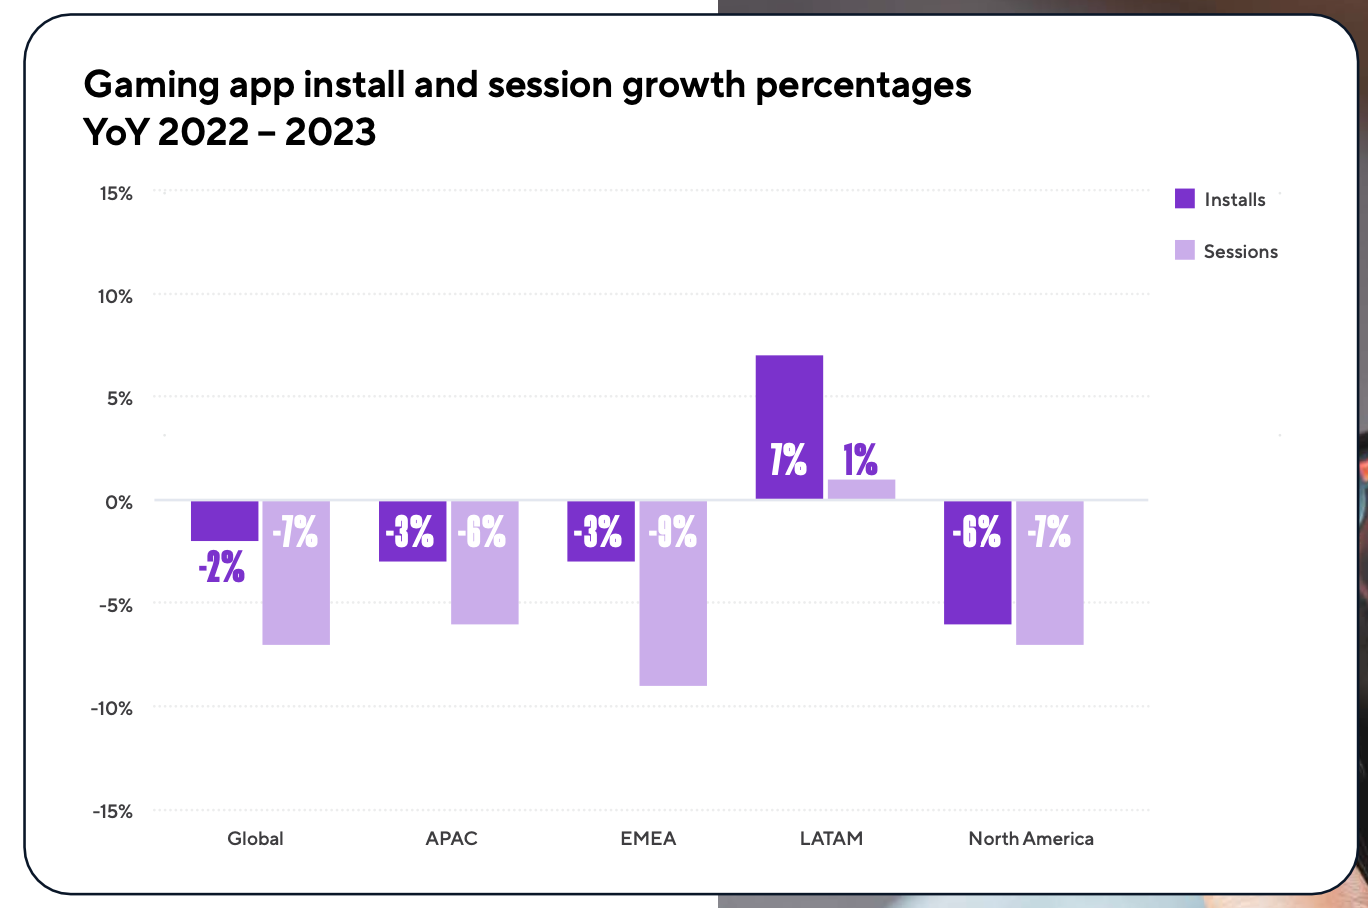
- The only market that grew in 2023 in terms of both downloads (+7%) and the number of sessions (+1%) is LATAM.
-
Other markets are in negative territory. The North American region saw the sharpest decline in downloads (-6%); EMEA saw a decrease of 9% in the number of sessions.
Most popular genres by Downloads and Sessions
-
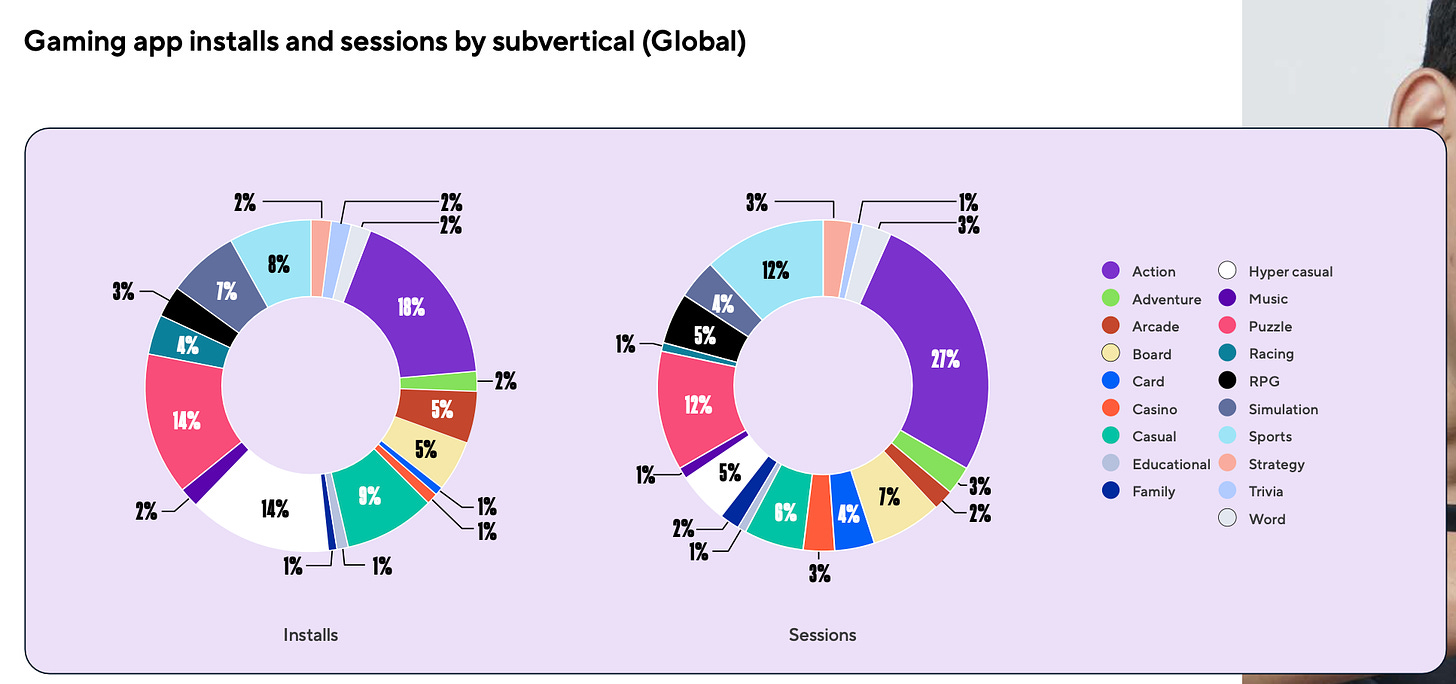
Action games account for the highest number of downloads (18%). Hyper-casual projects (14%) and puzzles (14%) follow.
-
In terms of sessions, action games also lead (27%). Puzzles (12%) and sports projects (12%) have a significant percentage as well.
Growing genres
-
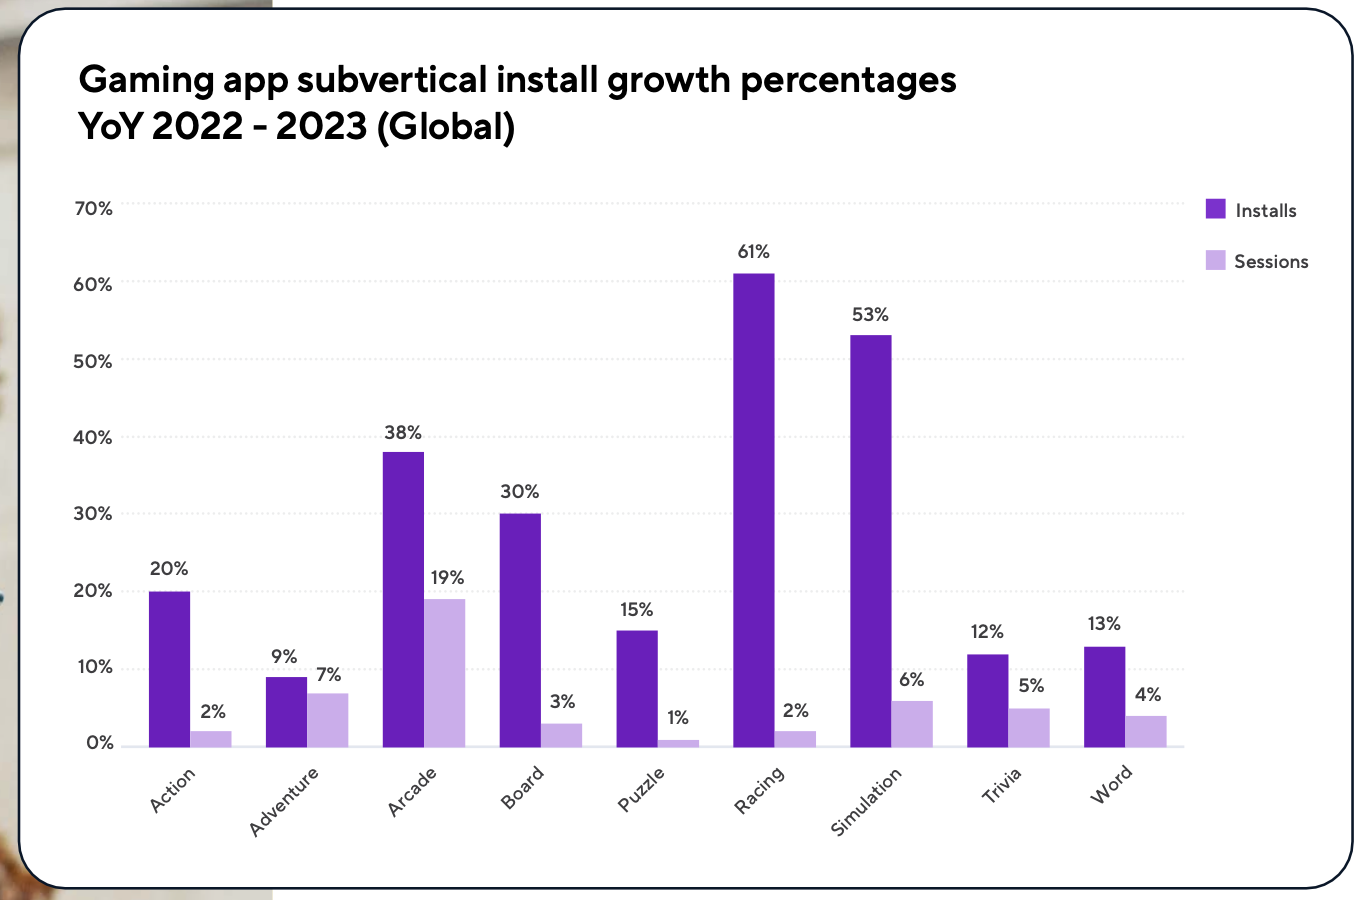
In 2023, racing games (+61%), Simulation genre (+53%), and arcades (+38%) showed the most significant growth in downloads.
-
The biggest increase in sessions was seen in arcade games (+19%), adventure games (+7%), and the Simulation genre (+6%).
Sessions in Mobile Games
-
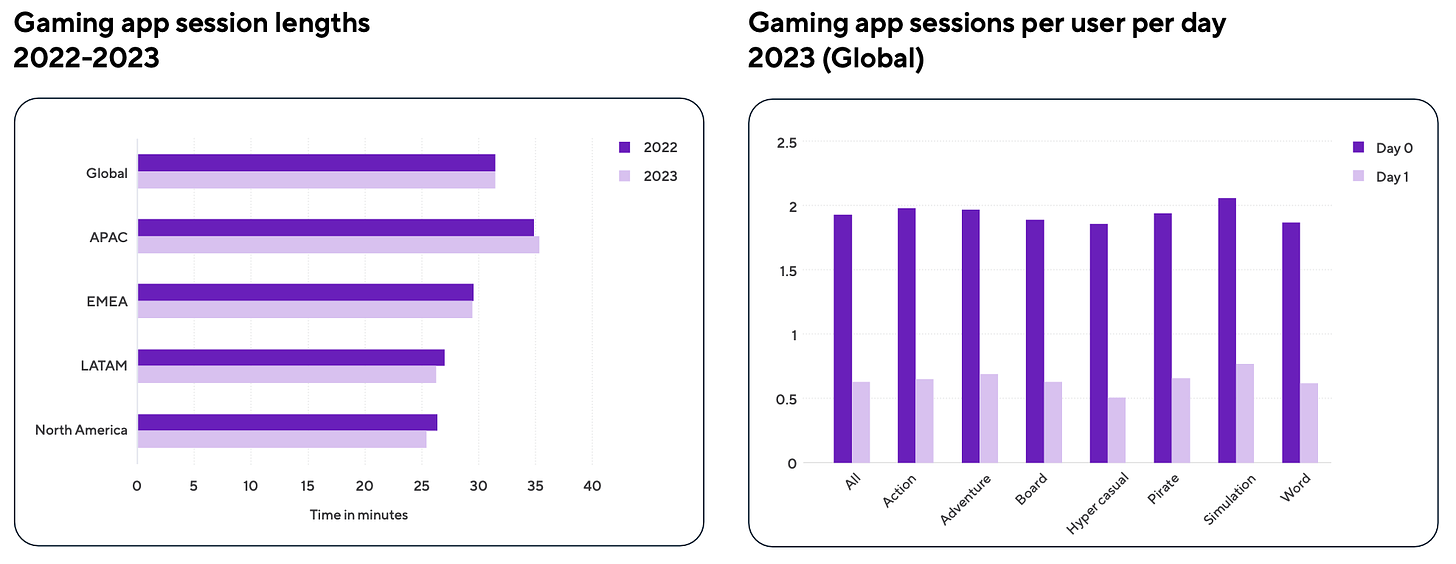
Globally, the average session length in 2023 remained unchanged. However, looking at regions, it increased in the APAC region (from 35 to 36 minutes), while in other regions (EMEA, LATAM, North America), it slightly decreased.
-
In 2023, user engagement after installation declined. On the first day, the average number of sessions was 1.93; on the second day, it dropped to 0.63. Hyper-casual projects saw the most significant declines, while Simulation games retained their audience the best.
Retention benchmarks
-
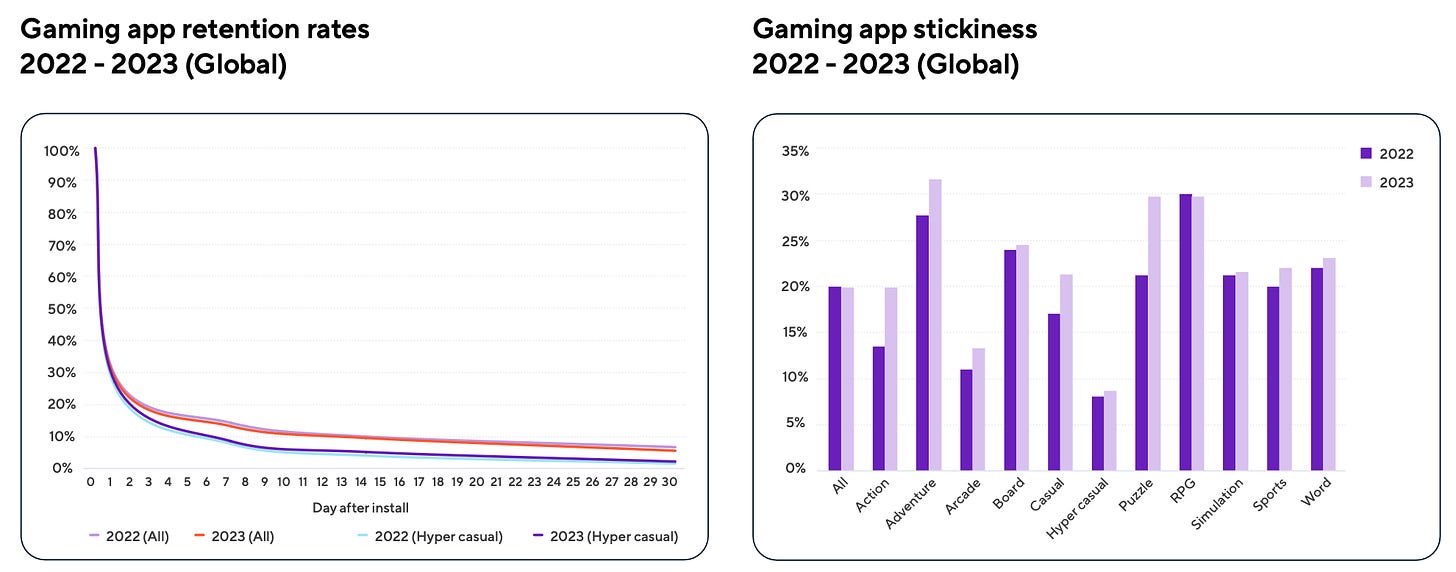
Overall, Retention decreased slightly compared to 2022 figures.
-
D1 Retention dropped from 29% in 2022 to 28.3% in 2023. Average D7 Retention decreased from 14% (2022) to 13% (2023); D14 Retention - from 9.7% (2022) to 9.3% (2023); D30 Retention - from 6.4% (2022) to 5.3% (2023).
-
However, hyper-casual projects saw an opposite trend. Retention in them increased. D1 Retention rose from 26% (2022) to 27% (2023); D7 Retention - from 8% (2022) to 8.4% (2023); D14 Retention - from 4.3% (2022) to 5% (2023); D30 Retention - from 1.8% (2022) to 2% (2023). Perhaps the complication of meta-mechanics played a role.
-
Retention in many genres increased in 2023. The highest figures are seen in adventure games, RPGs, board, and word games.
eCPI and LTV Trends
-
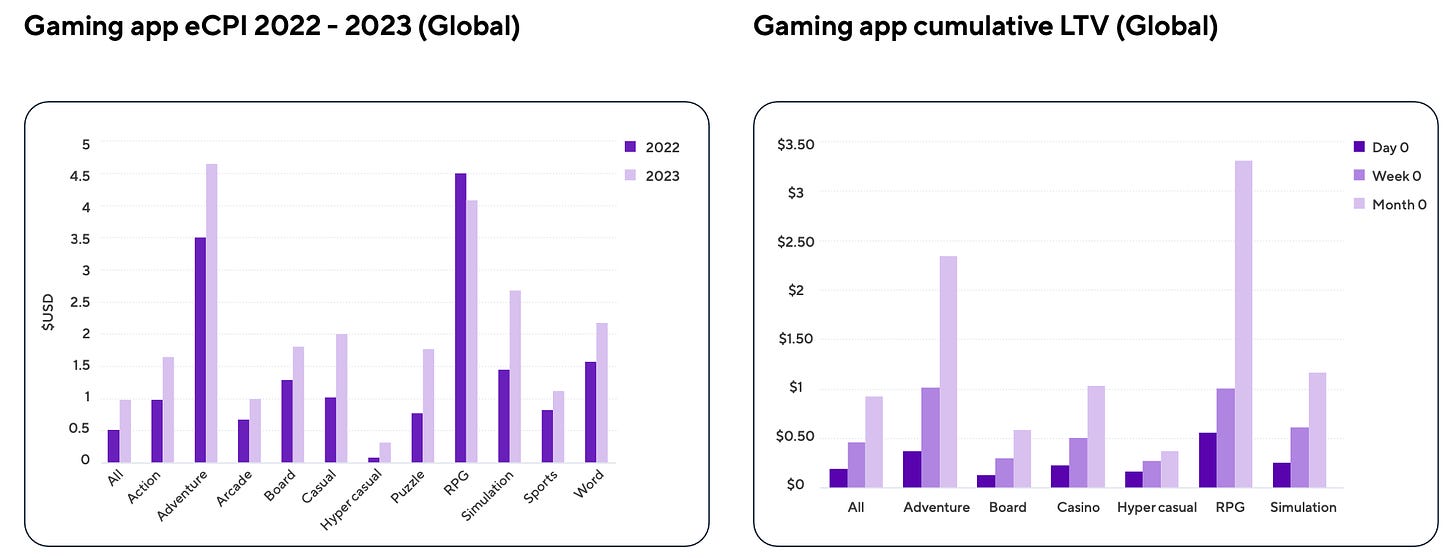
In almost all genres in 2023, eCPI increased. It only decreased among RPG projects (-$0.42). The highest growth was observed in the Simulation genre (+$1.23).
-
The highest average LTV is in RPGs ($3.31 after the first month); adventure games come second ($2.35). No genre breaks even in the first month when comparing eCPI and LTV.
Organic and Paid Traffic
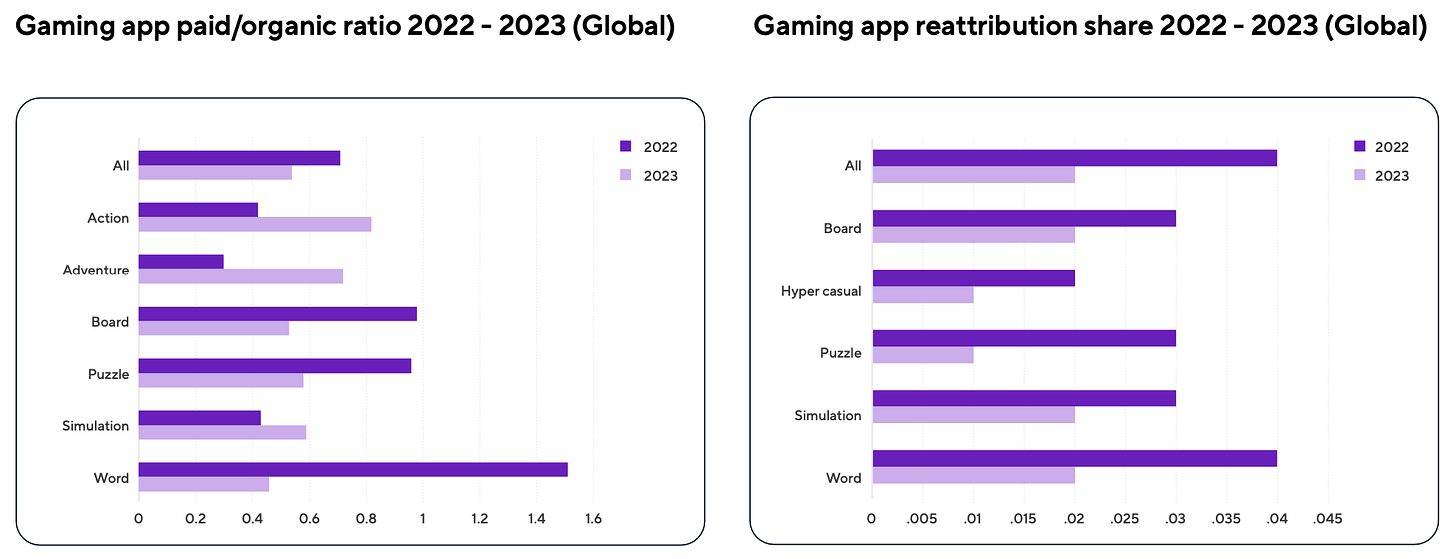
-
The overall ratio of organic traffic to paid traffic in 2023 significantly decreased - from 0.71 in 2022 to 0.54. This is especially noticeable in the Word genre, puzzles, and board games.
-
However, there are genres where organic traffic increased. These include action games (from 0.42 in 2022 to 0.82 in 2023) and adventure games (from 0.3 to 0.72).
-
Re-attribution in 2023 dropped from 0.04 (2022) to 0.02.
IAP Revenue in Mobile Games

-
According to Adjust and AppLovin data, by the end of 2023, mobile revenue from IAPs increased by 6% compared to 2022.
-
In December 2023, IAP revenue was 17% higher than the previous year.
ATT opt-in Rates
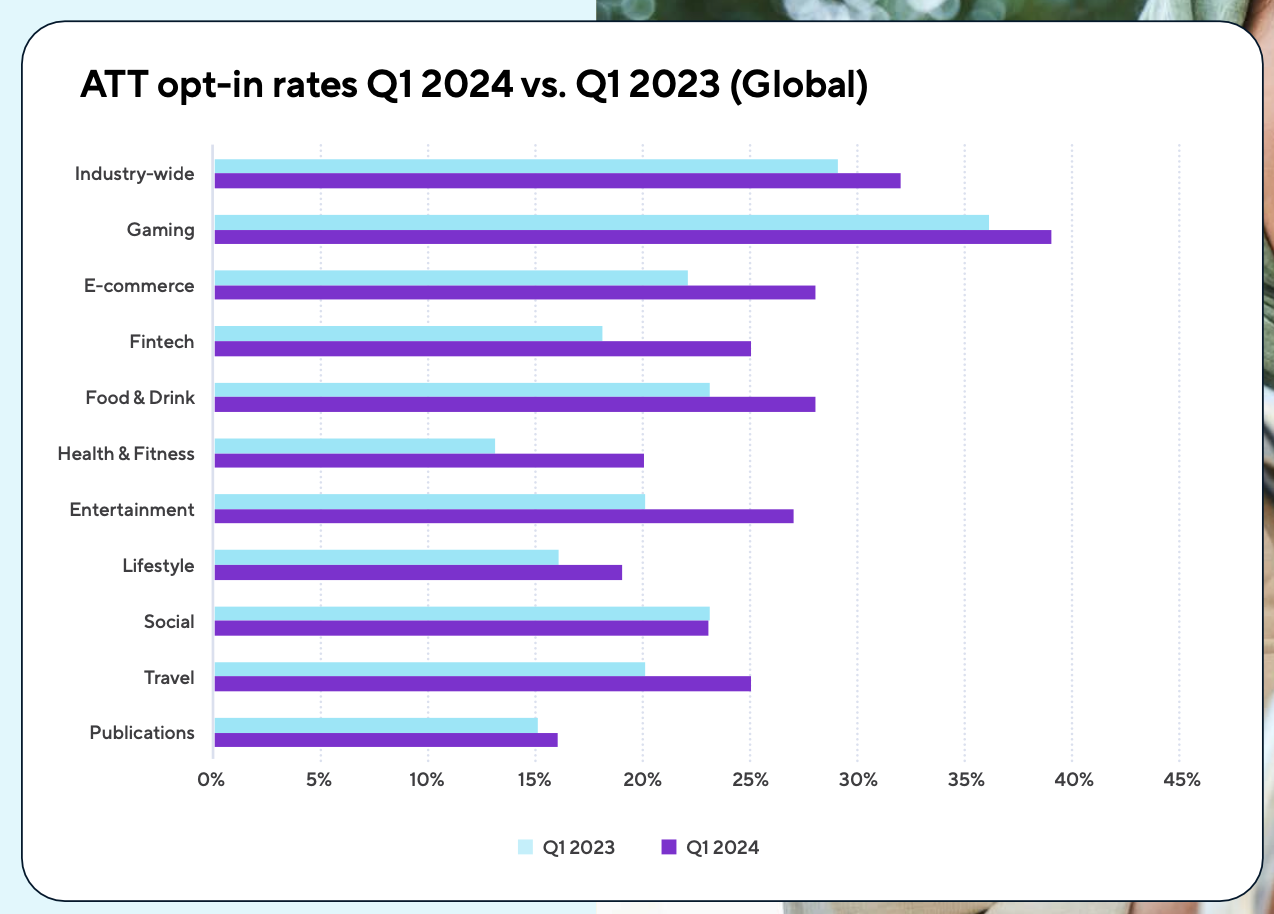
-
The ATT Opt-in rate in games rose to 39% in the first quarter of 2024. A year earlier, this figure was 36%.
-
This is the highest level among all applications. The market's average level is 32%.
DDM: Gaming Investments in Q4 2023; 2023 Results and 2024 Forecasts
Results for 2023 and Future Forecast
-
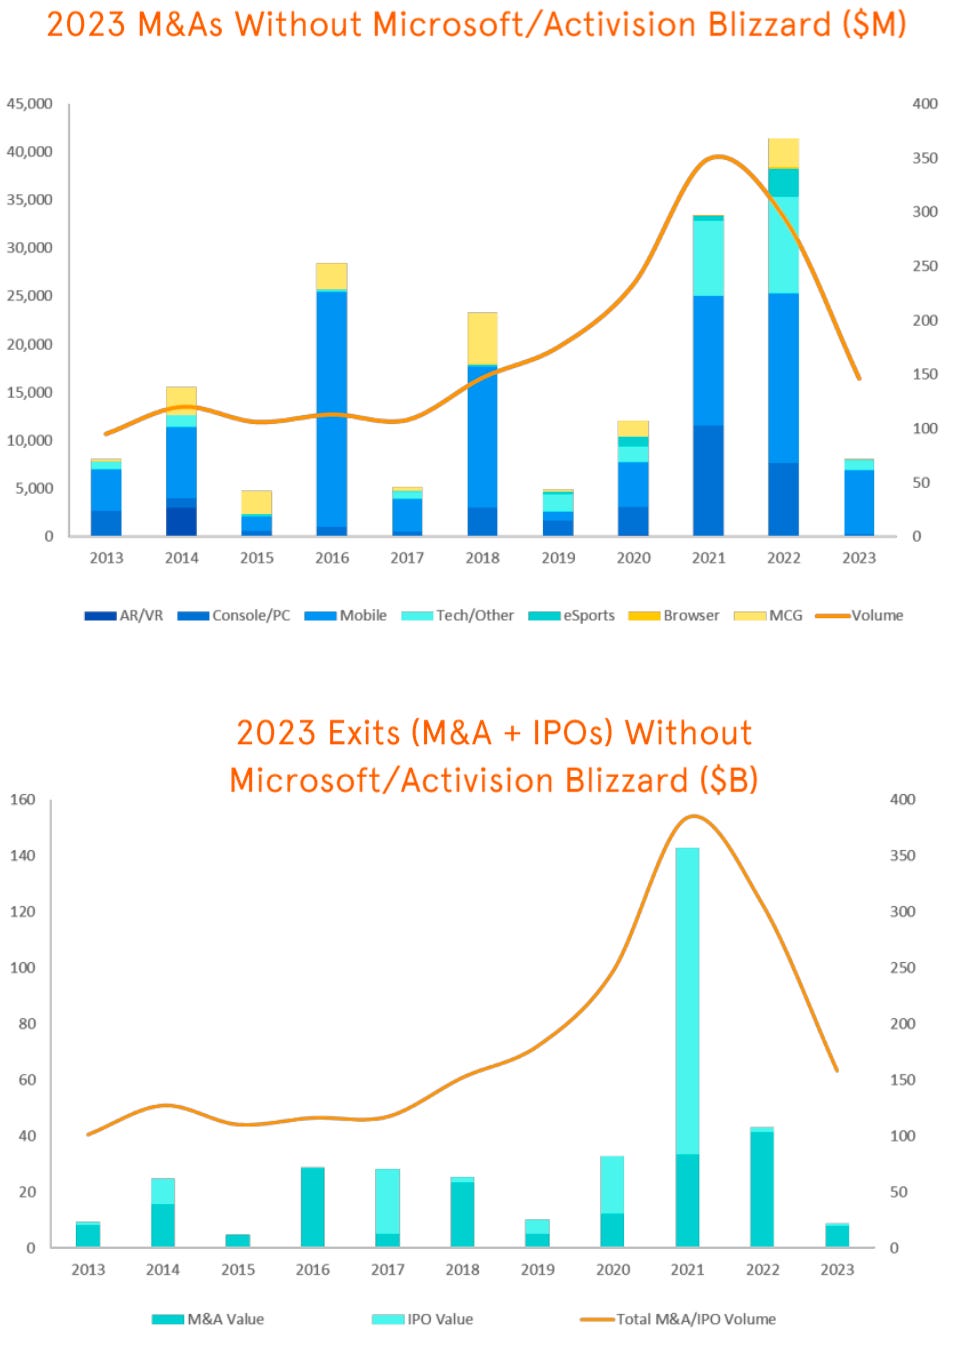
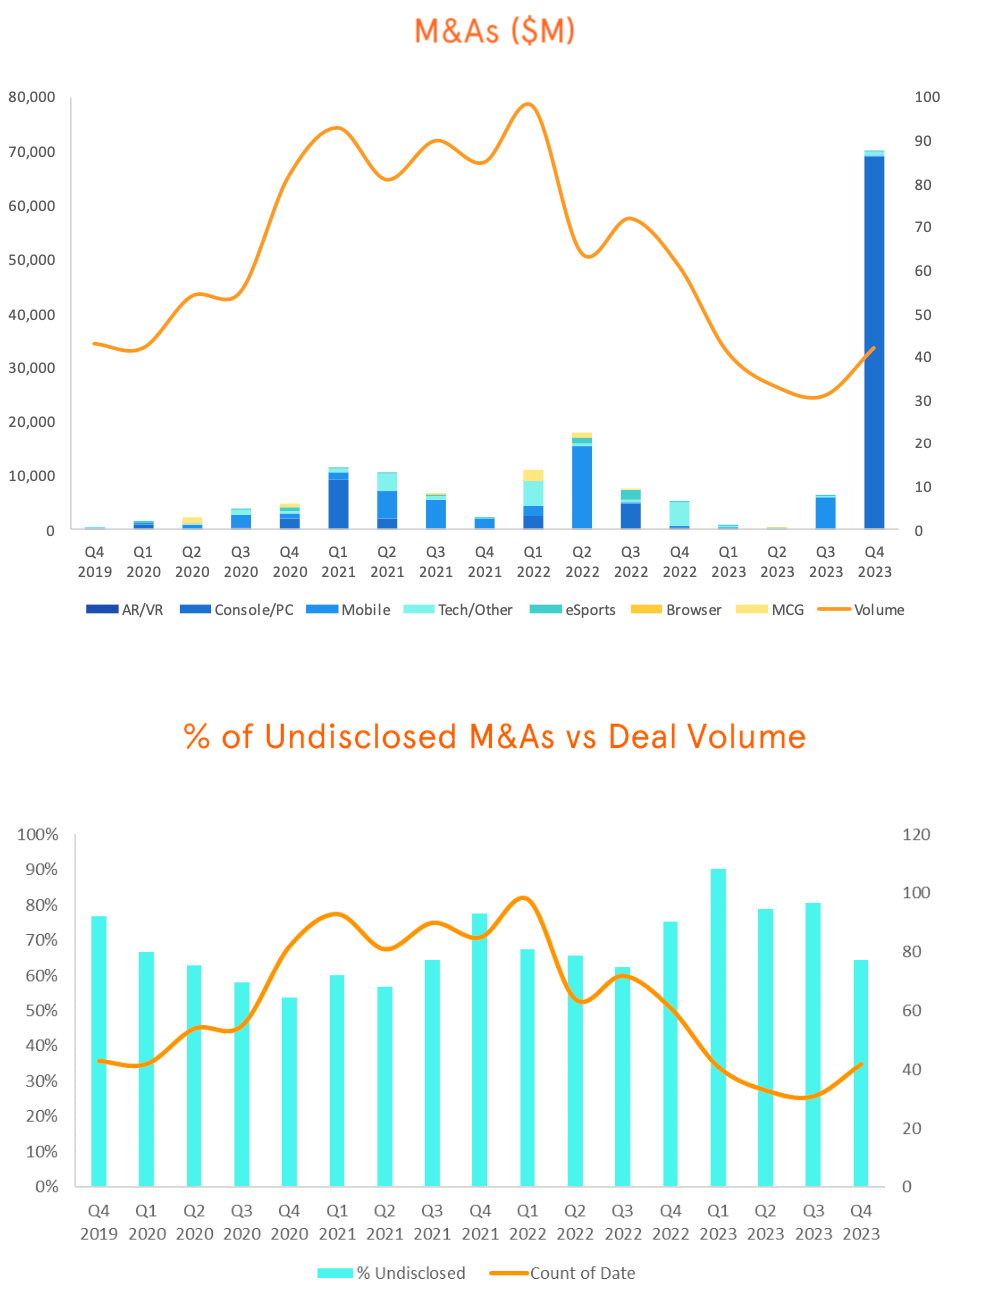
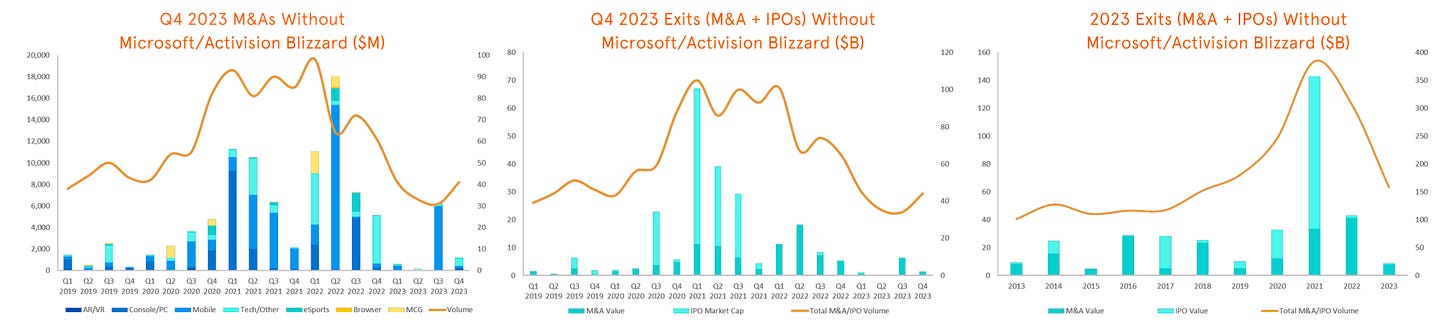
There are no companies too big for M&A deals. Activision Blizzard and Microsoft took 633 days from announcement to prove this. The deal amount - $68.7 billion.
-
Saudi Arabia's influence will continue to grow. Acquiring Scopely ($4.9 billion) and investing in VSPO ($265 million) is just the beginning.
-
Embracer Group has grown to a scale it couldn't sustain.
-
DDM expects the Chinese market to stagnate amid regulatory rhetoric from authorities.
-
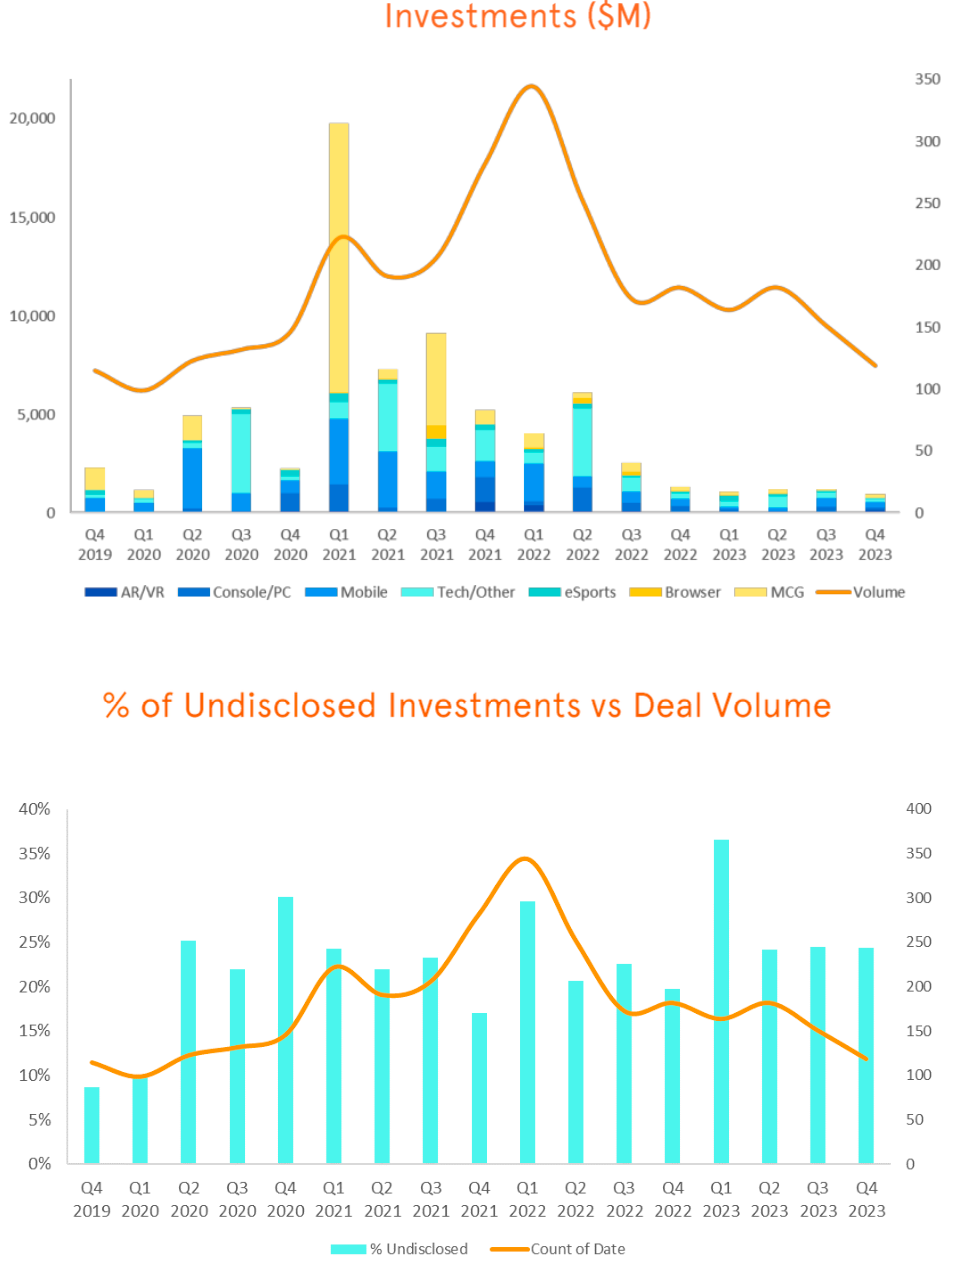
In 2023, there were the highest number of undisclosed M&A (78%) and investment (28%) deals in history.
-
eSports is experiencing a crisis. The best demonstration is the purchase of FaZe Clan for $17 million. This is a company that went public through SPAC in July 2022 with a valuation of $725 million.
-
In 2023, there were 214 investment deals (-57% YoY) totaling $1.4 billion (-72% YoY) in blockchain projects. This is 35% of all gaming investments (-34% compared to 2022). FOMO among investors has ended.
-
AI is one of the few bright spots of 2023. There were 61 deals totaling $319 million (including a $54 million Series A round for Futureverse). DDM expects sustained interest in AI startups, albeit less explosive than in Web 3 projects.
-
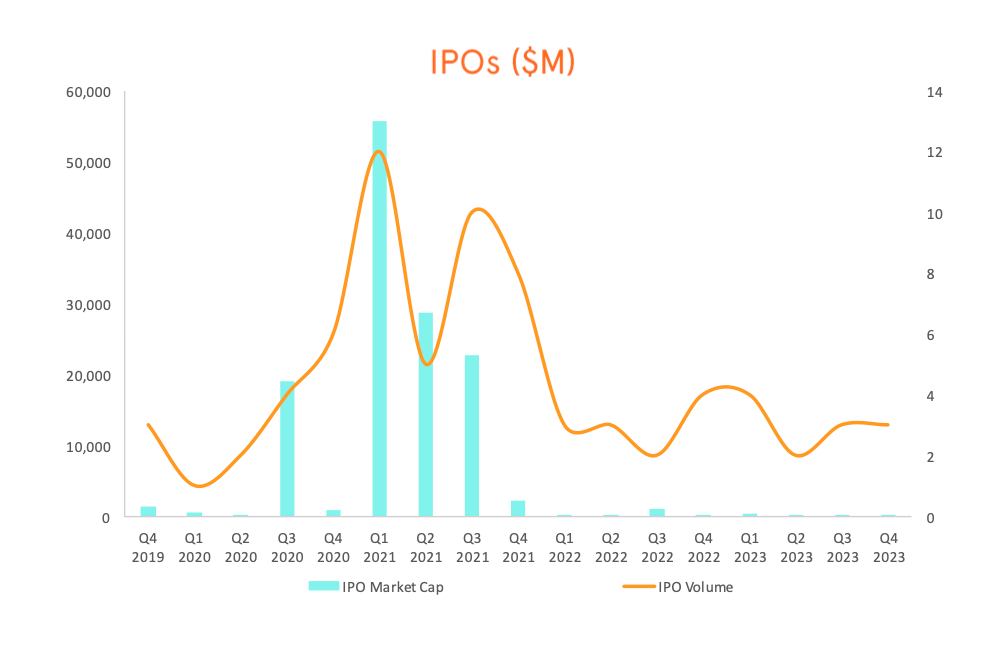
Since 2020, Poland has had 34 gaming IPOs - three times more than in the US. In 2023, there was only one IPO through SPAC - MultiMetaVerse merged with Model Performance Acquisition Corp.
-
Accelerators are playing a more significant role in the gaming ecosystem. For example, Speedrun from Andreessen Horowitz invested $500,000 checks in 32 companies.
-
Companies are becoming interested in Africa, as evidenced by deals with 24 Bit Games and eSports provider Galactech.
-
Australia wants to compete globally. In 2023, there was a 217% increase in investments in local companies. The government awarded 35 grants to local studios.
-
Fortnite, Minecraft, Roblox, and UGC continue to grow and attract investor interest. The most notable transactions are Gamefam ($16.5 million); Pahdo Labs ($15 million) and Melon ($3.3 million).
-
Rockstar Games acquired RP server developer FiveM and RedM - Cfx.re company. Everyone expects Grand Theft Auto VI to feature an RP mode in multiplayer.
2023 Results in Numbers
Overall Results
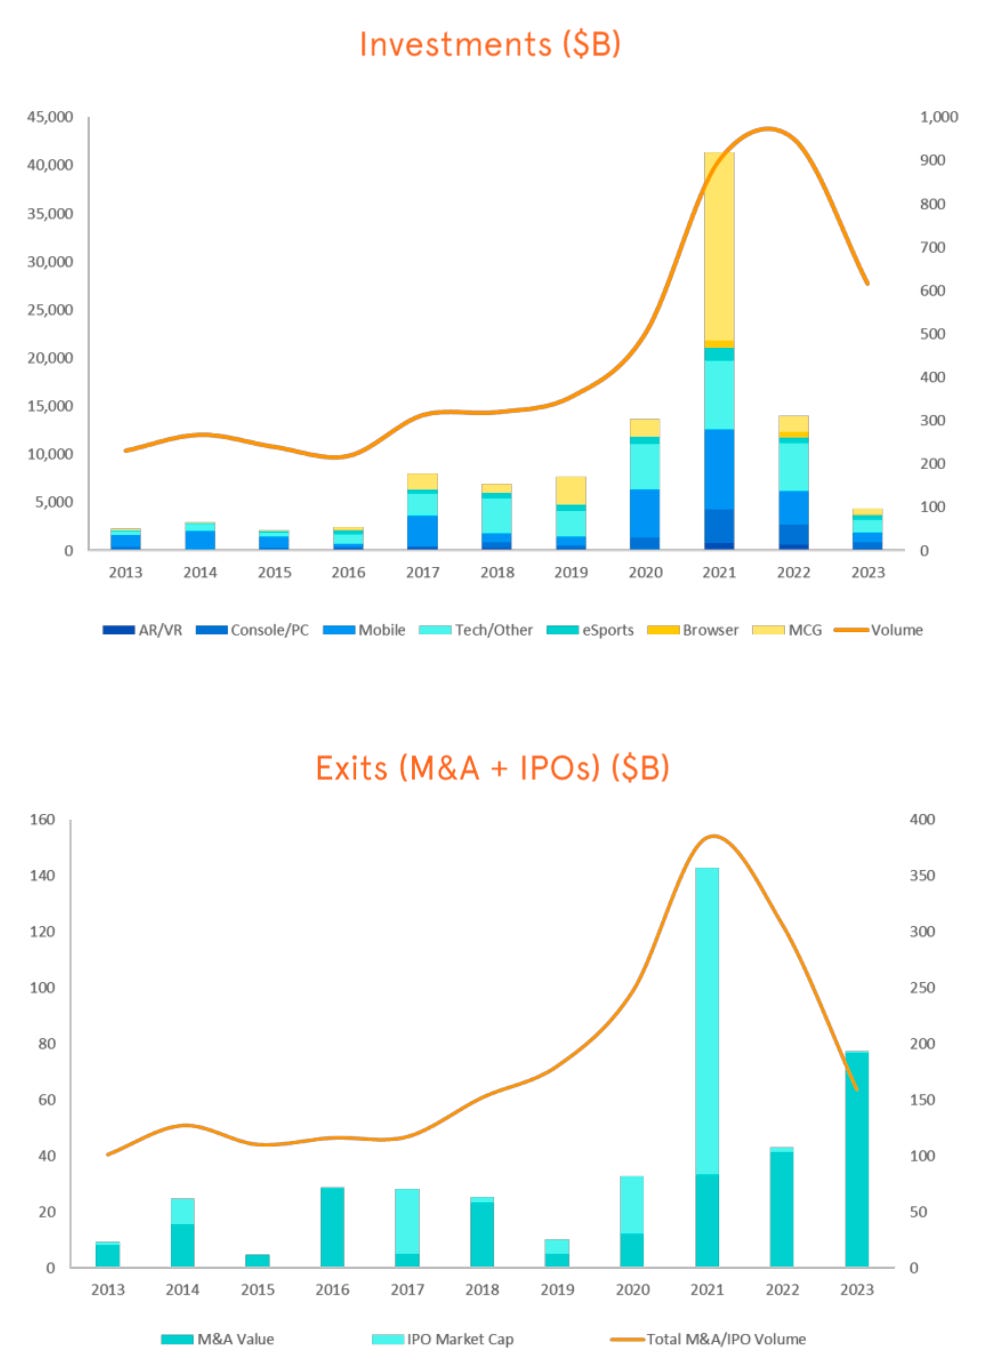
-
In 2023, there were 787 deals totaling $81.1 billion. The deal between Microsoft and Activision Blizzard accounts for 85% of the total volume in 2023.
-
Private investment totaled $4.4 billion in 2023 (-69% YoY) through 616 transactions (-35% YoY). However, in terms of the number of deals, the result was better than pandemic-ridden 2020.
-
Excluding the Microsoft-Activision Blizzard deal, the volume of M&A transactions in 2023 was $8 billion. There were a total of 146 transactions. This is the lowest figure since 2019.
-
12 companies went public in 2023, with a total valuation of $619.3 million (-60% YoY). This is the lowest figure since 2016.
-
In 2023, there were 415 deals with game developers (-57% YoY) totaling $2.2 billion (-72% YoY). This is excluding M&A and IPOs. Despite the decline, the share of deals with developer studios in 2023 increased to 67% of the total private investment volume. The previous record was in 2013 (63.5%).
-
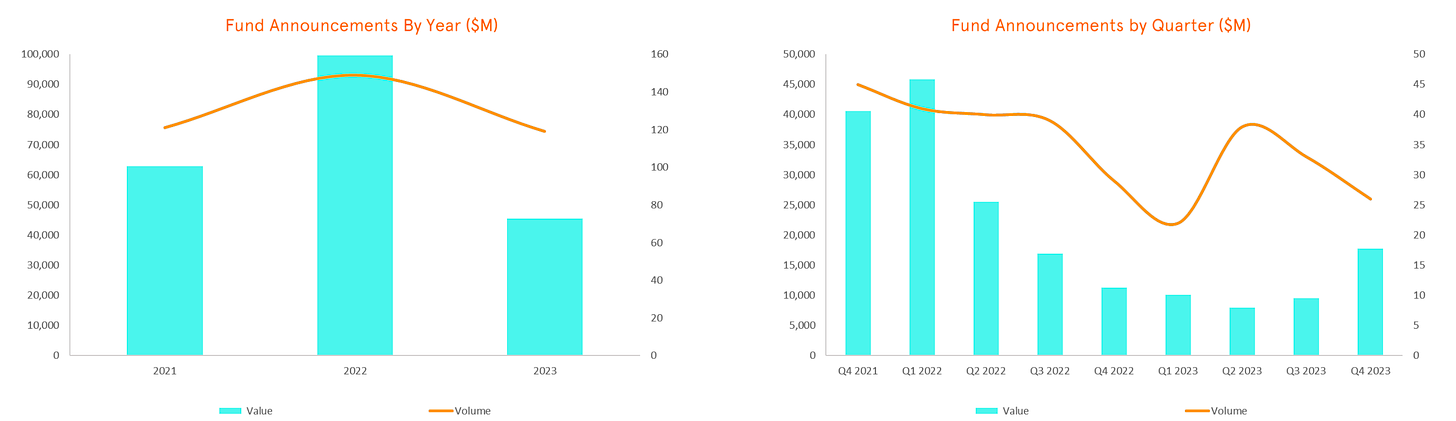
In 2023, 119 funds (-20% YoY) announced raising funds totaling $45.4 billion (-54% YoY).
Private Investments
-
In the second half of 2023, there were 270 venture investment deals totaling $2.1 billion. This is 4% less in volume and 22% less in quantity compared to the first half.
-
DDM expects venture investment activity in 2024 to remain at 2023 levels.
-
Saudi PIF still has over 75% of unallocated capital. It is expected that the company will continue to actively deploy funds.
-
Large Chinese companies will continue to try to gain a foothold in the West against the backdrop of regulating the local market.
-
The crypto winter is over, so an increase in venture activity in blockchain can be expected in 2024.
M&A and IPO
-
In the second half, the volume of M&A deals amounted to $76 billion (73 deals). Of course, this includes the acquisition of Activision Blizzard for $68.7 billion.
-
The trend of layoffs will continue in 2024, including from large companies. ByteDance, Epic Games, Unity have already started.
-
There will be more opportunities for cheap M&A deals on the market as independent companies find it difficult to stay in the market.
-
The IPO market is stable - 3 transactions per quarter, most of which are on the Polish market. The boom seen in 2020-2021 will not return for a long time.
Q4 2023 Results - Private Investments
-
In Q4 2023, there were 119 deals (-21% compared to Q3) totaling $936.6 million (-22% compared to Q3). This is the first quarter since Q3 2018 when the volume of venture investments in games was less than $1 billion.
-
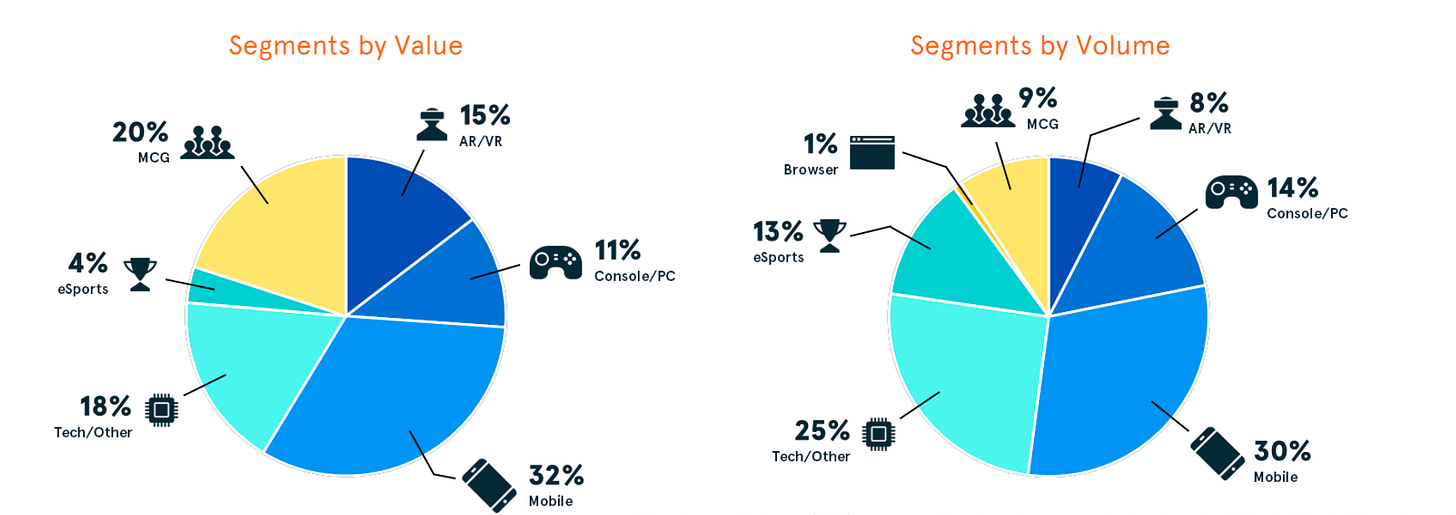
33% of the volume went to mobile startups; 20% to MGC (a segment DDM allocates to multiplayer projects, including metaverse projects); 18% to tech startups; 15% to AR/VR; 11% to PC and consoles; 4% to eSports.
-
In terms of the number of venture deals, 30% went to mobile; 25% to tech startups; 14% to PC/console studios; 13% to eSports; 9% to MGC; 8% to AR/VR; 1% to browser projects.
- In the fourth quarter, there were 29 undisclosed venture deals (24% of the total). The average for previous periods is 17%.
Q4 2023 Results - M&A
-
The deal volume amounted to $69.9 billion. Excluding the Activision Blizzard deal - $1.2 billion. There were 42 transactions (41 without AB). This is an 80% decrease in volume compared to Q4 2022.
- The valuation of companies went public was $112 million (+257% YoY).
GSD & GfK: The European Gaming Market Actually Grew in February 2024
Analytical platforms report only actual sales figures obtained directly from partners. The mobile segment is also not taken into account.
Game Sales
-
In February of this year, 16.74 million games were sold on PC and consoles in Europe. In fact, this is a growth of 21.2% compared to February 2023, but this year February had 5 weeks of sales. Comparing equivalent periods, game sales in 2024 dropped by 0.1%.
-
In February of last year, Hogwarts Legacy was released; its sales in just 5 weeks after release were higher than the sales of the entire top 10 games in February 2024.
It is worth noting that Palworld is not included in sales figures. Therefore, February 2024 could have been better than February 2023.
-
Helldivers II was the top hit of the month. 56% of the project's sales came from PC. The project has an interesting sales dynamic, quite atypical for a paid game. In the second week, it sold 70% better than the first. And in the third week, it sold 3% better than the second. Only in the fourth week did sales drop by 28% compared to the third week.
For most paid projects, sales in the second week are 60-80% lower than in the first.
-
Helldivers II sales for the first 4 weeks are only 5% behind Marvel’s Spider-Man II. The latter, however, was only available on PS5 and sold at a higher price.
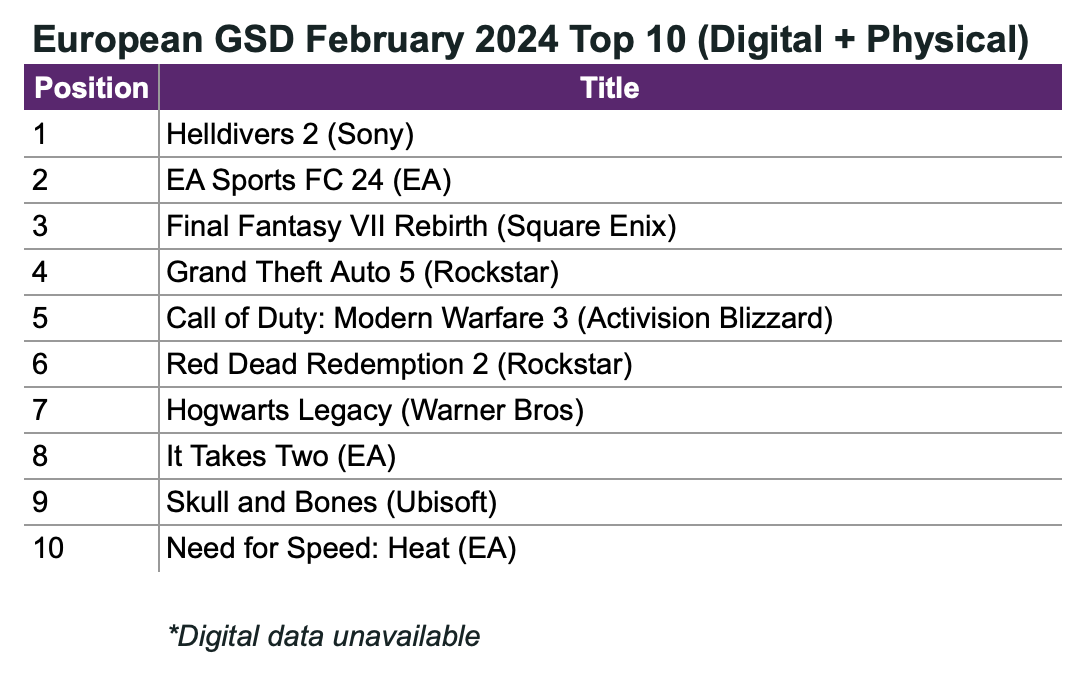
- EA Sports FC 24 takes the second position; the game sells well.
-
Final Fantasy VII: Rebirth climbed to the 3rd position on the chart. But its sales are 23% worse than the first part of the remake. And if compared to last year's Final Fantasy XVI, sales are 4% better.
-
Skull and Bones debuted at the 9th position. Its sales after the first 3 weeks are 30% worse than Sea of Thieves, released in March 2018.
-
Suicide Squad: Kill the Justice League didn't even make it to the top 10; it's at the 12th position. After the first 5 weeks, it sells 33% worse than Gotham Knights and 61% worse than Guardians of the Galaxy.
Console Sales
-
GSD does not take into account console sales in Germany and the United Kingdom.
-
In February, just over 474 thousand consoles were sold in Europe. This is actually 11% more than the previous month, but if compared weekly, sales dropped by 14%.
-
PS5 dropped slightly - by 2% YoY. Nintendo Switch suffered greater losses - -17% YoY; Xbox Series S|X suffered the most - its sales dropped by 47%.
-
In February 2024, 1.6 million accessories were sold. The best-selling ones were DualSense and Xbox Wireless Controller.
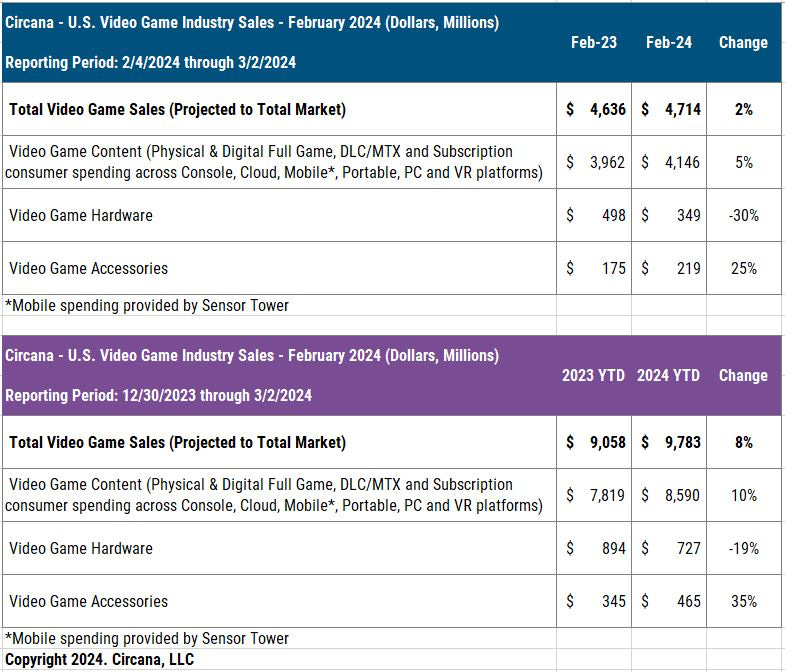
Circana: The US Gaming Market in February 2024
General numbers
-
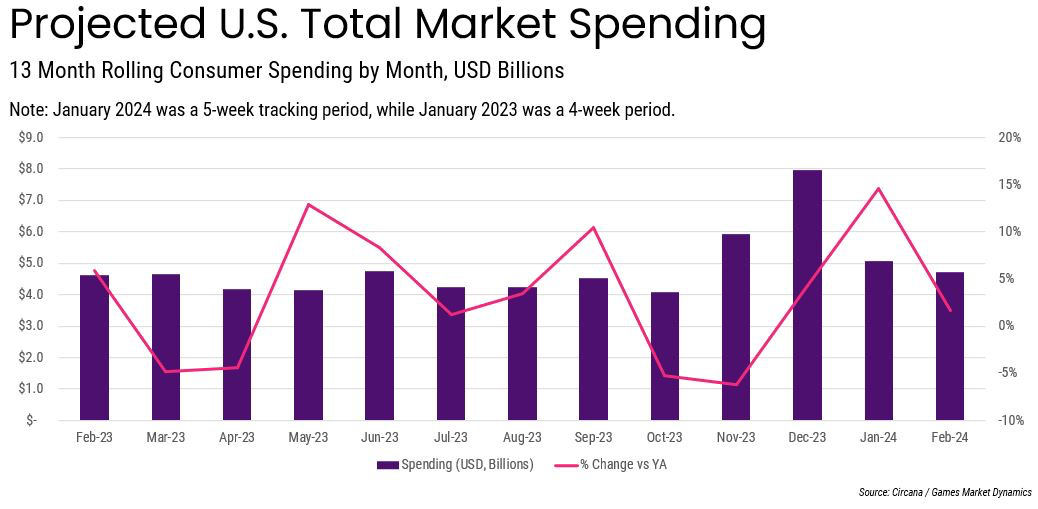
The revenue of the US gaming market in February 2024 amounted to $4.714 billion, which is 2% higher than the previous year.
-
Game sales in February increased by 5% compared to last year ($4.146 billion); hardware sales decreased by 30% ($349 million); accessory sales grew by 25% ($219 million).
-
For the first 2 months of February 2024, the American gaming market shows dynamics 8% better than in 2023.
This is due to accounting peculiarities - for the first 2 months of 2024, there was one extra counted week in January 2024.
-
PlayStation 5 became the sales leader in the USA. Nintendo Switch ranks second in unit sales; Xbox Series S|X - in second place in terms of dollars.
-
PlayStation Portal became the most successful accessory in February by revenue.
PC/Console Charts
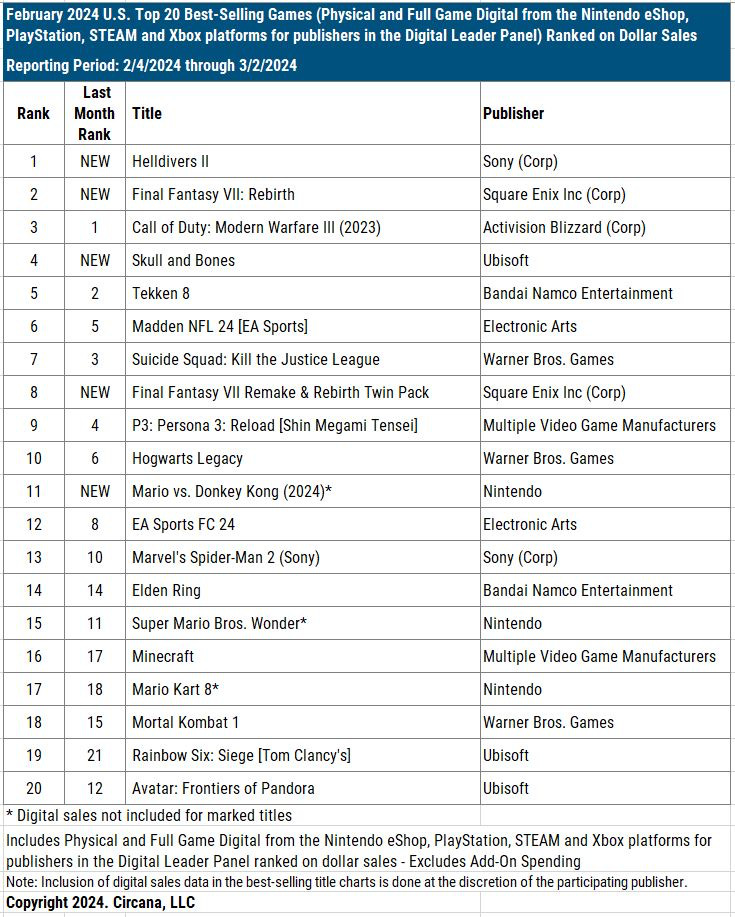
-
Helldivers II, Final Fantasy VII: Rebirth, and Call of Duty: Modern Warfare III were the best-selling projects in February 2024.
-
Among the new releases, Skull and Bones (4th position) and Mario vs. Donkey Kong (11th position) also made it to the chart.
-
At the moment, Helldivers II tops the list of the best-selling games of 2024 in the USA.
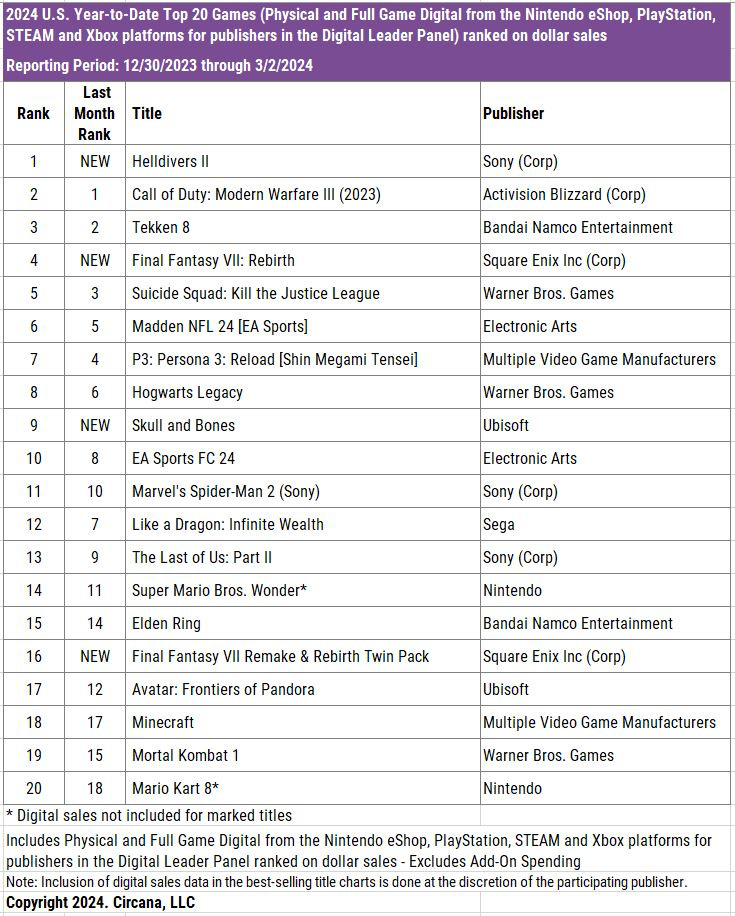
- Helldivers II ranked 7th in the list of the best-selling Sony games in the USA. Approximately 60% of sales came from Steam.
Mobile Charts
-
MONOPOLY GO!; Royal Match, and Roblox - this is the top three revenue generators on mobile devices in February in the USA.
-
February revenue from mobile games in the USA grew by 17% YoY. Sensor Tower analysts believe this is due to MONOPOLY GO!.
-
Pokemon GO had a successful event in February, allowing the game to earn 60% more than in January.
Games by Platforms
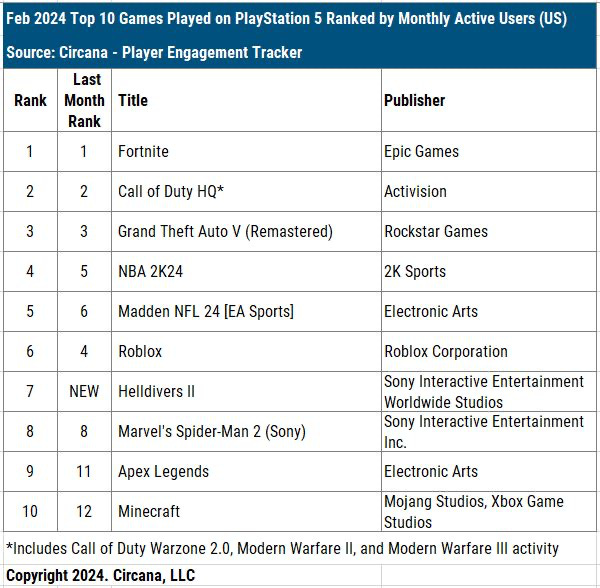
-
The leaders in MAU (Monthly Active Users) on PS5 in the USA remain unchanged - Fortnite; Call of Duty, and GTA V. Helldivers II - ranks 7th.
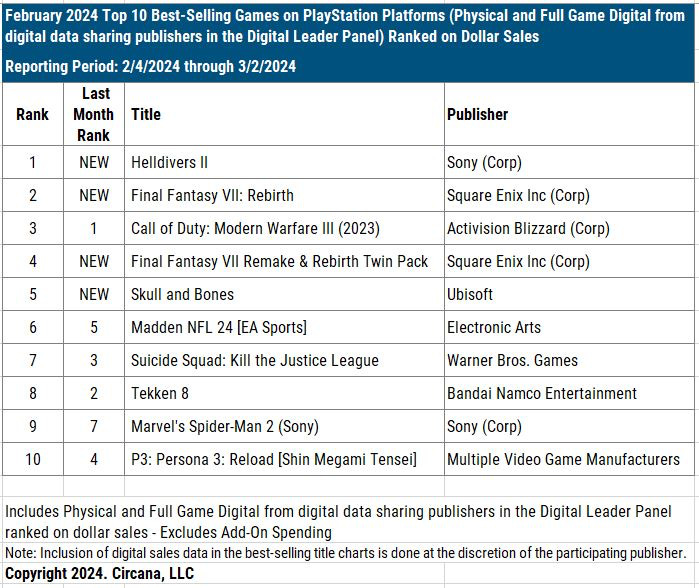
- When considering sales, Helldivers II; Final Fantasy VII: Rebirth, and Call of Duty: Modern Warfare III were the best-selling games on PS5 in February.
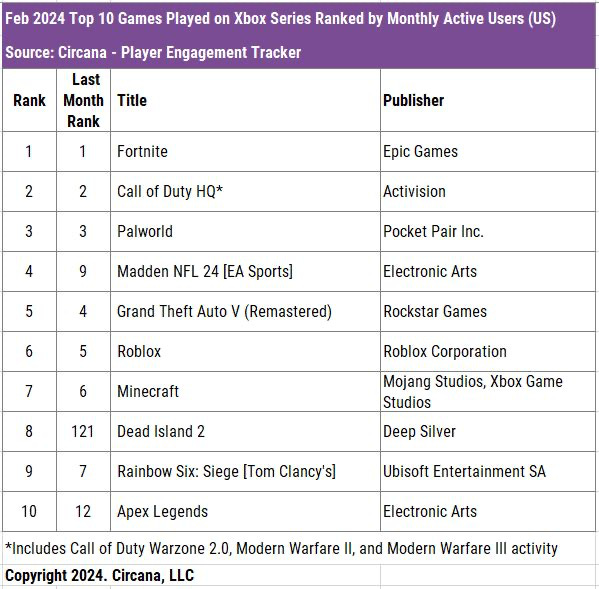
- On Xbox, the situation is the same, with one difference - instead of GTA V, Palworld ranks third. The sales leaders were Call of Duty: Modern Warfare III; Skull and Bones, and Madden NFL 24.
- The release of Dead Island 2 on Xbox Game Pass Ultimate helped the game rise from 121st place by MAU in January to 8th in February.
-
The largest games by MAU on Steam are Helldivers II, Palworld, and Counter-Strike 2.
- The best-selling games on Nintendo platforms in February in the USA are Mario vs. Donkey Kong; Super Mario Bros. Wonder; Mario Kart 8. All - excluding digital versions.
Unity: Gaming in 2024 Report

Data was collected from Unity Engine; Unity Cloud, and ironSource. All platforms were taken into account. In addition, Unity conducted a survey with more than 7,000 respondents.
5 Key Trends
-
Developers are integrating AI into their processes to accelerate development.
-
Studios are changing their approaches to monetization. More attention is being paid to advertising amid the decline in IAP revenue.
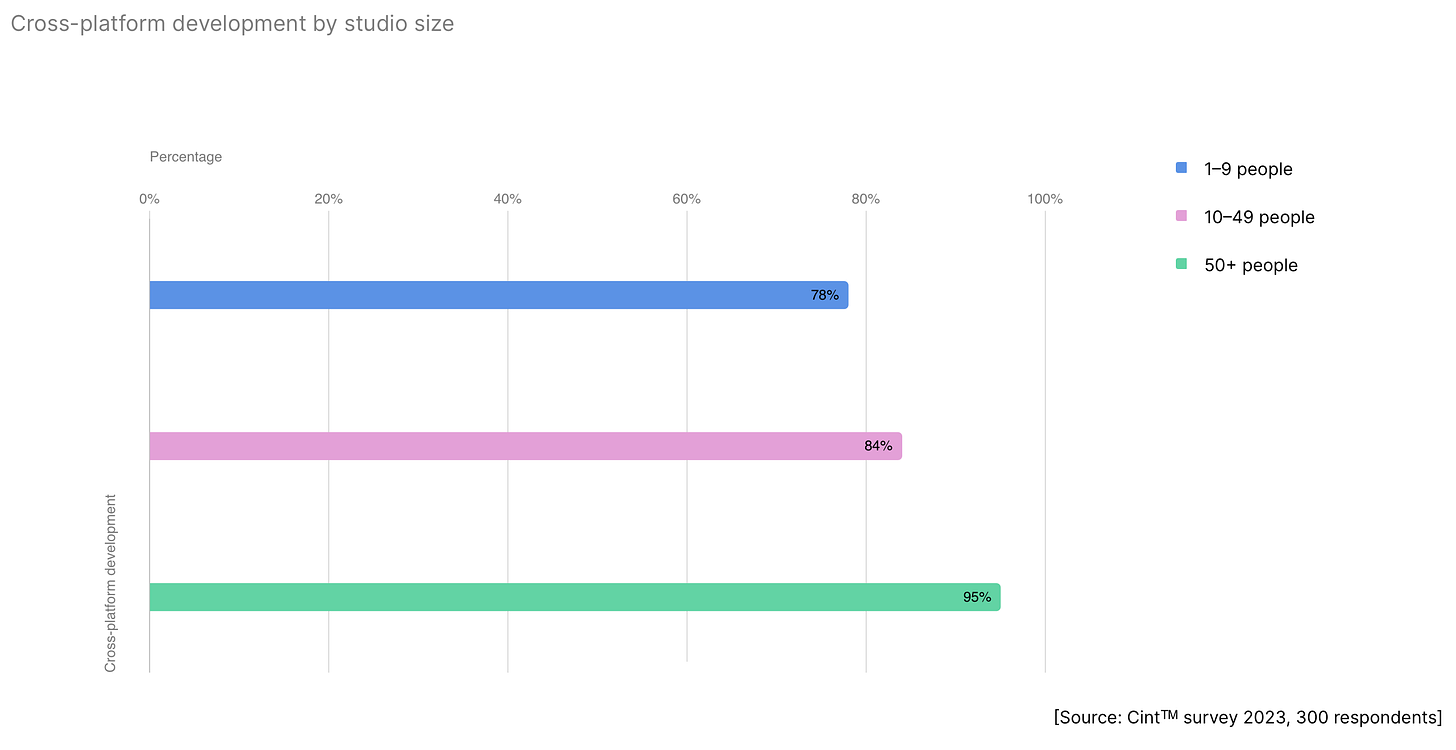
-
Studios of all sizes are releasing more cross-platform projects.
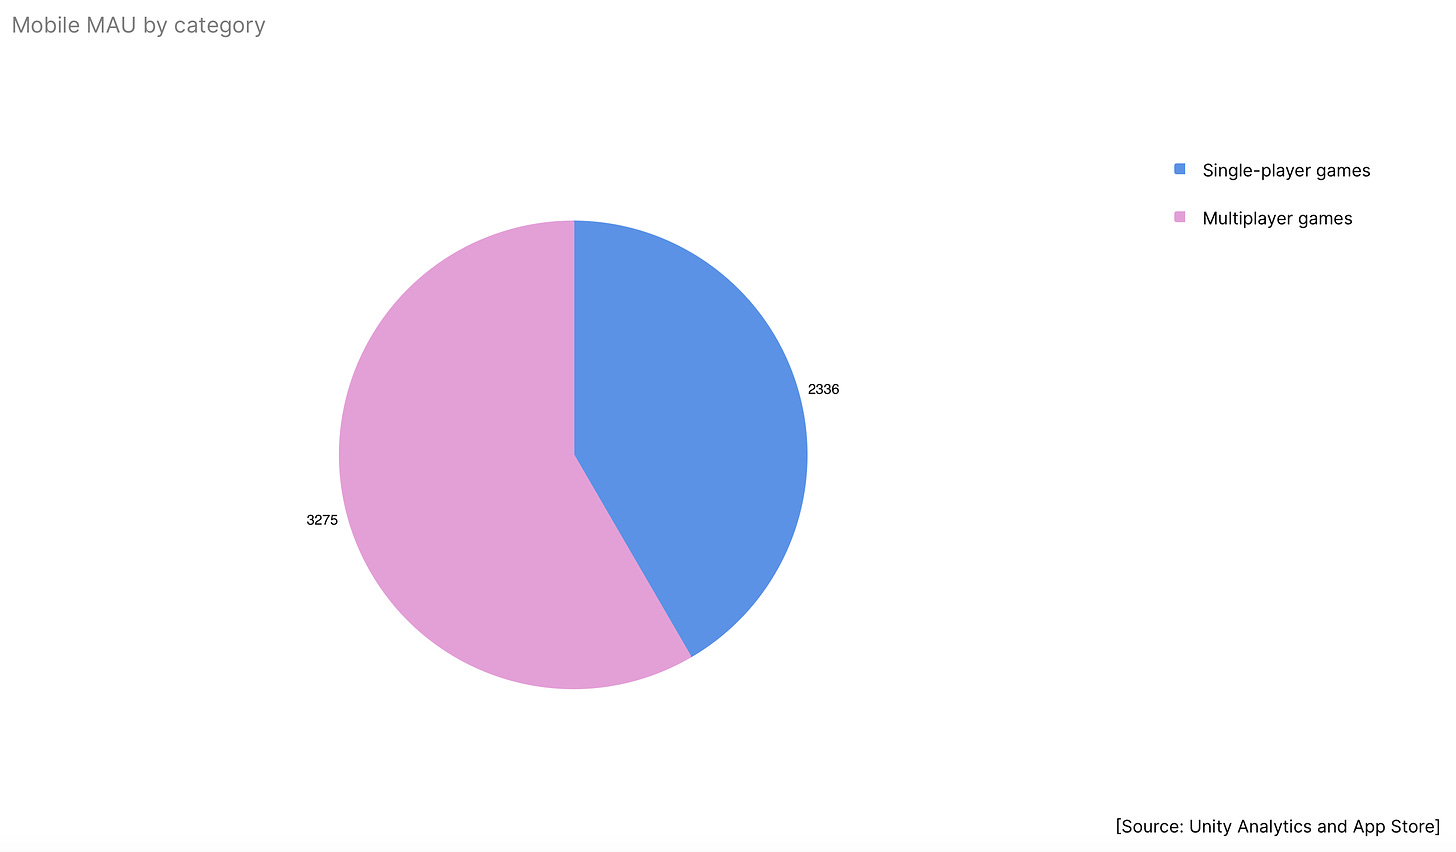
-
Developers are prioritizing multiplayer projects despite the complexity in their development.
-
Developers are now trying to build strong franchises rather than just games.
AI Usage in Games
-
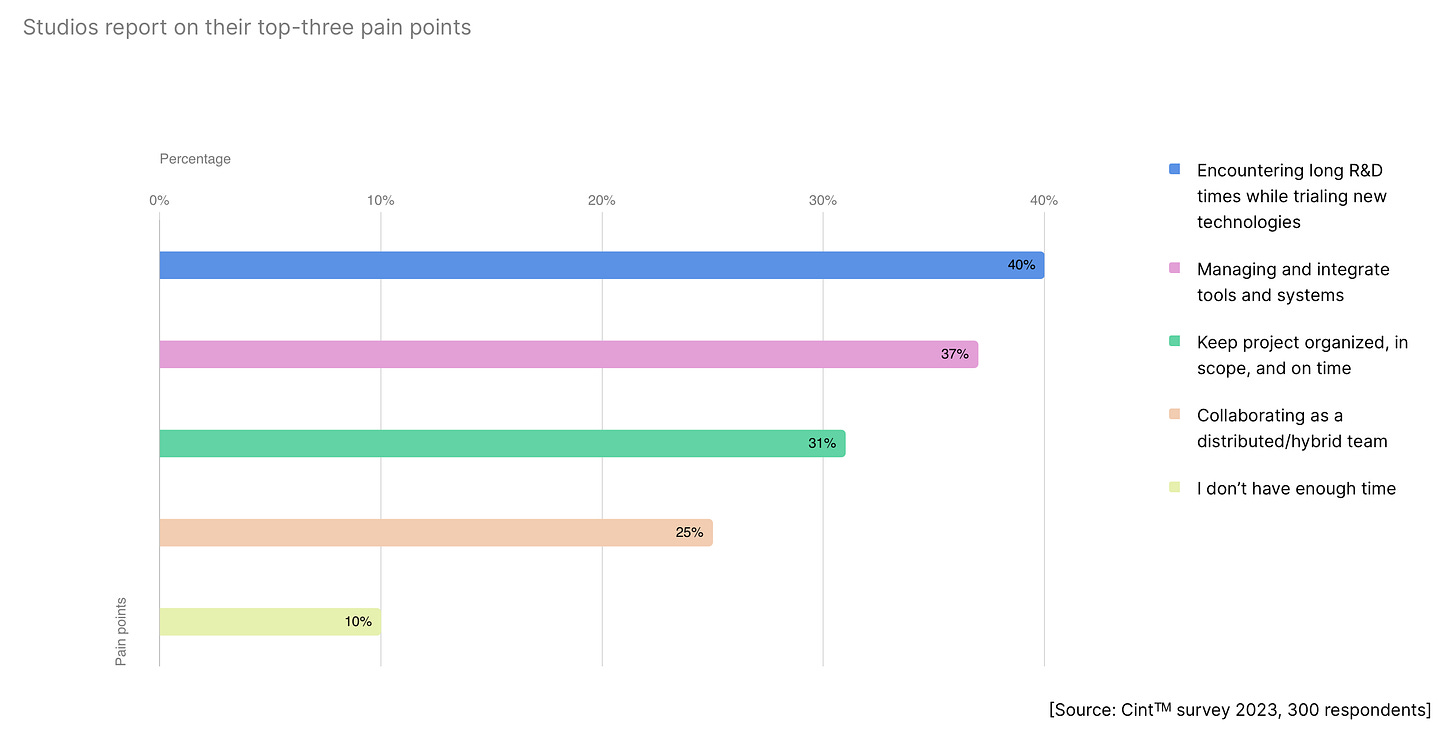
The average game development time has increased from 218 days in 2022 to 304 days in 2023. To speed up processes, studios are seeking new solutions - but they still face difficulties. 40% spend a lot of time in the R&D process; for 37%, a significant amount of time is spent on integrating new technologies; for 31%, it is challenging to maintain project deadlines and scope when applying new technologies.
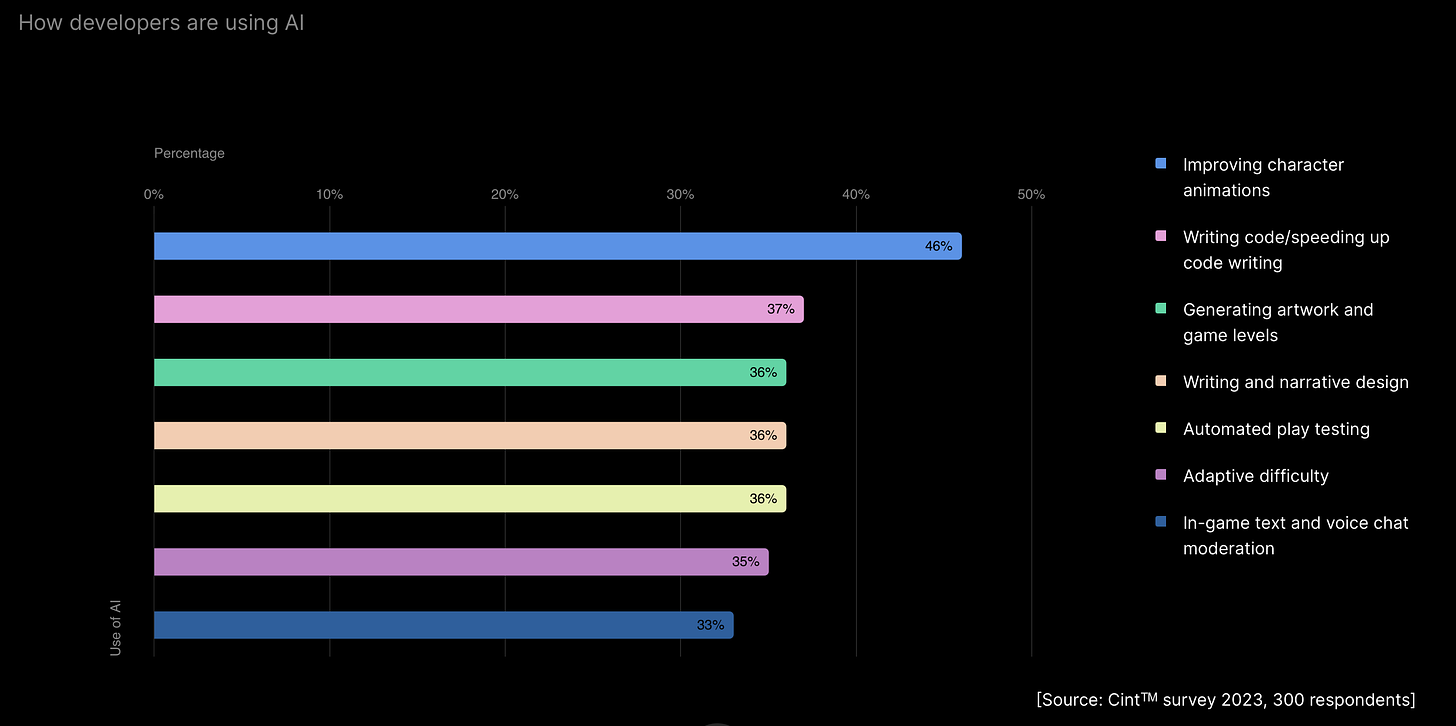
- The most common areas of AI application in development are improving animations (46%); writing code (37%); generating art and levels (36%); narrative design (36%); automated playtests (36%); difficulty adaptation (35%); moderation of voice and text chats (33%).
-
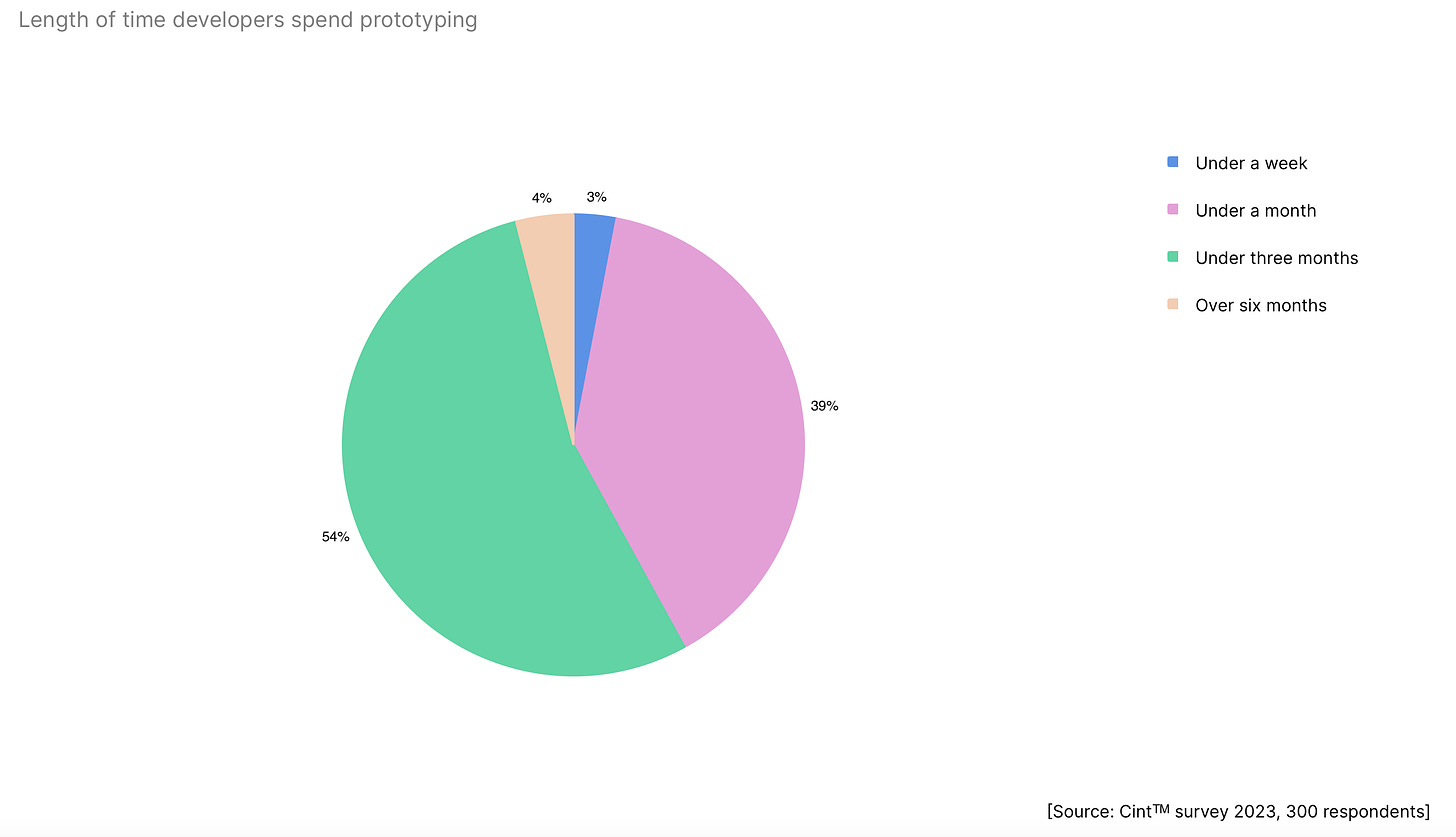
Prototyping takes less than 3 months for 96% of studios. For 42%, it takes less than one month. 68% of respondents noted that AI helps speed up this process. This is confirmed by the numbers - in 2022, 85% of studios prototyped in less than 3 months.
-
56% of studios that have integrated AI into their processes use the technology for world-building. Among the most popular use cases are creating NPCs, generating unique gameplay moments, speech recognition, and contextual NPC responses.

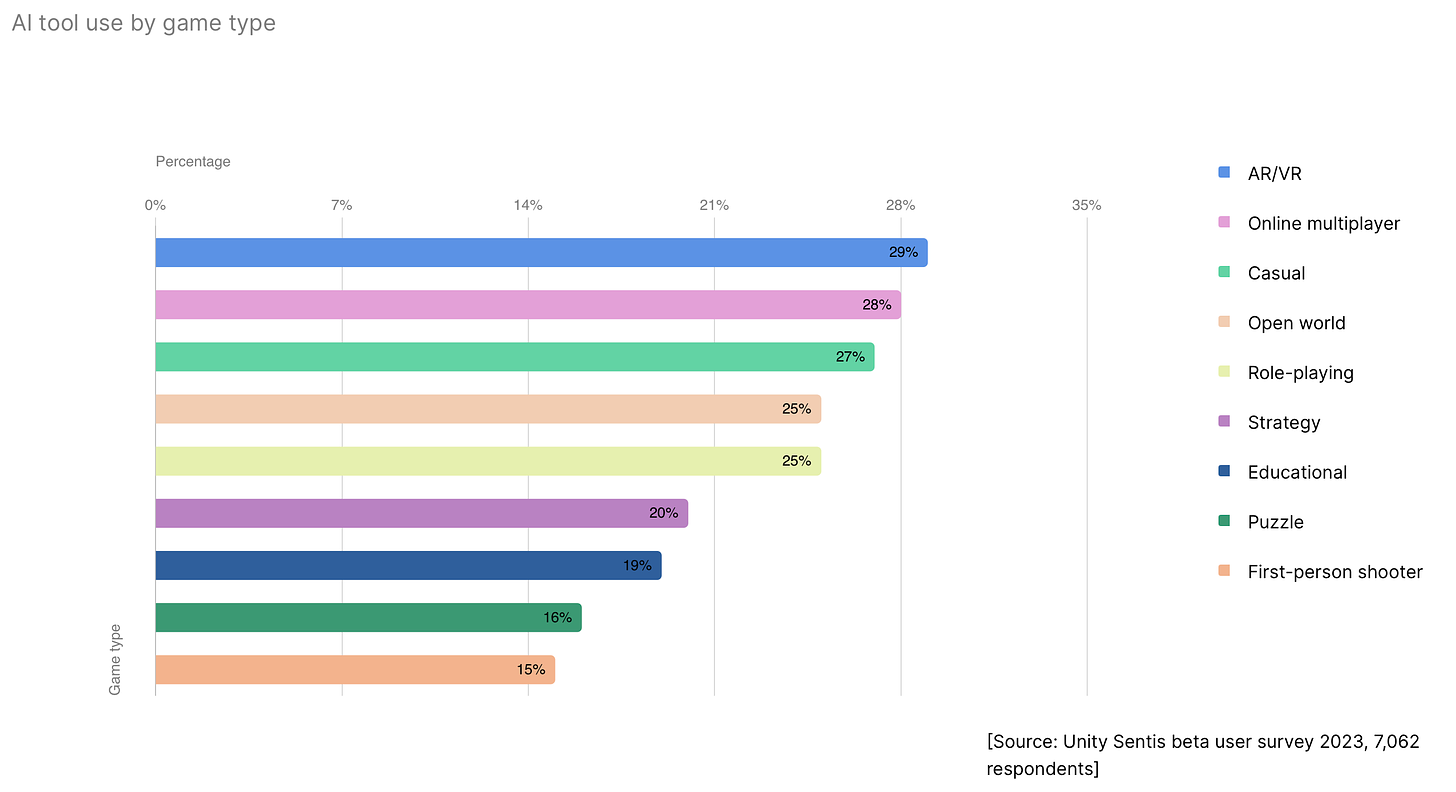
- AI is most commonly used by AR/VR developers (29%), multiplayer game creators (28%), casual developers (27%), open-world projects (25%), and RPG games (25%).
-
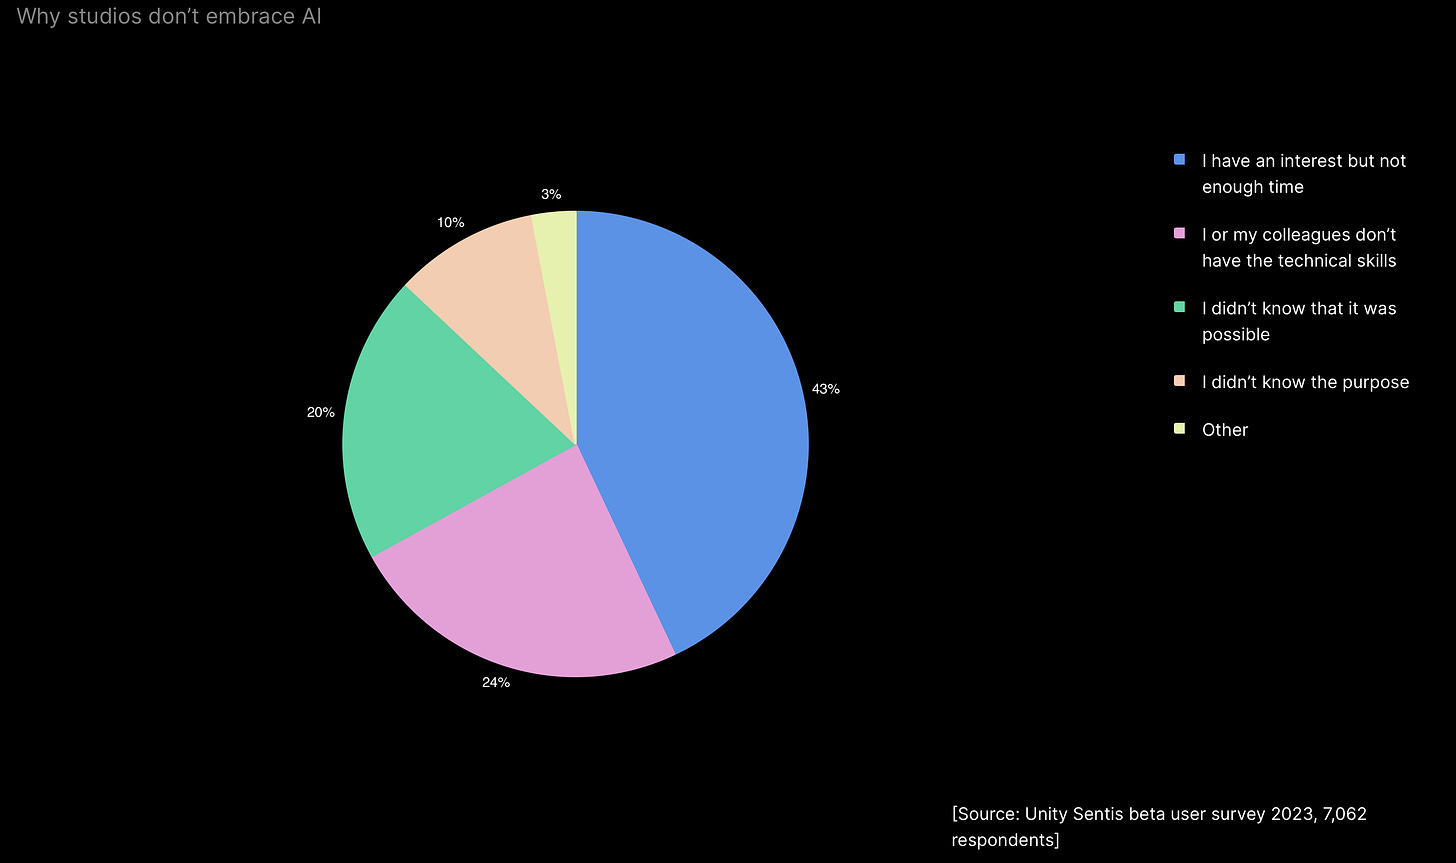
The main challenges in integrating AI are lack of time (43%), lack of technical skills (24%), and unawareness of AI capabilities (20%).
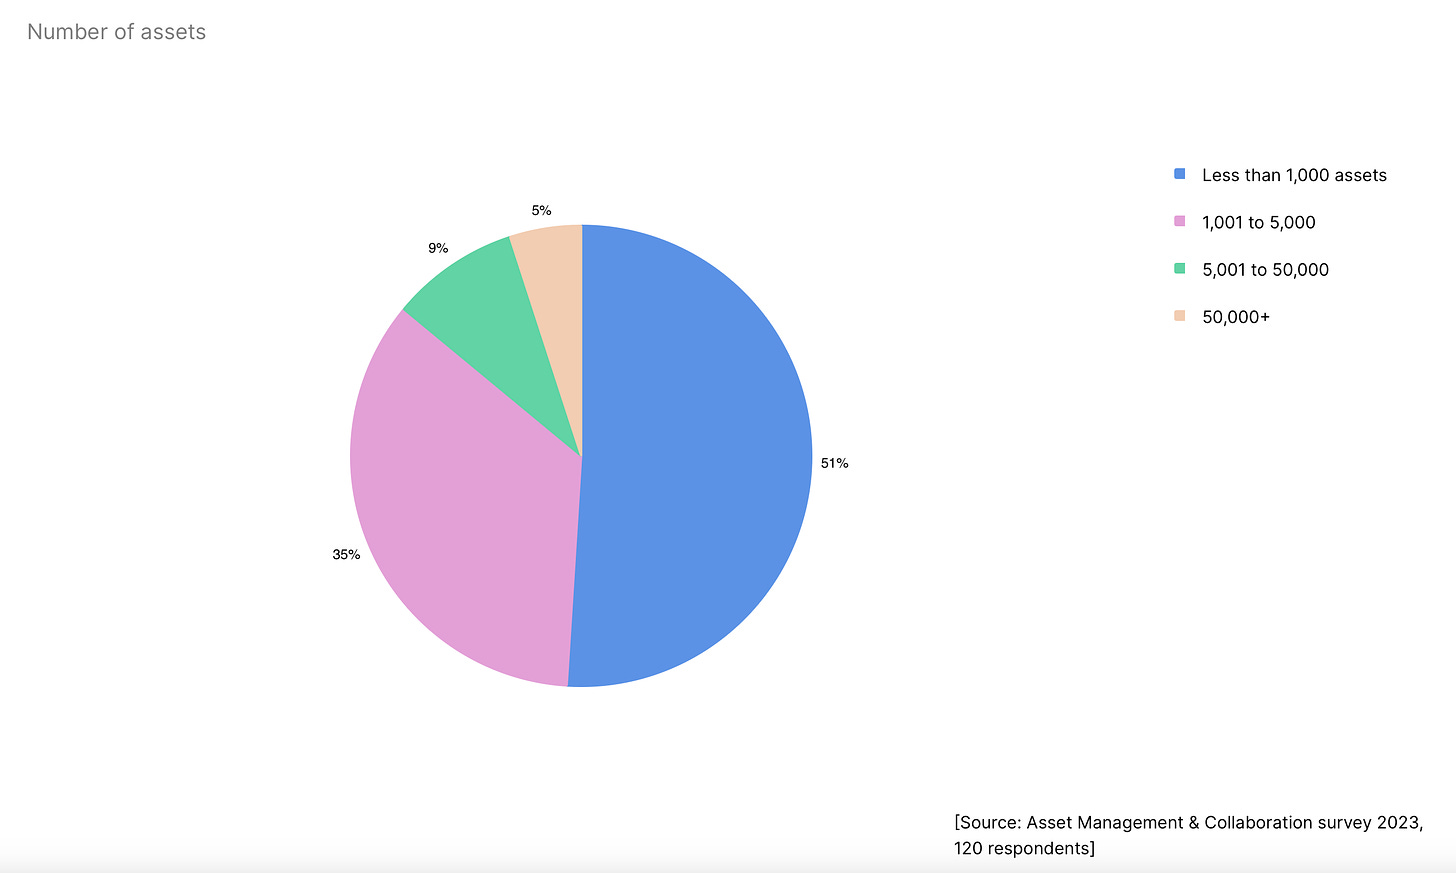
- 51% of studios have fewer than 1000 assets; 35% have between 1001 to 5000; 9% have between 5001 to 50,000; and 5% have over 50,000. According to developer surveys, 20% spend more than 4 hours per week structuring asset bases. AI can help with this.
Mobile Market Status and Revenue Sources
-
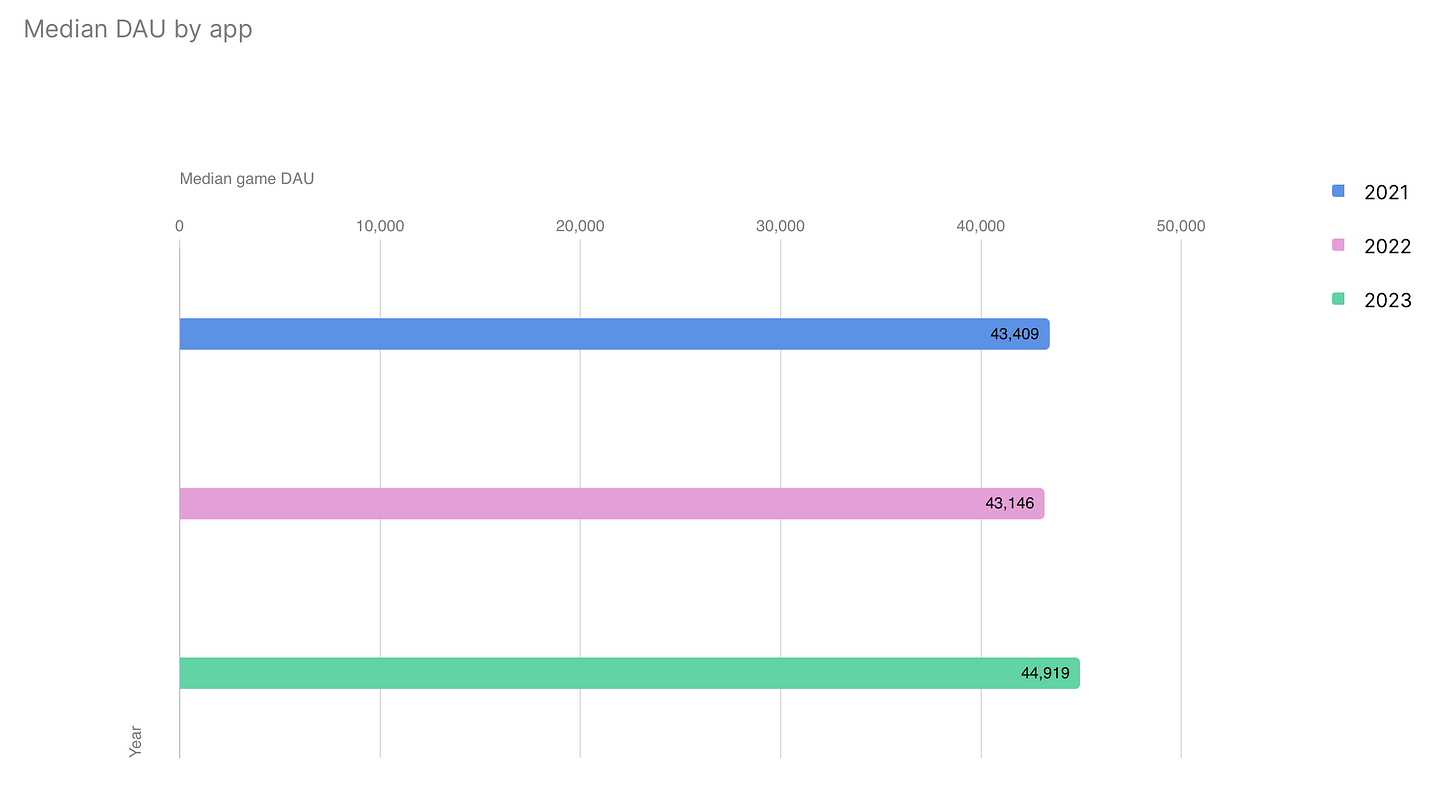
According to Unity data, DAU (Daily Active Users) in mobile games increased by 4.5% in 2023 compared to 2022.
-
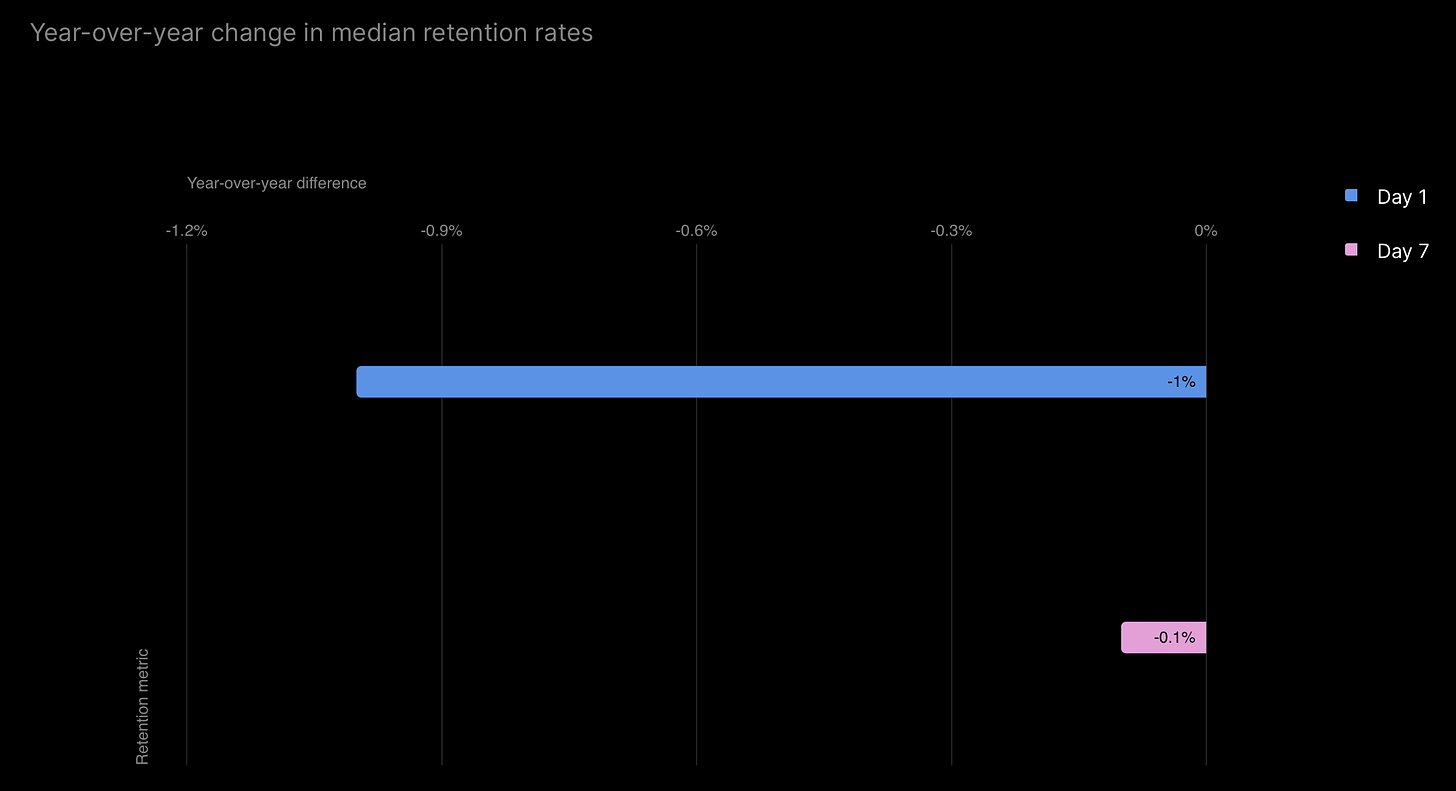
The average figures for D1 Retention decreased by 1%; D7 Retention decreased by 0.1%.
-
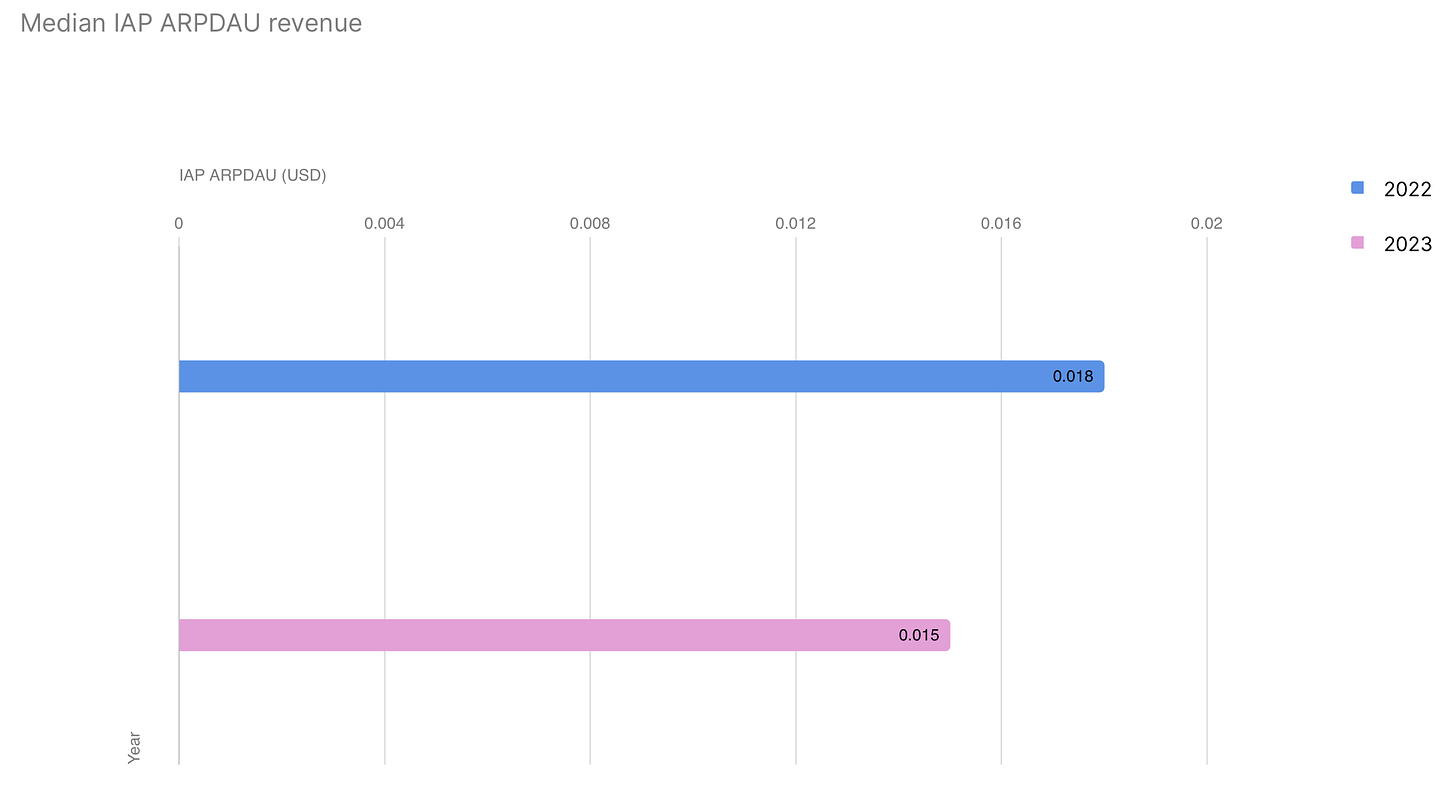
IAP revenue is declining. The median IAP ARPDAU (Average Revenue Per Daily Active User) was $0.015 in 2023 compared to $0.018 in 2022, a 13% decrease.
-
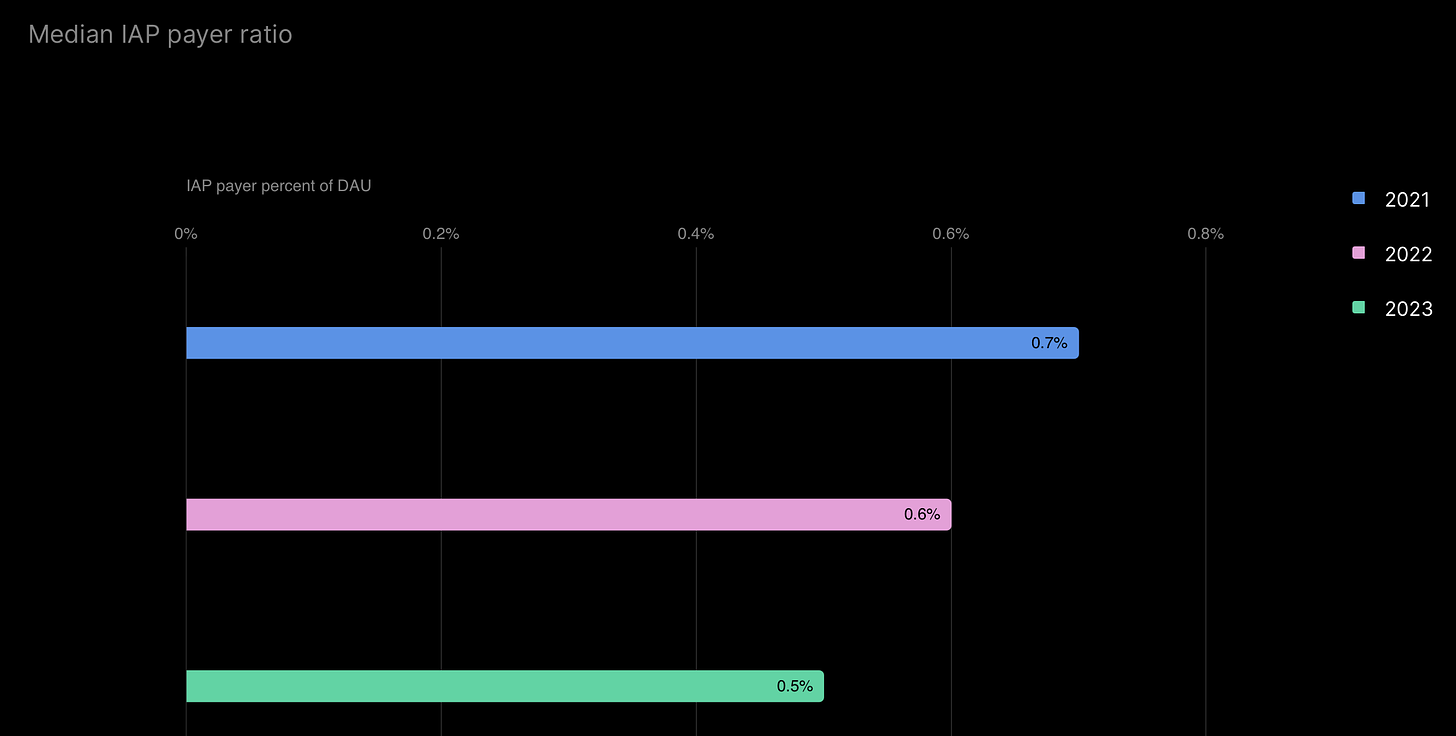
The median percentage of paying users in mobile games is also decreasing annually. In 2021, this figure was 0.7%; in 2022 - 0.6%; in 2023 - 0.5%.
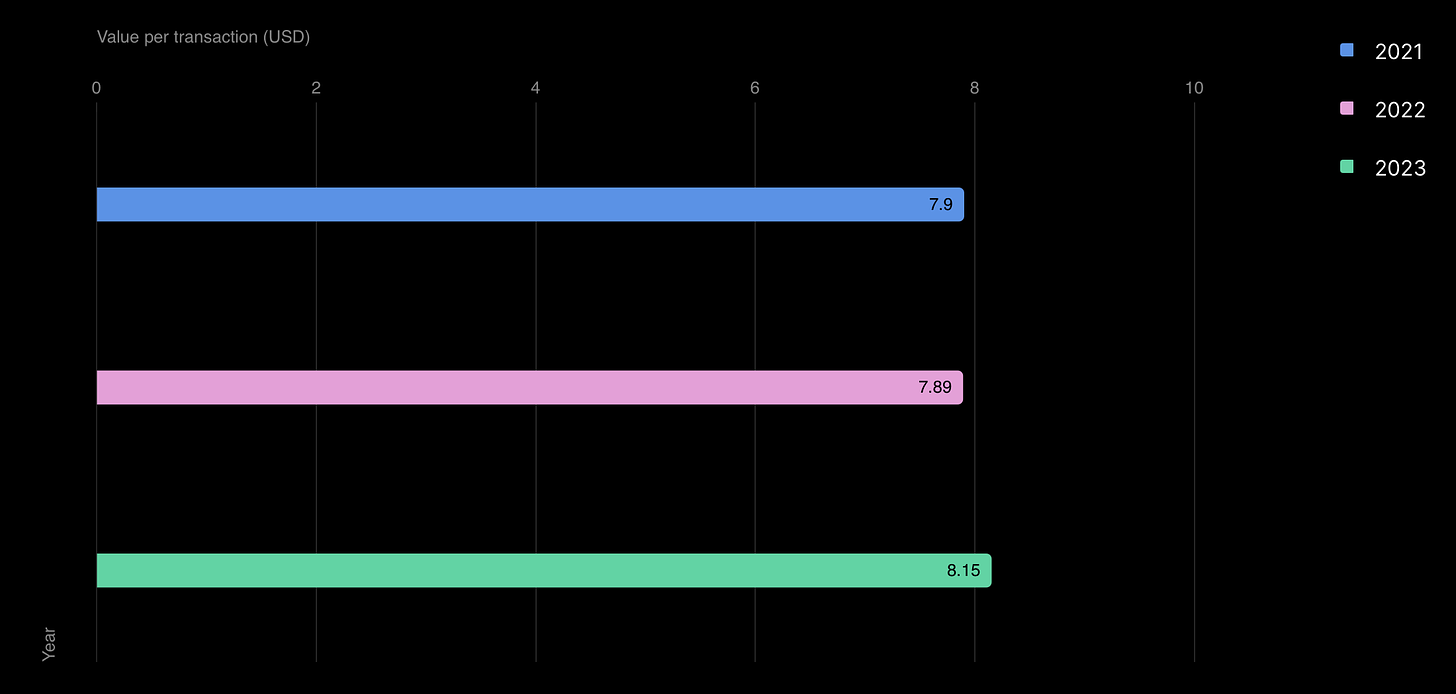
- However, the behavior of paying users has remained unchanged over the years. On average, one paying user accounts for 1.46 transactions, and the average revenue per transaction increased from $7.89 in 2022 to $8.15 in 2023.

-
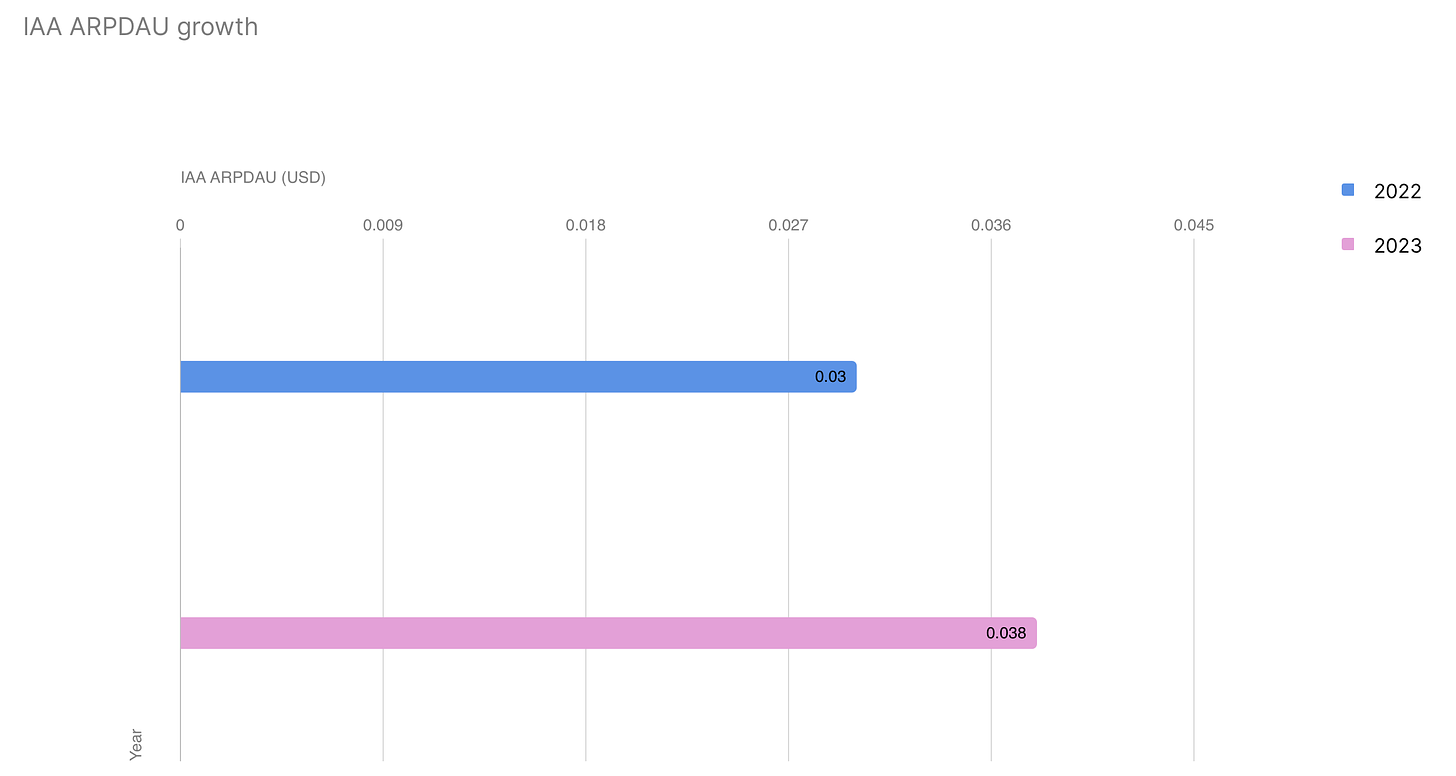
In contrast, advertising revenue showed significant growth - by 26.7%. In 2022, IAA (In-App Advertising) ARPDAU was $0.03, while in 2023, it reached $0.038.
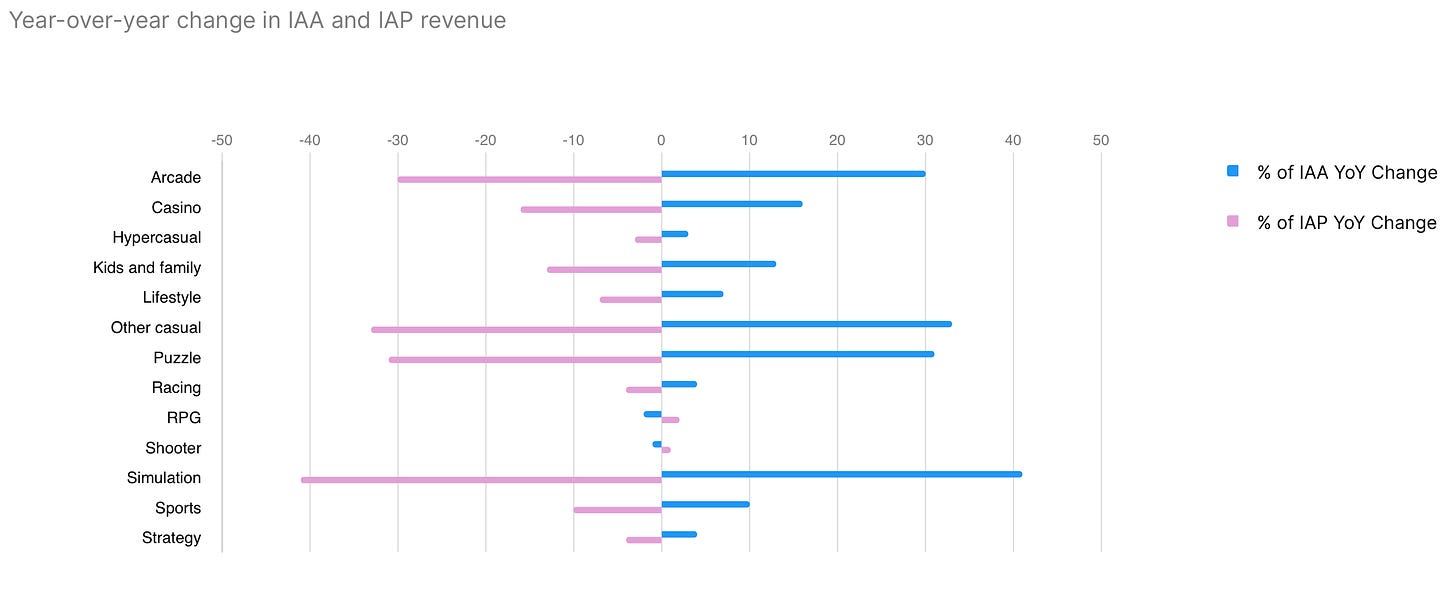
- Simulation games, casual projects, and puzzles saw the most significant growth in IAA revenue. IAP revenue increased only for RPGs and shooters, while all other genres were in the negative.
-
According to Unity data, projects with Rewarded Video and offerwalls have more daily sessions (3.12) than projects with only Rewarded Video (2.62), only offerwalls (2.58), or neither (2.1).
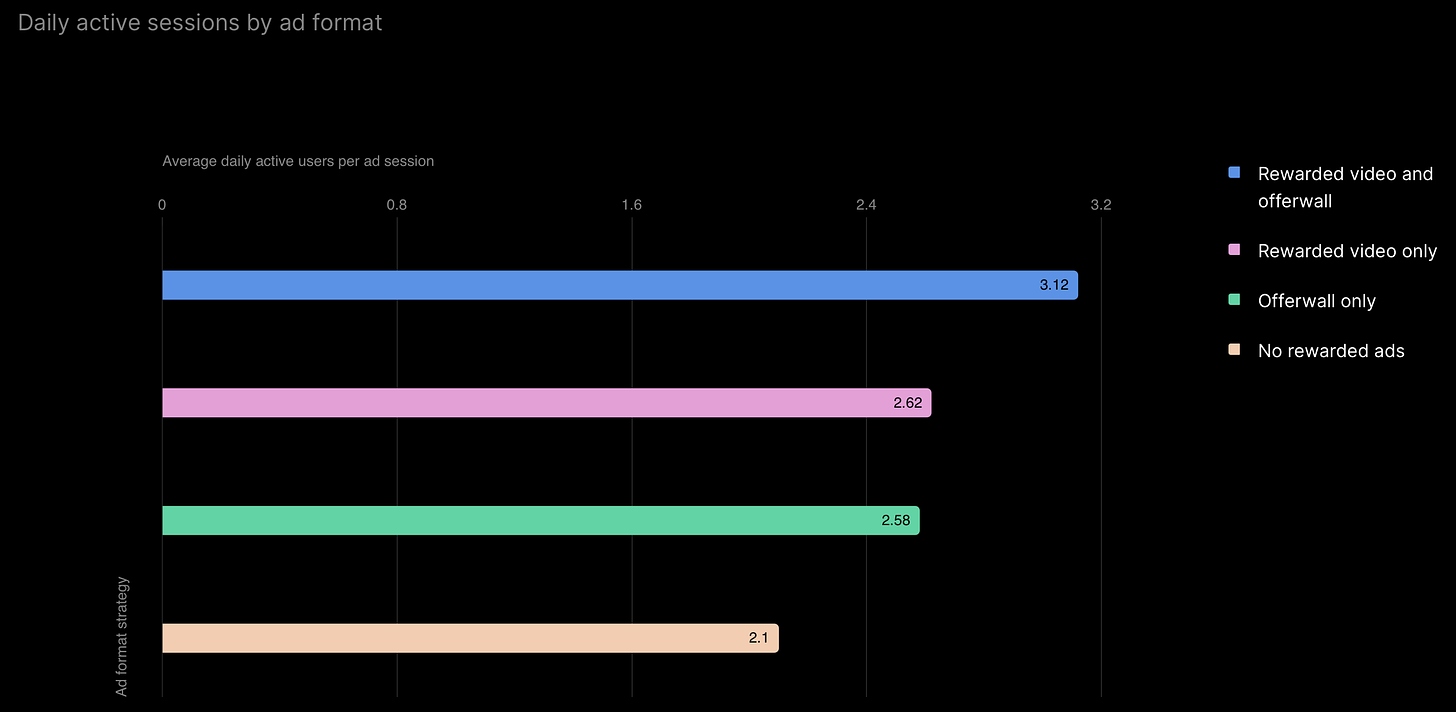
❗️There may be bias here because projects with more monetization mechanics are likely developed by large teams for big games. And besides monetization, these projects may have a large number of mechanics for audience retention.
-
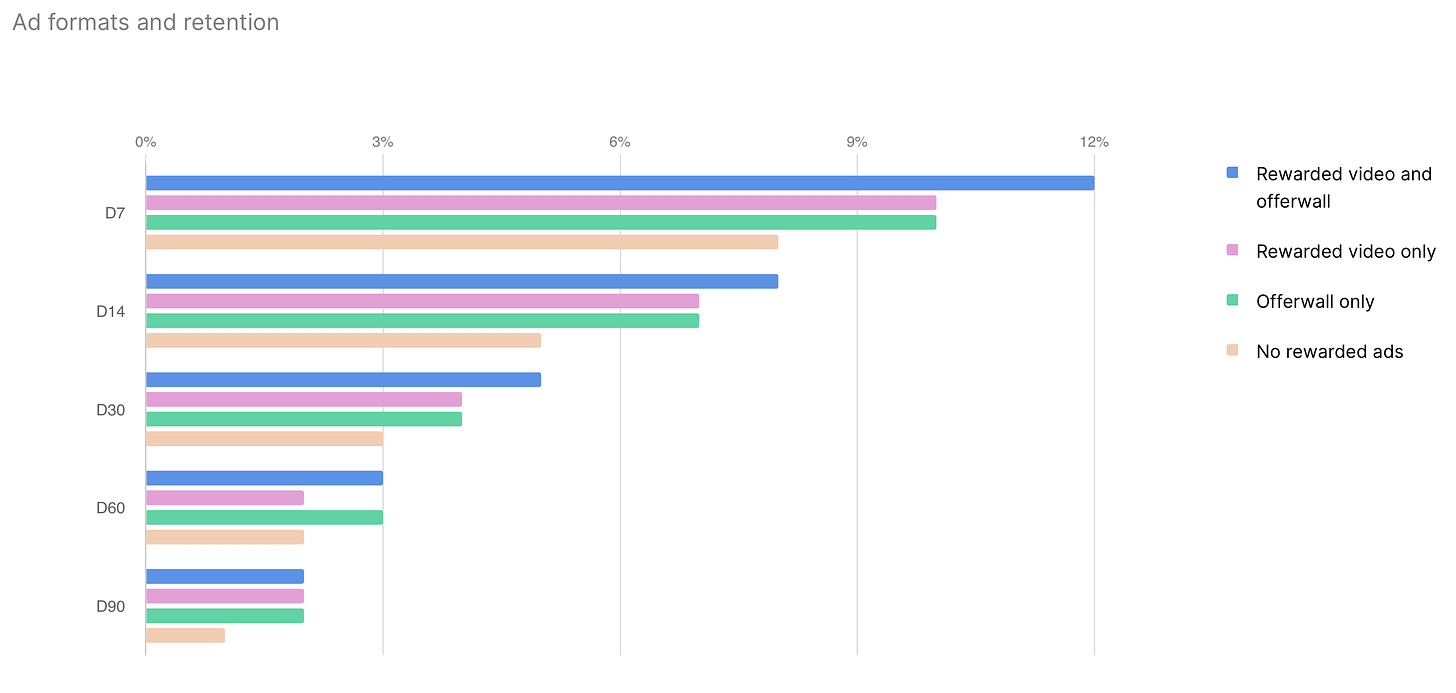
Unity presents a similar picture regarding Retention. Projects without additional monetization systems generally have poorer retention. The best performance is seen in projects with comprehensive advertising monetization.
Cross-Platform Projects
-
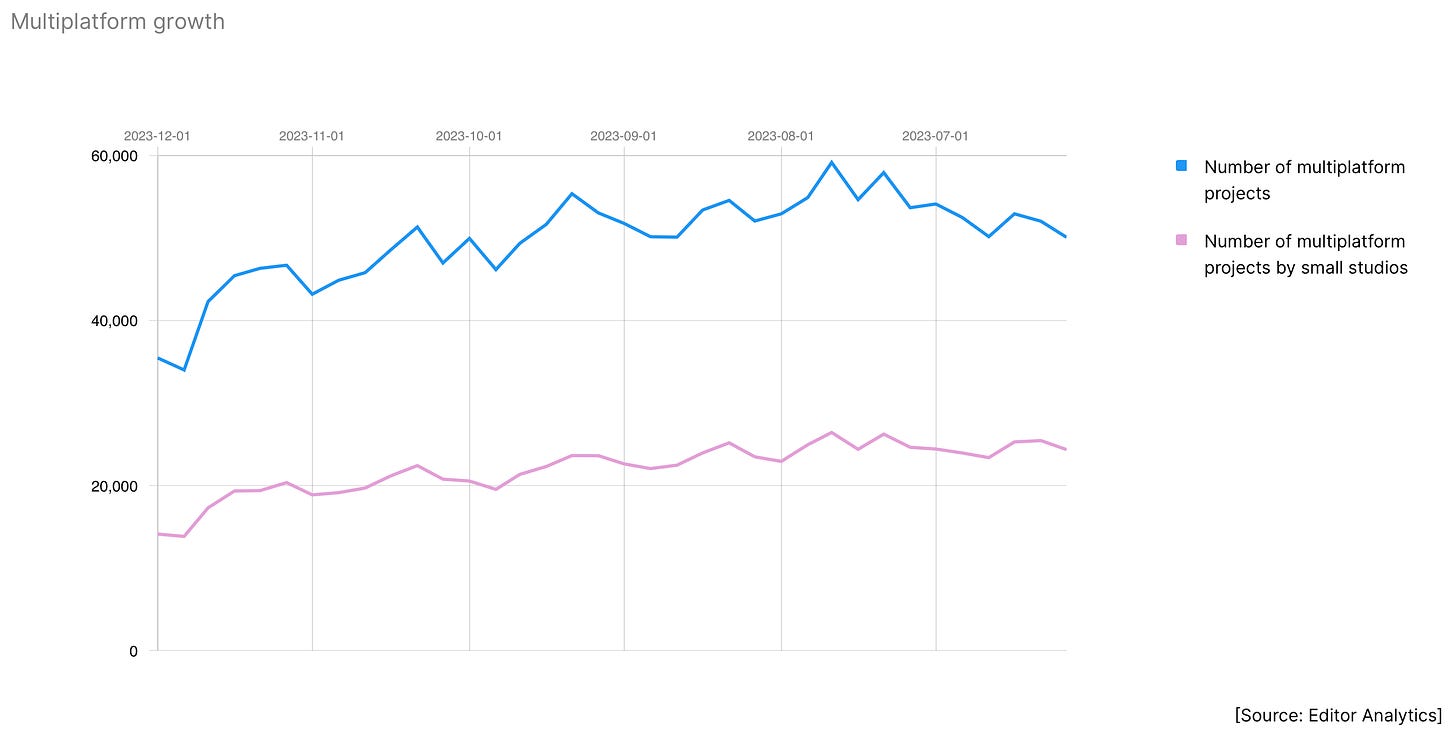
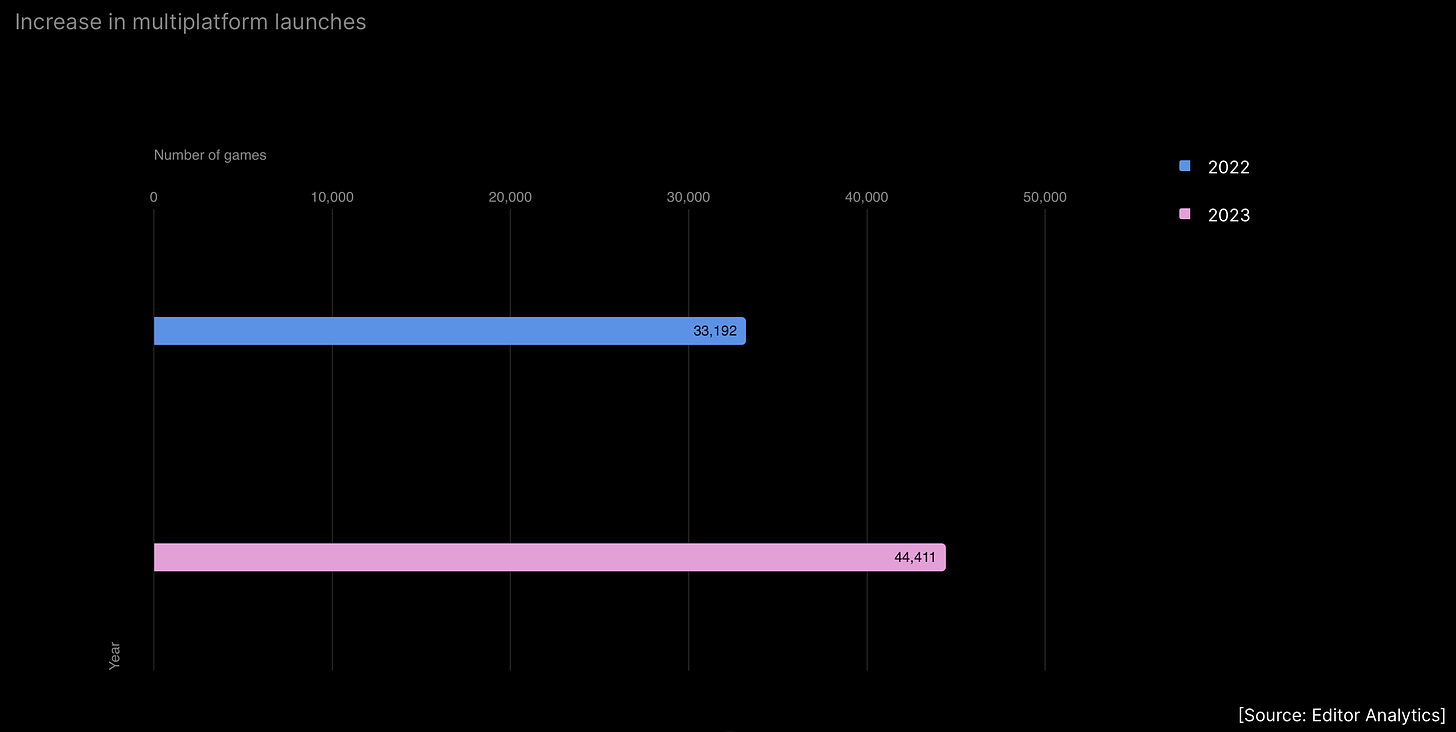
Since 2022, small studios have released 71% more cross-platform projects.
-
In 2023, there was a 34% increase in projects on three or more platforms compared to 2022.
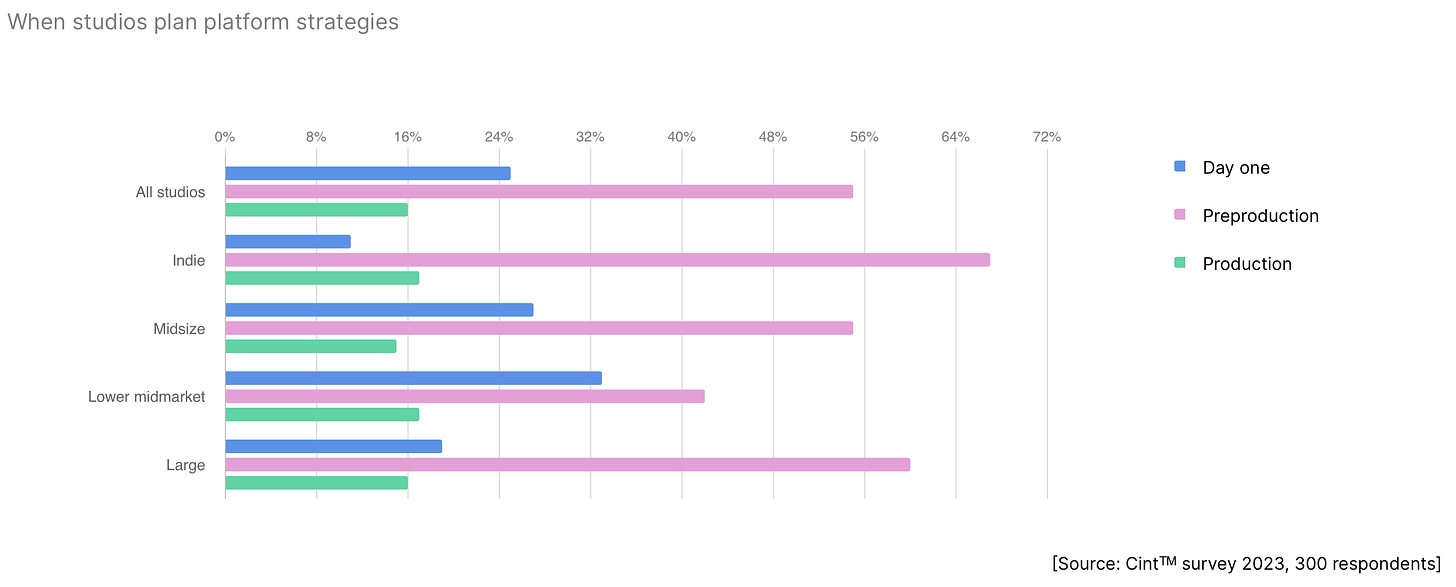
- Most studios incorporate cross-platform support at the pre-production stage.
-
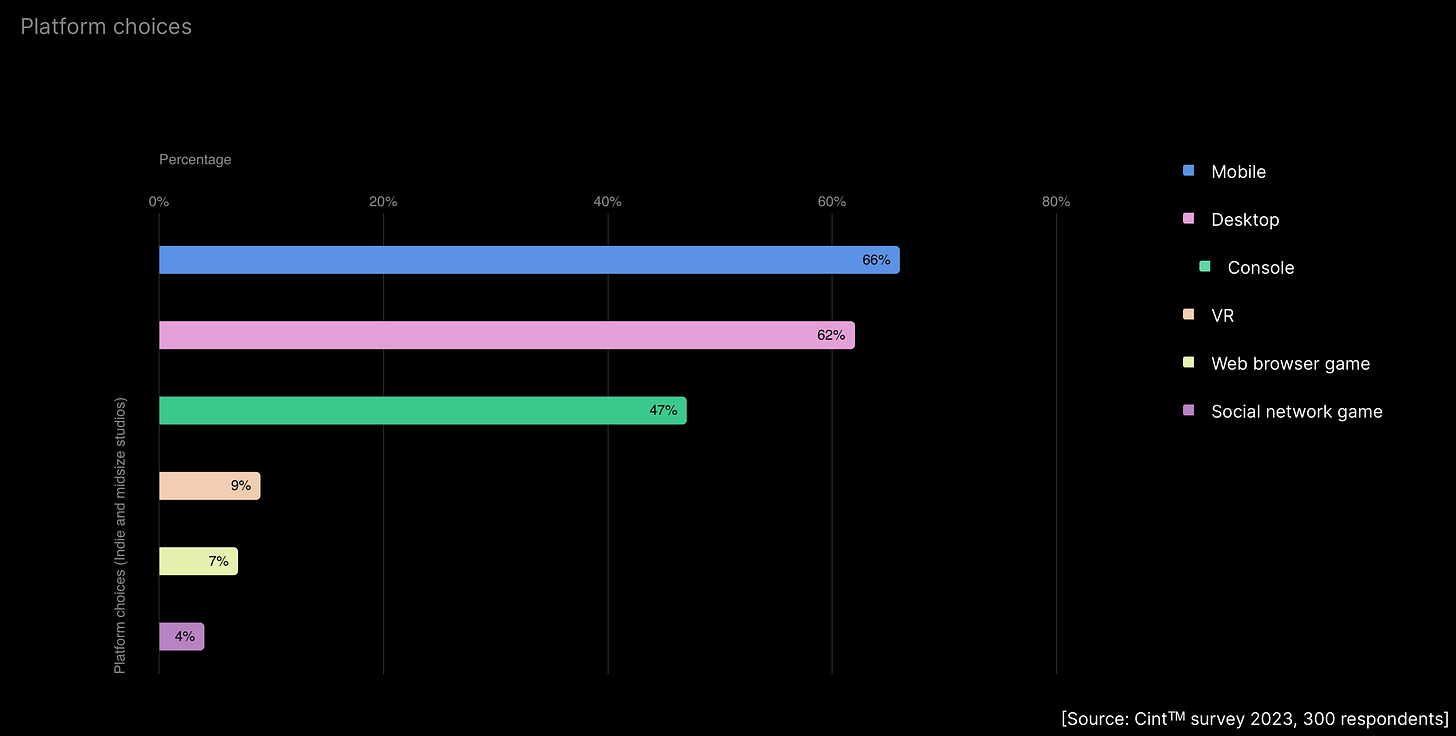
The primary platforms for studios with fewer than 50 employees are mobile (66%), PC (62%), and consoles (47%).
-
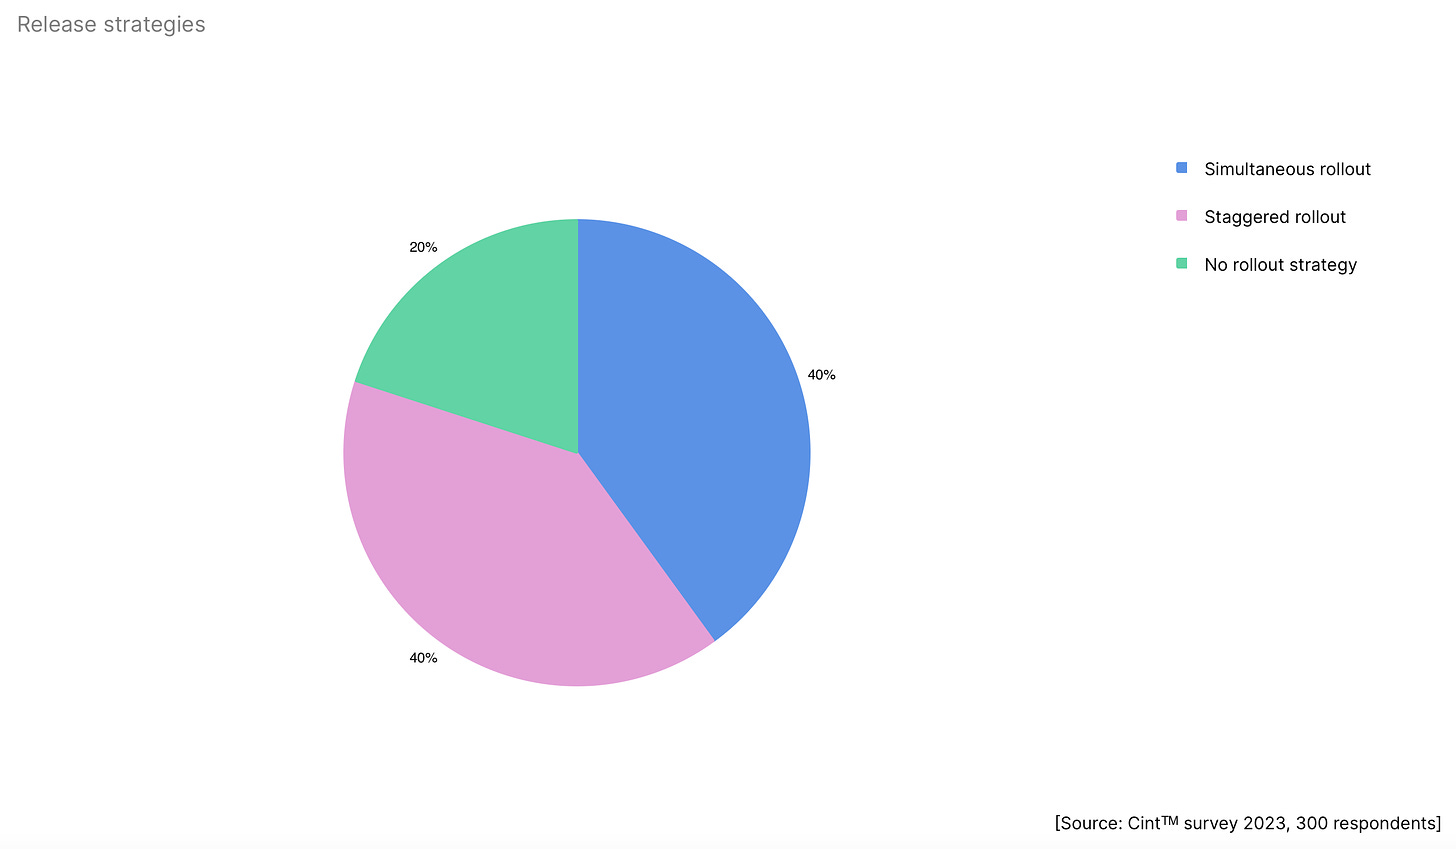
40% of studios release their projects on all platforms simultaneously; 40% do it gradually; and 20% have no specific strategy.
-
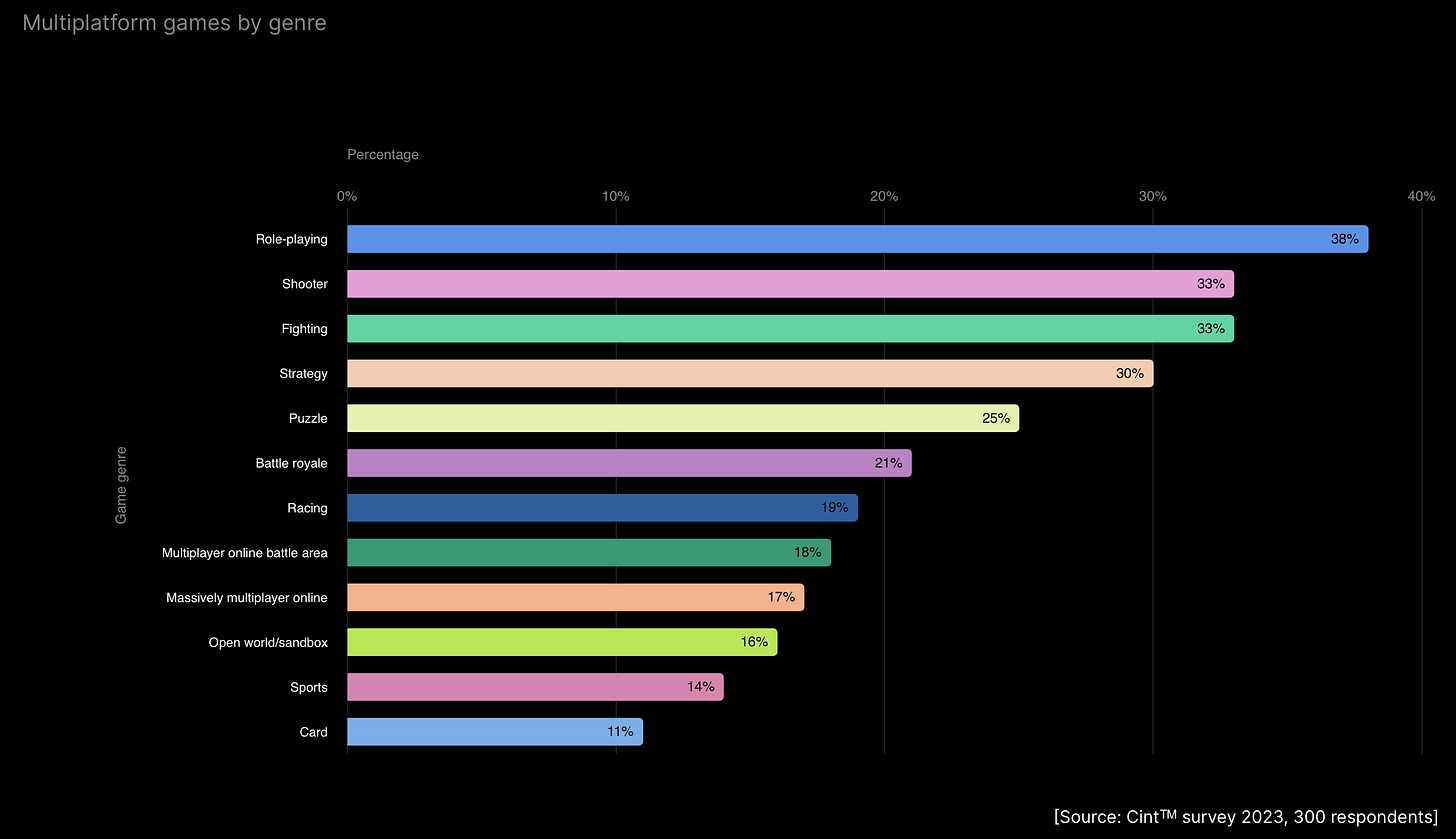
The most popular cross-platform genres are RPGs (38%), shooters (33%), fighting games (33%), and strategies (30%).
-
The larger the studio, the more likely they are to add cross-play. This is done by 95% of studios with over 50 employees.
Multiplayer Games
-
Mobile multiplayer games have a 40.2% higher MAU (Monthly Active Users) than single-player games.
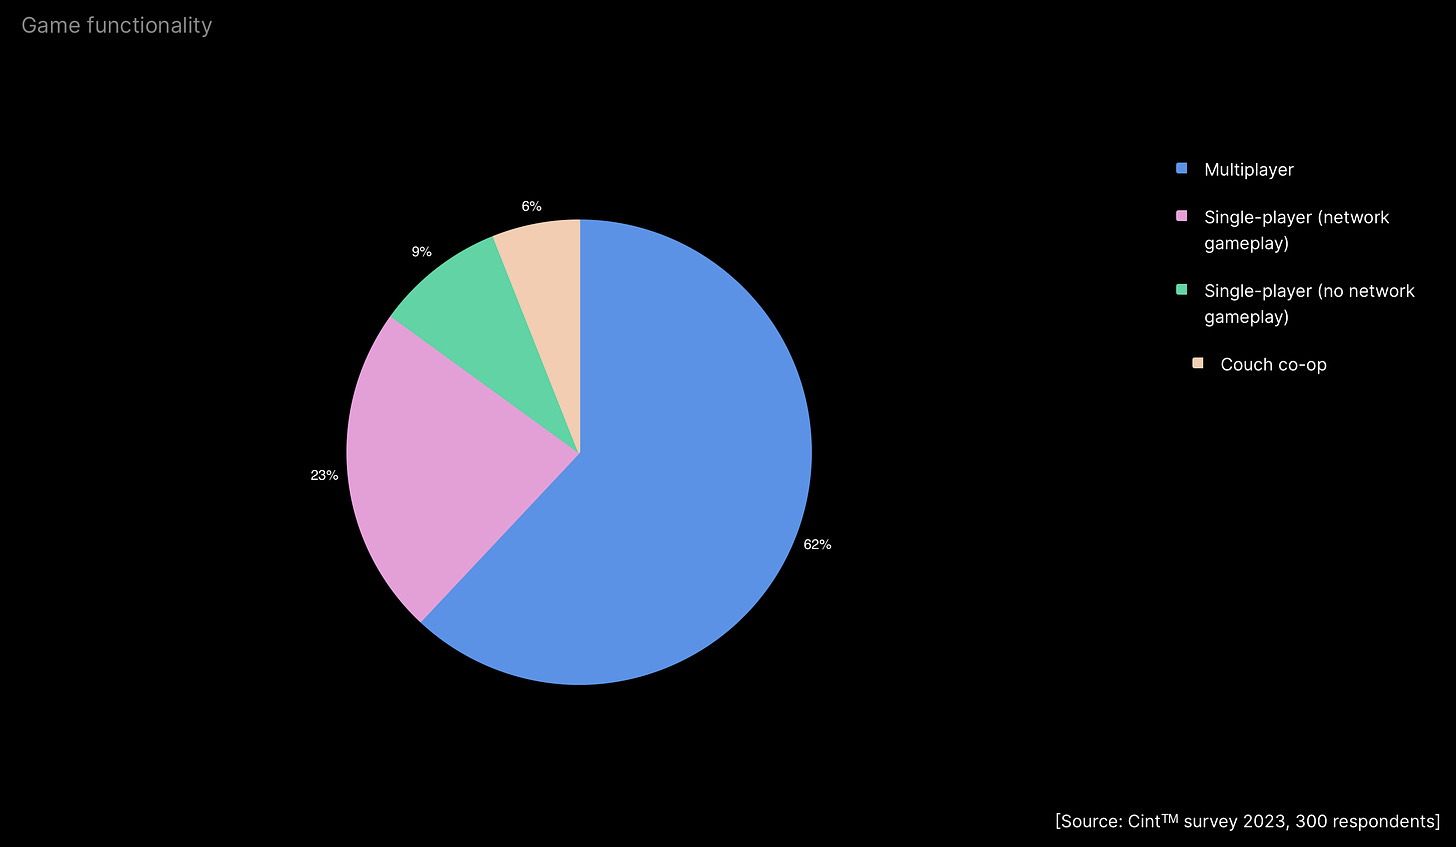
- 68% of surveyed studios reported working on a multiplayer project. 6% of these are working on projects with cooperative gameplay on a single screen.
-
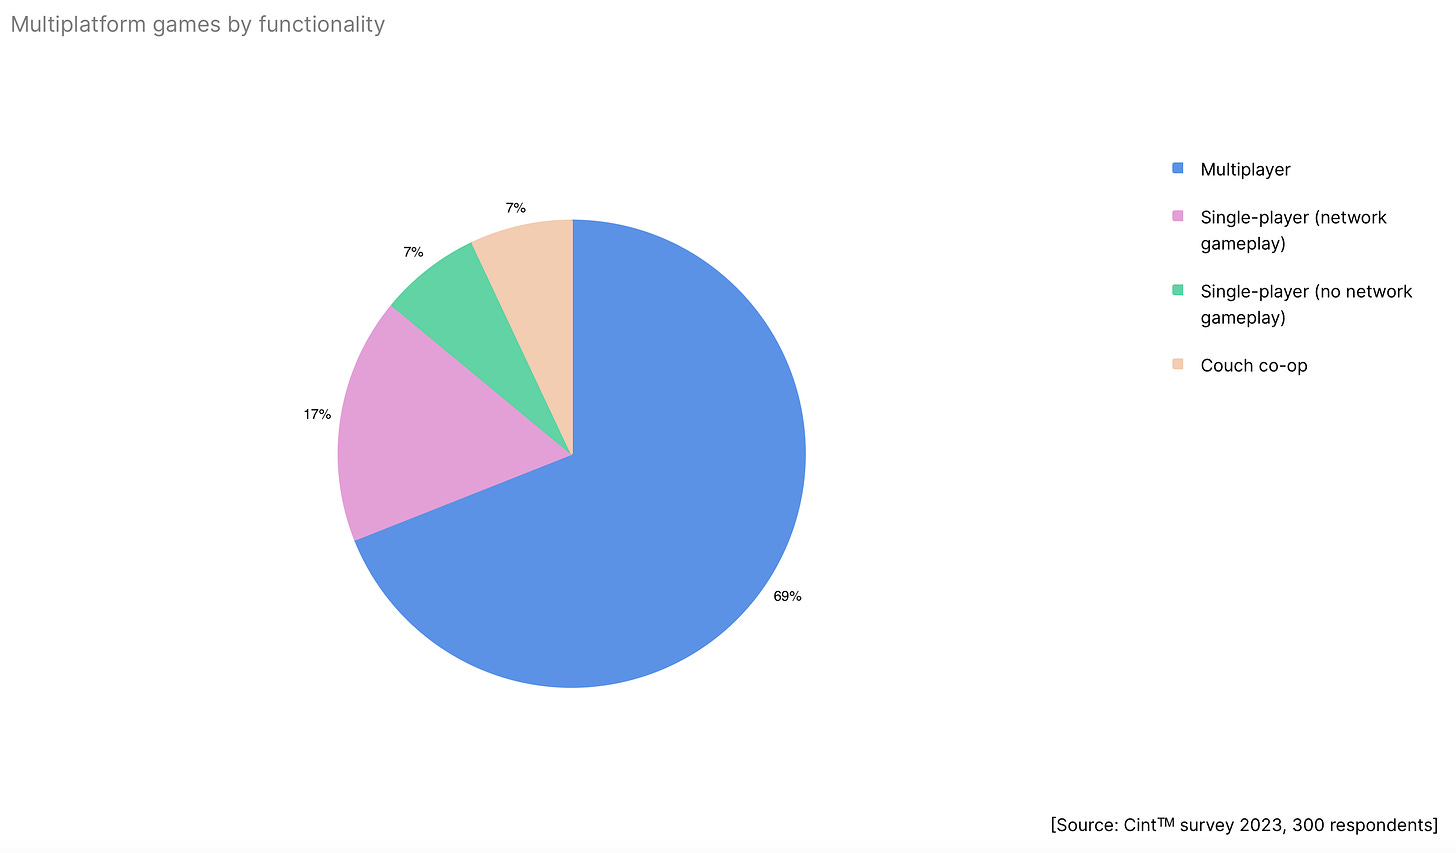
69% of cross-platform games are multiplayer. Another 7% offer local cooperative play.
-
62% of developers plan multiplayer functionality at the idea or pre-production stage. Interestingly, 5% of developers decide to add multiplayer just before the game's launch.
-
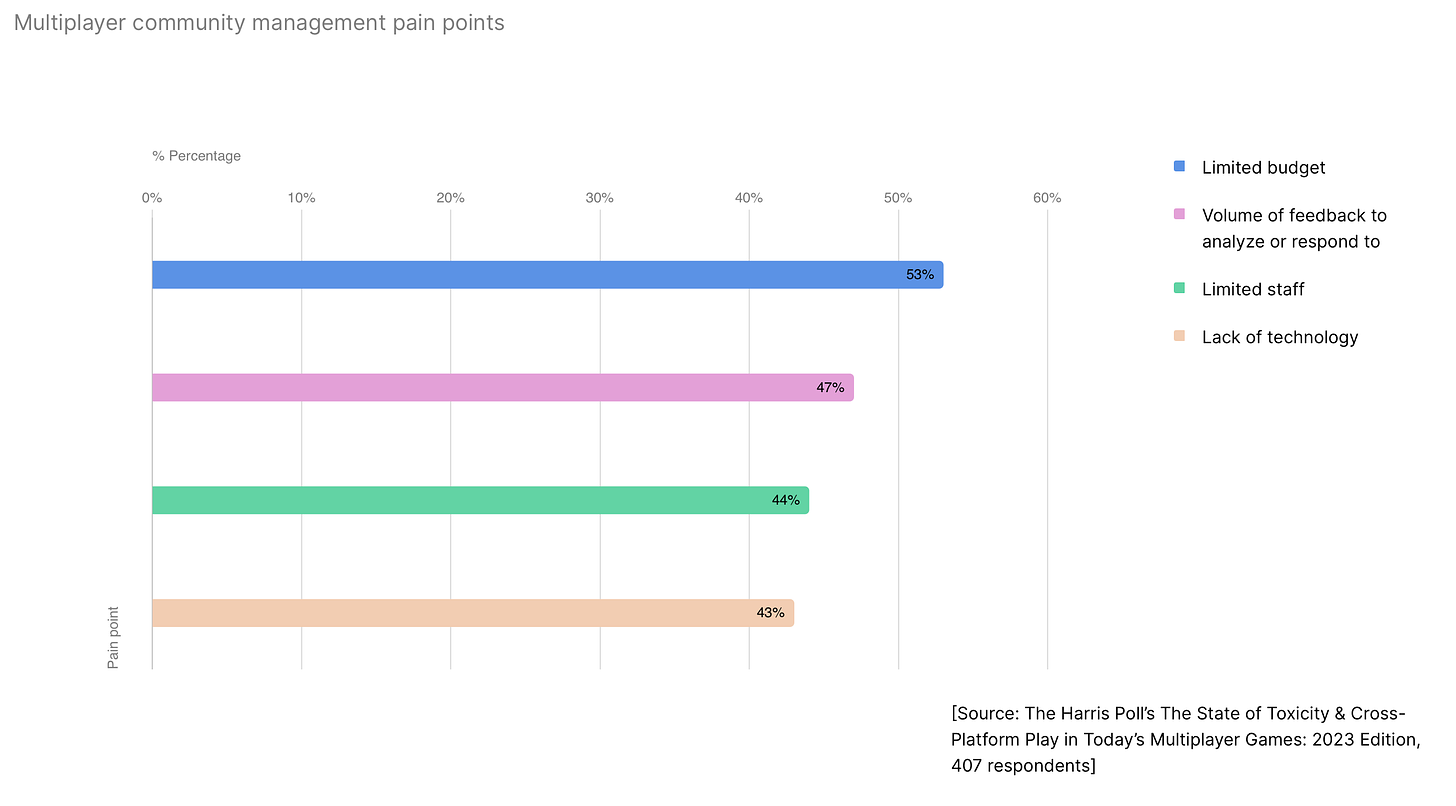
The main challenges in dealing with the audience of multiplayer projects are limited budgets (53%), managing a large amount of feedback (47%), staff limitations (44%), and lack of technology (43%).

-
Developers believe that users expect multiplayer games to allow free communication (38%), lack lag (37%), fair matchmaking (34%), and shared progress (31%).

- The revenue from multiplayer games continues to grow. In 2022, it was $24 billion; in 2023 - $26 billion, and in 2024, it is forecasted to reach $28 billion.
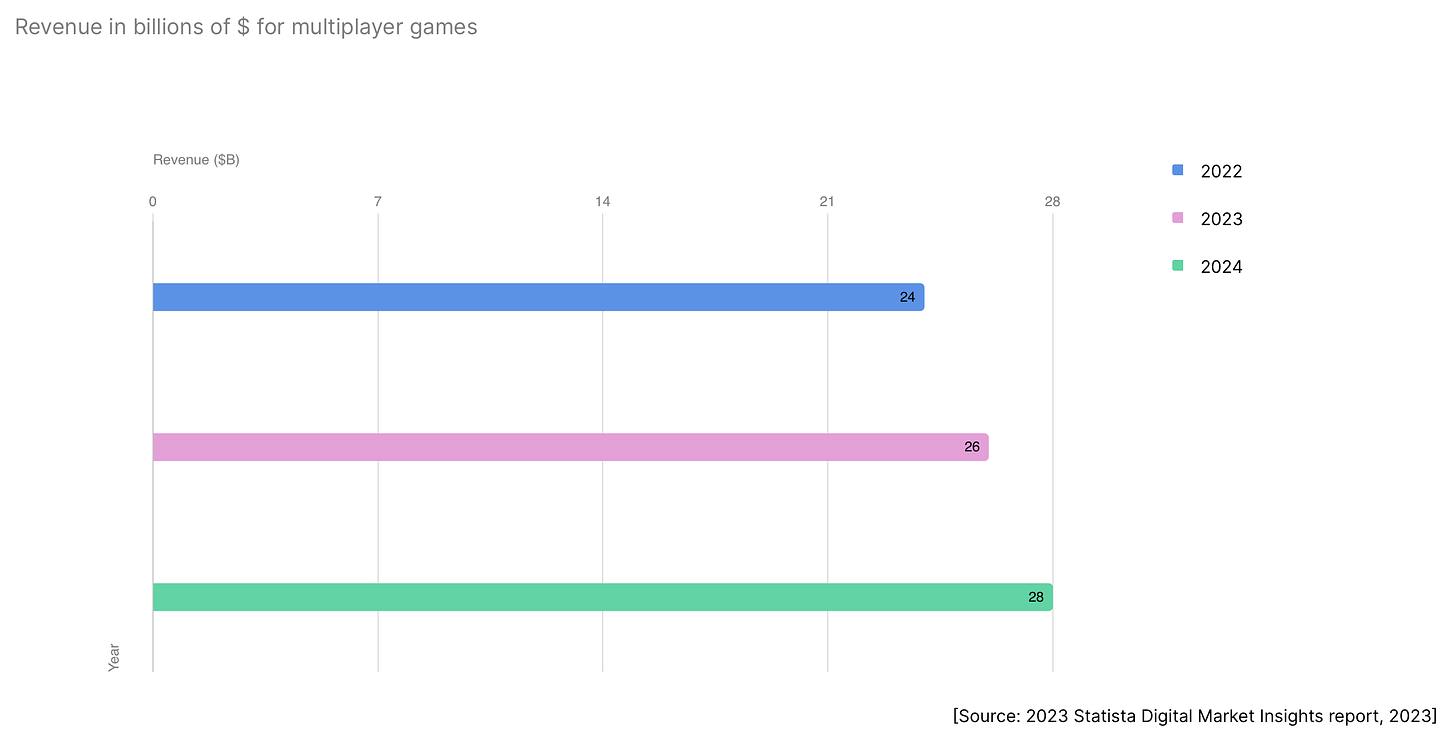
❗️Here, Unity refers to Statista data, but it's not very clear which specific games are included. Therefore, the figure is questionable.
Developers and their Live-Ops Approach
-
83% of developers understand how they will operate the game before releasing the first public versions.
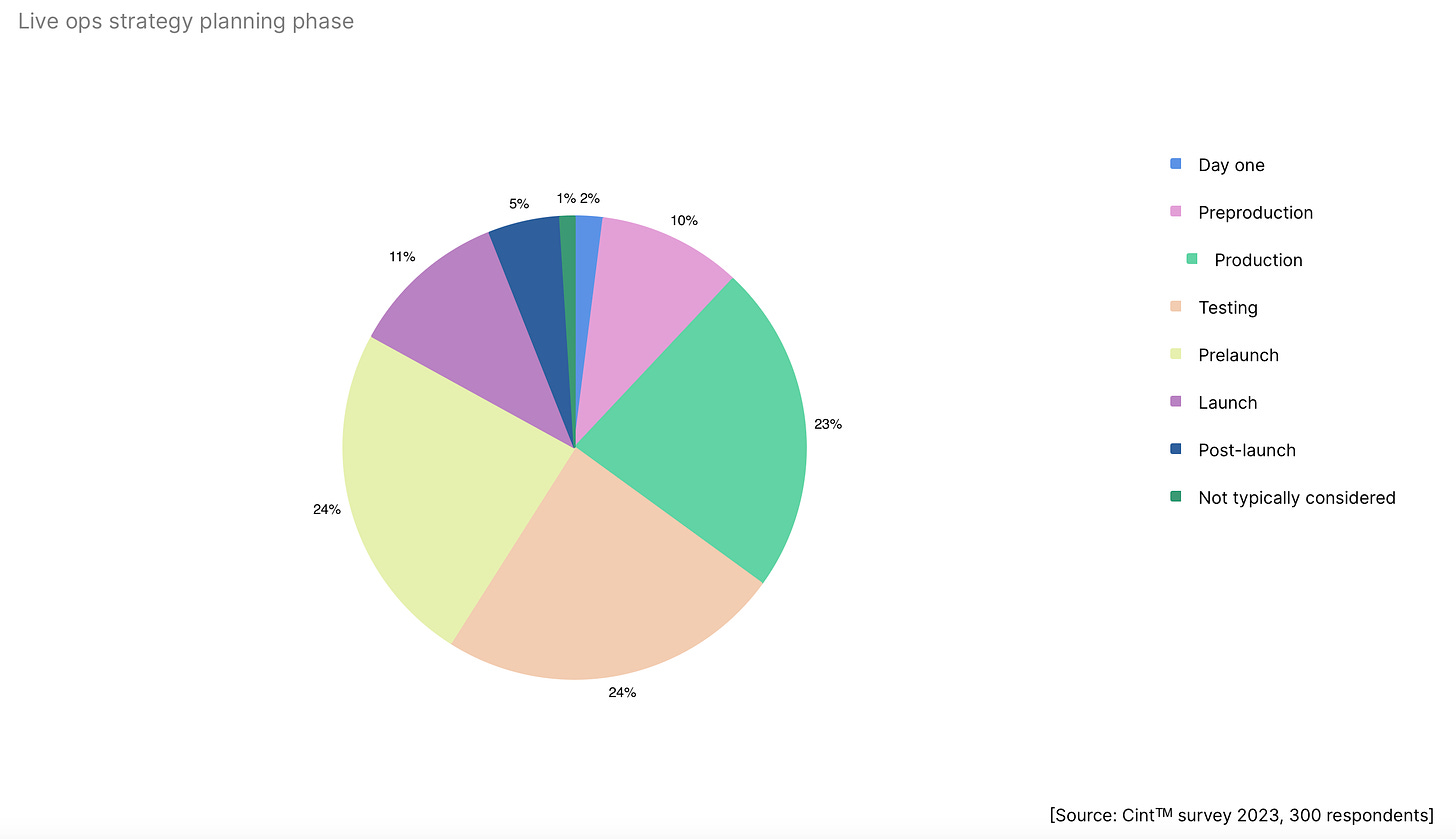
-
To cope with market challenges, studios try to enter new markets with existing projects (53%); constantly create new content (52%); seek opportunities to work more efficiently (50%); diversify their game portfolios (47%); focus on player retention (35%); and invest in monetization and user acquisition (26%).
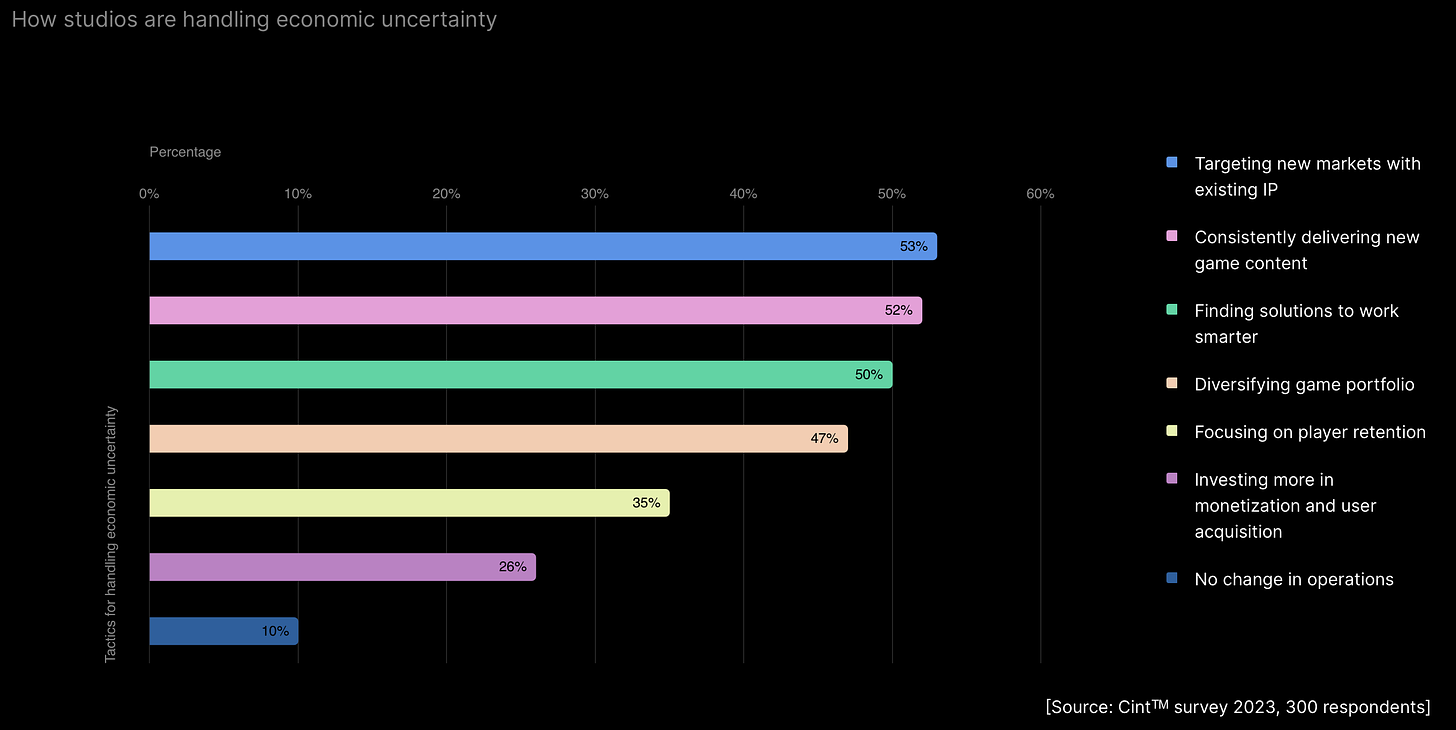
- 7% of games are supported for less than 6 months; 39% - from six months to a year; 49% - from one to two years; 5% - from three to five years.
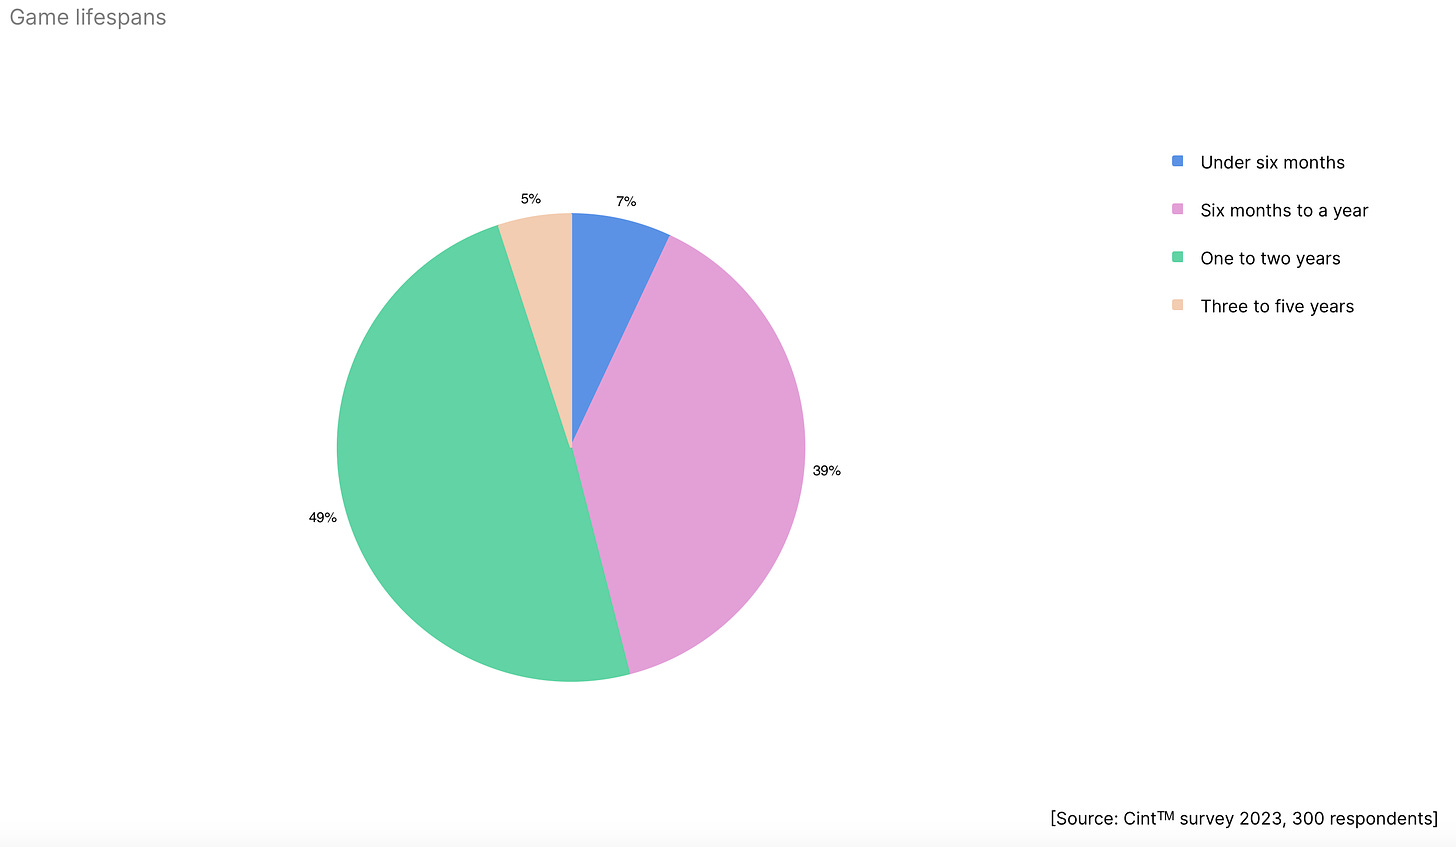
- Users pay attention to toxic behavior in games. 46% of players block toxic users, and 34% simply leave the game.
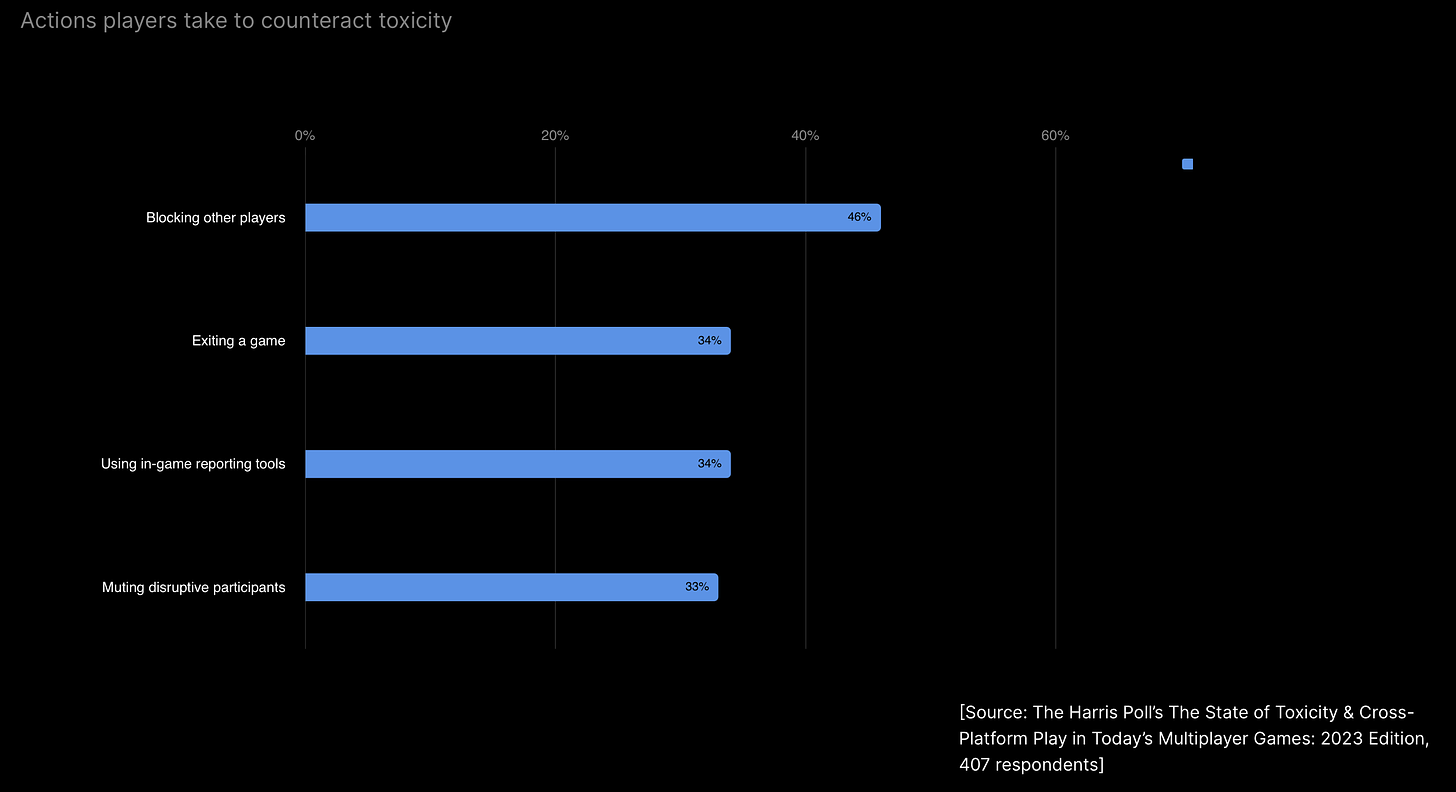
- Developers consider daily missions and rewards (67%), achievements and challenges (59%), Rewarded ads and in-app purchases (40%), leaderboards (33%), and PvP (31%) as the most effective mechanics for increasing retention.
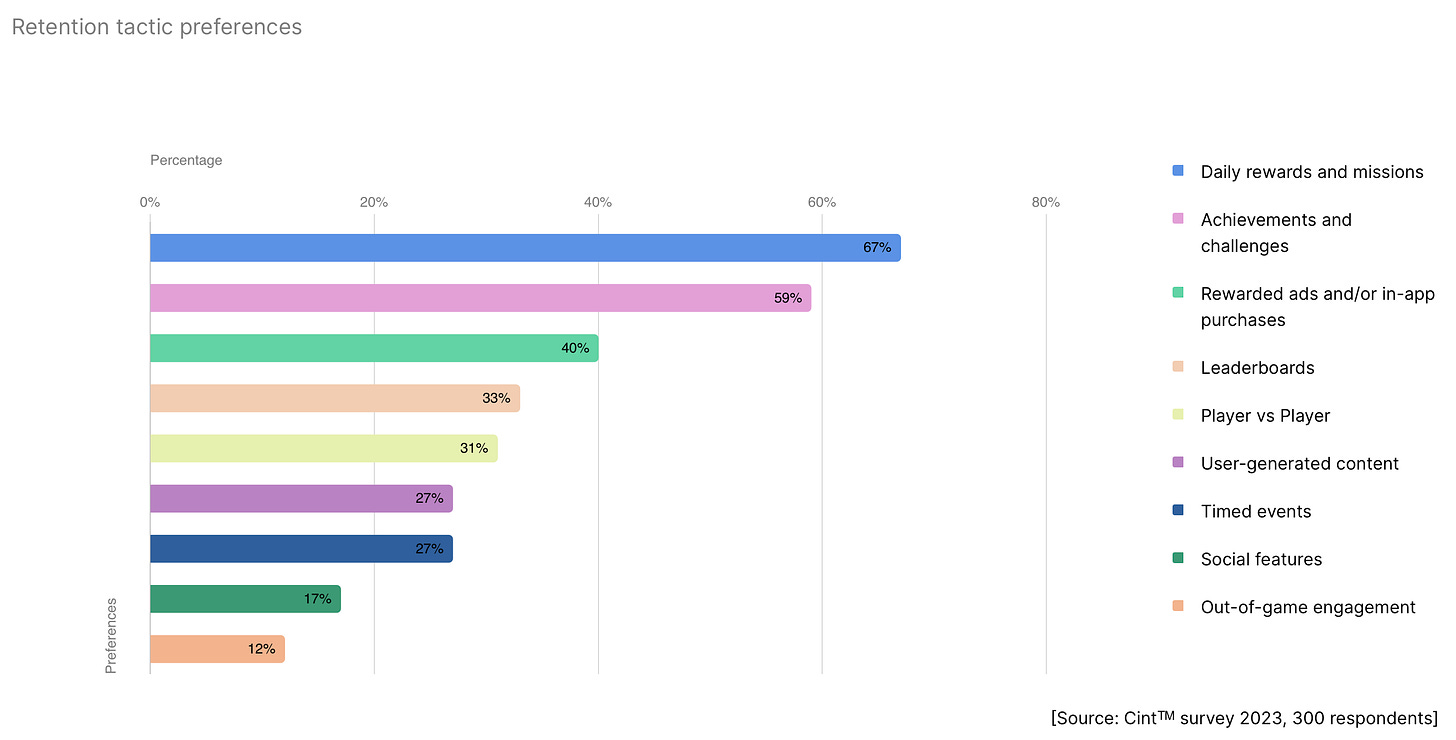
❗️Again, it's not very clear how the presence of Rewarded Ads and in-game purchases can directly impact retention.
-
39% of developers are considering adding user-generated content to their games; 27% have already done so. 34% do not plan to add player content.
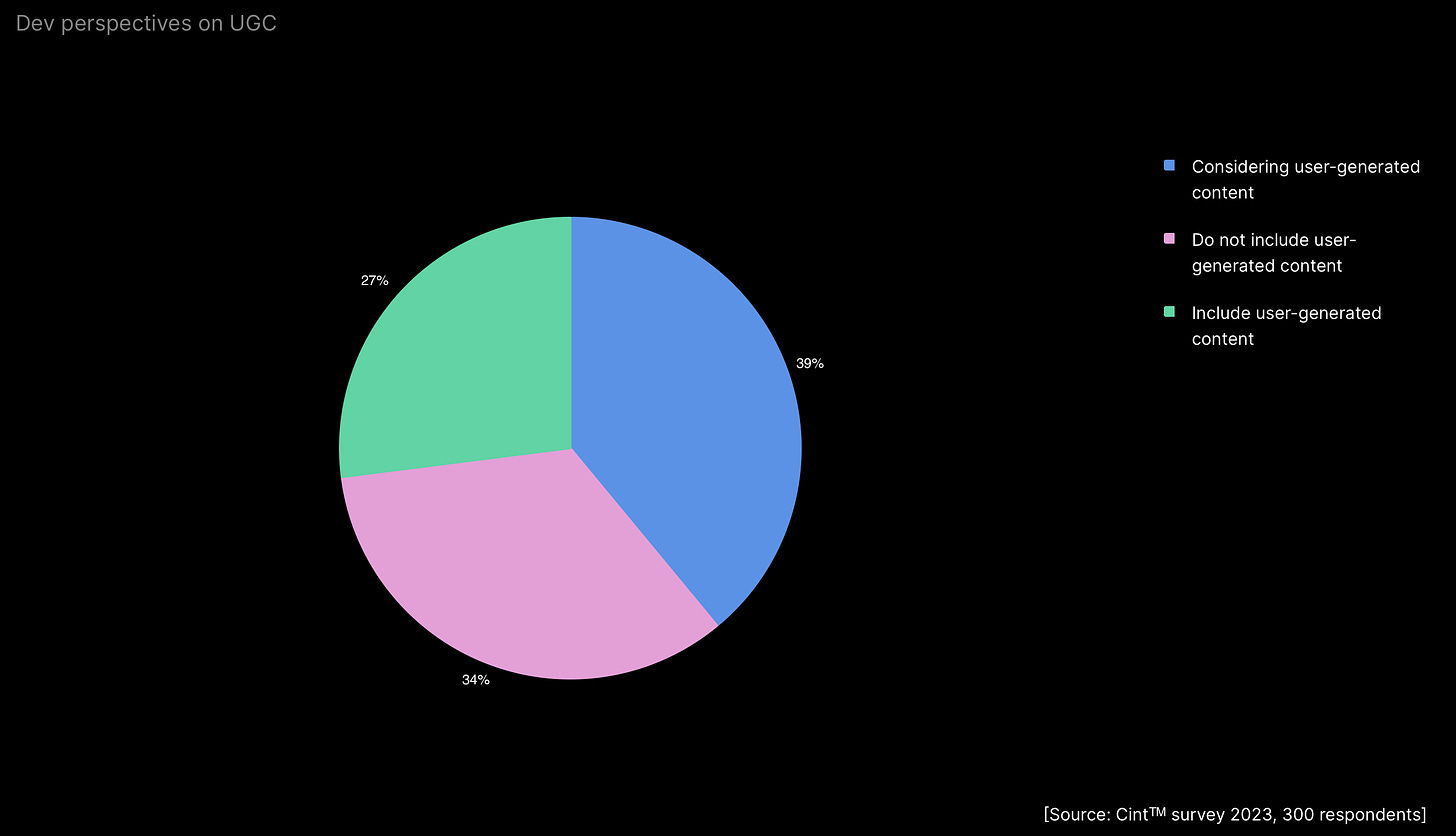
Mistplay: Paying Users in Mobile Games in 2024

General Behavioral Patterns
-
39% of all paying users make purchases only in one game. Half spend in 2-3 games.
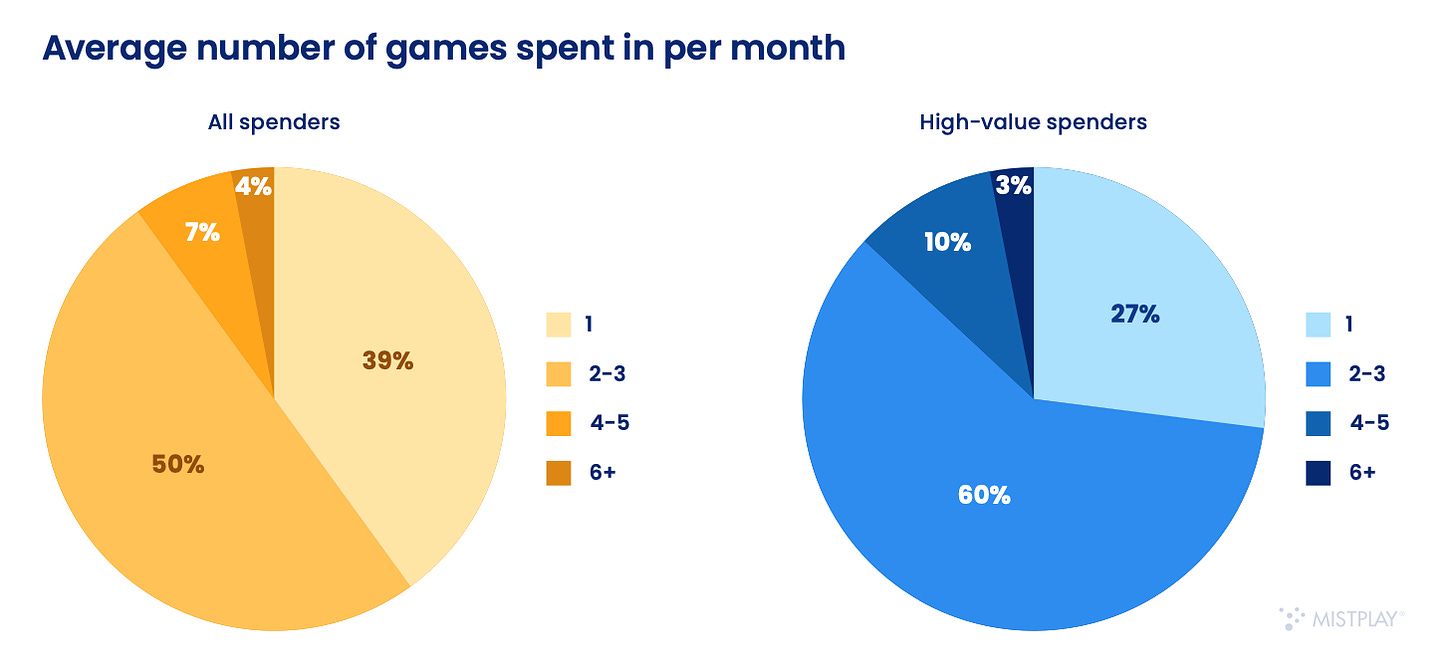
- 37% of all paying users, on average, make 1-2 purchases per month.
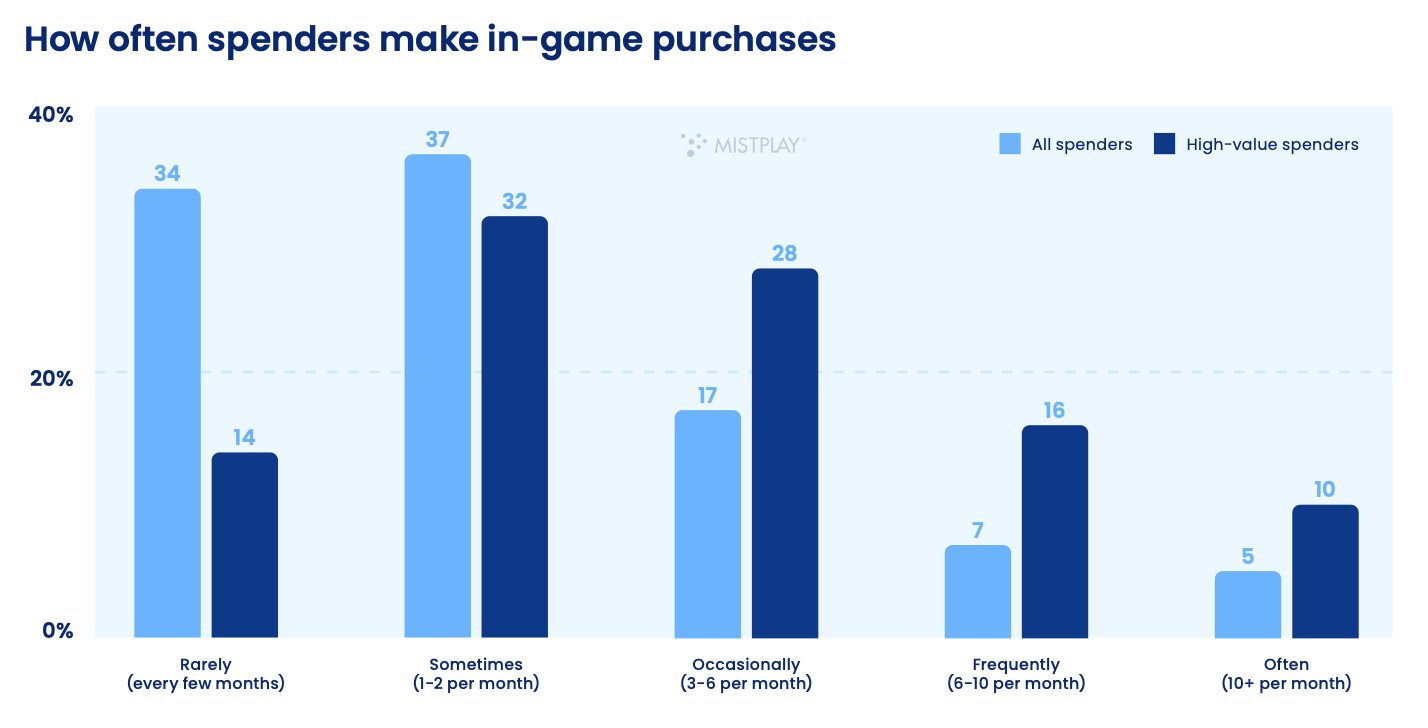
- 41% of the most valuable paying users plan to reduce their spending on games in 2024.
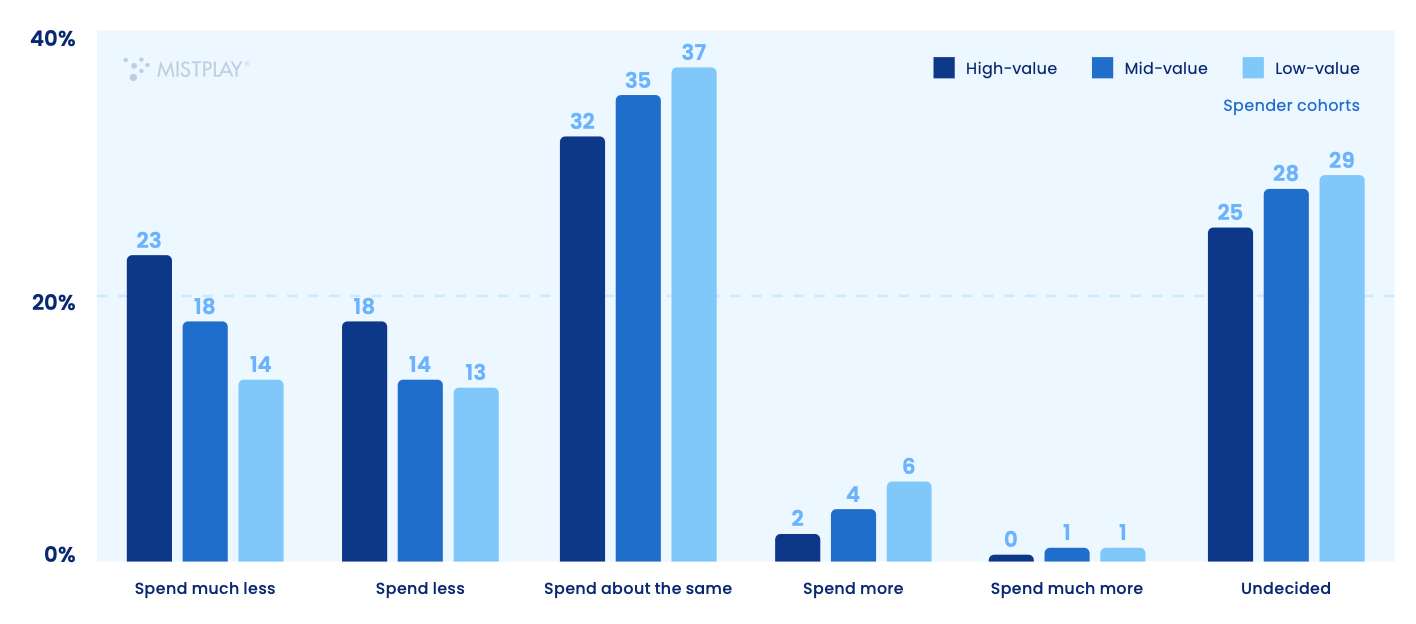
- The most valuable payers, on average, make significantly more purchases than regular paying users.
Acquisition of Paying Users
-
20% of paying users pay attention to advertising only when they are looking for a new project. However, it seems that users still actively engage with ads.
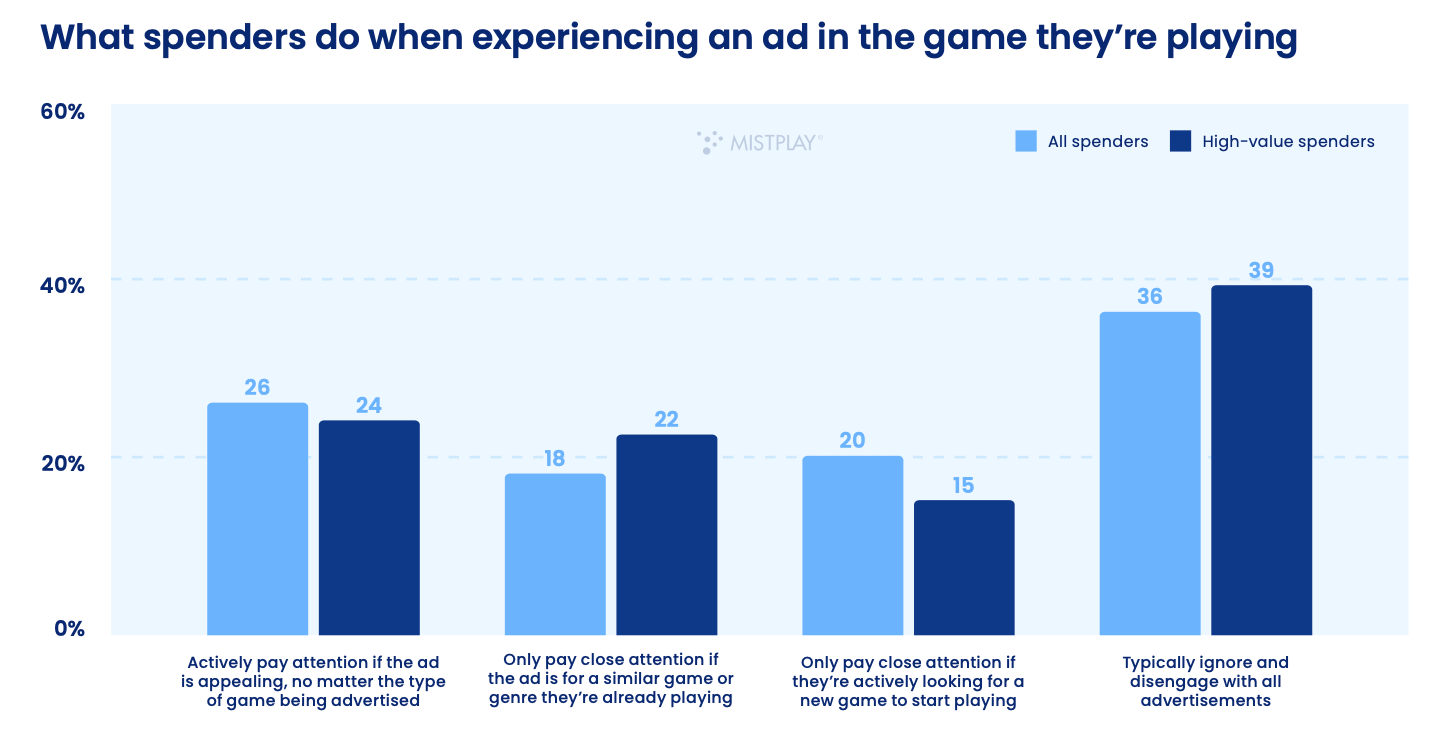
- On average, 36% of paying users need to see ads for several days to install a new game. For 22%, it will take weeks; for 13%, a month or more.
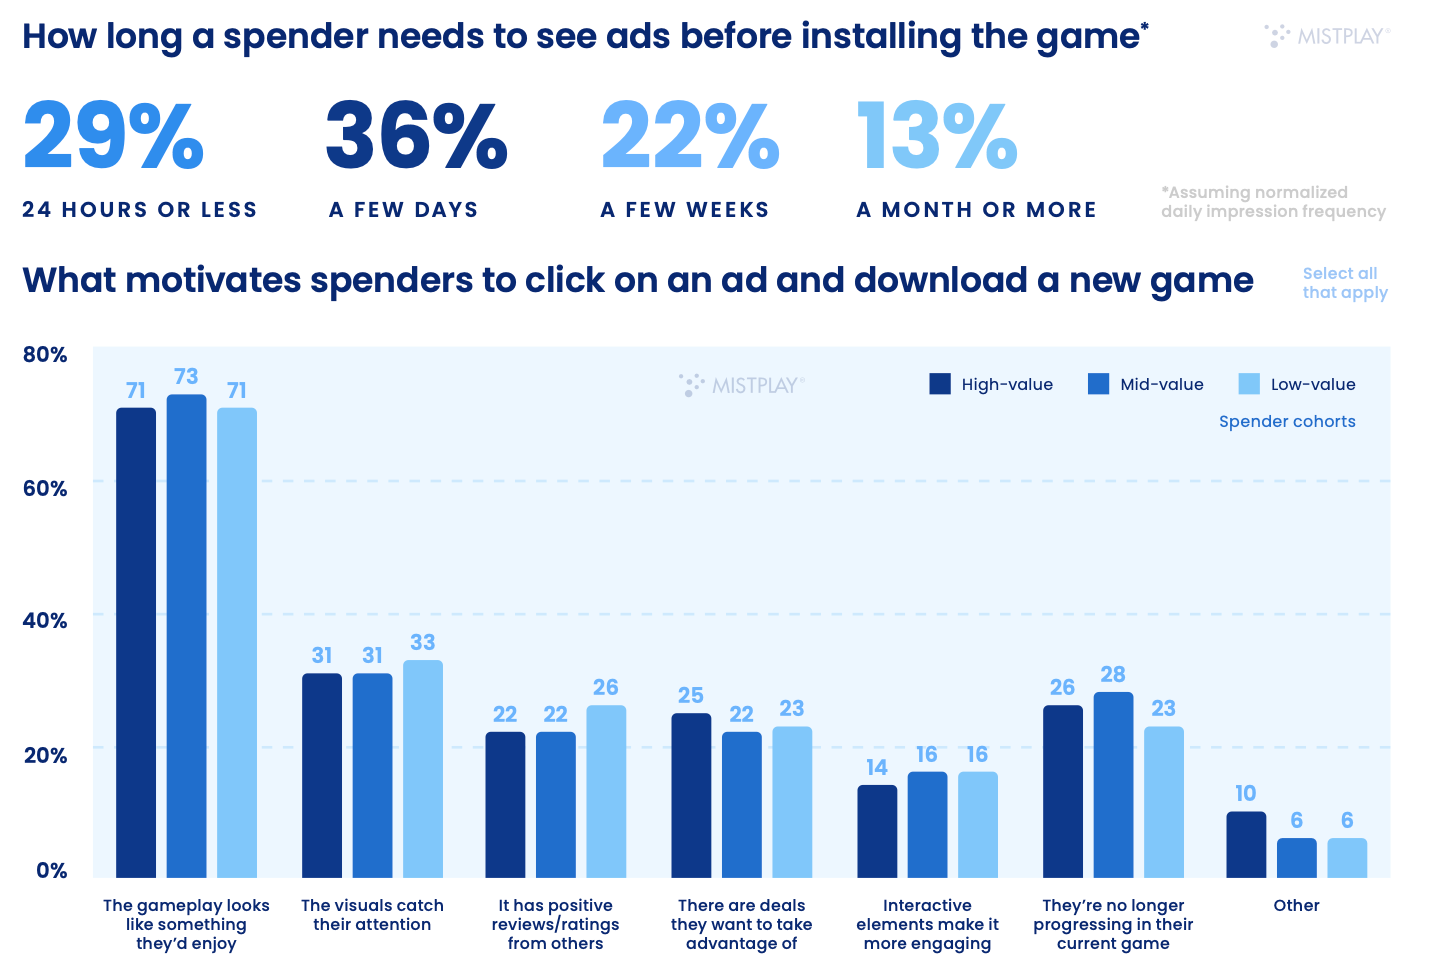
- Interesting gameplay is the main reason why a paying user will try a new project.
-
Facebook, YouTube, TikTok, and Instagram are the main social networks where paying users learn about new games.
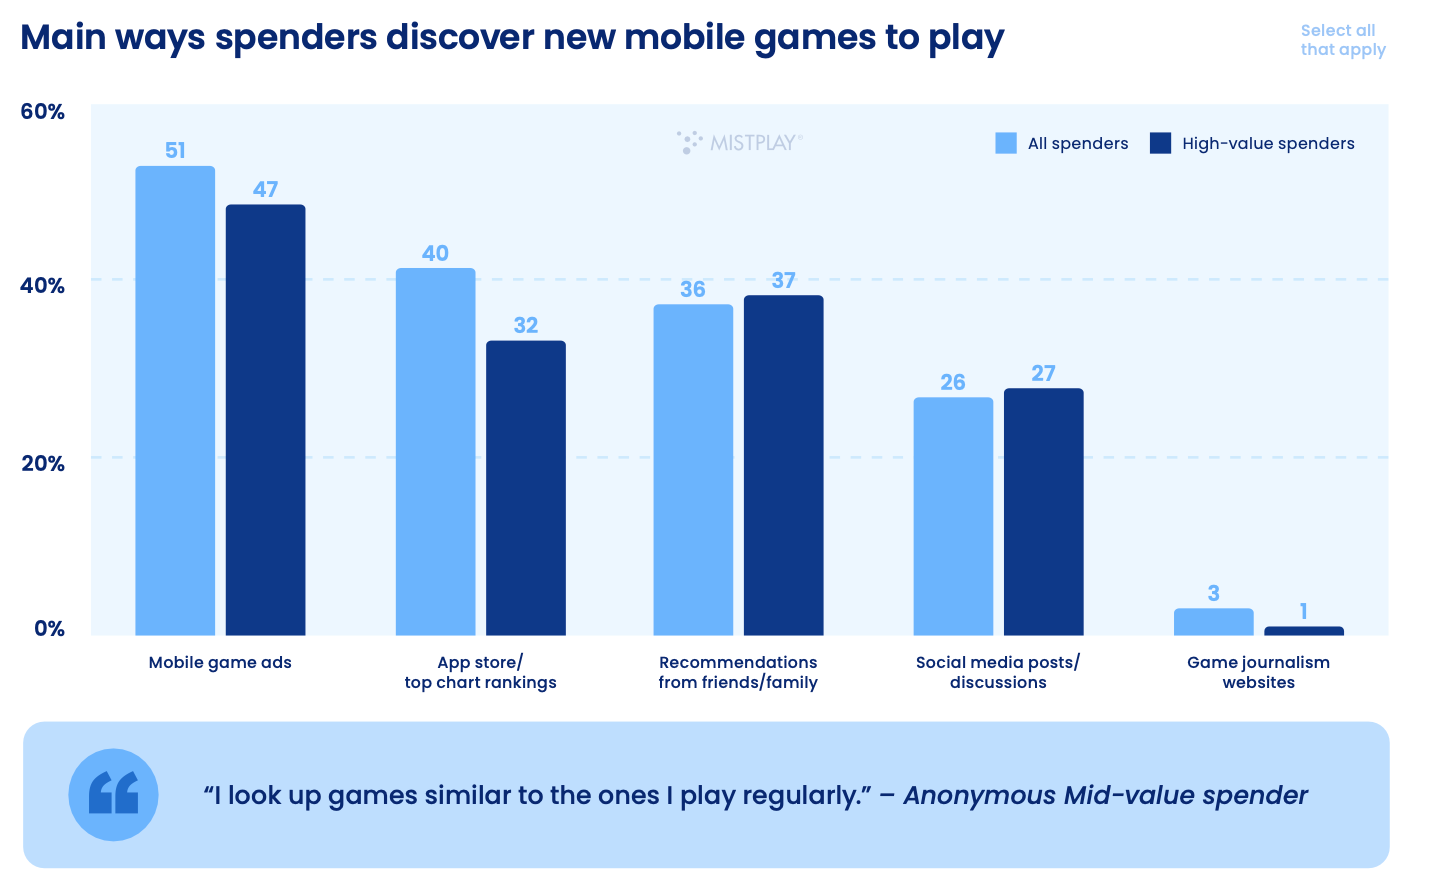
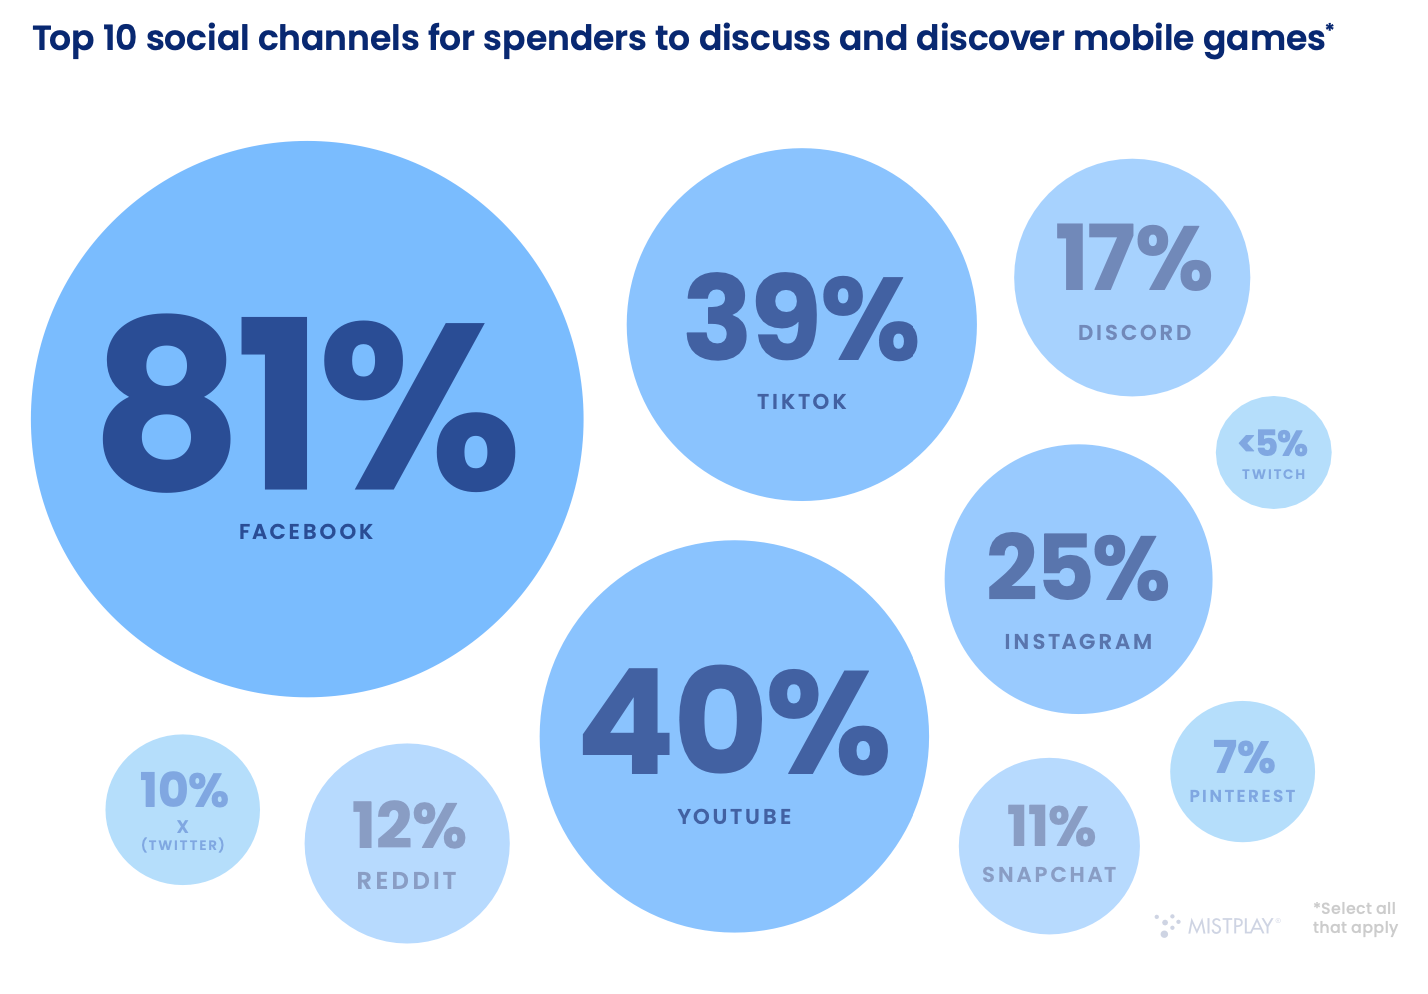
- 80% of paying players cited relaxation as the main motivator for playing.
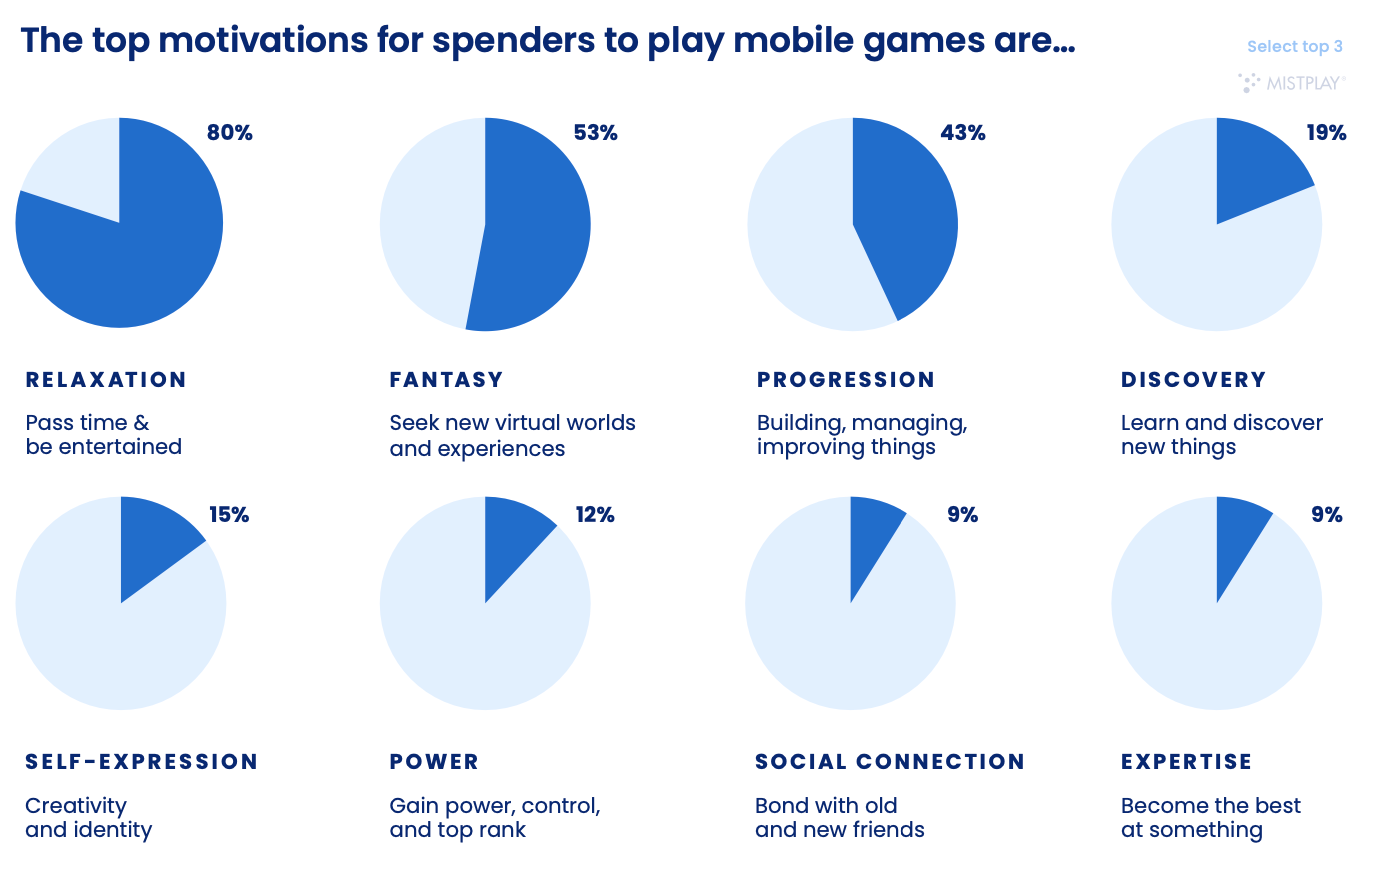
- 73% of paying users installed at least one game through a referral program last year.
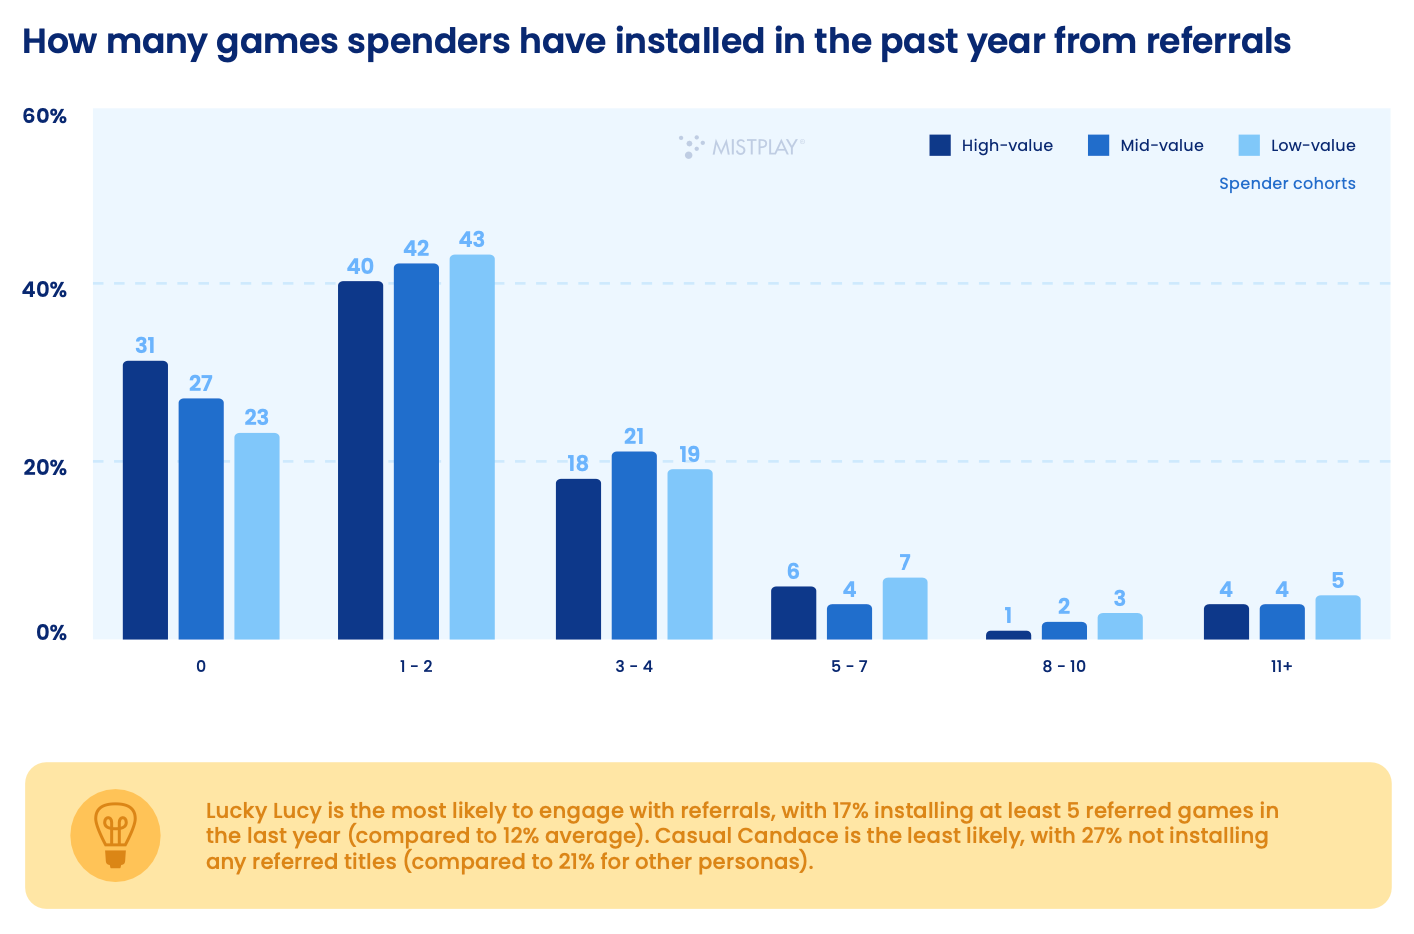
Behavior of Paying Players
-
79% of mobile players make their first purchase within the first month.
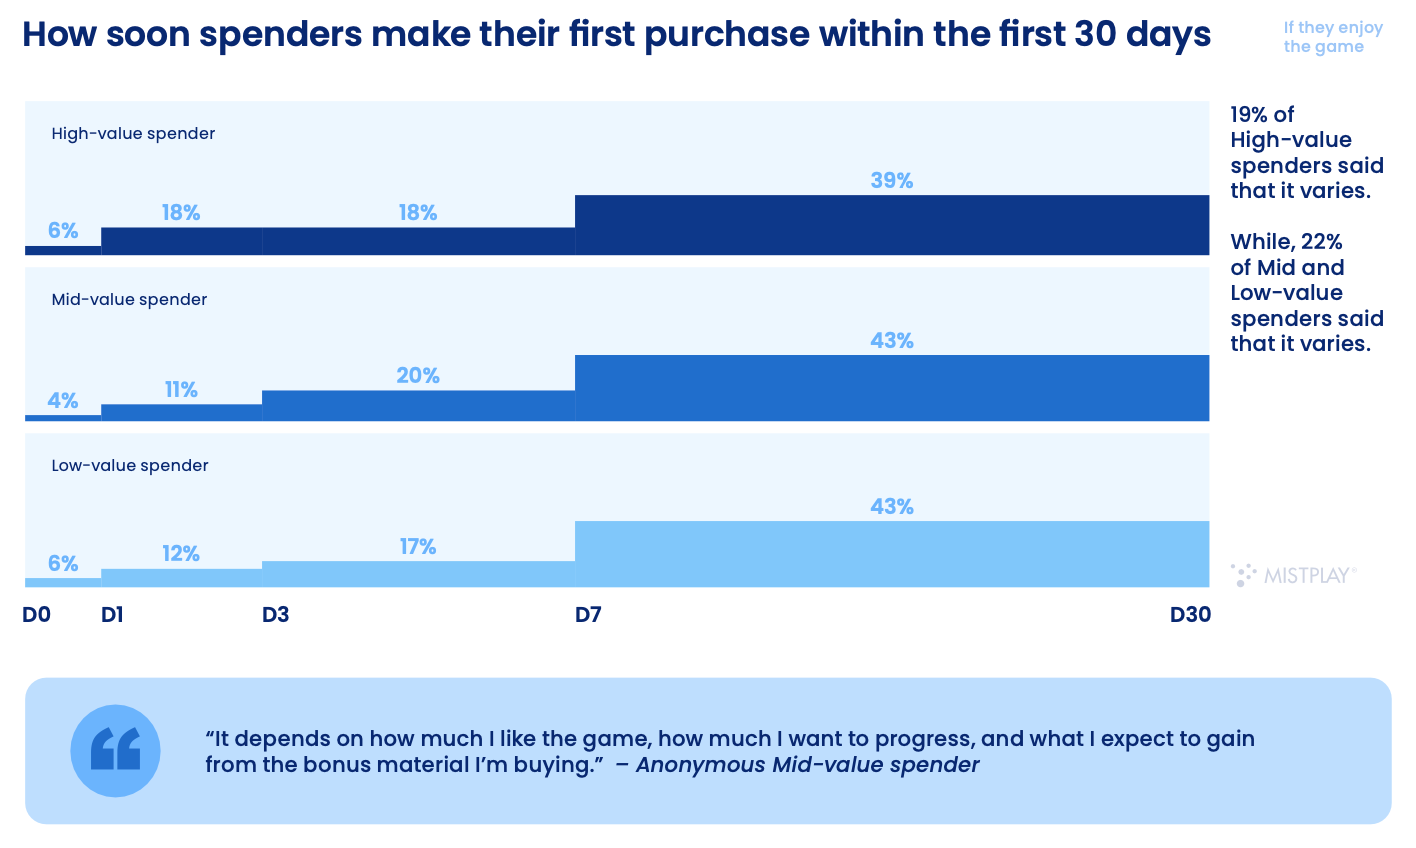
- Only 8% of paying users buy goods whenever they want. 33% wait for discounts; 25% make purchases only if they can't progress further in the game.
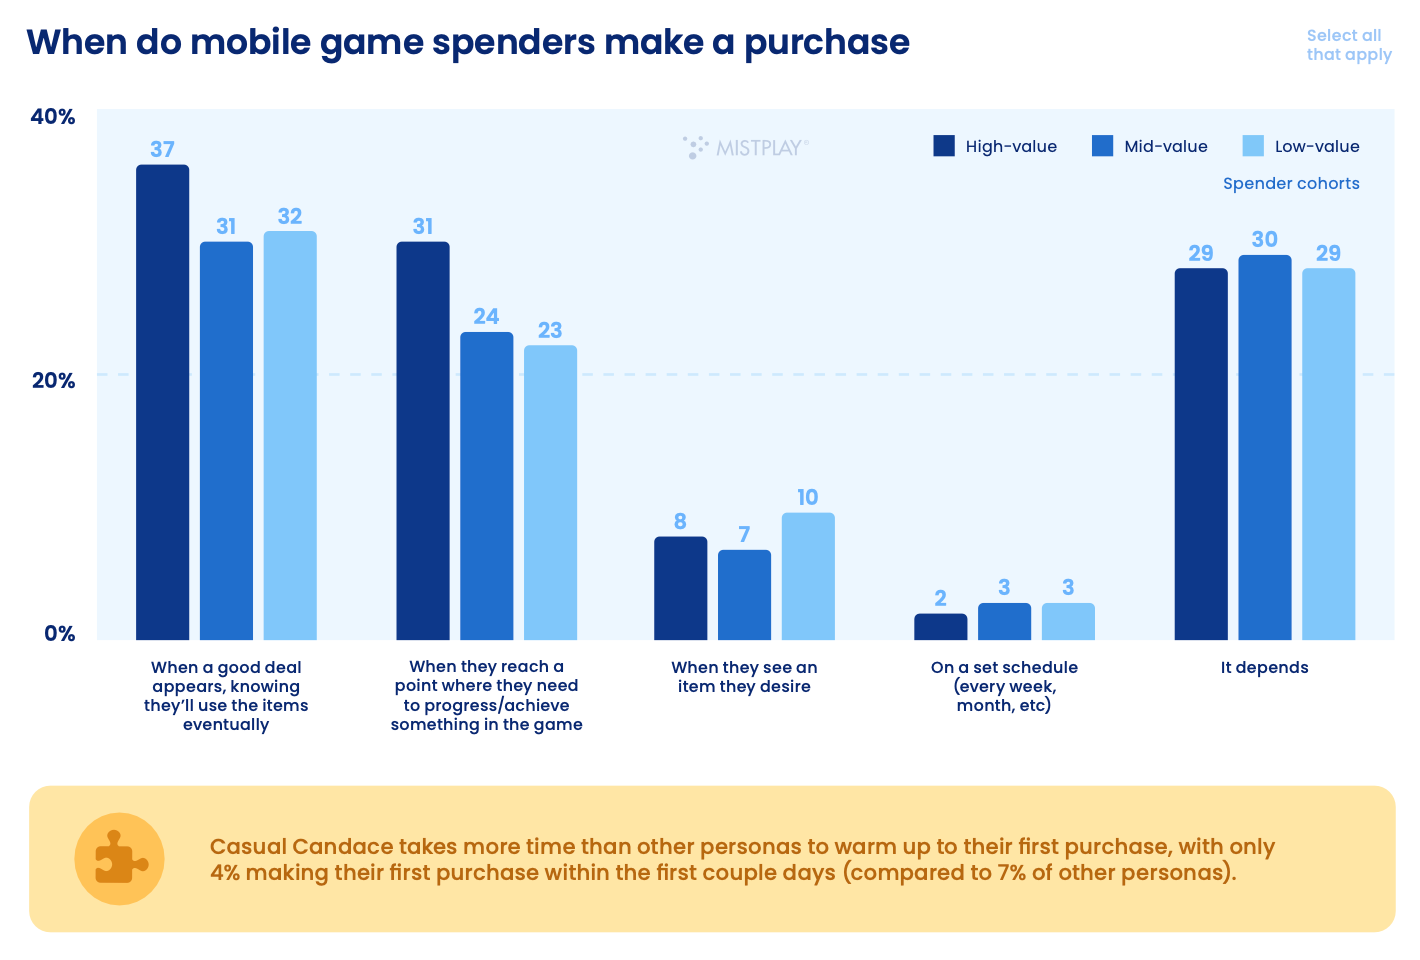
- The main motivators for making purchases are progression (54%) and personal enjoyment (44%).
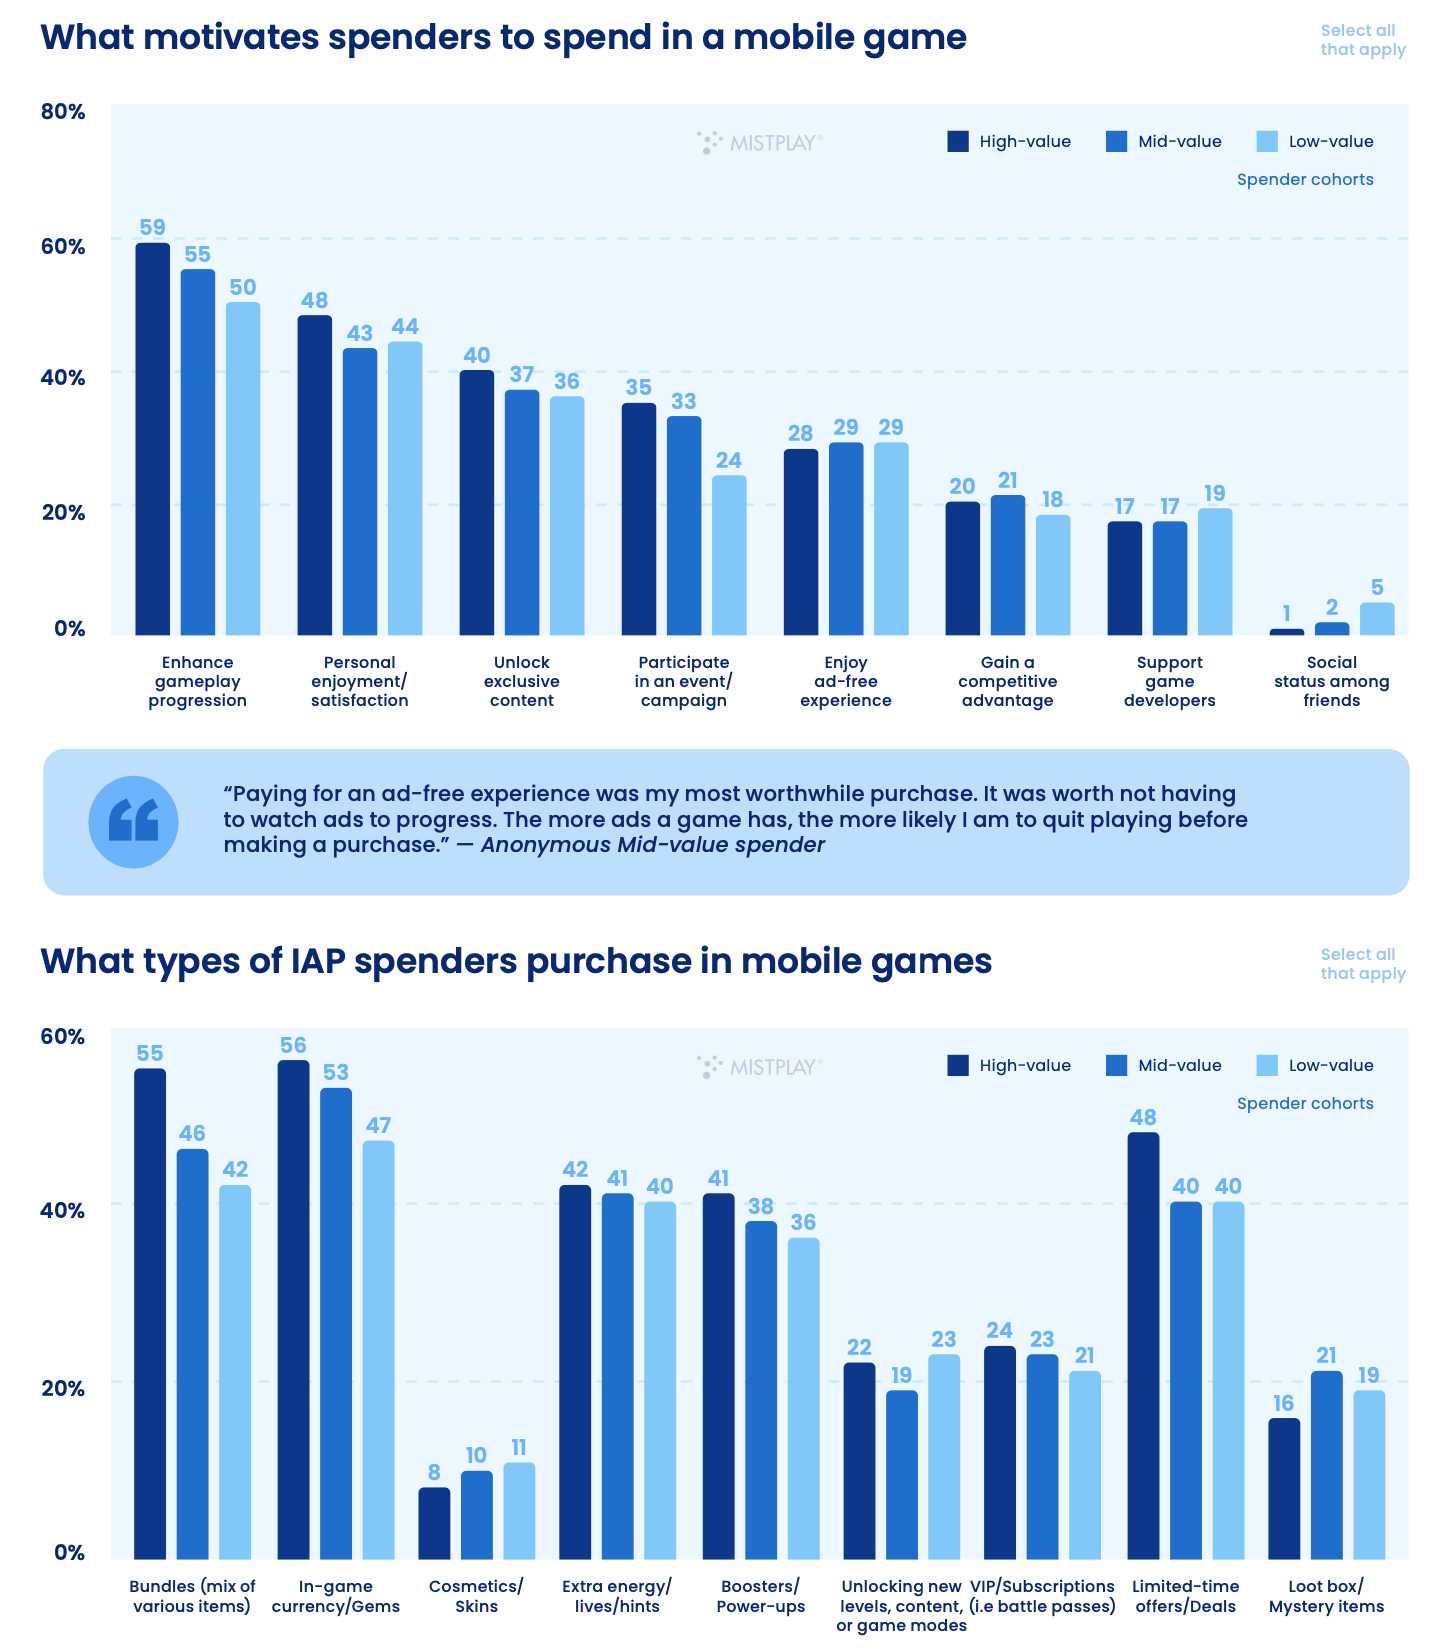
- Personalized offers increase spending for 40% of paying users.
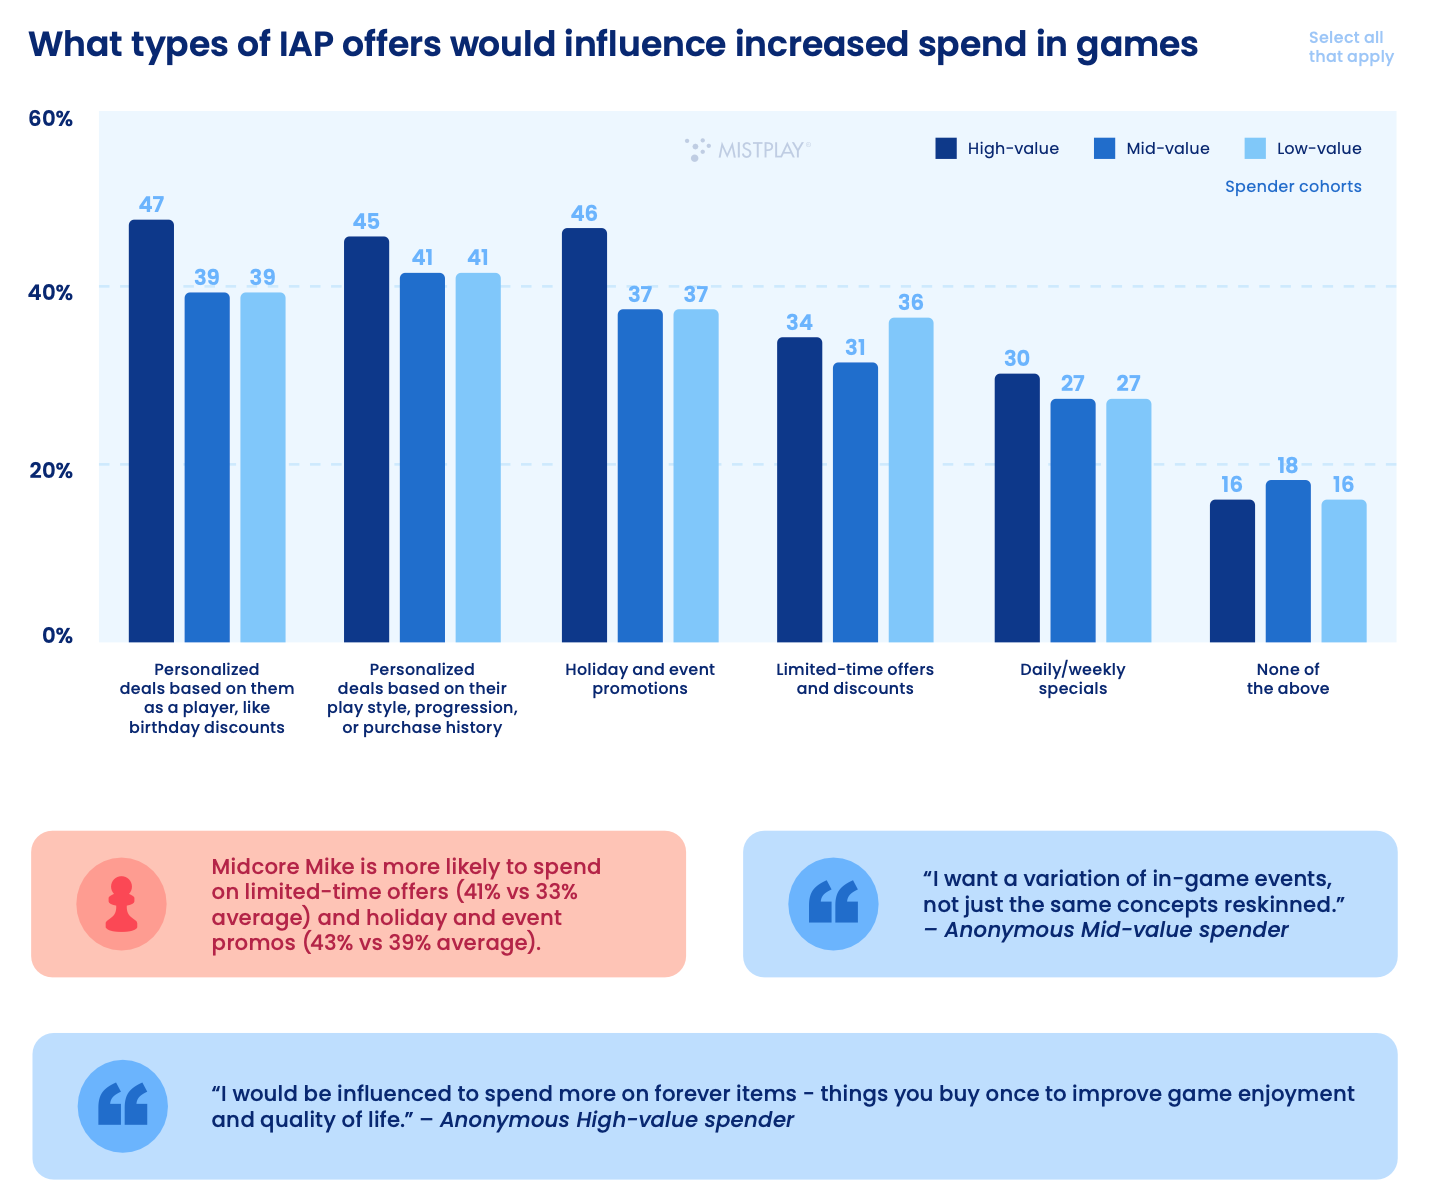
Engagement of Paying Users
-
In-game promos (39%); email (25%); and social media (18%) are the main channels for notifying players about promotions.
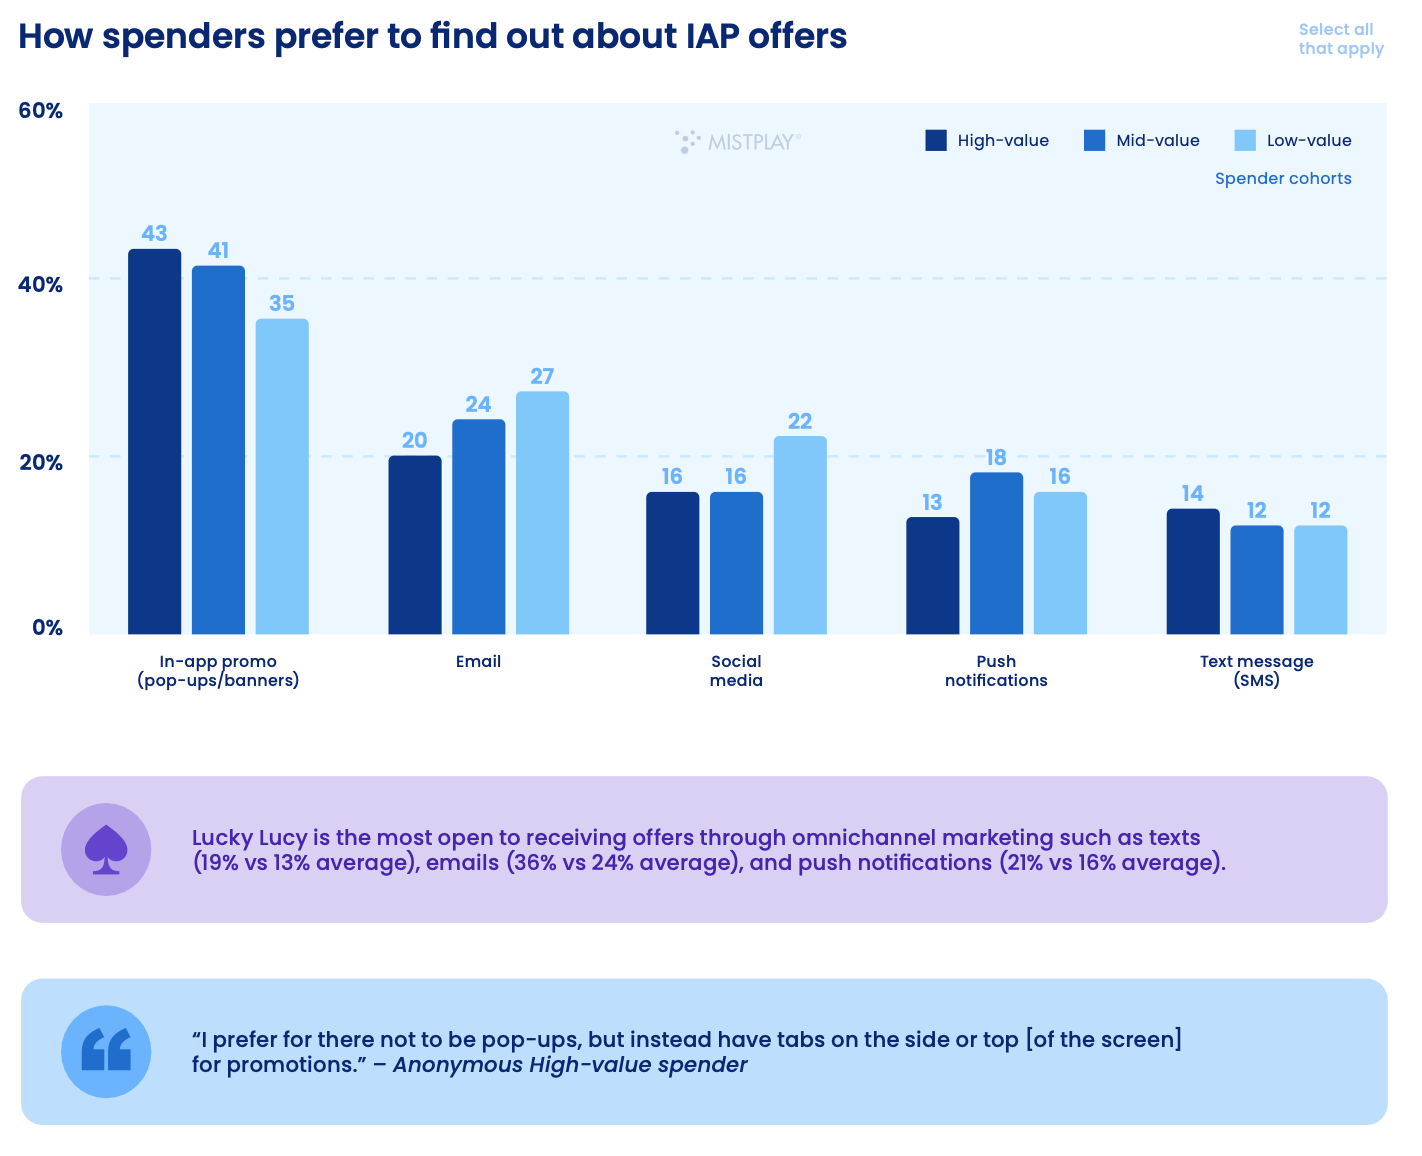
- Approximately 60% of the highest-paying users noted that they would like to receive some additional rewards for their spending. They are interested in some loyalty programs.
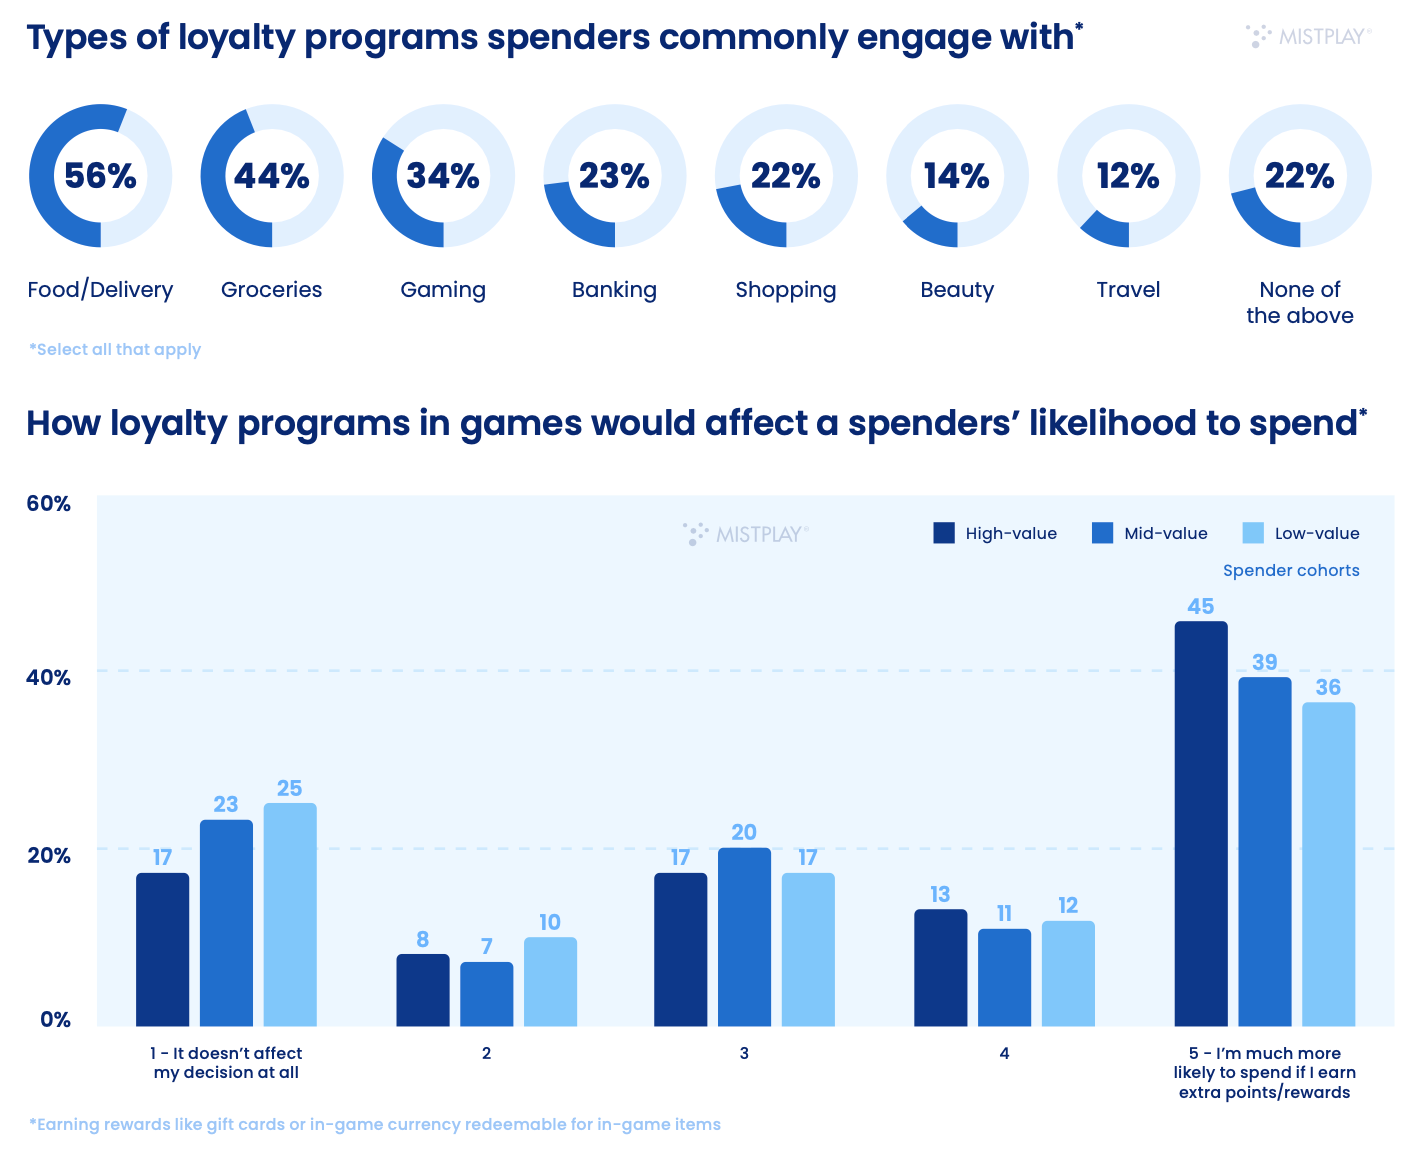
- 27% of paying users noted that purchases negatively affected their gaming experience. However, for most, the experience is positive.
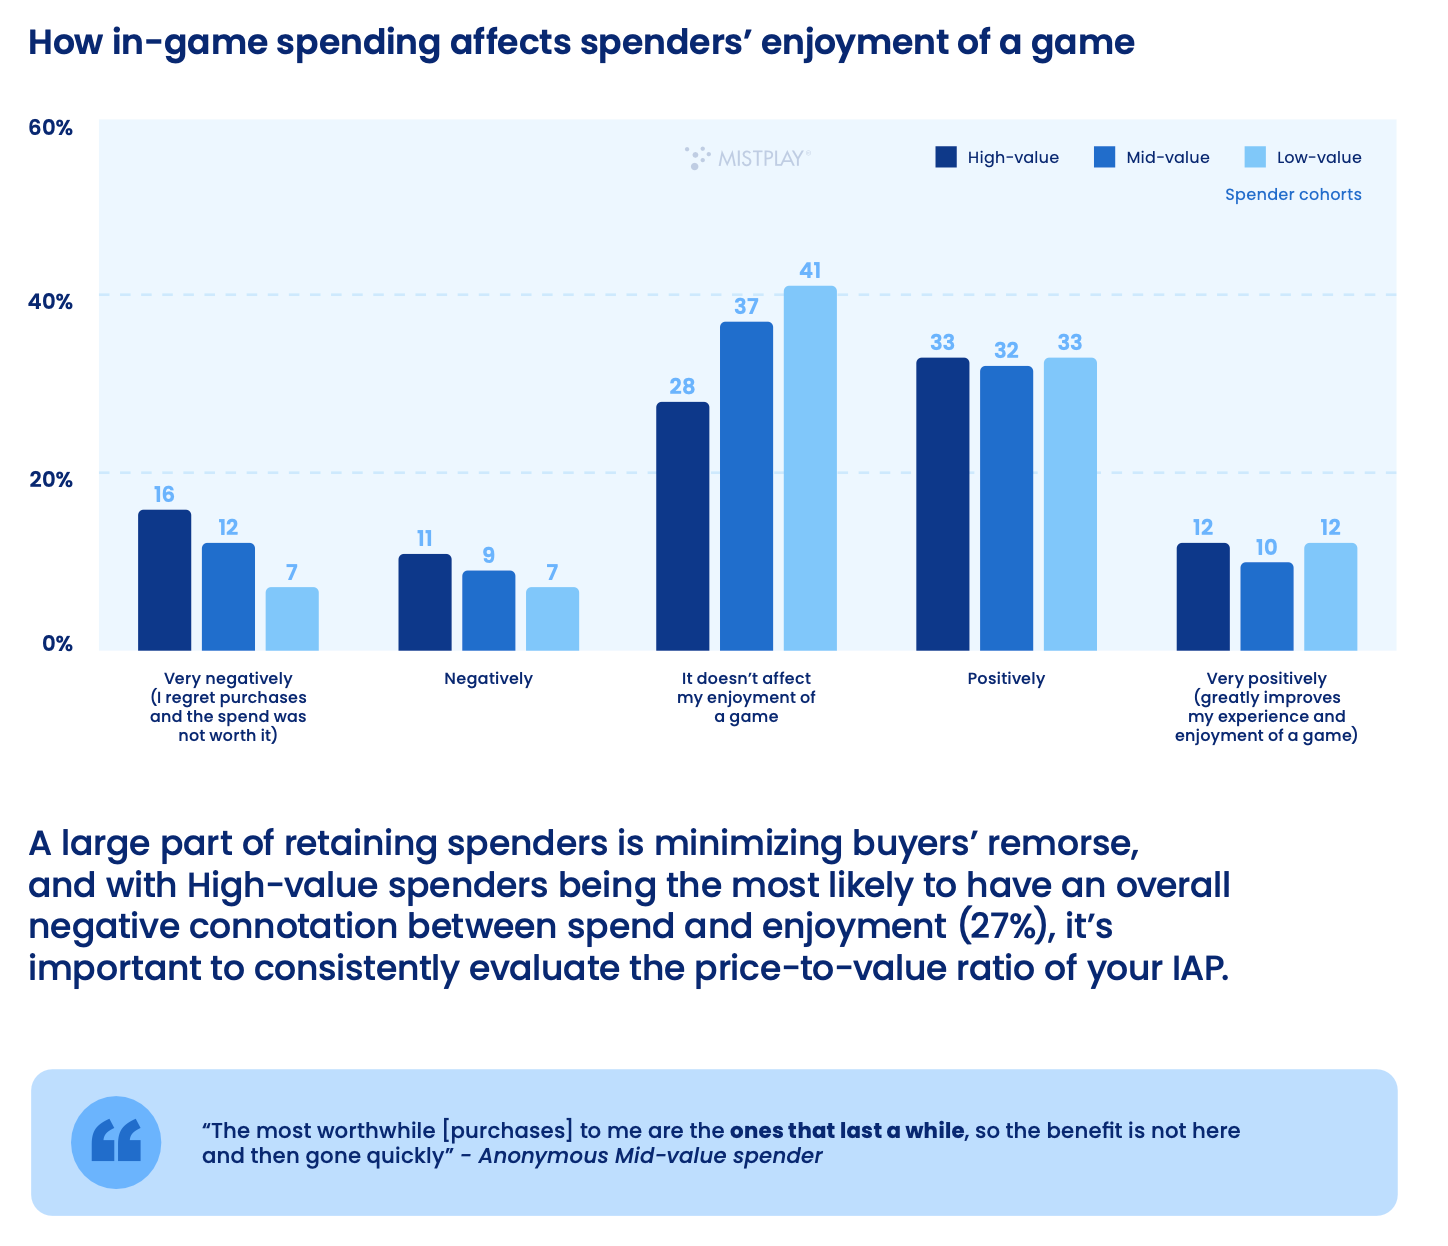
- The main factors for paying users leaving the game are pay-to-win mechanics, abundance of bugs and technical issues, lack of progress, and excessive advertising.
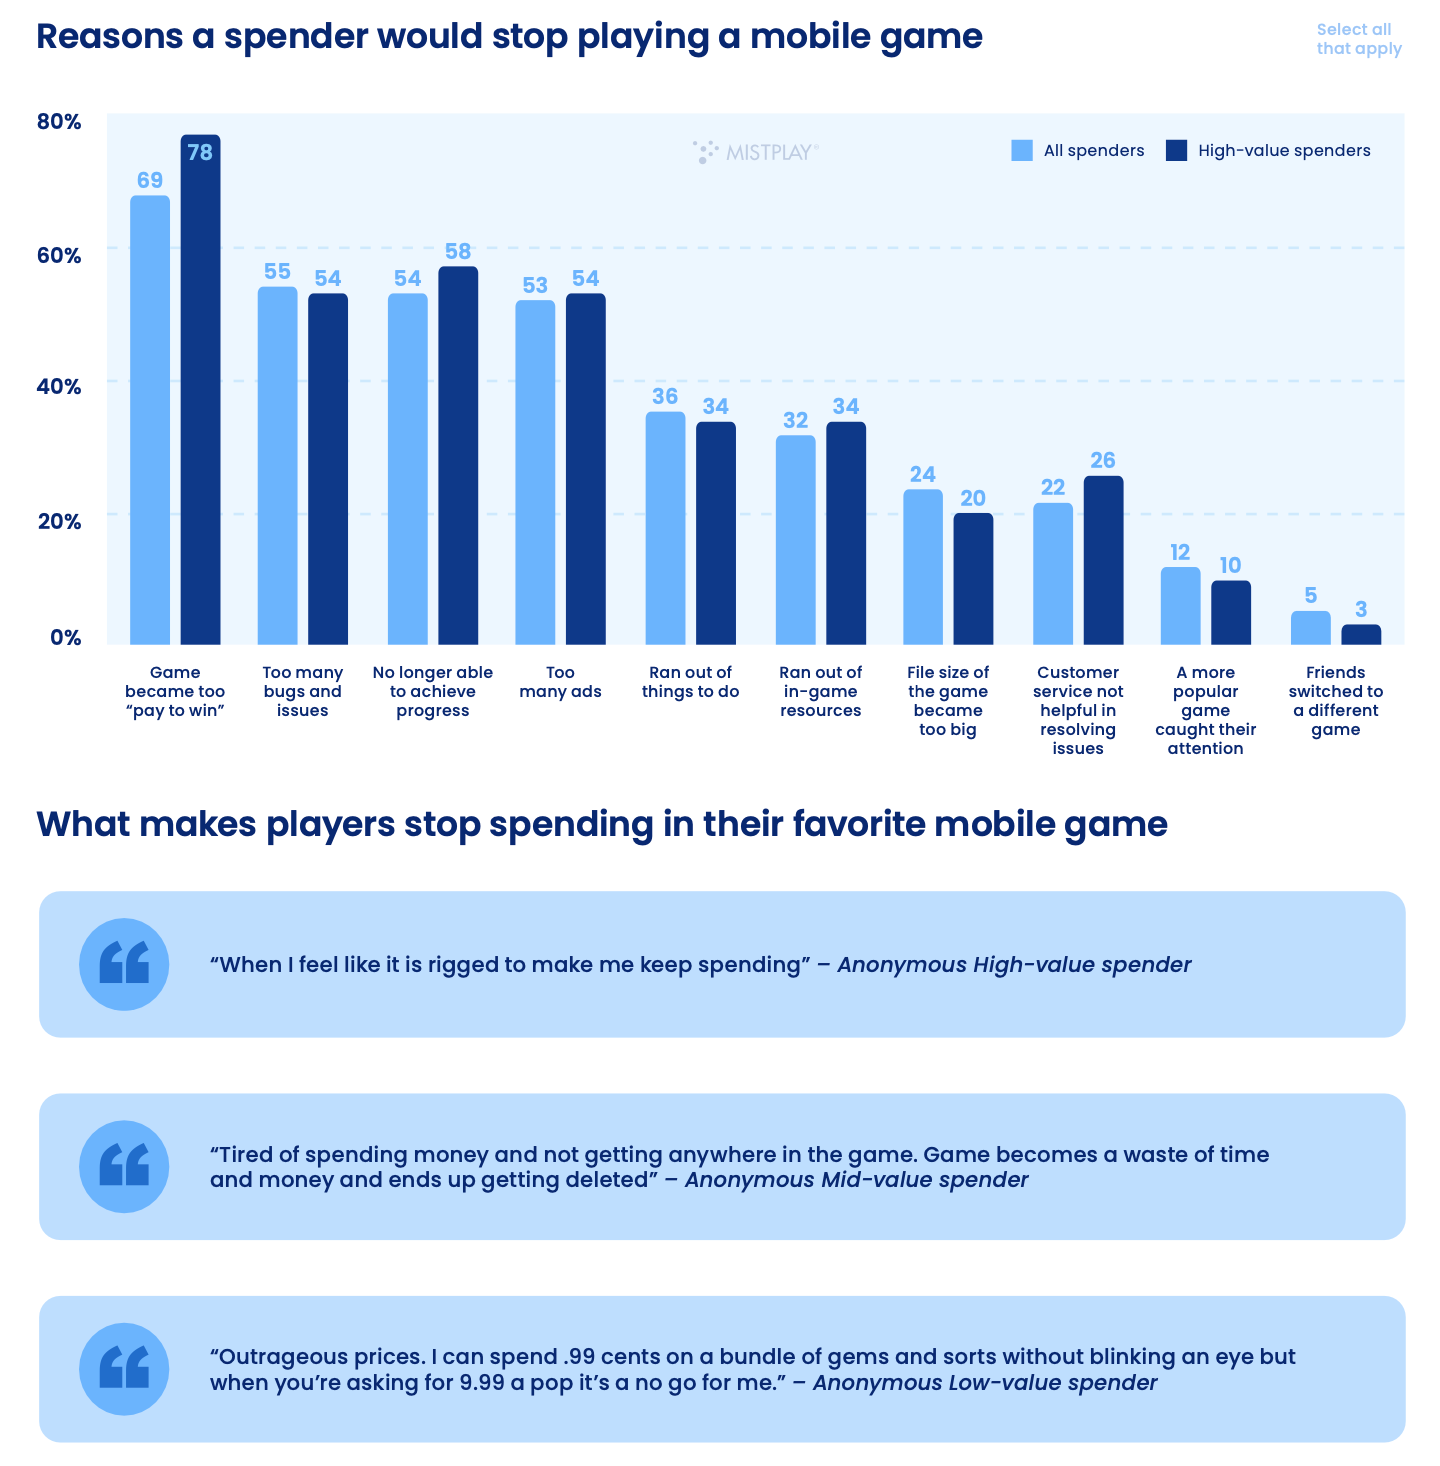
Future of Spending in Mobile Games

-
32% of paying users plan to spend less money in 2024. 5% plan to spend more; 35% do not plan to change their habits. The rest have not yet decided.
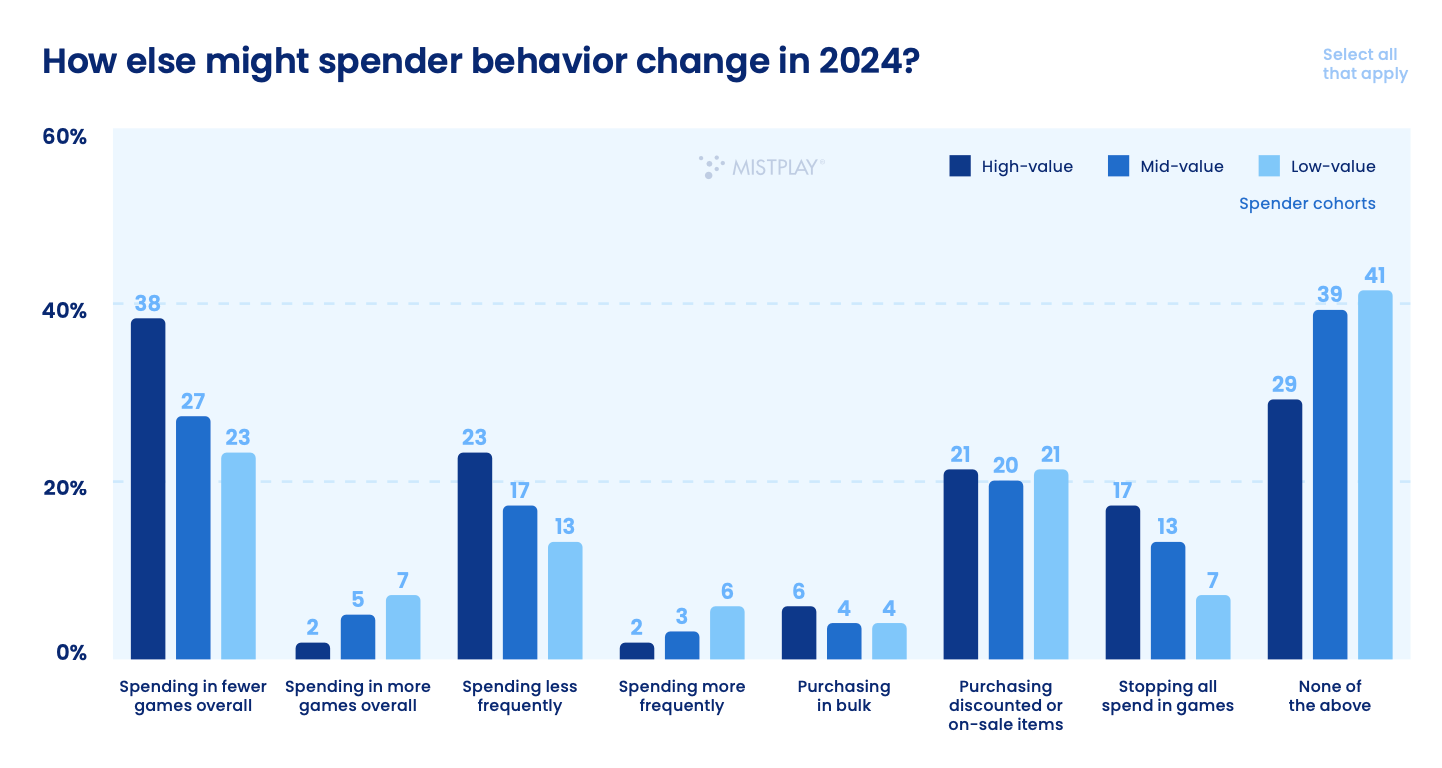
Mistplay identifies three main types of paying players in mobile games - casual; midcore, and casino players.
Portrait of a Casual Paying Player
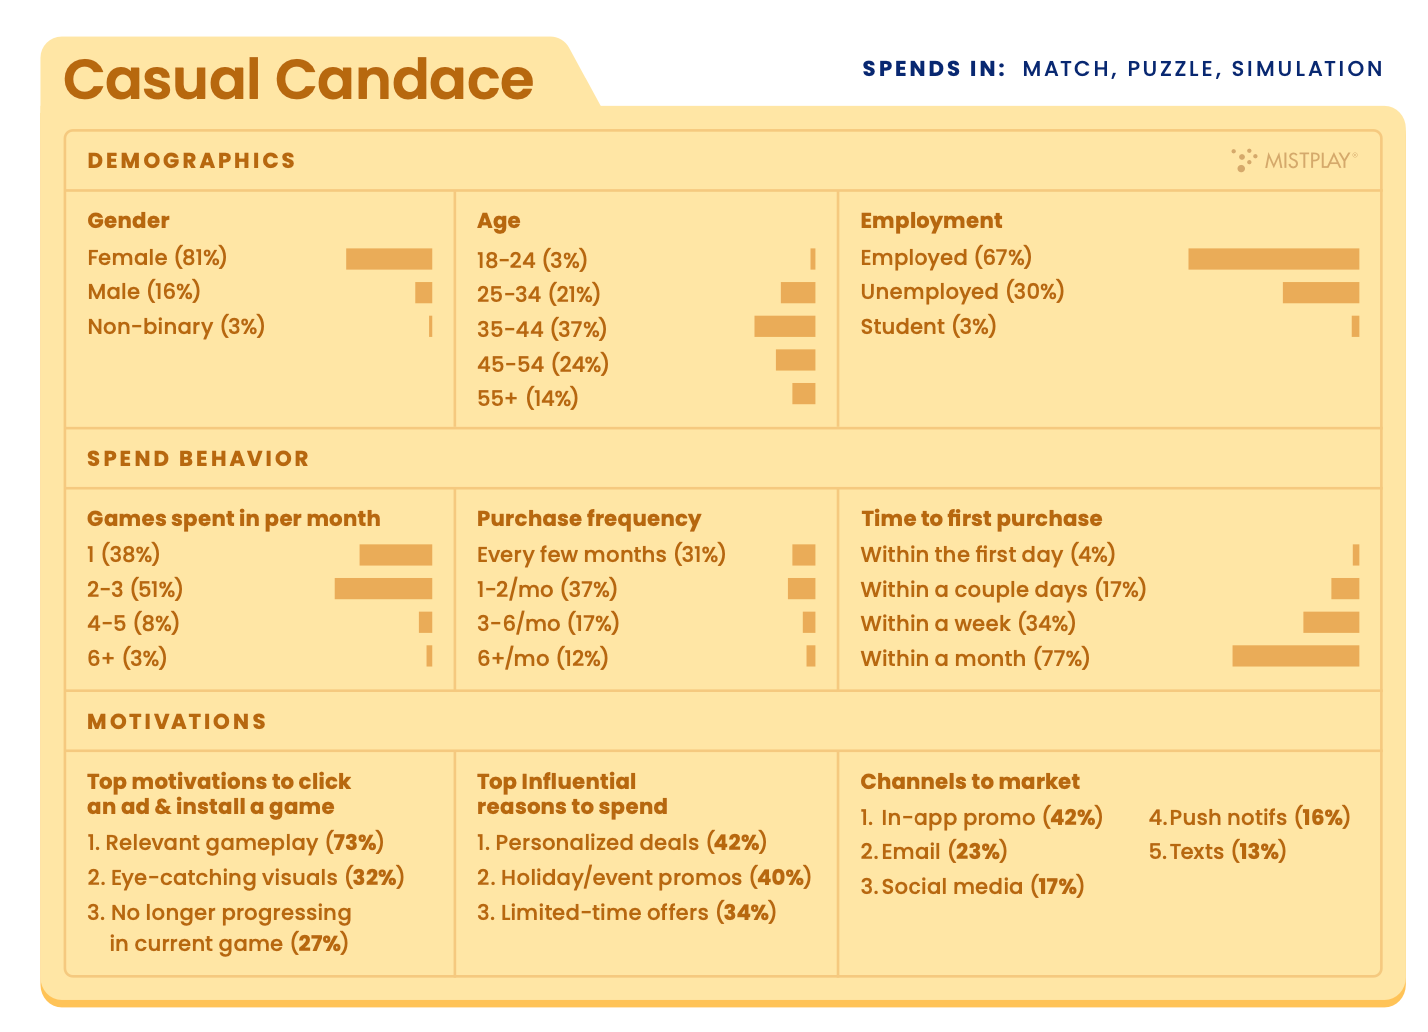
-
81% of such users are women. 16% are men. 3% are non-binary individuals.
-
37% are between the ages of 35 and 44; 24% are between 45 and 54 years old.
-
67% are employed; 30% are unemployed; 3% are students.
-
51% of these players spend money in 2-3 games. 38% spend only in one game. 37% make purchases 1-2 times a month; 31% once every few months. 17% - 3-6 times a month.
-
The first purchase for 77% of these players is made in the first month. 34% - within the first week; 17% - within the first couple of days; 4% - on the first day.
❗️Each subsequent cohort includes the previous one. That is, the percentage of those who buy within the first month includes those who buy on the first day.
-
The main motivators for these players to get acquainted with a new game are relevant gameplay (73%); interesting visuals (32%); unwillingness to continue playing the current game (27%).
-
The main motivator for spending is personalized offers (42%); holiday discounts (40%); and limited-time offers (34%).
-
The most effective promotion channels are in-game promos (42%); email (23%); social media (17%); push notifications (16%).
-
In 2024, 28% of such players plan to spend less on games. 17% plan to make purchases less frequently. 20% plan to make more purchases during discounts.
Portrait of a Midсore Paying Player
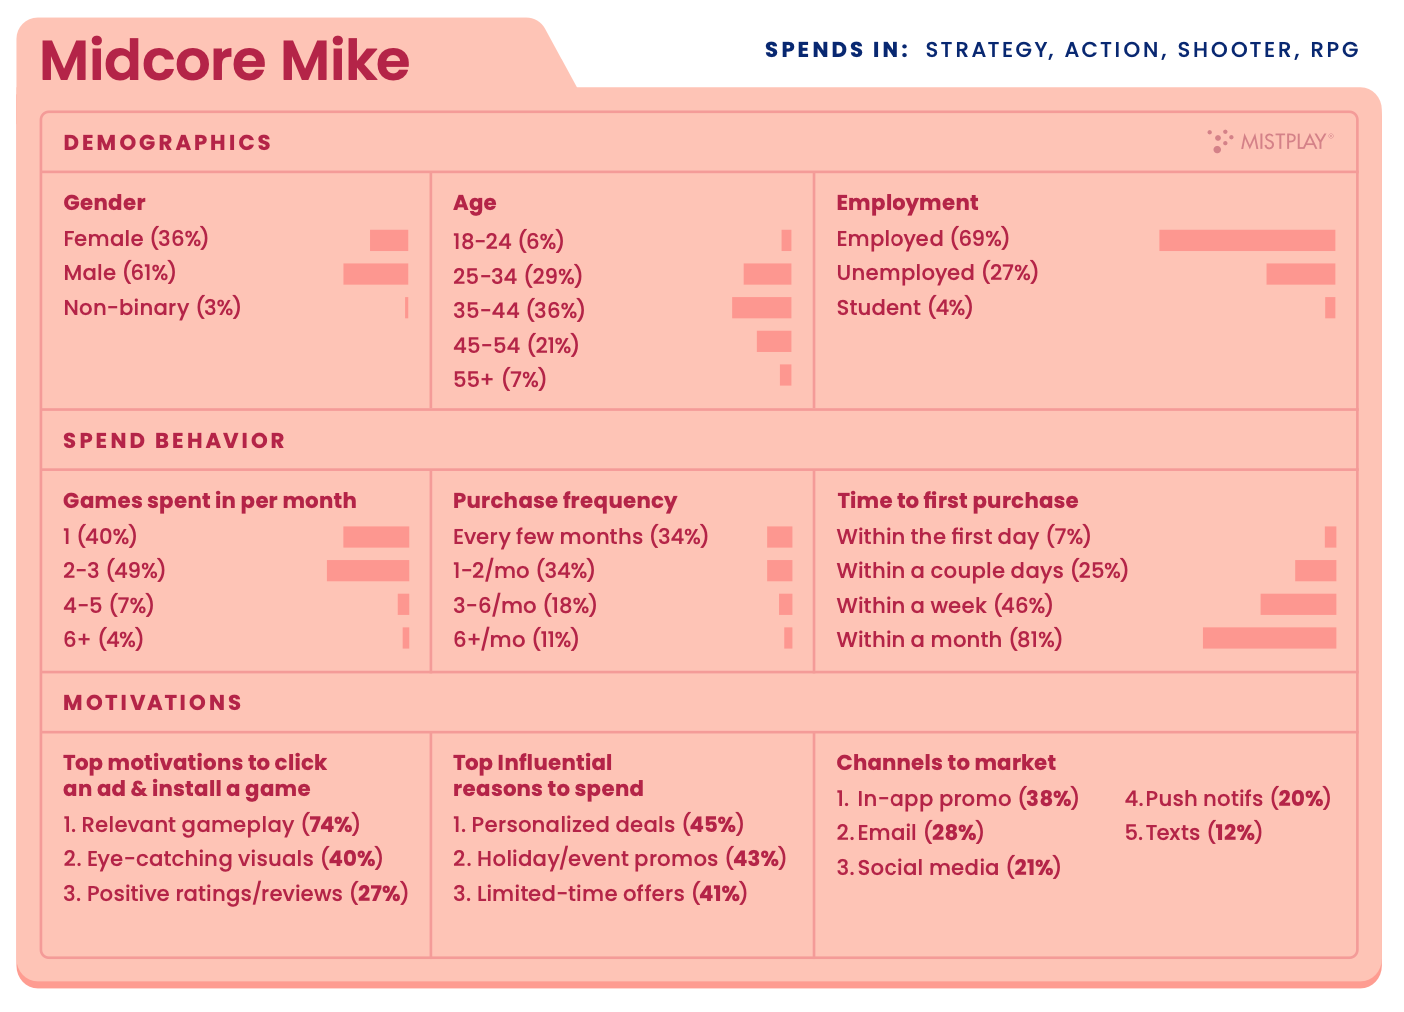
-
61% of such players are men; 36% are women; 3% are non-binary individuals.
-
36% of these users are aged 35-44; 29% are aged 25-34; 21% are aged 45-54.
-
69% are employed; 27% are unemployed; 4% are students.
-
49% of these users play 2-3 games per month; 40% play only one game. 34% make a purchase once every few months; the same percentage makes 1-2 purchases a month. 18% make purchases 3-6 times a month; 11% - more than 6 times a month.
-
81% of mid-core users make their first purchase within the first month. 7% only need 1 day for this.
-
The main motivators for this category to install a new game are relevant gameplay (74%); interesting visuals (40%); positive reviews and ratings (27%).
-
The main motivators for purchase are personalized offers (45%); holiday discounts (43%); limited-time offers (41%).
-
The main promotion channels are in-game promos (38%); email (28%); social media (21%); and push notifications (20%).
-
In 2024, 29% of users in this category plan to spend less. 18% plan to make purchases less frequently. And 26% plan to make more purchases during discounts.
Portrait of a Casino Player
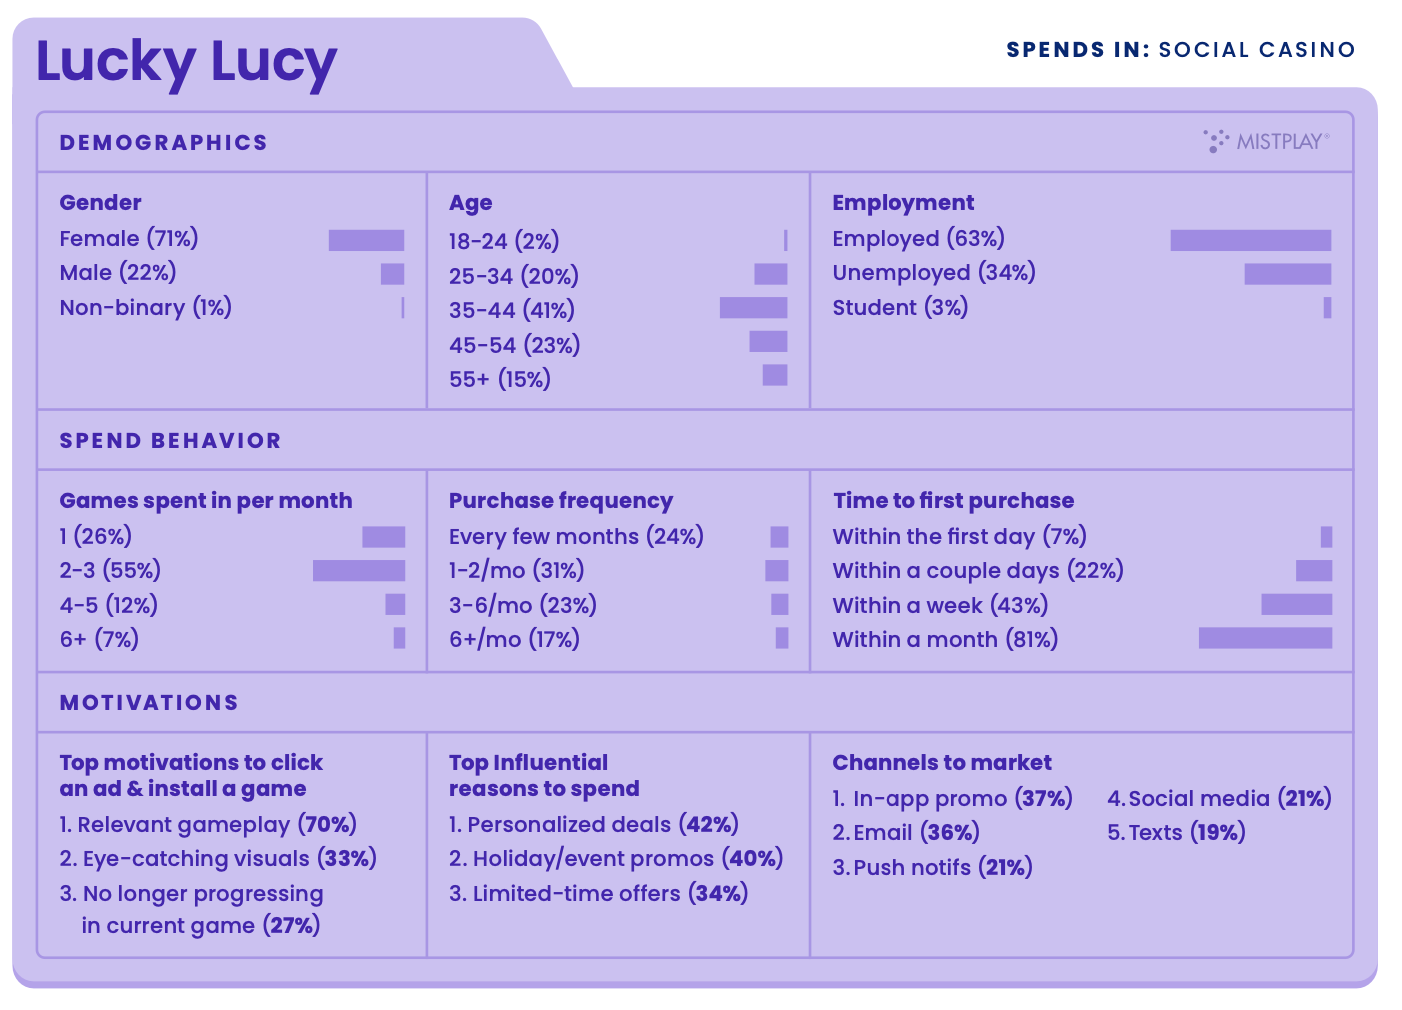
-
71% are women; 22% are men; 1% are non-binary individuals.
-
41% of this category are aged 35-44; 23% are aged 45-54. 63% are employed; 34% are unemployed; 3% are students.
-
55% play 2-3 games per month; 26% play only 1 game.
-
31% make 1-2 purchases per month; 24% - less than 1 purchase per month; 23% - 3-6 purchases per month.
-
81% make their first payment within the first month.
-
These users are motivated to change games by relevant gameplay (70%); visuals (33%); unwillingness to continue in the current game (27%).
-
42% are motivated to purchase by personalized offers; 40% - holiday discounts; 34% - limited-time offers.
-
The most effective notification channels for this audience are in-game promos (37%); email (36%); push notifications (21%); social media (21%).
-
In 2024, 27% of this audience plans to spend less on games. 18% plan to buy less frequently. And 21% plan to redistribute their spending to discount seasons.
Tune in next month for more updates!
In the meantime, you can take a look at our free demo to better understand how devtodev helps game projects grow and increase revenue.