
While discussing one or the other project, we often use the term - conversion. Analysts analyzing a project always pay attention to this key indicator and do their best to boost it.
Conversion is a percentage of users who have performed a target action: pressing the “Register” button at the landing page, clicking an ad, or, for example, making a payment.
Let's look into the last case in more detail, as it is the most important one for a project. Usually, by saying conversion, we mean paying conversion specifically.
Before we derive the formula, let’s talk about its key element - a cohort. This metric is calculated for a cohort, which is a certain group of users who have installed the app during a certain period.
So, paying conversion is a percentage of users who made payments out of all users who installed your app or game.
Paying Conversion = Paying Users/New Users
Conversion is directly proportional to the revenue. By increasing conversion, you increase the number of users who make payments, which leads to increasing the revenue.
Revenue = New Users*Conversion*ARPPU
| New Users | Conversion | ARPPU | Revenue | |
| Before | 1000 | 10% | $5 | $500 |
| After | 1000 | 15% | $5 | $750 (+250) |
However, if the conversion increases because of the decrease of the average payment or the product's price, the result may turn out to be negative.
| New Users | Conversion | ARPPU | Revenue | |
| Before | 1000 | 10% | $5 | $500 |
| After | 1000 | 15% | $3 | $450 (-50) |
That is why while experimenting with conversion you should keep an eye on other financial metrics.
You need to pay especially close attention to them when discounting your products. Not always lower prices lead to lower income, but it's still necessary to control them.
In addition to promotions and discounts, conversion can be affected by:
- product’s design and its individual elements
- headlines
- texts
- marketing proposals
- the simplicity of the interface
- time of the offers
- the right CTAs
- positive feedback about the product, etc.
These points are very individual in every project; what increases conversion rates in one product may not affect conversion in another. However, you still need to experiment to find out what works for your game.
You can analyze your conversion in more detail if you know these additional approaches.
Separating payment types
To get a better understanding of user behavior, you need to separately calculate the conversion of the first payment and repeated payments as opposed to calculating it for all the payments at once. In this case, repeated payment conversion is the percentage of users who have made more than one payment during the analyzed period.
You can also divide the repeated payments by their number: 2nd, 3rd, and so on, and then you’ll be able to calculate the conversion rate for each of them separately.
It's important to ensure that your users continue making purchases after they made their first payment, as often the repeat and recurring payments are responsible for the largest part of the revenue.
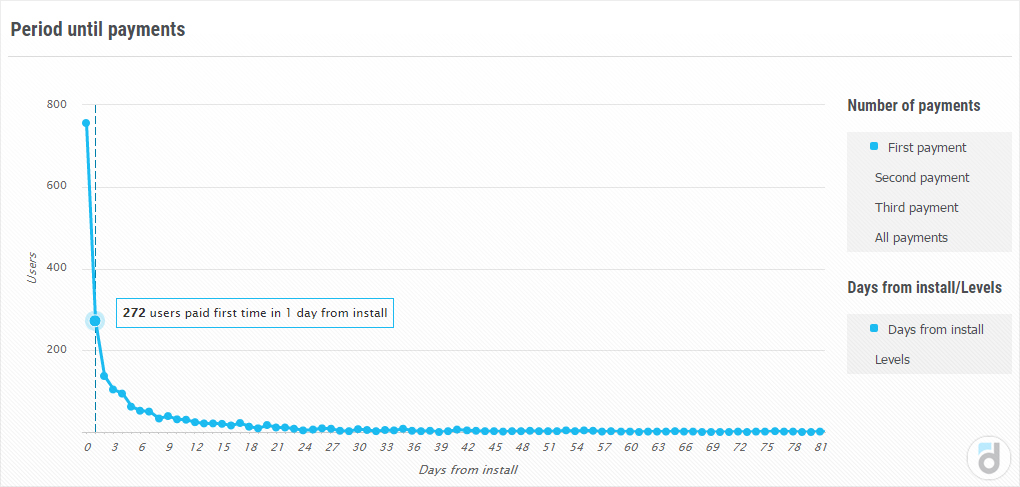
Tracking time before the first payment
It's also important to understand when exactly your users start paying – immediately on the day of installation or some time later, when they get the feel of the game.
After you got to know that, you can find patterns in user behavior, affect them, and plan various marketing activities, increasing the probability of making payments.
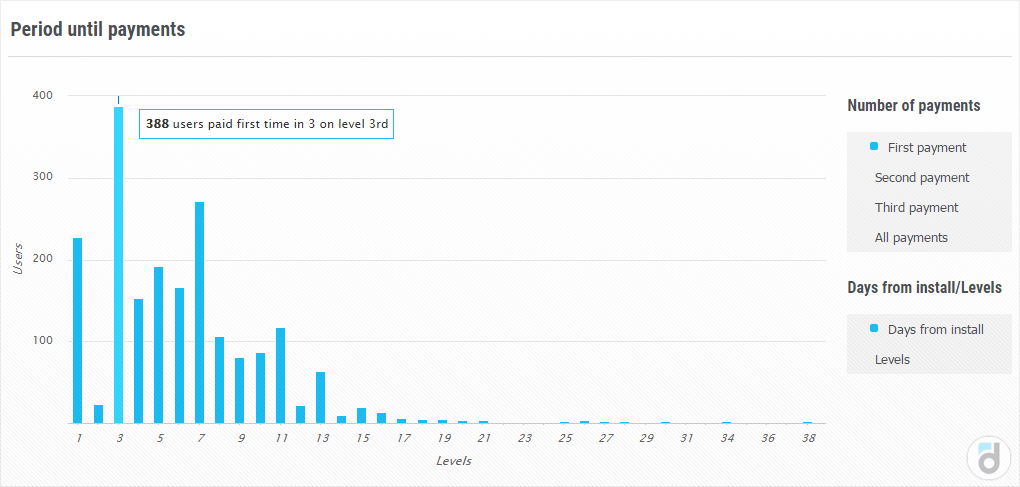
In addition, if your game or app has levels or stages, it's worth considering the moment of the first (or any other) payment in the context of these stages. This division can be relevant for games with levels, as well as various educational or fitness apps where the user's progress can be divided into separate stages.
Using cohort analysis to study the metrics by days
Conversion rate is calculated for cohorts, and you can use this aspect to track its changes over time for a specific group of users, as well as to compare different cohorts with each other.
|
Date
|
Cohort Size
|
Days from Install | ||||||
| 1 | 2 | 3 | 4 | 5 | 6 | 7 | ||
| 25.01.2020 | 977 | 16% | 13% | 11% | 5% | 3% | 1% | 2% |
| 26.01.2020 | 946 | 17% | 13% | 10% | 6% | 2% | 2% | |
| 27.01.2020 | 945 | 17% | 14% | 11% | 5% | 2% | ||
| 28.01.2020 | 1029 | 18% | 14% | 9% | 6% | |||
| 29.01.2020 | 953 | 18% | 13% | 10% | ||||
| 30.01.2020 | 995 | 20% | 13% | |||||
| 31.01.2020 | 972 | 17% | ||||||
Such analysis is relevant while conducting experiments – it's possible to estimate how the changes affect the conversion of cohorts that were formed before and after these changes.
There's one more metric, which is similar to conversion but has a different meaning – Paying Share.
Paying share = Paying users / Active users
This metric differs from Conversion by its denominator, which is the entire active audience. It is not tied to the installation date, nor does it require cohort analysis.
In addition to the fact that the Conversion rate affects the app's revenue, it's also an indicator of user's interest. Therefore, it is useful to study their behavior and needs in order to provide relevant offers, develop and improve the product. Remember: while tracking how all these changes affect the percentage of paying users, you should not forget to check other equally important financial metrics.