
What is ROI? What are the ways to calculate return on investment? How to track the return rate? What are other indicators that help evaluating commercial success of an investment project? You’ll find all the answers in the article below.
When we make any purchase, we want to get the result within the shortest period of time possible. After buying a car, we start driving to work with comfort; we have fun playing our favorite game on a new PlayStation; after paying a fitness trainer, we expect to get fit, and when paying for dinner, we expect to spend a great Friday night with our friends.
Similarly, putting money into a project, an investor wants a return on their investment (only by value) preferably at the earliest time possible.
Such metrics as ROI (Return On Investment) indicate how invested money is returned. There are several ways to calculate ROI for your game. The first one is the following:
ROI = (Revenue – Investments) / Investments
The sum of investment is deducted from the revenue received and divided by the sum of investment. In this case, if ROI > 0, one can assume that the investment hit the break-even point.
Read more: How to Integrate an Analytics System into your Game
The second way is a bit easier - the revenue received from the investment is divided by the sum of investment.
ROI = Revenue / Investment * 100%
In this calculation, the ROI > 100% ratio will indicate payback.
The equally important issue after the fact of payback is its period - when the investment will be returned. Therefore, to control the process and the rate of return on investment, ROI can be tracked during the first week and calculated on the 7th, 14th, 30th, 60th, 90th, and other days.
At a time when revenue will equal to the sum of investment and ROI will equal to 0 or 100% (depending on payment methods), investment is considered to be paid back. And all the subsequent revenue of the project will mean additional profit.
Knowing ROI values on certain days, one can not only track how money returns, but also compare the return on investment for various projects.
Read more: Retention is Dropping - What to Do?
Let's look at an example.
There are two projects: $500 is invested into the first project and $1,000 is invested into the second one. Now we'll see how the money returns applying the second formula:
| Project 1 | Project 2 | |||
| Investment | $500 | $1,000 | ||
| Revenue | ROI | Revenue | ROI | |
| 7th day | $75 | 15% | $150 | 15% |
| 14th day | $250 | 50% | $300 | 30% |
| 30th day | $450 | 90% | $600 | 60% |
| 60th day | $850 | 170% | $1,000 | 100% |
| 90th day | $1,000 | 200% | $1,350 | 135% |
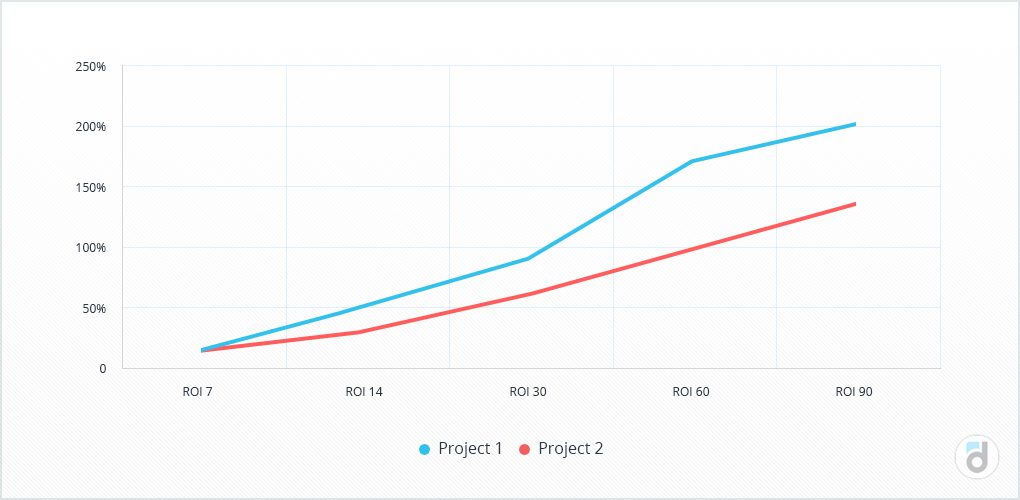
Despite the fact that the second project brings more revenue, the first pays back faster.
Calculation of ROI on certain days allows us to compare different projects even if the investments were not made simultaneously. If we take into account the final ROI only, we can falsely compare its indicator for the project which ''held up'' for 30 days with the one that is on the market for half a year.
ROMI, or return on marketing investment, is a special case of ROI. In fact, it is the same indicator, but it also underlines that ROI can be applied to marketing companies as well as to other areas.
Read more: How to Apply Analytics at Every Stage of Product Development
ROI is widely used in marketing to analyze the return on investment and effectiveness of traffic. In this case, you can modify the formula a little bit and count it as LTV (Lifetime value) minus CPI (cost per install) divided by CPI, in other words, the revenue from a user during their life in a project reduced by the cost of acquiring them and divided by the cost of acquisition:
ROI = (LTV — CPI) / CPI
Or another way:
ROI = LTV / CPI * 100%
In this case, ROI can be also calculated on a certain day since a user installed an application, only instead of LTV, you’ll need to use the cumulative ARPU for that day:
N day ROI = (N day Cumulative ARPU — CPI) / CPI
or:
N day ROI = N day Cumulative ARPU / CPI * 100%
When analyzing traffic, one can not analyze ROI isolated without considering other metrics mentioned before, as you can get even more information about a user, from ARPU to their behavioral characteristics which will also help evaluate the quality and targeting of your traffic. For example:
- ARPU, conversion to registration or purchase;
- number of sessions per user;
- retention which can be evaluated during the first days after the install;
- completing certain events.
All this will give you a better understanding of what kind of users come to a project from a certain channel.
Read more: Top 10 Youtube Channels for Data Analysts
Here’s a quick example where we'll take into account a few more indicators. Let's assume that we have two projects with the following parameters:
| Project 1 | Project 2 | |
| Acquisition cost | $500 | $300 |
| User acquisition | 200 | 140 |
| Revenue | $550 | $400 |
Using this data, you can calculate not only ROI but also ARPU - an indicator that takes into account both paying and non-paying users along with the number of their transactions - after that, the second project seems more profitable as it returns investments faster and attracts those users who on average pay more.
| Project 1 | Project 2 | |
| ARPU | $2.8 | $2.9 |
| ROI | 110% | 133% |
There are two more indicators that will help to evaluate the success of an investment project - NPV (net present value) and IRR (internal rate of return). Let's take a look at them.
NPV makes it possible to take into account the discounting when calculating the potential revenue of a project.
It is the total revenue multiplied by the discount rate:
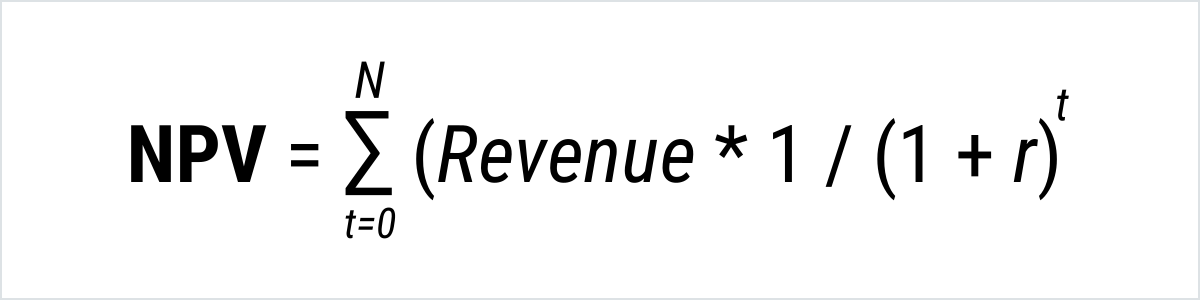
Here ''r'' is the discount rate, ''t'' - time intervals of the revenues that we sum up.
This indicator will be more than zero for successful investments; the more profitable the project is, the higher it will be.
Let's calculate it for two projects which we were talking about in the first example. Suppose that the discount rate is 10%, then the calculation for the first month and the first project will look like this:
($450*1 / (1+10%)1 = $409.
Similarly, one can make the calculation for all other remaining periods:
| Project 1 | Project 2 | |||
| Revenue | Revenue* discount coefficient | Revenue | Revenue* discount coefficient | |
| 1st month | $450 | $409 | $600 | $545 |
| 2d month | $400 | $331 | $400 | $331 |
| 3d month | $150 | $113 | $350 | $263 |
| Investment | -$500 | -$500 | -$1000 | -$1,000 |
| Sum | $500 | $352 | $350 | $139 |
Read more: Color Code you Data to Simplify Interpretation and Enhance Analysis
Summing up NPV with investments into a project, we can see that the outcome of both projects is more than zero – it means that both of them will return the investment but the first one is more attractive as its NPV is higher than of the second project.
Now let's take a look at the second indicator - IRR. It is closely related to NPV because it is the interest rate when NPV is zero.
Therefore, all you have to do to count IRR - is to set the previous formula to zero and calculate the interest rate.
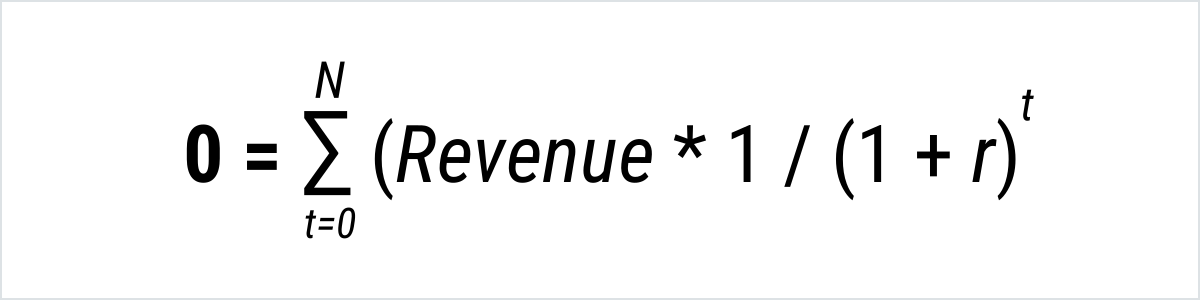
Here ''r'' is the IRR that we are looking for.
IRR shows at which interest rate investment will hit the break-even point.
In our example, such rate is 54% for the first project and 19% for the second one which shows another advantage of the first project.
One always wants to get a positive result when investing their money and, moreover, when the result can be measured. We went through the main indicator of financial investments. The good thing about it is that it takes into account both spent resources and the revenue, thus determines the feasibility of the investment. You can use it to monitor these investments and to manage them more efficiently.