
When examining user behavior during data analysis, it is crucial to provide precise descriptions of their actions and metrics. However, often the data is incomplete or analyzing it is costly. Consequently, we frequently have to draw conclusions based on partial data, specifically using populations and samples.
A population refers to the entire group of individuals, objects, or items that share a common characteristic within a given context.
On the other hand, a sample is a subset of the population that is selected for analysis.
These concepts provide the basis for drawing meaningful conclusions and making accurate inferences from collected data.
Representative Sample
Findings from sample analyses can never guarantee 100% confirmation upon repetition of the experiment. One method to enhance the accuracy of analysis results is by including random objects in the sample.
The representativeness of the sample refers to the extent to which it reflects the population.
Read more: Power App & Game Metrics for Captivating Potential Investors
Let's consider an example where we want to conduct customer development on our app users from Ireland. However, it is impractical to have every user complete our survey due to the effort involved, and not all users may be willing to cooperate.
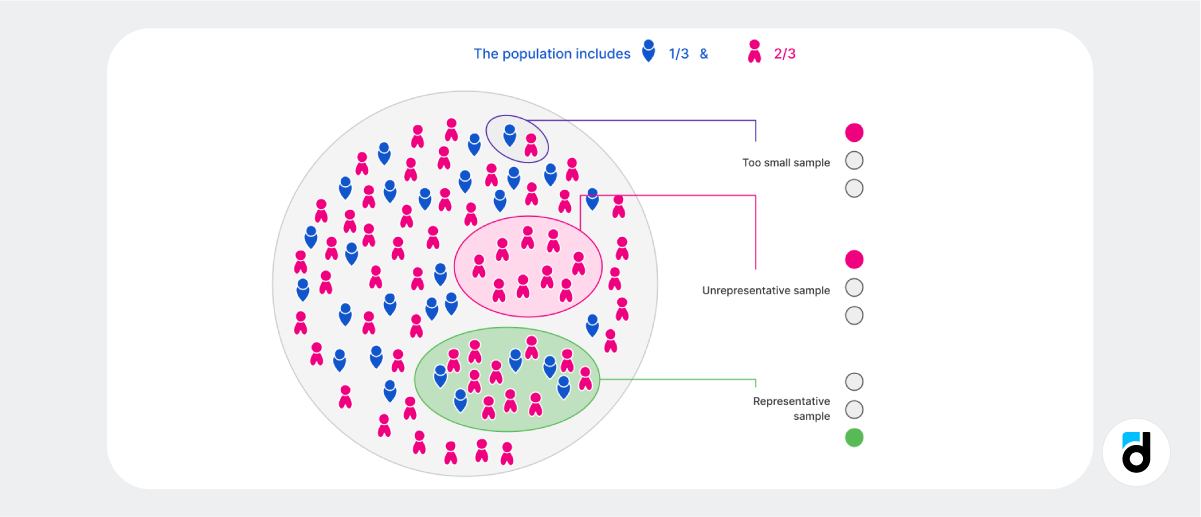
We know that ⅓ of Irish users are men and ⅔ are women. So, how can we perform proper customer development on a subset of users to gauge the opinions of Irish customers about the app?
-
If we include just one man and one woman in our sample, the analysis results will not allow us to confidently determine the app's perception among Irish users. Random errors are likely to occur, leading us to believe that these two individuals despise the app to the extent of criticizing every aspect of its interface.
-
If we only include Irish women, we end up with another unrepresentative sample that excludes male opinions, even though men constitute ⅓ of the population.
-
The correct approach would be to include men and women in the same proportion as that in the population, such as 10 men and 20 women. However, this sample is still likely to include more users with highly negative experiences. Thus, by increasing the sample size, we can enhance the relevance of the results.
Read more: A Simple Guide to Analyzing Paid Traffic and Avoiding Fraud
Examples of Unrepresentative Samples
A representative sample is ment to mirror the characteristics of a larger population. However, there are some common mistakes that can undermine the representativeness of a sample and consequently compromise the validity. Here are some examples:
-
Drawing conclusions solely from US users will not provide insights about overall app users but only about the conversion rate for US users.
-
Analyzing only paying users' behavior may not accurately reflect the behavior of non-paying users, making it inappropriate to extrapolate paying users' behavioral patterns to the entire user base.
-
Surveying people on the main street will not provide insights into the sentiments of city voters as the street may have a substantial number of tourists or businessmen whose opinions may differ from those of city residents.
So, how do you constitute a proper sample?
Improper Sampling Methods
Let's explore the limitations of the two common sampling methods. Suppose we have a complex B2B platform and aim to observe the sequence of user actions following app installation to identify behavioral patterns among users who purchased a subscription versus those who did not.
- The least favorable and worst approach would be to select the first ten users. The issue with this method is that such lists are usually sorted based on a specific criterion, such as installation time. Consequently, our sample consists entirely of users who installed the app on a particular day and time. User behavior on weekdays and weekends can vary significantly, especially in the B2B context. Additionally, by selecting users who installed the app within a single hour, we unintentionally create a sample primarily composed of users from the same time zone. Since it is nighttime in the US during that period, none of the users from that location are included in our sample.
-
Another commonly used method is to select several users from each country. However, this approach is likely to result in a sample that fails to accurately reflect the actual distribution of all app users. It is possible that the majority of users come from the same region.
Read more: Unlock Insights with Devtodev’s User Flow Report
Proper Sampling Methods
In contrast, employing appropriate sampling methods is essential for obtaining reliable insights. Here are a few approaches that ensure a more accurate representation of user behavior:
-
Select every 'n' user from the list. It is advisable to determine the number of users that meet the research criteria and then calculate 'n' based on this number and the desired sample size.
-
Another method is to choose users with IDs divisible by a certain number. This approach works well if the IDs are randomly assigned and not based on sequential installation dates.
-
An even better approach would be to generate a random number list and select users with corresponding sequence numbers.
Read more: SQL Knowledge Levels: Beginner, Middle, Advanced
Statistical Significance
As mentioned earlier, in statistics, it is challenging to draw conclusions that are absolute facts due to working with small sample sizes of all possible data. Statistical significance is a concept related to the likelihood of being correct. For instance, if we claim that a new app version has a better free-to-paying conversion rate, we can only state this with a certain degree of probability, typically 95% or 99%. Essentially, this probability represents the chances of obtaining the same result (conclusion) in a repeated experiment.
Statistical significance depends on two factors:
-
Sample size: the larger the sample size, the more reliable the analysis results become.
-
Deviation value: it indicates the level of variation between samples. The greater the difference between two samples (e.g., two app versions or two groups in A/B testing), the more confident we can be in asserting that a difference exists between them.

Read more: Game Onboarding: Uncover Bottlenecks with devtodev
Let's consider a scenario where you released an app update with modified user onboarding and expect the onboarding funnel to improve. After analyzing user data before and after the update, you obtained the following results: the current percentage of users returning to the app the next day after installation is 51%, compared to the previous 50%.
Yay! Update is a success! But although this appears to be a successful update, it is not prudent to draw conclusions based on only two numbers. Without knowing the sample size, we cannot determine the significance of the result. If you were Facebook and had 100,000 users in each update, the result would likely be statistically significant because the probability of random users affecting the statistics would be negligible. However, if you have just launched the app and are gaining 100 new users with each version, the probability of one user accidentally logging into the app the next day and inflating your rate would be relatively high. Such a result cannot be considered statistically significant, and we cannot be certain that the changes made were responsible for the improved metric.
Populations and samples enable analysts to study the behavior of the entire user base of their product. By crafting representative samples and employing specific tools, analysts can extract valuable insights that empower the company to make data-driven decisions.