
Analyze subscriptions with Devtodev—a unique analytics platform that enables you to gather subscription data from the App Store and Google Play. Calculate all the vital statistics, including trials, conversion to subscription, subscription renewals, retention of subscribers, revenue structure, and more.
If you are new to the Devtodev analytics platform, please navigate to Smart view -> Monetization -> Subscriptions in our free demo project. For experienced users, simply open your Space and begin engaging with subscription analytics.
If you wish to utilize the subscription analytics feature of the Devtodev platform, you must first integrate the SDK version 2.1 or higher, following the instructions in the documentation, and make necessary adjustments to settings. The process is fast and easy (you can also pass on information using the API afterward).
The subscriptions report consists of three sections: Overview, Structure, and Retention. Let's review each of them.
Overview
The report comprises multiple widgets providing information on various aspects of the essential metrics for the mobile app's subscription monetization model.
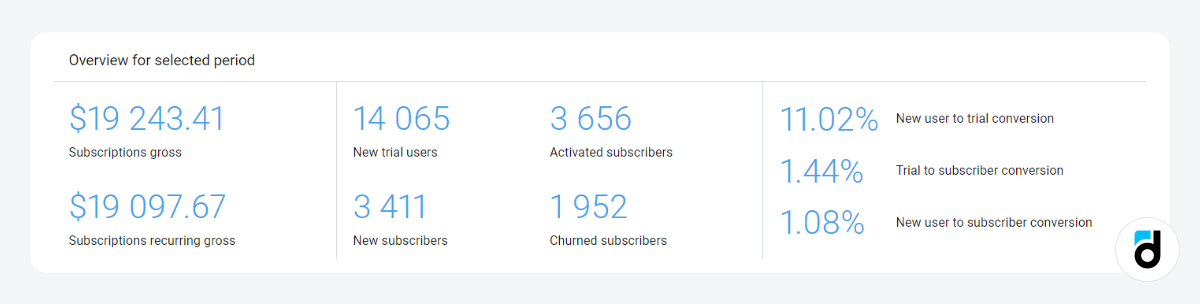
The first widget, named Overview for the selected period, contains general information about metrics. This allows you to track several key subscription indicators simultaneously.
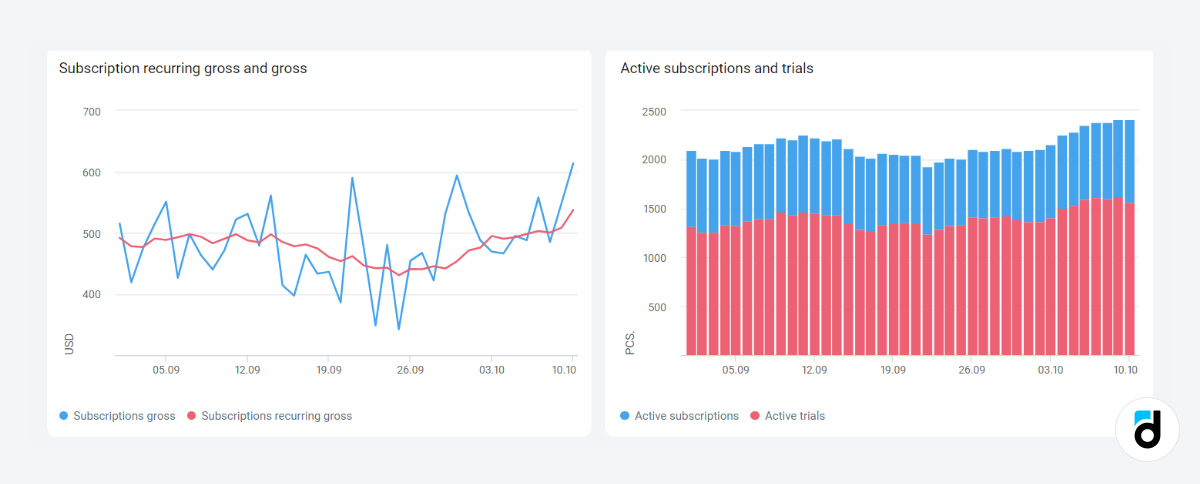
The next two graphs illustrate your daily income flow and recurring gross, along with the dynamics of active subscriptions and active trials for your mobile app. These graphs can be used to monitor any changes in your product and respond promptly.
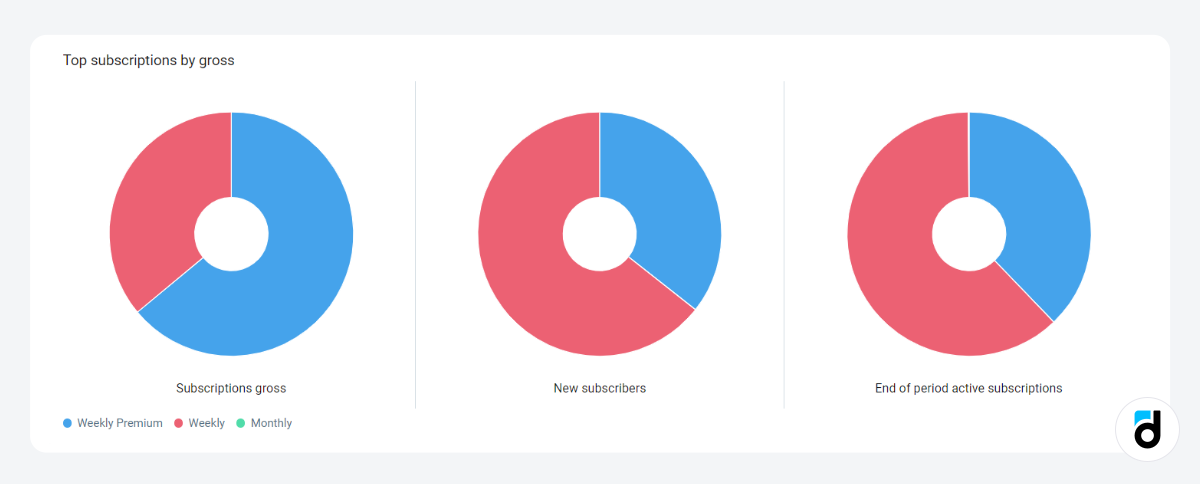
Next, you'll find a set of pie charts presenting information on subscription gross, new subscribers, and the number of active subscriptions at the end of the selected period. These are broken down by the top five subscription bundles by gross.
Take a look at Devtode pricing
The next set of widgets displays the daily dynamics of new users, new trial users, subscribers, and their conversions.
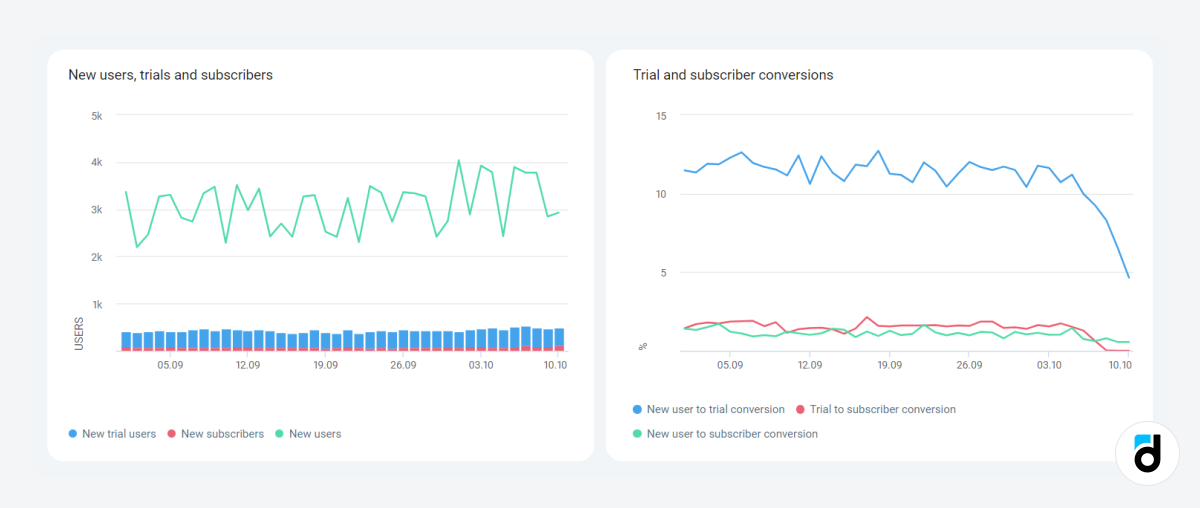
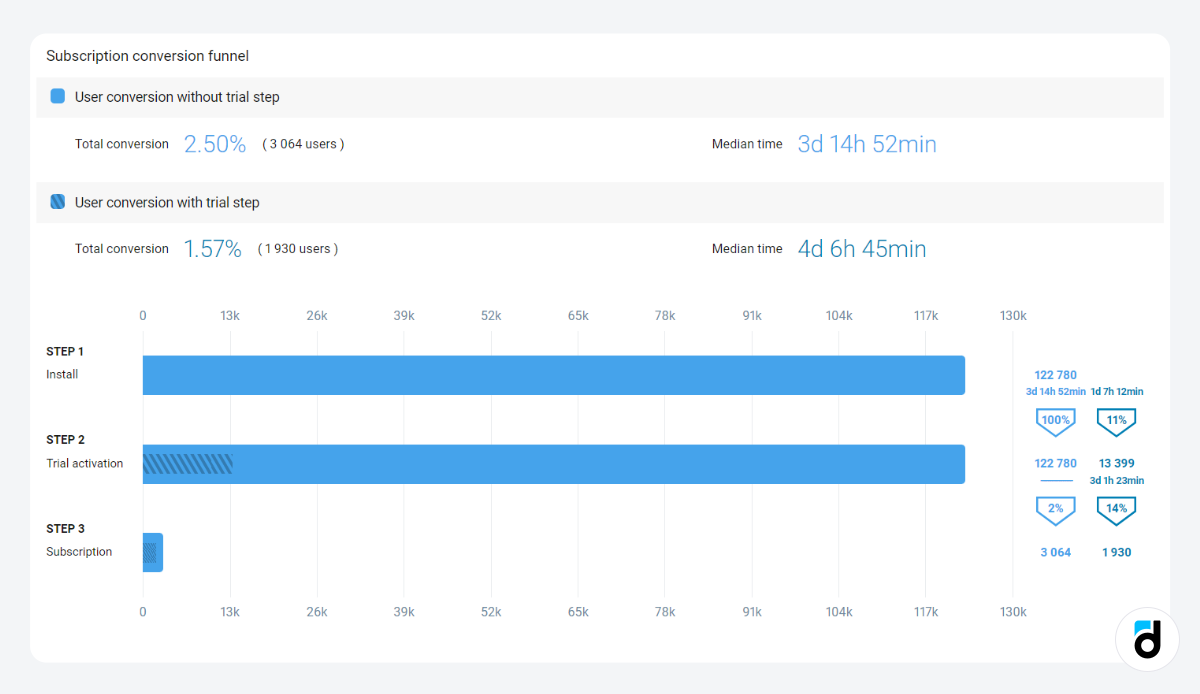
Below them, you can find a funnel presenting aggregated information for the selected period. This includes data on new users and their conversion to subscribers (depicted in a light blue funnel with accompanying data signatures). Additionally, it provides information on the conversion of new users to trials and subsequently to subscriptions (illustrated with a blue funnel and signatures). The funnel also contains details about the median time required to progress through each stage.
These reports alone can provide you with a thorough understanding of the state of subscriptions. You can create similar widgets using funnels (or the Basic metrics/Custom events/SQL reports), add any of the widgets to a dashboard, and keep track of the metrics of your choice.
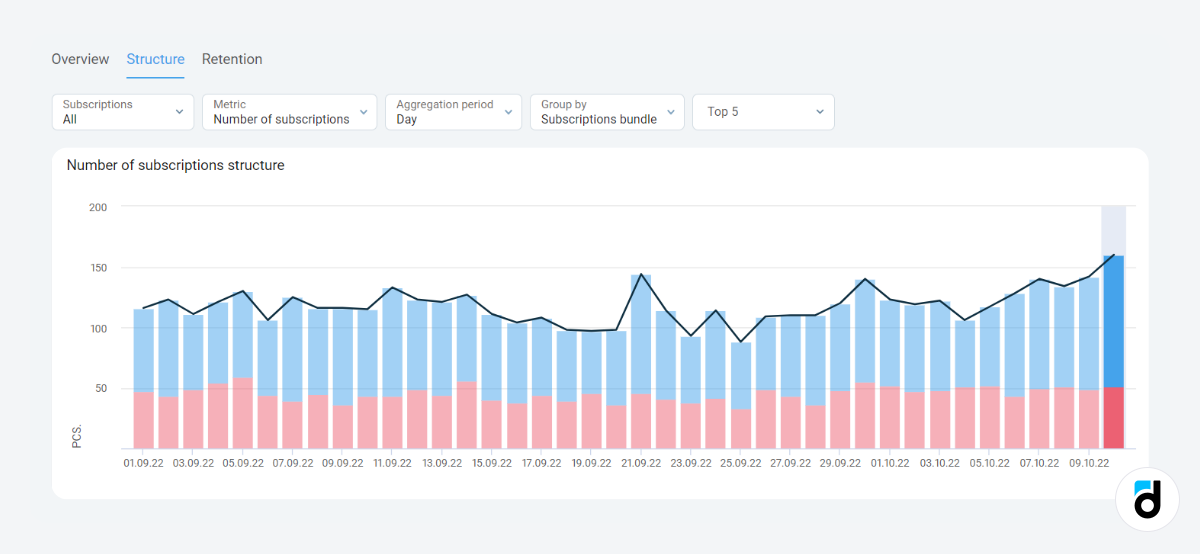
Structure
Utilize this report for an in-depth analysis of the structure of subscriptions purchased by your users and the income earned from them.
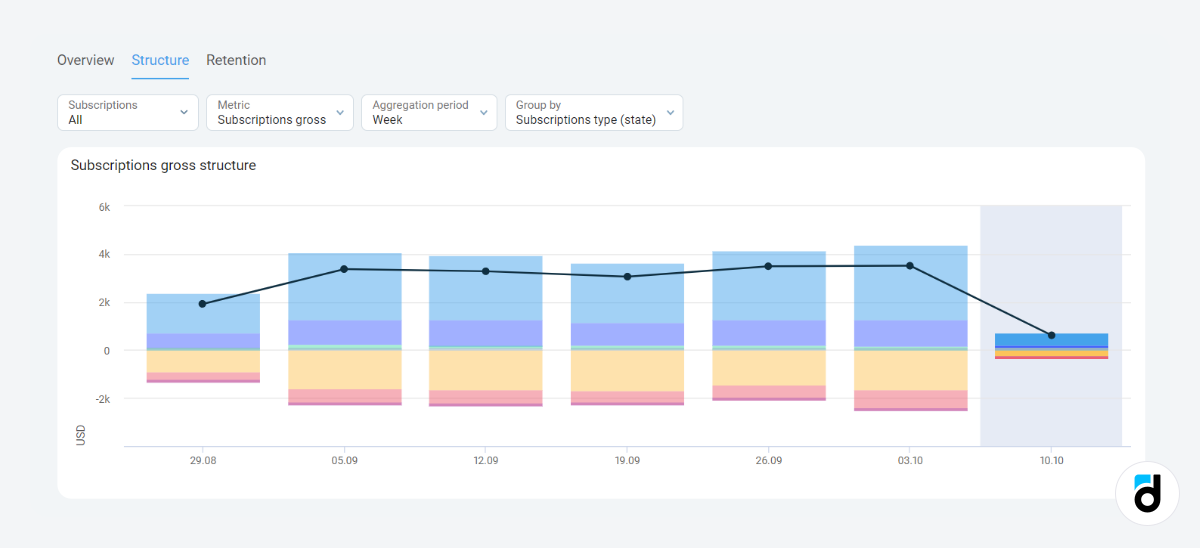
Depending on the options selected in the Group by field, the report will display all the components of the metric you choose:
-
Subscriptions bundle — with a breakdown by top subscriptions.
-
Subscription state — with a breakdown by subscription status (new, renewed, reactivated, upgraded, downgraded, refund). Additionally, you can identify opportunity losses here, representing income lost because users didn’t renew their subscriptions that expired during this period.
In fact, this report offers more depth, as you have the choice of five metrics. You can also analyze a specific subscription type (monthly, yearly, etc.) or aggregate data and analyze it over time.
Retention
This report illustrates the impact of subscriptions on user retention and how frequently users renew their subscriptions (Subscription retention).
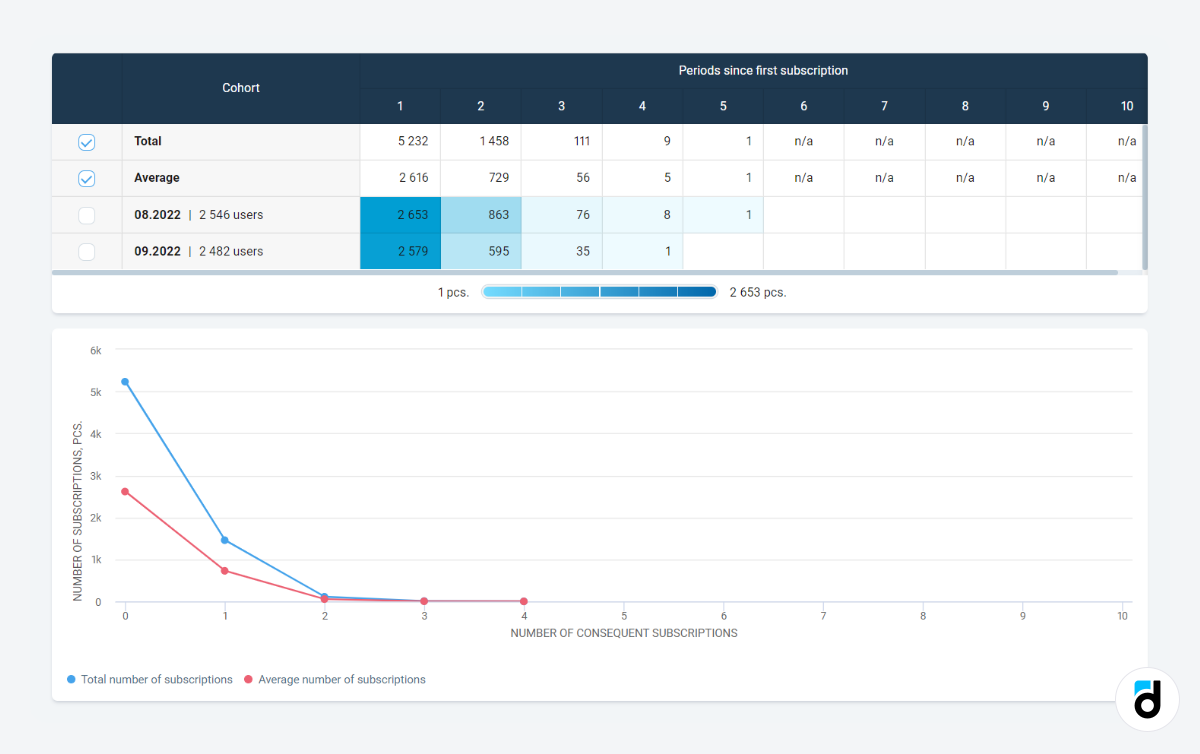
In the example above, we observe that in the first week of October 2021, 686 users purchased the first subscription. Subsequently, 114 of them renewed it, indicating a conversion rate from the first to the second subscription of approximately 17%. Furthermore, 9 users renewed the subscription again, constituting 1.3% of the initial cohort.
The following metrics are available for analysis in the Metric selector:
-
Activated subscriptions: This represents the total number of purchased subscriptions, including subsequent renewals.
-
Subscription conversion: This metric signifies the conversion into purchasing the Nth subscription. It starts at 100% for the first period, and for each renewal period, it equals the ratio of users who activated the Nth subscription to the number of users who bought the first subscription.
-
Subscriptions gross: This metric quantifies the amount of income earned from both the initial and renewed subscriptions.
How to Use it?
-
Track the number of subscriptions, conversions into subscribers, trials, revenue earned, and observe how changes in the product and your experiments influence these metrics.
-
Monitor subscription renewals, upgrades, downgrades, refunds and churns.
-
Identify the most profitable price plans and the ones that lead to more subscription renewals. Highlight these findings in the interface to improve your conversion rate.
-
Use subscription data to monitor Lifetime and LTV of different price plans. This allows you, for example, to calculate the price of a discounted item that is profitable for the company and simultaneously attractive for the customer.
-
Create cohorts based on the subscription state and analyze the differences in the behavior of unsubscribed users, trial users, and subscribers. Use this data to enhance user experience and increase conversion rates.
For more details on the subscription analytics section of the devtodev platform, refer to our documentation.
Remember that you can get a hands-on experience with the analytic platform absolutely FREE!


: The Basics")
: The Basics")


 in Mobile Games")
 in Mobile Games")


")
")


")
")


")
")


 Tactics for Mobile Games")
 Tactics for Mobile Games")


