
From time to time, we make Monday or even New Year resolutions about going to the gym more often, then really buy a membership and start training. Some people quit after the first session and first muscle pain, others work out for the whole month to see their money well spent, but some people settle down and for many years working out in the gym in the evenings.
The situation with mobile apps is exactly the same - most people stop using it as soon as interest or need disappears, while some use it for years.
This is an indicator of the demand and interest of users, as well as a guarantee of their financial activity.
What is Lifetime
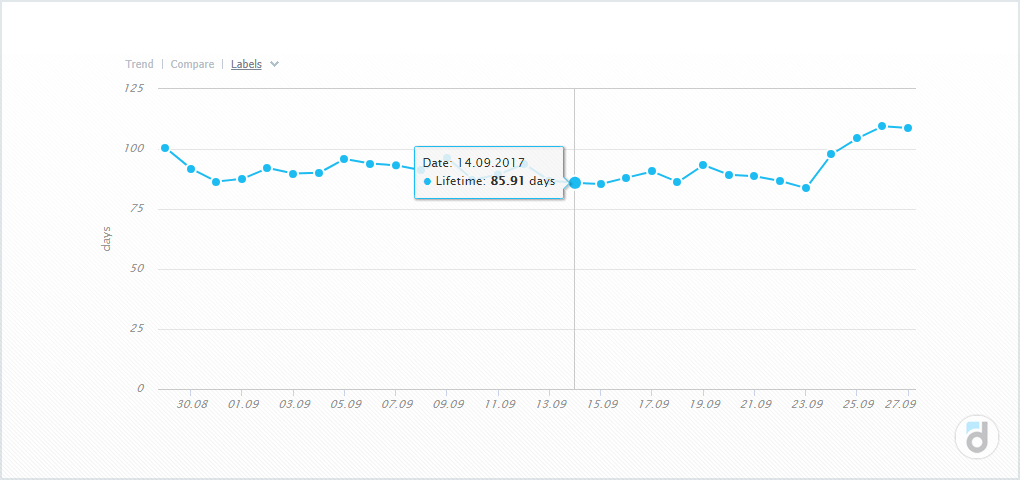
Lifetime (LT) is a metric that explains the process we have described above and shows the average time a user stays active in the project. By activity here we don’t mean daily visits, but the amount of time that has passed between the first and last launch of the application.
How to calculate it
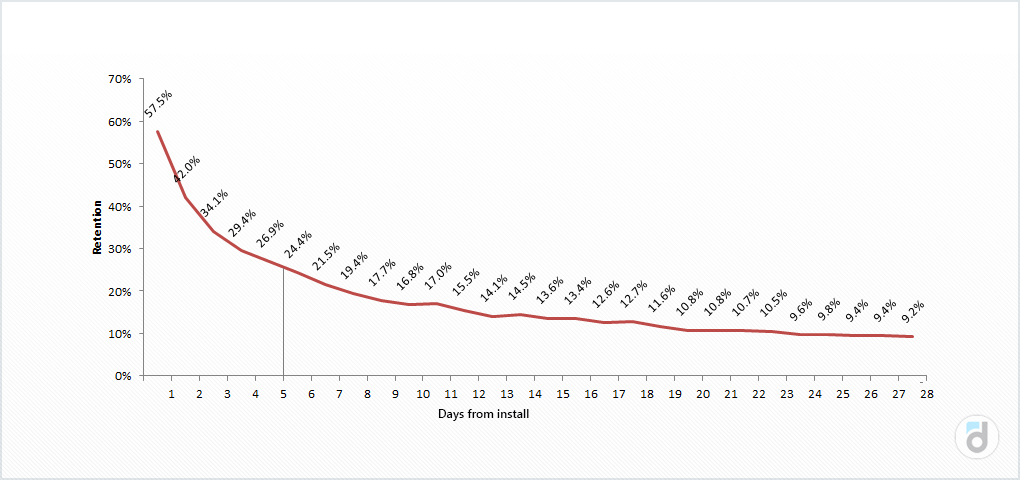
We usually calculate Lifetime for cohorts and the more time passes from the installation the fewer users from the cohort keep on using the product. The largest outflow usually happens on the first days. It looks like a graph of the retention metric:

There are several ways of calculating Lifetime. Perhaps the most precise is the following: you take a cohort of users, wait until they all completely stop using your project, and calculate the average amount of time they have spent in the project before leaving.
You can take a free online course on Game Analytics to get a better understanding of all these metrics
For example, there is a cohort of 100 users, and we know how many days they spent in the project before they left it:
|
Number of users |
Number of days in the project |
|
30 |
1 |
|
20 |
7 |
|
10 |
14 |
|
10 |
18 |
|
10 |
22 |
|
5 |
31 |
|
5 |
40 |
|
5 |
45 |
|
5 |
54 |
In this case, their Lifetime equals 15.6 days.
But you can not apply this method to real life because you will need to wait for too long and you can’t always draw a conclusion based on only one cohort.
Therefore, it is common to evaluate the Lifetime, rather than calculate it. While evaluating it is necessary to take into consideration additional information such as the retention rate.
Read more: Map of Key Analytics Metrics in Games
One way to evaluate Lifetime is to consider people inactive in the app for 7, 14, 30, etc. days as churn. It means, you set the criterion of the “no return point”. It is usually one or two weeks of being inactive. We at devtodev (see our pricing) use this method of evaluations Lifetime, while as the churn point we take 7 days of inactivity.
Another, slightly more complicated method of evaluating Lifetime is to calculate the integral of the Retention function (since Lifetime is the area beneath the retention curve) or to simply sum all the retention figures. To do this, you need to know the retention values for several days. You need as many values as possible because it influences the accuracy of the calculated Lifetime.
Read more from our Main Metrics article series: Sticky Factor
For example, we have retention values for the first 28 days. By summing them we get a lifetime value of 5.05.
How to use it
We need to keep in mind that Lifetime is an average figure, i.e. it doesn’t mean that most users leave the project in the set number of days.
That’s why this metric is very useful - it provides the overall picture of the product in just one figure.
Let’s assume that we managed to increase the retention of the first days during experiments, but from day 5 it started to decline.
Read more from our Main Metrics article series: Active Users (DAU, WAU, MAU)
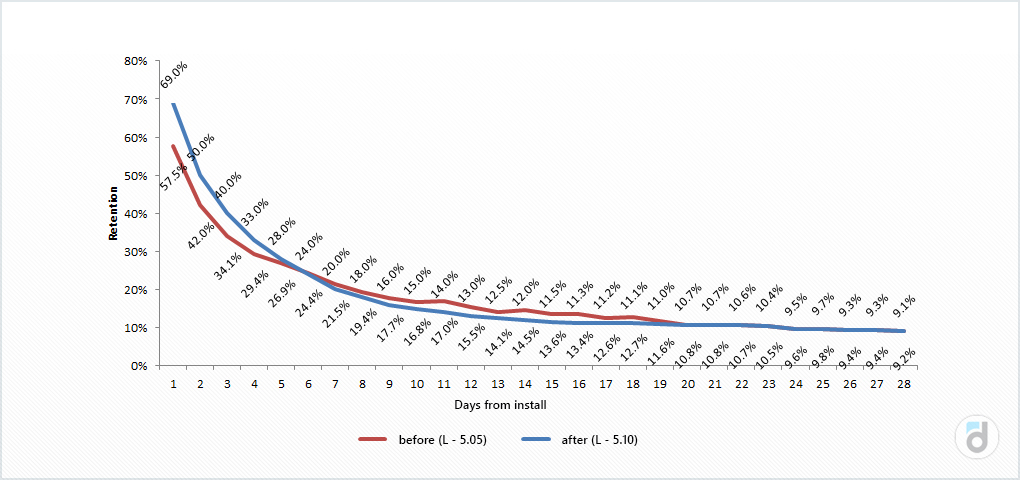
What part of the retention curve influences the project the most? Does the increased retention of the first days compensate for the more prolonged decline which starts on day 5? When we get such a mixed result, we may have difficulties with the evaluation of the effectiveness of the changes. Lifetime may help us to draw this conclusion because it takes into account all retention values. If we calculate it for the example above, we will see that the change positively affected the project.
When working with Lifetime, you should pay attention to segmentation. Moreover, you can segment in two directions: use standard segments such as country, device, or divide users by the time they spend in the application (on the Lifetime itself). It means that you can separately analyze and evaluate the behavior of users with a Lifetime of less than one week, or from one to two weeks, or from two weeks to one month, etc. Probably, user behavior in these segments will be different and if you examine each group, you may find your app’s bottlenecks and reasons for the outflow.
You can use this metric to estimate the time when a user churns the project. If you know it, you can try to change their behavior: offer a discount, send push notification (you can use devtodev for it), change something in the app to make them stay there longer.
Read more from our Main Metrics article series: Downloads
Difference between Lifetime and Lifetime Value
Lifetime is closely connected to lifetime value (LTV) - another metric, which shows us the amount of revenue gained from one user for their lifetime in the project. It seems that Lifetime is not a financial metric because we estimate it in days and not in monetary terms, but it still influences the income. The bigger the Lifetime value is the longer a user will keep on making payments. This is especially important for subscription services because every user makes scheduled and stable payments.
The longer the lifetime of those users is, the longer they will pay and the more revenue they will produce.


: The Basics")
: The Basics")


 in Mobile Games")
 in Mobile Games")


")
")


")
")


")
")


 Tactics for Mobile Games")
 Tactics for Mobile Games")


