
In this article, we are going to talk about Churn Rate - a metric, which influences both the company’s finances and possibilities for growth. Churn Rate measures user drop-off. This is one of the most important product metrics because the audience size and hence the income depend on its values: the bigger the audience is the more paying users we have.
The more users we have in a project the more viral it is. It again promotes audience and income growth because more people will talk about the project with their friends and colleagues.
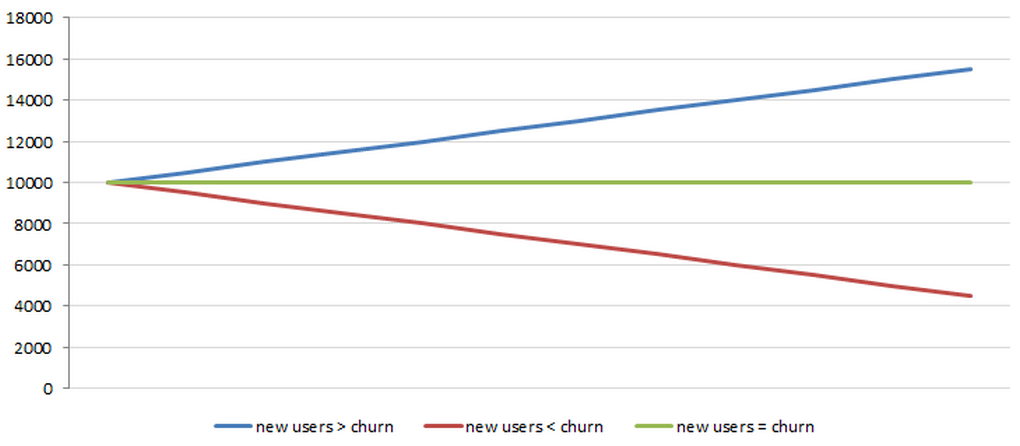
We often use Churn Rate as a supplementary tool for calculating such financial metrics as Lifetime and Lifetime Value, but we can also use it independently. If users leave an app and new users do not recover this churn then the audience size is going to slowly decline.
In this case, we calculate churn in users. It means that we measure the number of people who left the service. Here it is important to specify who do we regard as a left user: is it someone inactive for 7, 14, 30 days, some months, or maybe the whole year? We customize it for every app depending on its type. It highly influences the total Churn Rate because the shorter the chosen inactive period is, the faster the metric will react to changes and the more unstable it will be.
We can also calculate “dropped off” subscribers. This is the method primarily used by subscription services. This kind of Churn Rate we often measure in percentage by the following formula:
Churn Rate = (number of users at the beginning of period - number of users at the end of period) / number of users at the beginning of period * 100%
For example, if we had 200 subscribers at the beginning of the month and only 180 of them renewed their subscription for the next month, then the Churn Rate will equal 10% ((200-180)/200*100%). By doing so, we don’t take into consideration new users who subscribed this month.
For subscription-based apps, we can calculate Churn Rate by months, quarters, or years. But we can also apply this metric to any application and calculate it for any given period. In this case, in the formula, we will use the number of all people who left the service and the specified period of inactivity which we take as a sign of churn.
You can take a free online course on Game Analytics to get a better understanding of all these metrics
When we talk about lost subscribers, we can calculate Churn Rate in monetary terms (in this case we call it MRR Churn Rate):
MRR Churn Rate = (MRR for the previous period - MRR for the current period) / MRR for the current period,
where MRR or Monthly Recurring Revenue, is the regular monthly income (often from subscriptions).
This rate shows the amount of money lost for the assessment period. Let’s take a look at an example of the difference between user churn and revenue churn.
|
1 period |
2 period |
Churn |
|
|
Number of $2 plan subscribers |
60 |
50 |
17% |
|
Number of $10 plan subscribers |
20 |
10 |
50% |
|
Total amount of subscribers |
80 |
60 |
25% |
|
MRR |
$320 |
$200 |
38% |
Even though the number of subscribers declined by 25%, the loss in income came out to be much more - 38%. That’s why it is important to control both rates.
We have to keep in mind that when we deal with subscriptions we count as churn both left users and those who switched to a less expensive plan. The latter group starts paying less but stays within the service.
Read more: 20 Best Books for Game Analysts
We often compare Churn Rate with a leaky bucket: we pour in water (new users) but it leaks through the holes in this bucket (churns). So, if we want to keep water (project audience) inside we have to either lessen the outflow or pour in tons of water which can be costly.
It is possible that many new users come to an app but they don’t stay for too long (churn is much bigger), no one pays and the effort we made to acquire them does not pay off. This situation will definitely influence your income.
Let’s take a look at an example. An app has a certain number of paying users, then we buy some more but in the meantime, there is also a churn. Here is how it influences financial metrics:
|
Metric |
1 period |
2 period |
3 period |
|
Paying user base |
10 000 |
9 400 |
8 860 |
|
Churn, % |
10% |
10% |
10% |
|
Churn, number of paying users |
1 000 |
940 |
886 |
|
Number of new users |
2 000 |
2 000 |
2 000 |
|
Conversion into purchase |
20% |
20% |
20% |
|
Acquisition price |
$0.5 |
$0.5 |
$0.5 |
|
Cost of subscription |
$2 |
$2 |
$2 |
|
Acquisition cost |
-$1,000 |
-$1,000 |
-$1,000 |
|
Income from new users |
$800 |
$800 |
$800 |
|
Income from paying user base |
$20,000 |
$18,800 |
$17,720 |
|
Outflow because of left users |
-$2,000 |
-$1,880 |
-$1,772 |
|
Total |
$17,800 |
$16,720 |
$15,748 |
If we want to correct this downtrend and increase the income from period to period, then we can do the following:
-
Decrease the cost of user acquisition (but in our example even if the cost drops to $0 the downtrend will continue anyway).
-
Increase new user’s conversion into a purchase (to elevate the trend we need to increase it for a minimum of 150% to 50%).
-
Decrease Churn Rate (for 60% to 4%).
In this example, we see that the Churn Rate requires fewer changes than other metrics.
Besides the general Churn Rate, we can also calculate Churn Rate for a certain period of work with the app. This approach is particularly true for games and educational apps with levels or benchmarks which users have to complete.
Here is an example of how users “fall off” on different stages of a game:
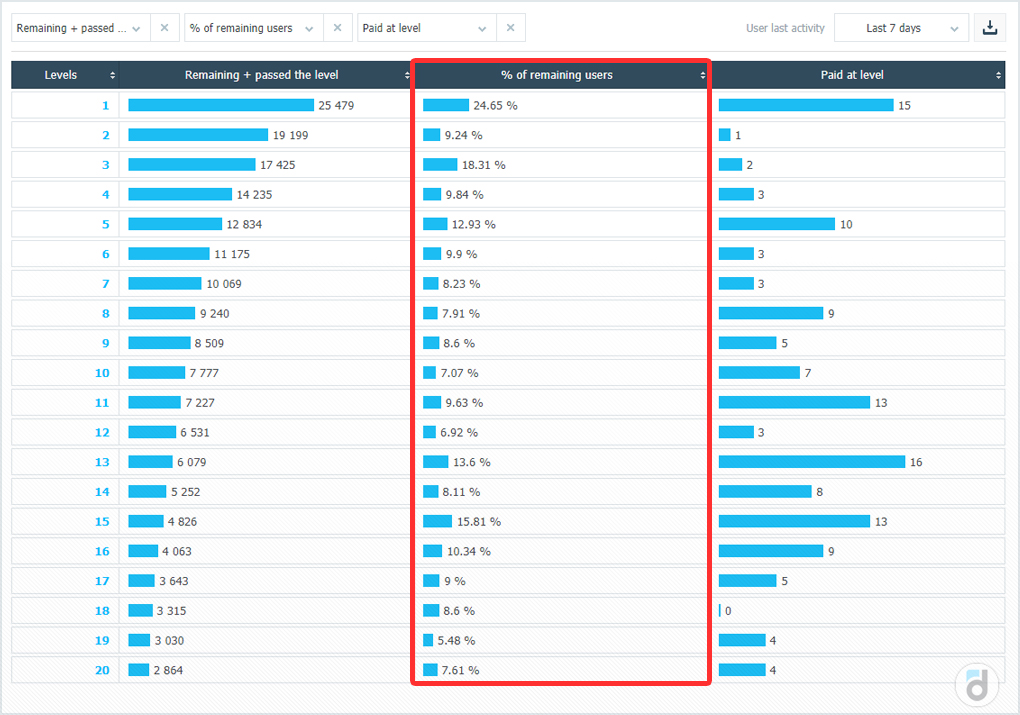
This is a devtodev report showing the percentage of users who remain on different levels of a game
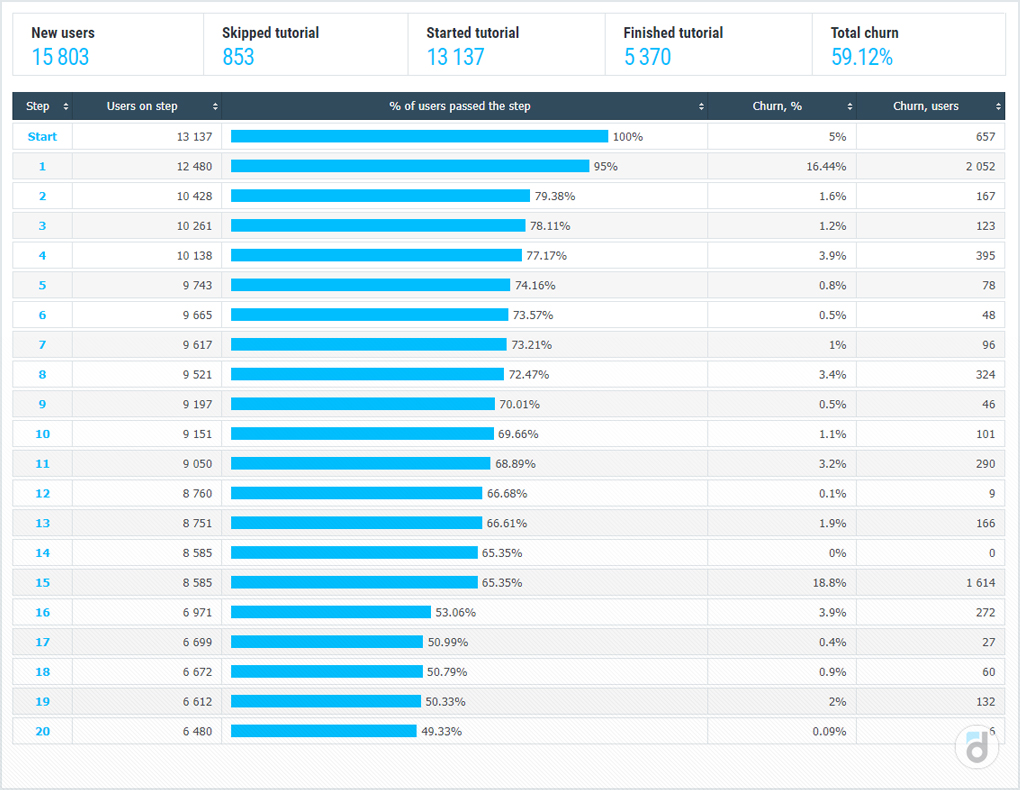
Or even on tutorial steps
Our experience: when we know our churn points, we can experiment and try to prevent it so that we can keep users in the product.
What can be a reason for user outflow?
-
First of all, it is the quality of the product, its convenience, and user utility. If the product meets the client's needs, then it will positively influence the Churn Rate. If their issues stay unresolved then there is a chance that the user will look for another product.
-
The price can also influence the outflow. This is particularly so with a situation when it’s too high compared to competitors. In the meantime, if a user already appreciates your product and uses it regularly (see the previous point) then the price may take a back seat.
-
An influx of off-target audiences may raise Churn Rate because in this situation we will get the users who expect to see something different from the experience they get after installing our app.
-
Churn can be caused by launching an app in a crowded market with many similar products which already captured the audience. In this case, potential users already formed their vision of a product suitable for them and they can choose from many offers around.
-
If you created a game with either too easy or too difficult speedrun, it will lead to failure too. In the first case gamers will get bored after finishing some levels and in the second case, they will get no pleasure from it.
-
The market appearance of a new supplier providing the same services may lead to audience shrinkage (especially if their price is more appealing).
-
An abundance of advertising in the project or regular bugs can also lead to churn.
Read more: 25 Key Metrics to Track User Loyalty
How to lower Churn Rate
Methods of fighting churn come from its causes. It is important to understand what exactly making users leave a project and at what moment does it happen.
Churn Rate is, in fact, the reverse Retention metric. It means that if we want users to stay in the project we have to think about making them come back. We can do it using the following ways:
-
Make the right impression during the first session in the app. It often influences the fact whether or not a user comes back and it also shapes the Retention (and churn accordingly) of the next days. We have to use the first session to show the app’s possibilities and advantages, to spark a user’s interest in our product.
-
Look through app reviews to understand why users are unhappy about it and what else they would like to see in the app.
-
Remind users about the product, inform them about new functions, bonuses, personal offers with push- and email messages.
-
If we created a game we need to make various difficulty levels to support user interest.
-
Be better than competitors, study client’s needs, theirs change, develop and improve the project.
No doubt that Churn Rate is a very important metric for any product because it shapes the auditory size, points at demand among users, and clarity of the project and directly influences the income. That’s why all the effort we put into fighting the churn will definitely pay off in terms of financial metrics.


: The Basics")
: The Basics")


 in Mobile Games")
 in Mobile Games")


")
")


")
")


")
")


 Tactics for Mobile Games")
 Tactics for Mobile Games")


