
What is Cumulative ARPU, how does it differ from the regular one, how to calculate and use it? Team devtodev is ready to explain all these things.
In this article, we'll take a look at a metric that will be very useful for estimating the traffic quality and choosing the optimal CPI (Cost Per Install). It's Cumulative ARPU.
This metric is calculated just the same as the regular ARPU: you need to divide revenue by the audience, but it has one very important feature which distinguishes it from the regular ARPU and makes it useful for analyzing the traffic.
Cumulative ARPU is calculated not for a whole audience but for a specific cohort of users. This cohort is made up of users who installed the app during a certain period of time (it's most convenient to use daily or monthly cohorts).
This metric increases daily for a single cohort, that's why it's called “cumulative”.
Lay your hands on the metric in devtodev DEMO
How does it happen?
Let's say we decided to analyze users who installed the app on 01/01/2017, e.g. 1,000 people. On their first day, they made certain purchases and total revenue was $800.
Day 1 cohort’s ARPU is $800 / 1000 = $0.8.
We'll use the following table to keep records:
Cohort's size 1000
Day from install
| 0 | 1 | 2 | 3 | 4 | 5 | 6 | 7 | 8 | 9 | 10 | 11 | 12 | 13 | 14 | |
| Revenue | $800 | ||||||||||||||
| ARPDAU | $0.8 |
The next day, some of the same users made purchases worth $500. No matter how many of them returned to the project and how many of them made purchases, the size of the cohort that we divide the revenue by is always 1,000 users.
Read more: Accurate LTV Prediction using Machine Learning Model
We can already calculate the cumulative ARPU. It will be a sum of day 0 (day of install) and ARPU Day 1.
Cohort's size 1000
Day from install
| 0 | 1 | 2 | 3 | 4 | 5 | 6 | 7 | 8 | 9 | 10 | 11 | 12 | 13 | 14 | |
| Revenue | $800 | $500 | |||||||||||||
| ARPDAU | $0.8 | $0.5 | |||||||||||||
| Cumulative ARPU |
We calculate the remaining days in the same way.
Cohort's size 1000
Day from install
| 0 | 1 | 2 | 3 | 4 | 5 | 6 | 7 | 8 | 9 | 10 | 11 | 12 | 13 | 14 | |
| Revenue | $800 | $500 | $350 | $220 | $150 | $100 | $85 | $75 | $70 | $60 | $45 | $30 | $20 | $15 | $10 |
| ARPDAU | $0.8 | $0.5 | $0.4 | $0.2 | $0.2 | $0.1 | $0.1 | $0.1 | $0.1 | $0.1 | $0.0 | $0.0 | $0.0 | $0.0 | $0.0 |
| Cumulative ARPU | $0.80 | $1.30 | $1.65 | $1.87 | $2.02 | $2.12 | $2.21 | $2.28 | $2.35 | $2.41 | $2.53 |
Here's the final formula which calculates the Сumulative ARPU:
Cumulative ARPU for N days = Revenue (of a selected cohort for N days) / Number of users (within the selected cohort)
The Cumulative ARPU Day N is equal to the revenue made by this cohort within N days and divided by the number of users within this cohort.
A typical chart of the cumulative ARPU looks like this:
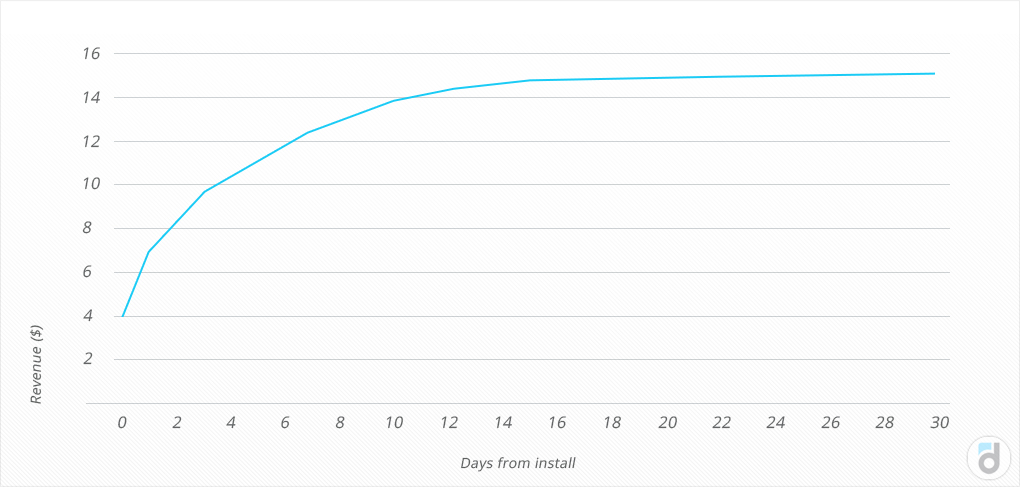
This metric can only grow with time, as the more time users spend in a project, the more they pay. If at some point they stop paying or using the product at all, then after reaching a certain level this chart will become a horizontal line.
Why is this metric interesting?
First of all, it allows you to find out which revenue a user will bring on day 7, or day 30, or even 3 months after the date of install. In other words, you'll be able to predict when and how much money a new user will bring.
Read our free ebook on lifetime value
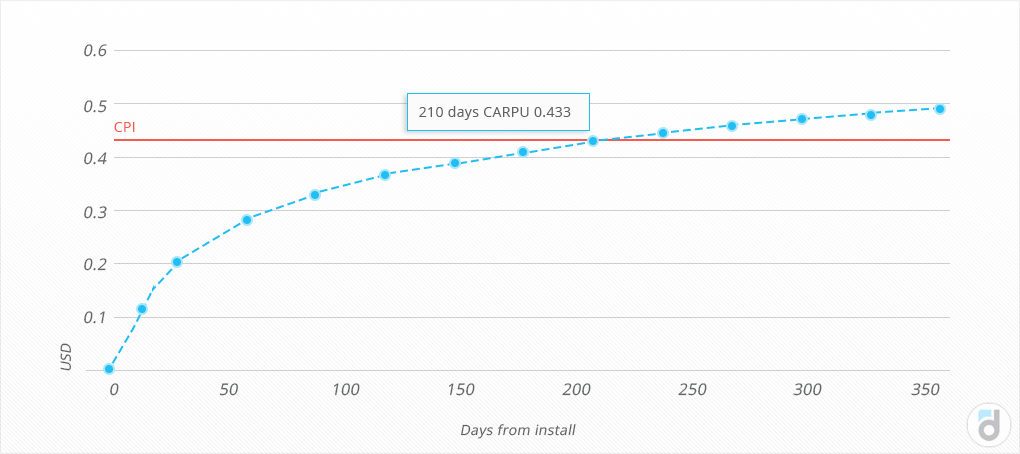
And it leads to its second advantage. This metric is really useful for estimating traffic quality and its payback period, as it's important to know when users start to bring more money than you've spent acquiring them. It is the moment when the Cumulative ARPU becomes equal to CPI (Cost Per Install).
If you know the Cumulative ARPU of a cohort for, let's say, the 365th day (or any other subsequent day), it's already possible to talk about the average revenue per user during the project's lifetime -this metric is called Lifetime Value, LTV or CLV).
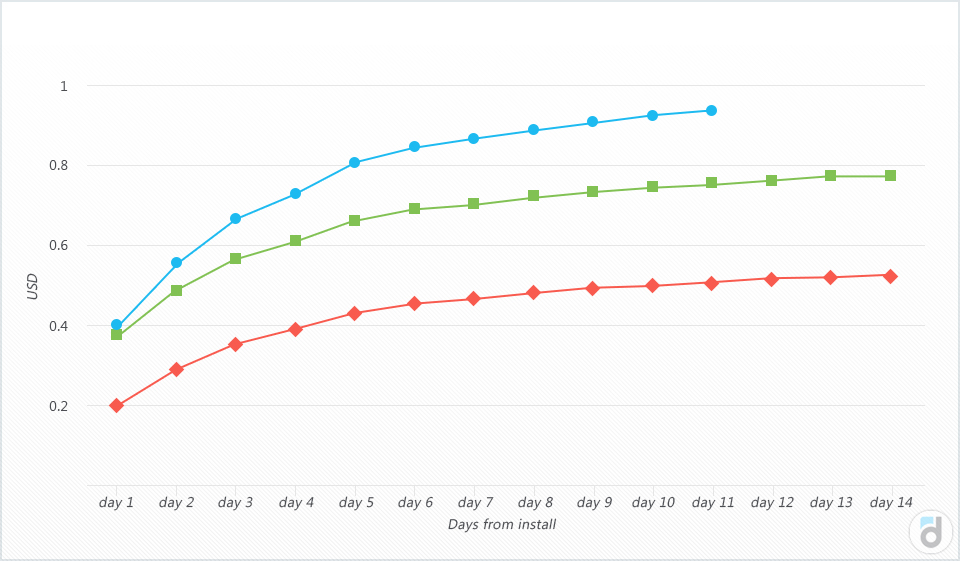
And here's one more advantage of this metric: due to the peculiarities of calculation, cumulative ARPU allows you to compare different cohorts, which is especially convenient when you make any changes to the product.
Read more: A Simple Guide to Analyzing Paid Traffic and Avoiding Fraud
In this case, you can compare the dynamics of the Cumulative ARPU for these two cohorts: those who installed the app before the changes were made versus those users who installed the app after the changes to see how the changes affected payments.


: The Basics")
: The Basics")


 in Mobile Games")
 in Mobile Games")


")
")


")
")


")
")


 Tactics for Mobile Games")
 Tactics for Mobile Games")


