
Regardless of the type of the product, measuring user loyalty remains one of the most important questions for product’s success:
- Are my clients happy?
- Is the level of their happiness this month higher than it had been in the past?
- How much money does their happiness bring me?
Product managers ask this kind of questions all the time. In this article devtodev analysts Vasiliy Sabirov and Vera Karpova guide readers through metrics of user loyalty and explain when they should be used.
But at first, what is user loyalty?
Some would define loyalty as user happiness, their satisfaction. Is a gambler loyal to a slot machine? Perhaps, yes. Is he or she happy? Unlikely.
Are customers loyal to a product-monopolist? Yes. Are they happy considering the fact that there are no alternatives on the market?
This question is even more difficult to answer from the analytical perspective. There is no such metric as loyalty, therefore measuring it can be quite challenging.
So let’s define loyalty through activities of loyal users:
- Loyal users remain in the product for some time.
- Loyal users pay. If they pay and stay in the product, it is very likely that they will pay again.
- Loyal users share information about the product and recommend it to their friends.
- Loyal users give feedback and openly share what they like and dislike about the product.
It is possible to define some groups of metrics that quantify these activities:
- retention metrics
- monetization metrics
- virality metrics.
Let’s look at each of them in detail.
Retention Metrics
First of all, we are speaking about classic retention:
- day 1 retention - share of users that return to the app in 1 day after the first launch. This metric shows users impressions from their first session: whether they like the visual style of the project, understand its purpose and are interested in it.
- day 7 retention - share of users that return to the app on the 7th day after the first launch. These users have figured out the project and understood its basics.
- day 28 (30) retention - these are long-term users, who know your project and most likely will continue using it.
Retention is not limited to these intervals (1, 7 and 28 days). However, they are the most used benchmarks on the market. Even the famous retention rule “40-20-10” (average retention values of a successful project) is based on these time intervals.
It is also possible to calculate retention for other days. For example, day 3 retention is used as an interim indicator between day 1 and day 7 retention.
Sometimes it makes sense to calculate the retention for longer time intervals. SaaS and GaaS (game as a service) projects, which imply long-term retention, may require analysis of retention for 3, 6, 12 months and even several years.
When working with the retention, it is important to understand whether your calculations are based on calendar days (in this case day 1 retention is the share of users that return on the next calendar day) or hours (when users return 24 hours after the first launch). This difference is especially relevant for projects, whose audiences are spread across different time zones. In this case the retention calculated by hours will give more accurate results.
In devtodev we have implemented both options - the retention by calendar and by 24h intervals:
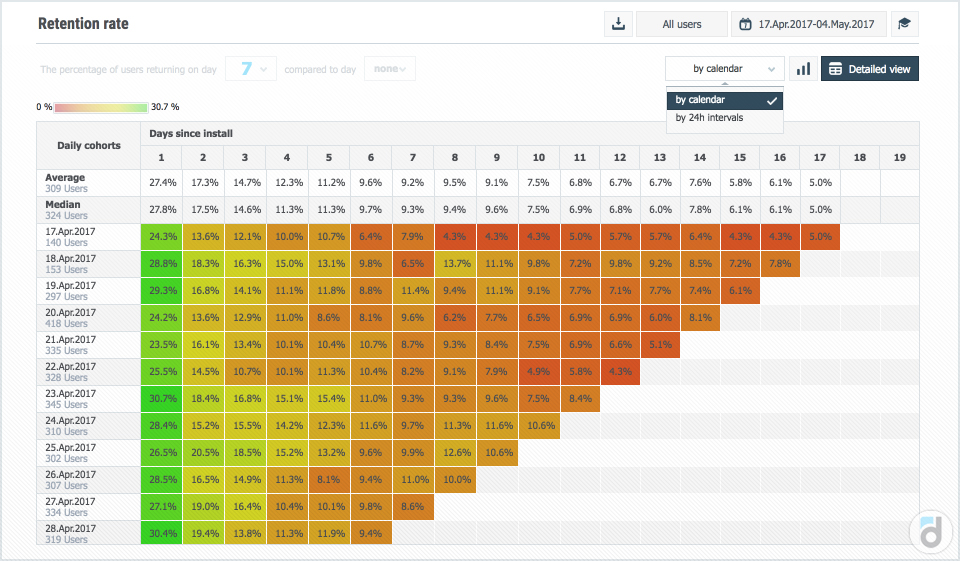
Sometimes it makes sense to work with day 0 retention - the share of users that have visited the app for the second time during 24 hours since the first launch. This quick metric is great for monitoring changes related to the first session.
One more important tip. The fact that users don’t return to the app on the 7th day after the first launch doesn’t mean that they are not loyal. Maybe, they were on a holiday or busy finishing their business project. It would be wrong to exclude them from your loyal user base.
To deal with this, there has been created a metric called rolling retention. It is calculated almost the same way as classic retention with one important note: day 7 rolling retention is the share of users that return to the project after 7 or more days after the first launch. This means that rolling retention ≥ classic retention.
Here is how they are interrelated:
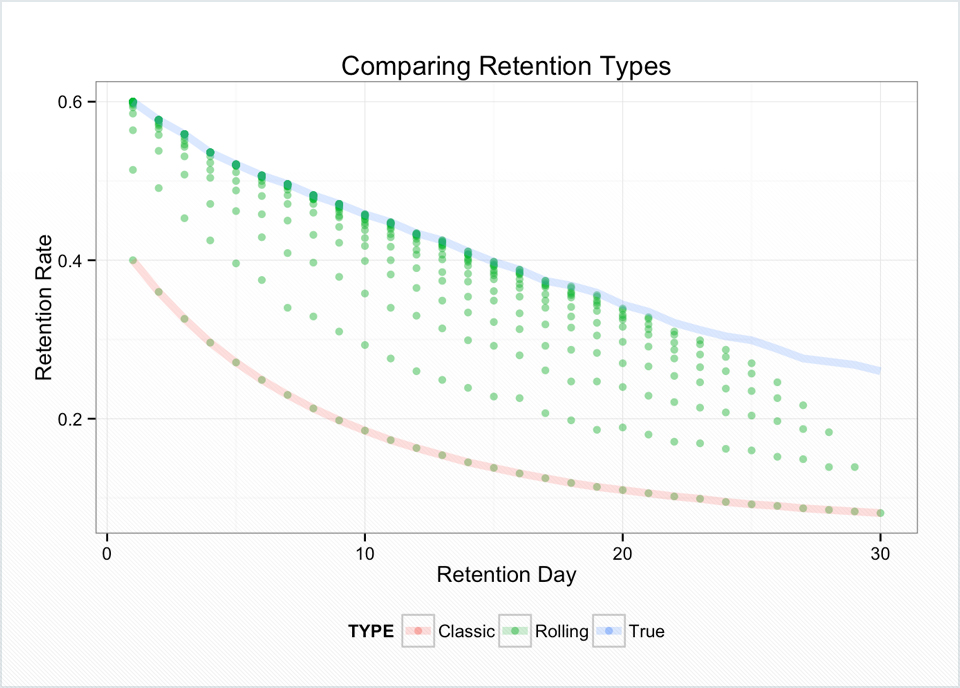
It’s quite possible that some changes in your app will decrease day 1 retention, whereas day 7 retention will rise (for example, you can increase the complexity of the tutorial to get rid of the non-targeted audience).
How can we understand whether this update is better than the previous version? There has to be some metric that brings together all retention indicators. This metric is called lifetime.
Lifetime is the metric that shows how many days on average users spend in the project. It is calculated as a retention line integral (here some school knowledge would be very helpful). However, it might be easier to explain how to calculate lifetime in the following way:
- Select time interval of inactivity, the end of which will mean that the user has left the project (it can be one or two weeks, a month, etc);
- Every day mark users that are considered to have left the project on this day (by the way, the share of such users is called churn rate - and unlike most metrics it should be minimized, not maximized);
- Measure how long these users stay active in your app - from the first to the last launch. The average value is the lifetime. The more users and the larger time period you take for the analysis, the more accurate the results will be.
Lifetime is not a quick metric, so you have to wait some time to be able to calculate it. However, by measuring it regularly, you will see how user loyalty to your project changes over time.
Here is one more retention metric - sticky factor. It is calculated as average daily audience divided by average monthly audience. Easy to guess that this value can vary from 3% to 100%. As a rule, the sticky factor of successful projects is higher than 20-25%. This is the indicator of how “sticky” your project is, or how regularly users open it.
The higher the sticky factor is, the better. Our researches show that this metric has a strong correlation with the share of paying users. Measure sticky factor every month and make conclusions regarding the changes in the quality of the product.
Monetization metrics
The key monetization metric that indicates user loyalty is ARPU (average revenue per user). ARPU is calculated as the revenue divided by the audience. This metric is often used in conversations between developers during conferences to compare apps’ success, no doubts you will be asked about this metric by your partners or investors.
Usually ARPU is calculated for one month (your monthly revenue divided by MAU), however it is possible to take any other period. For example, ARPU for one day (which is calculated as daily revenue divided by DAU) is called ARPDAU. This metric has strong seasonality and depends on the day of the week.
Another indicator of user loyalty is ARPPU (average revenue per paying user). ARPPU is calculated as the revenue divided by the number of paying users. As you see, ARPPU is the indicator of paying users’ loyalty, their reaction on prices in your project and its value.
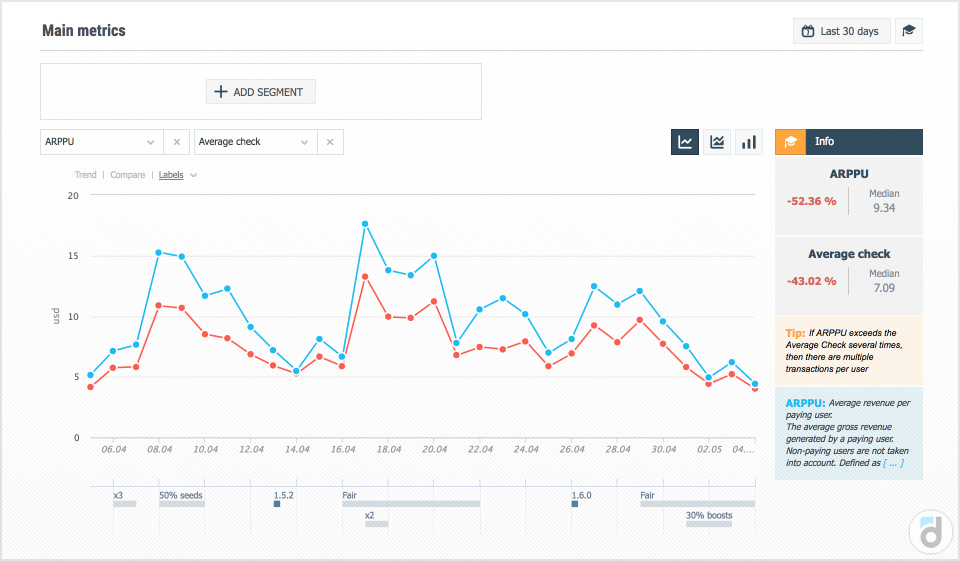
Don’t confuse ARPPU and average check: average check shows only the size of a transaction, whereas ARPPU includes repeated payments. By the way, when looking at the revenue structure of many projects, repeated payments constitute the biggest part of the revenue. Therefore, it is crucial to make paying users like what they pay for, so that they are willing to pay again.
ARPU, ARPPU and ARPDAU are slow metrics, and they work well only if you have stable audience.
If you need to evaluate the quality of, let’s say, a new version of the project, we recommend to use the indicator of cumulative revenue. The cumulative revenue for N days shows how much money on average a user pays during his or her N days in the project.
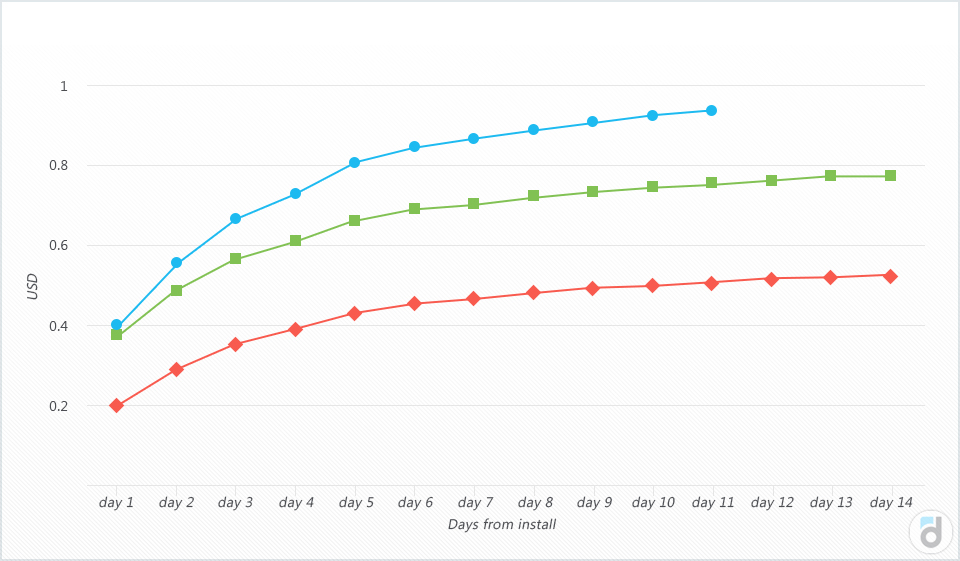
In the beginning, this metric grows quite fast (until users start to churn or run out of money). Then its growth slows down, and the graph becomes flatter. The limit of the graph for large N values is LTV - the total revenue that a user contributes over their life in the project.
LTV is a slow metric, which requires some time to pass since users registration. However if you measure LTV regularly (once a month), you will get an idea of how things are going on in your project and how its quality changes over time.
LTV is the metric that counts both retention and ARPU. There are several ways to calculate LTV: the most popular one implies taking the integral of retention (lifetime) and multiplying it by ARPDAU. Thus, LTV is an excellent metric that shows users loyalty, but requires some time to work with it.
One more monetization metric is the paying share. It is calculated as the number of paying users for the period divided by the total audience for the period.
The paying share is a useful metric that shows user loyalty to your product. However, there are a couple of other related metrics that are even more informative:
-
First payment conversion - the share of users that registered in the project at a particular time and have made at least one payment by the current moment.
-
Repeated payment conversion - the share of users who registered in the project at a particular time and have made more than one payment by the current moment. Our researches show that the probability of the second payment is higher than of the first, as well as the probability of the third payment is higher than of the second. Also, repeated payments constitute the biggest part of the revenue.
Finally, you need to measure how fast users make payments (it is particularly relevant for the first payment). When you know this data, you can create promotions at the right moment to attract users’ attention and increase chances that they will pay.
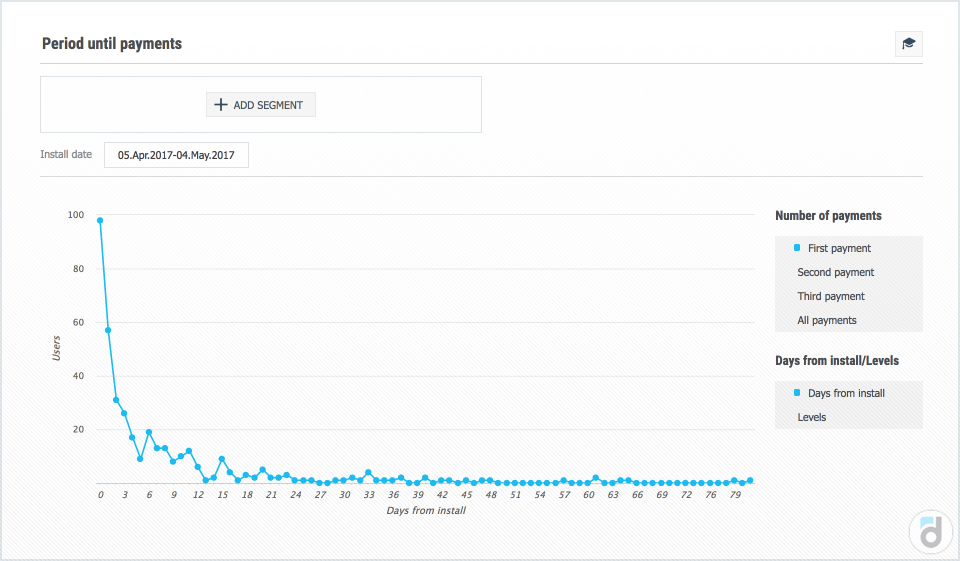
With devtodev you can measure the average time before the first, second and third payment. The same report can be built not by days, but by levels to better understand the patterns of user behaviour.
Virality metrics
If the project is viral enough, users are willing to share it with their friends, their friends invite other people and so on. The viral project can conquer the market very quickly.
The indicator used for measuring the virality is borrowed from epidemiology and is called K-factor. It shows how many friends on average one active user brings into the project. It can be calculated in several different ways, but we propose you the following formula:
K-factor = (organic downloads for the period n+1) / (active users for the period n)
What is the period in this formula? It can be a week, month, year or any other period, which you define for yourself. This metric is not used for benchmarking (because it is not clear how other people calculate it and for which period), but the K-factor is very useful when you look at its dynamics and try to explain its growth and decline.
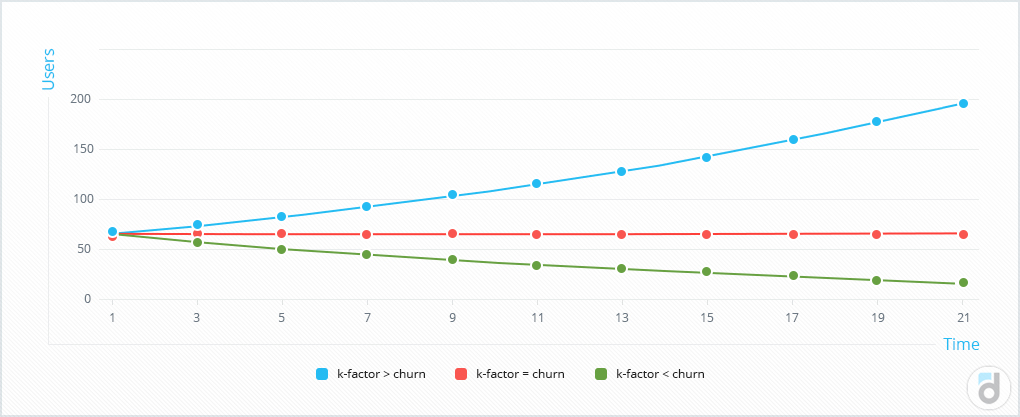
It is very important that the K-factor is bigger than your churn rate. If it is so, the project will grow exponentially. If the K-factor is less than the churn rate, the audience is going to gradually decrease. When comparing both metrics, it is important that their values are calculated for the same period!
There is one more metric called the viral cycle (average time since the moment when one user comes to the project till the moment when their friend comes). The smaller the viral cycle is, the better. Let your users share the information about the project as soon as possible!
Specific metrics for game projects
In this part we are going to look at a couple more metrics designed specifically for game projects. How to measure user loyalty at a particular stage of the game / on a particular level? There are several options.
First of all, churn rate of the level. If players don’t like the level or it is too complex for them, they leave it. Your task is to understand what preceded this step, on which level the player was and how many attempts to pass the level have been undertaken.
Secondly, achievements. Achievement is a player’s reward for a particular action in the game. When achievements are distributed among levels in right proportion, they bring joy to the players and allow analysts to measure how many users have reached a particular level and received their portion of endorphins.
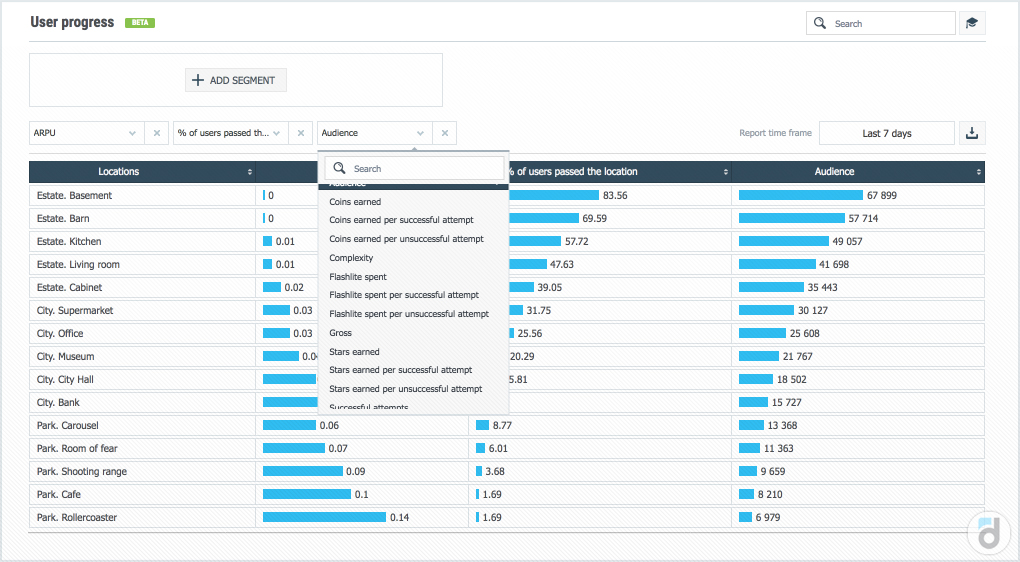
Thirdly, stars, virtual currency and any other quantity indicators that are received upon the level’s completion. These indicators on their own are not enough to make reliable conclusions, however when used in a combination with the churn rate or ARPU of the level, they allow you to better understand why users like or dislike a particular part of game experience.
In devtodev we have reports that allow you to measure any indicators of level’s completion both in general and recalculated for (un)successful attempt.
Finally, FUUU-factor, which shows player’s negative emotions. Most references to this metric lead to the Wooga’s performance at the GDC conference in 2014. Therefore, it may well be the case that this popular metric has been invented by this company.
FUUU-factor = (the number of attempts for level’s completion) / (the number of attempts when the level has been almost completed)
Let’s say, it has taken 100 attempts to pass the level, and only 5 of them have been close to winning. In this case the FUUU-factor will be equal to 20, which is a very high value. Wooga recommends to get rid of levels where the FUUU-factor is higher than 10.
User loyalty index
What are other ways to learn whether users like your project? Simply ask them!
The most popular method of measuring user loyalty based on surveys is Net Promoter Score (NPS) - the index of user loyalty.
It works in the following way:
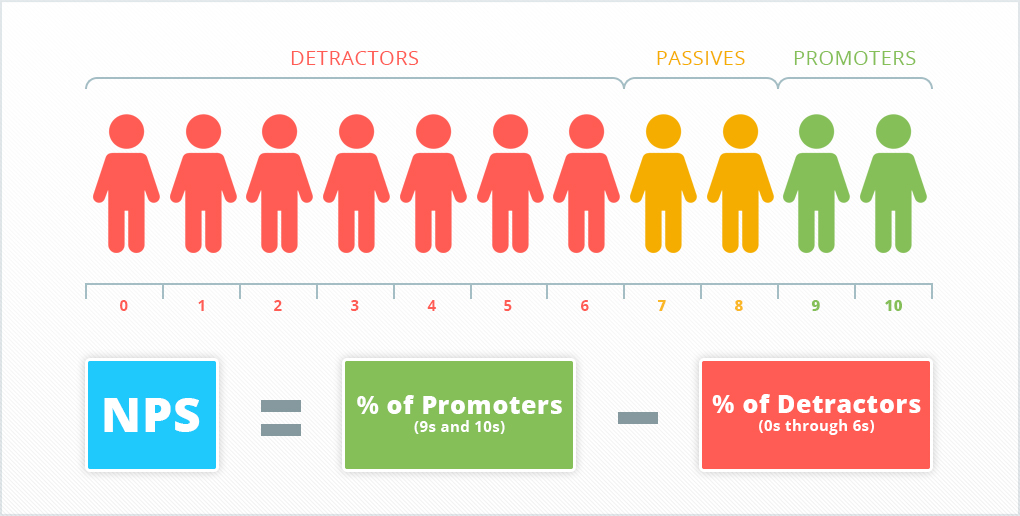
- you ask users to evaluate the probability that they share information about the project with their friends, from 0 to 10 (I bet at least one project have asked you this question!)
- calculate the share (%) of promoters - users that are very satisfied with your project and gave you 9 or 10
- calculate the share (%) of detractors - users from whom you received negative evaluations (6 and less)
- by subtracting the share of detractors from the share of promoters you get Net Promoter Score.
It’s quite a simple and effective method used by many developers. Let’s find out if it is as good as it seems to be?
NPS advantages:
- it can be easily calculated
- it can be easily interpreted: NPS - is a pure (excluding detractors) share of users that are ready to be viral, which means it is a good indicator of loyalty
- there are lots of benchmarks based on NPS for different industries
- it can be easily measured in time to make conclusions about quality changes in the product
- as a rule, it correlates with the growth of the business.
NPS disadvantages:
- "sharing with friends" is not a real action, but an imaginary experiment conducted by users on your request; not everyone who gave you 9 or 10 will share your product in real life;
- NPS is an indicator of loyalty, not money - so it should be considered together with revenue indicators;
- simplicity of calculation leads to tunnel vision - narrow view and wrong interpretation of the reality.
Don't forget that it is better to use NPS together with other metrics!
There are also some alternatives to NPS - user surveys based on a similar methodology of calculation. The main difference lies in the formulation of the initial question:
- CSAT: How satisfied are you with the product / service (right after the end of the interaction with the company)?
- CES: Do you agree with the statement: “The company gave me the opportunity / helped me to easily solve the problem”?
- CLI: How likely is it that you would recommend us to your friends? How likely is it that you would buy again in the future? How likely is it that you would try our other products?
We will not go deep into marketing and psychology, but believe me, there are loads of sources on the internet that compare these methods with each other.
To sum up, we have just looked at the following types of loyalty metrics:
- retention metrics
- monetization metrics
- virality metrics
- specific metrics for game projects
- NPS and other types of surveys.
Hope that you find these metrics helpful and start using them to increase loyalty of your users. Let your NPS and ARPU increase, while viral cycle and churn rate decline (do not mix them up!)
You can always check our Live Demo to see how all the metrics work.
Feel free to drop us a line at info@devtodev.com if you have any questions on game analytics.


: The Basics")
: The Basics")


 in Mobile Games")
 in Mobile Games")


")
")


")
")


")
")


 Tactics for Mobile Games")
 Tactics for Mobile Games")


