
LiveOps is extremely data-intensive, hence, it’s important to carefully test it in order to avoid making mistakes in your game.
An A/B test is a way to test a hypothesis. During the A/B test, we give different users slightly different, modified product (game) options, and then measure which of the options worked better, in order to subsequently roll it out to the entire audience.
Before implementing the A/B test, we need to make a plan looking something like this:
-
experiment ideas;
-
option generation (what exactly we are going to change for different groups);
-
metric choice;
-
sample preparation;
-
preliminary testing;
-
experiment;
-
interpretation of the results.
Take our free online course on Game Analytics
Experiment ideas
While doing LiveOps we often change two things:
-
text of the offer (e.g, “buy the sword” or “buy the sword now”);
-
design of the offer.
Here are some ideas for your A/B tests:
-
ASO. When it comes to screenshots, Angry Birds 2, for example, tested three theories: should there be characters or the gameplay process; should the screenshots be vertical or horizontal (people hold their phones vertically, but play this game in landscape mode); should the screenshots have frames or not (some players like frames).
-
Design (one button or two, if two - then what text do we place on each of them).
-
Call to action.
-
FTUE.
-
Description and texts.
-
Advertising.
-
Push notifications and timing.
-
Prices and promotions (we test prices less often than promotions due to problems that may arise as a result of communication between the tested groups).
-
Purchasing screen and the store itself.
-
Etc.
Deteriorating tests
Instead of doing classical A/B tests on your LiveLps events, sometimes it is more cost-effective to perform so-called “deteriorating tests”. For example, we want to add more levels to our game, but we are not sure about the results and we want to run an A/B test. The problem is that it is very time- and resource-intensive, because, for example, creating 50 additional levels takes one month of work. How do you check this theory with no extra costs? Let's say you already have 150 levels in your game. Then for one group of new players, you can reduce this number to 100, and for the second group leave all the 150 levels. This is called a deteriorating (worsening) A/B test: a test in which one group of users deliberately gets an inferior option. If you see that those players who finished 150 levels showed better results, i.e. better metrics, then you can say that, yes, really, we need to add more levels.
The same deteriorating tests you can perform on speed. Suppose you have a hypothesis that your application should run faster. Then you can slow it down for one group of users and test this hypothesis. If speed is really so important, then the people in the control group who used a normal speed app, will show better, higher metrics than those who used the slower version of the app.
Watch our webinar on Analytics and Monetization in Hyper-Casual Games
Option Generation
It seems that the A/B test can only have two options - A and B, but in fact, there can be many more since there is also multivariate testing. For example, we want to run two tests - a price test and a text test. The price is $2 or $3 and the text is “buy now” or “buy”. We can run these tests either simultaneously (two tests at the same time), or sequentially (first we carry out one, then the other). The first option will be multivariate testing. That is, we have two price options and two text options, we multiply them and get 4 options and we check them at the same time. This is convenient only if we have a small number of options. But if we have more than two of them, for example, 10 color options and 10 button size options, then we get 100 options total. In this case, there will not be enough people in each group to achieve statistical significance (read about it in the next article).
Read more: devtodev’s Map of Key Analytics Metrics in Games
Metric Choice
It is better to use the metrics to which you can apply cohort analysis. These are the metrics that tell us about the quality of the project and are tied to the specific registration date, for example:
-
Conversions of various types (for example, what percentage of users converted to payment at the end of the week, or what percentage of users converted to fifth and higher payments at the end of the month).
-
Retention of D1, D7, D30.
-
Monetization metrics, e.g. ARPU, first payment, etc.
-
Any other custom metrics that you want to influence with your test.
Take, for example, cumulative ARPU metric:
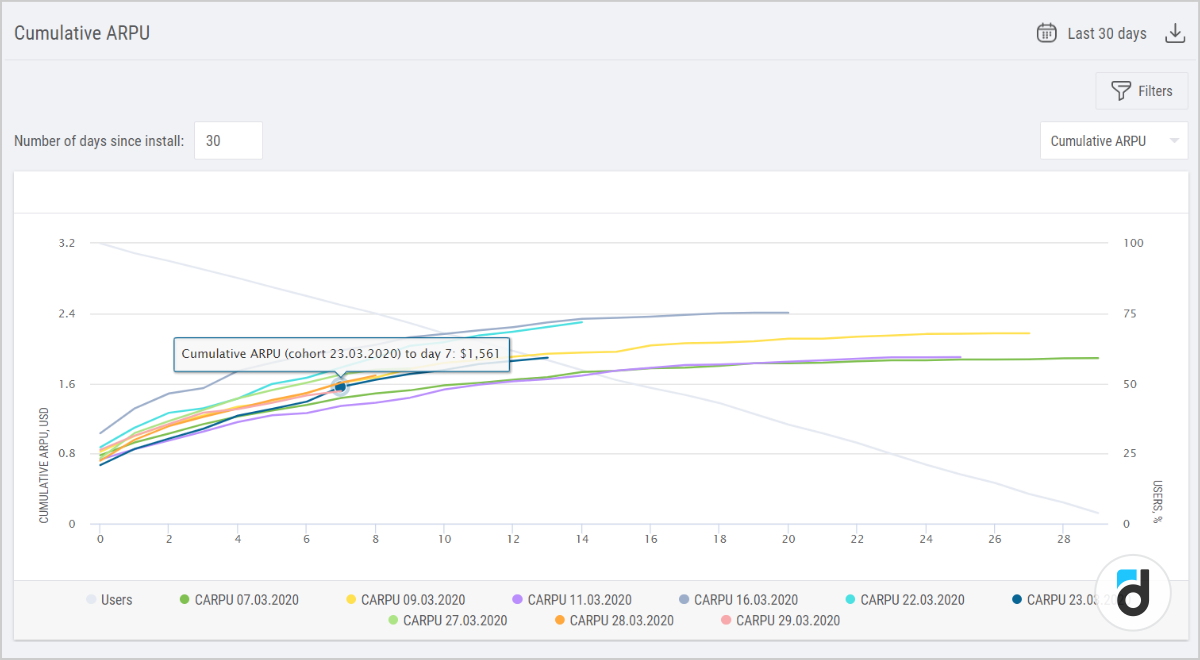
If we look at the day 7 cumulative ARPU on this chart, we can understand how much money a user pays for their first 7 days in the game. This is a very good metric, because it indirectly takes into account the retention and, at the same time, directly takes into account monetization. It all means that this metric very clearly indicates a qualitative change in the product. If the change we introduce is at least somewhat related to monetization, then this metric can be used for A/B testing.
Start using our great analytics platform today! devtodev is a full-cycle analytics solution developed specifically for game developers that helps you convert players into paying users, improve in-game economics, and more.
Sample Preparation
The most important thing when running an A/B test is that you use a group of people that never encountered the changed functionality. Therefore, tests are often run on a tutorial or on the download form, that is, on those people who first install the game/application. You can also run an A/B test on experienced users who, for example, have never visited an in-game store. But most A/B tests are done on beginners.
When planning an A/B test, you need to understand:
-
How many groups do you plan to have?
-
What level of significance do you want to achieve (you need more people for the test if you don’t want to make a mistake)?
-
What kind of change are you making?
This is a rough formula that I do not recommend to use:
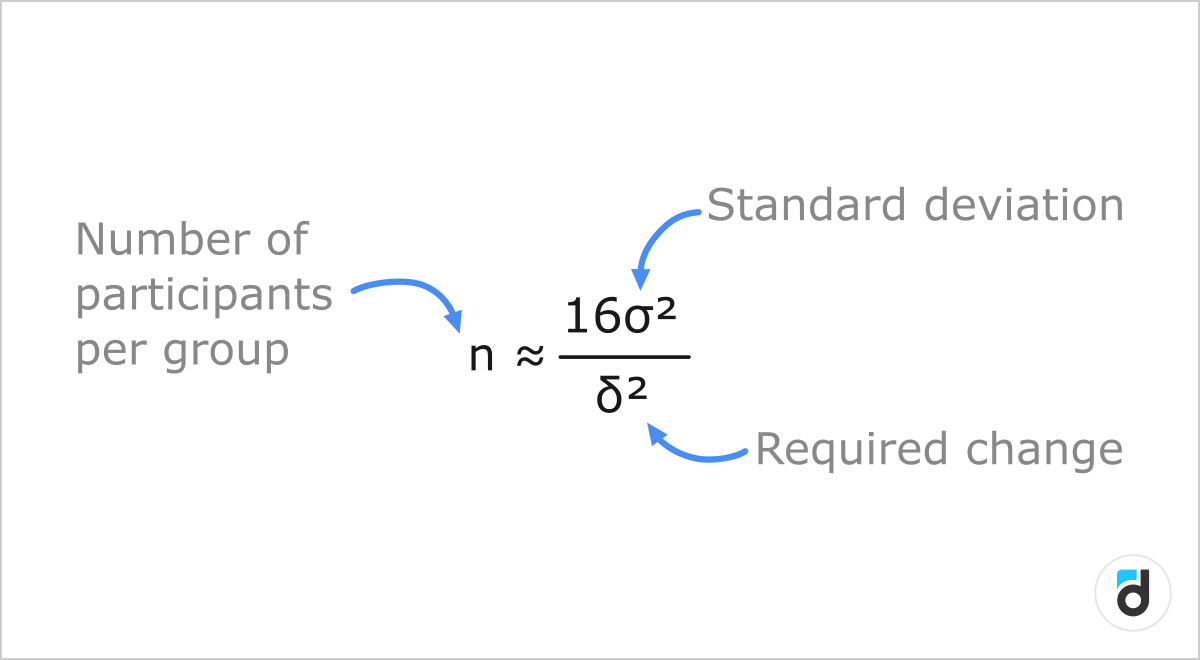
But it has an interesting indicator, which is worth paying attention to. The numerator has a squared standard deviation (the less stable the metric is, the more users we need to run the test), and the denominator is the change that we want to achieve. Thus, the smaller the change we want to achieve, the more users (squared!) we need for this. For example, if we have 30% retention, but by adding a LiveOps event, we want to make it 40%, then use a small number of users to check this. If retention was 30%, and we want to check whether it became 30.1%, and the result should be statistically significant, then we will need a lot more users.
Most importantly, the picking must be random. It is fundamentally wrong to send users who, for example, came on Wednesday, into one group, and users who came on Thursday, into another. These are different users, they are motivated differently, they joined the project on different days. The right way to do it is to combine both of them in one segment and randomly distribute them into two groups.
Watch our webinar on How To Develop Game Community. Tips and Tricks
Preliminary testing
Before starting the A/B test, you need to check the quality of your audience - is it good enough to trust the results? To do this, you can conduct an A/A test or an A/A/B test.
In the A/A test, we do not change anything for anyone, but simply randomly distribute the audience into two groups and check the metrics. If they are similar for both groups, then everything is fine. If not, it means that our audience is too heterogeneous and we can’t trust the results. In this case it is better to increase its volume so that, according to the law of large numbers, to make it more homogenous first.
If you don’t want to spend time on the A/A test, you can run an A/A/B test: it is a test when you do not change anything for two groups, but make a change for the third group. In this case the test will be successful if we get statistically significant proof that there is no difference between A1 and A2, and that A1 and A2 differ from B in the same direction.
Read more: 4 Simple Methods of Paying Audience Segmentation
Interpretation of Results
While collecting data, you will be tempted to take a peep at the results. When we start the test, we often have an internal favorite or a version that the producer really likes. And it happens that the test is still running, however we’ve peeped at the results and we see that the favorite is already winning. We decide to stop the test to save time and money, and often this is a mistake. It is possible that if we waited for the whole allocated audience to finish the test, then the results could be different. This is the same as if a match between FC Barcelona and a little-known team would be stopped 15 minutes before the end, if Barcelona managed to score a goal. But we all know that 90 minutes of a match spring surprises. Therefore, you can peep at the results, but you always need to wait for the entire sample to go through the test.
Statistical Significance
Significance is a measure of certainty. We can say that the test is significant if we are confident that the results that we obtained on a small sample will be exactly the same for a larger audience. Significance depends on many factors and we ourselves choose the percentage of mistakes we can make.
There are two approaches to measuring significance:
1. Frequency approach. The one students learn about at universities.
-
Probability here is the frequency of an event.
-
It is used to test statistical hypotheses.
-
The output is p-value.
Frequency approach is more trivial; it is described in most textbooks on mathematical statistics. We need to meet many conditions in order to take into account all the features of the frequency approach.
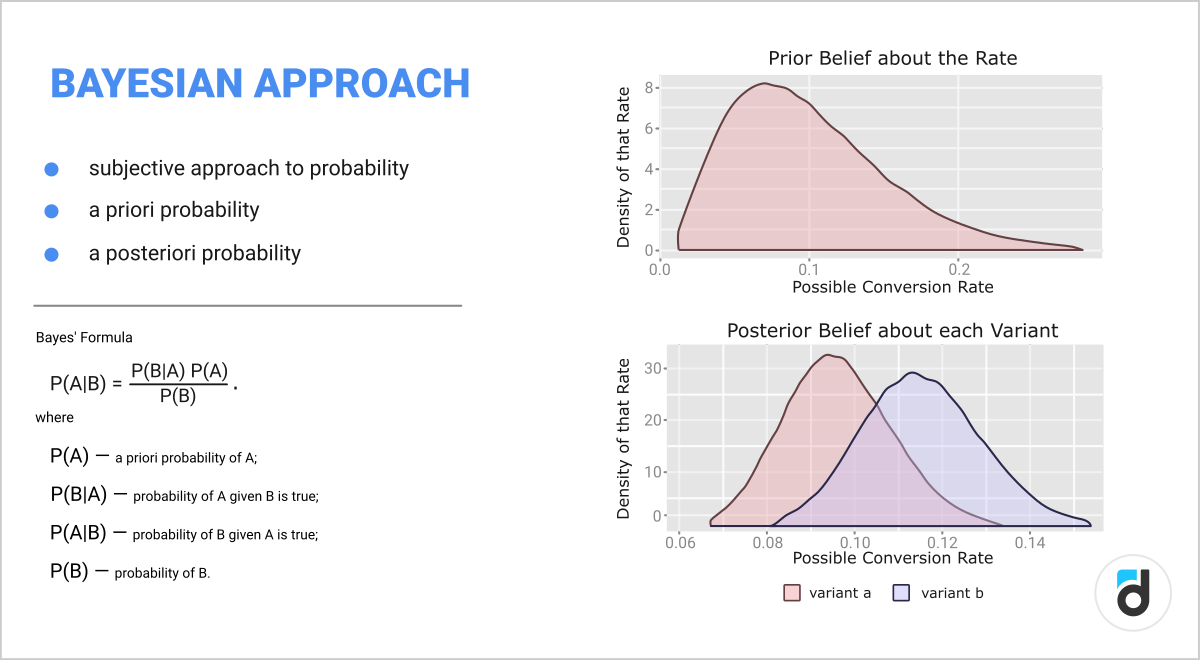
2. Bayesian approach.
-
Probability here is a degree of confidence (subjective probability).
-
As a result we get the probability of success for each of the options.
This approach is less demanding on the source data: we do not have to check the distribution and we need less data in general, but the price for this is a complexity of Bayesian calculations.
Application of the Frequency and Bayesian Approaches to Various Metrics
LiveOps influence various metrics. There are:
1. Binomial metrics. They are usually measured as a percentage:
-
0 or 1 (Yes or No)
-
Conversion (paid/didn’t pay, clicked/didn’t click)
-
Retention (returned/didn’t return)
2. Non-binomial metrics. They are not measured in percentages, but, for example, in money or minutes:
Let’s take a look at several cases:
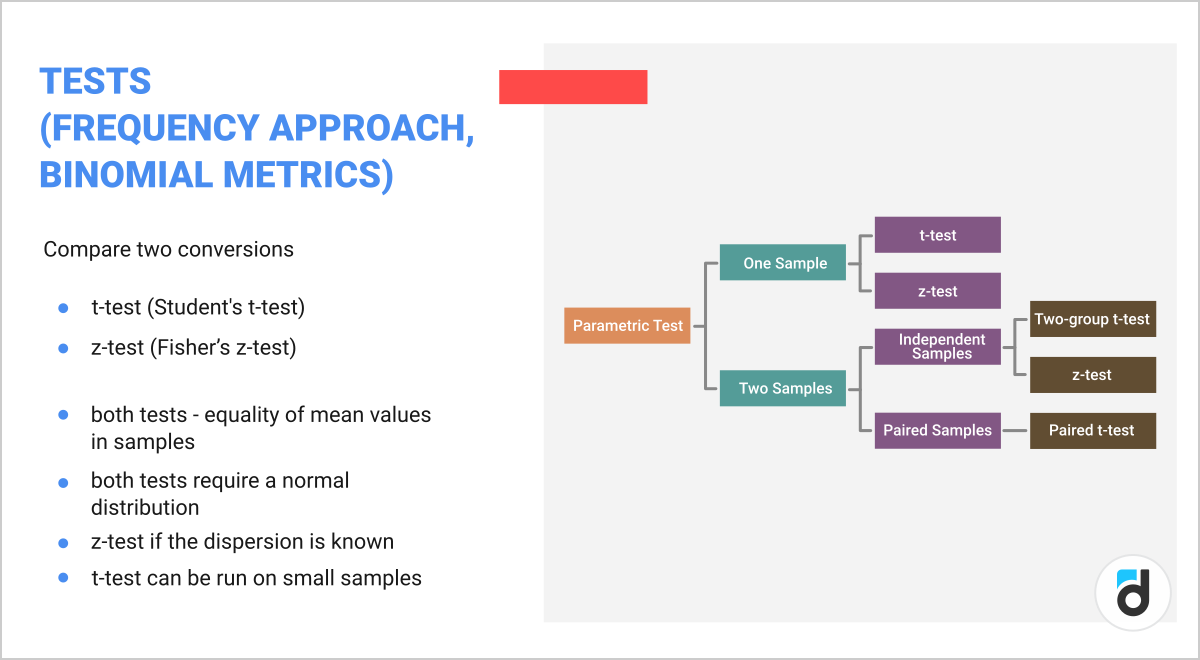
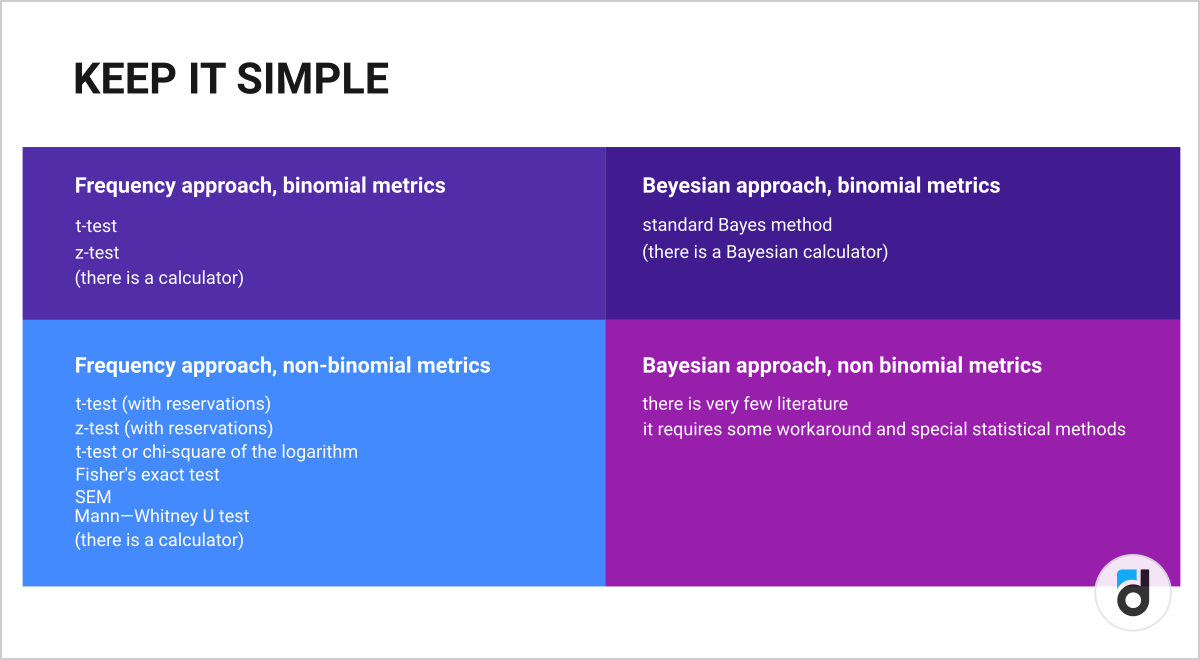
Frequency approach and binomial metrics (e.g. retention or conversions)
Here you can use the classic t-test (Student's t-test) or z-test (Fisher’s z-test).
Bayesian approach and binomial metrics
In this case the probability is somewhat subjective. It is evaluated before the test (a priori probability) and after the test (a posteriori probability). It is important to understand that this approach works somewhat differently than the frequency approach.
The advantage of this method is that as a result you get, figuratively speaking, the probability of success for each of the test groups and not a simple p-value. It is quite convenient to interpret, although difficult to calculate.
Other methods of statistical analysis are used for non-binomial metrics. This is important to consider, because in LiveOps most of the changes are about money.
Read more: How to Improve a Free-to-Play In-Game Store
Sum it up. Common Errors in A/B Testing
-
Wrong hypothesis and testing of changes that are difficult to track (we do not always clearly understand how many users we have and what changes we want to see).
-
Favorable (for yourself) interpretation of the experimental results (the problem of peeping; the lack of results on the chosen metric and changing this metric for another after receiving the test results).
-
Intuition (you shouldn't use it during tests at all).
-
Audience
-
new/not new;
-
traffic sources (one traffic source gets the A version of the test, another traffic source gets the B version);
-
paying/not paying.
-
Too few users (only very noticeable hypotheses can be tested on a small audience).
-
Running several tests at the same time (multivariate testing is fine, but you need to test hypotheses that influence each other as little as possible)
-
The quality of tests can vary from project to project, over time, etc. (what worked for one project may not work for another project; moreover, what worked for this project may not work for it again in a year).
-
Statistical significance.
-
Lack of prior testing.
-
Wrong choice of metrics.
-
Wrong sample size (too small or too large).
A/B testing is not so simple. And, strangely enough, 51 is not always more than 50.


: The Basics")
: The Basics")


 in Mobile Games")
 in Mobile Games")


")
")


")
")


")
")


 Tactics for Mobile Games")
 Tactics for Mobile Games")


