
What is a dashboard in analytics? What features should your analytics platform provide if you want to build or create dashboards for all team members? And finally, what does a real-life analytic dashboard look like?
A dashboard is a compilation of metrics displayed with graphical representations for continuous or frequent monitoring and analysis. Anyone with access can take a quick look at a single screen featuring graphs, diagrams, and bar charts to gain a comprehensive understanding of what’s happening with the product—both in terms of metrics and user engagement. A dashboard is akin to a patient monitor found in ICUs; it functions as a collection of vital health metrics that a doctor uses to monitor a patient's condition.
For example, a dashboard can help you to:
-
Fast and easy access to data.
-
Analyze product data in real time.
-
Take immediate actions when something abnormal is detected.
-
Monitor KPIs.
-
Keep all information in one place.
-
Save time.
-
Motivate employees to achieve their goals.
etc.
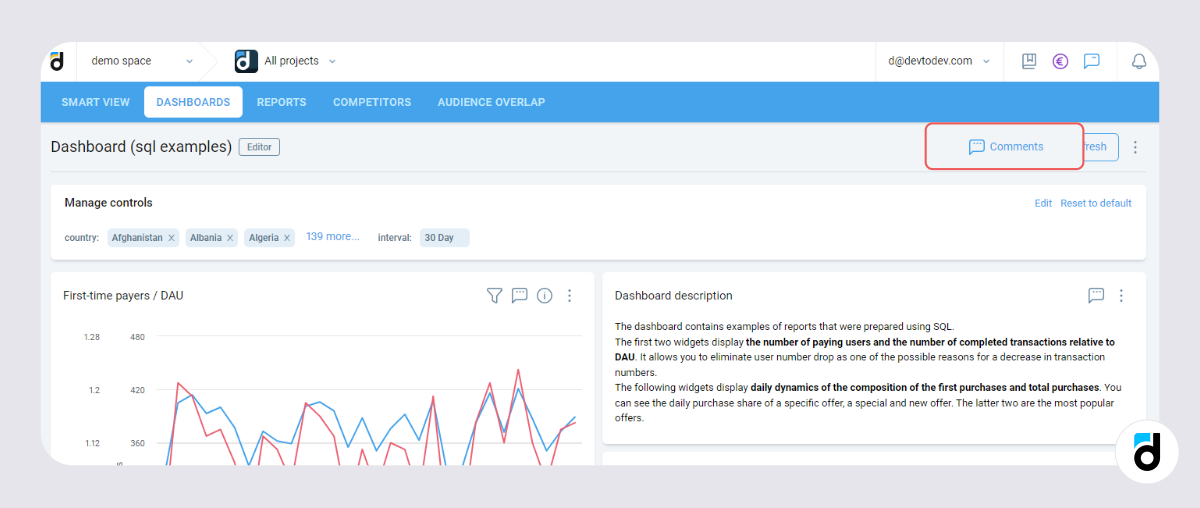
On the Devtodev analytics platform, dashbord building looks as follows:
Read more: How to Integrate an Analytics System into your Game
Vital Features of an Ideal Dashboard
-
Flexibility. This is a key in dashboard building. Everyone involved should have the ability to create their own dashboard, tailoring it to include the metrics of their choice. Simultaneously, you'll want to establish a specific view and update permissions to ensure end users can't alter the widgets. If you need to reposition a particular widget, there's no need to redo the entire dashboard—simply drag and drop.
-
Broad selection of metrics. Managers require access to monetization metrics, analysts focus on retention and engagement metrics, and so on.
-
It’s easy to create and use. The entire process should be user-friendly and intuitive, minimizing the need for extensive manual reading.
-
It’s easy to share and screen share. Sharing a link should be a one-click process, and screen sharing for in-person meetings should be as straightforward as possible.
-
Enable note-taking. The ability to add comments allows you to explain concepts to colleagues or jot down important reminders.
Read more: Best Game Analytics Platform: devtodev vs DeltaDNA
What Reports and Widgets to Use
The choice of widgets depends entirely on your needs. For example, when you need to routinely track monetization metrics, you can create a dashboard with monetization metrics for the selected apps (gross, ARPU, paying conversion, time to conversion, conversion to second subscription, etc).
If you want to build a dashboard that shows performance of apps’ audience acquisition channels, you can add some widgets and they will show the current traffic status. For example:
-
a table for analyzing the most important metrics by traffic sources: new users, gross, paying conversion, ARPU, day 1 retention, day 7 retention, and so on;
-
a diagram that shows new user acquisition performance by app;
-
and other widgets that help you analyze channel performance.
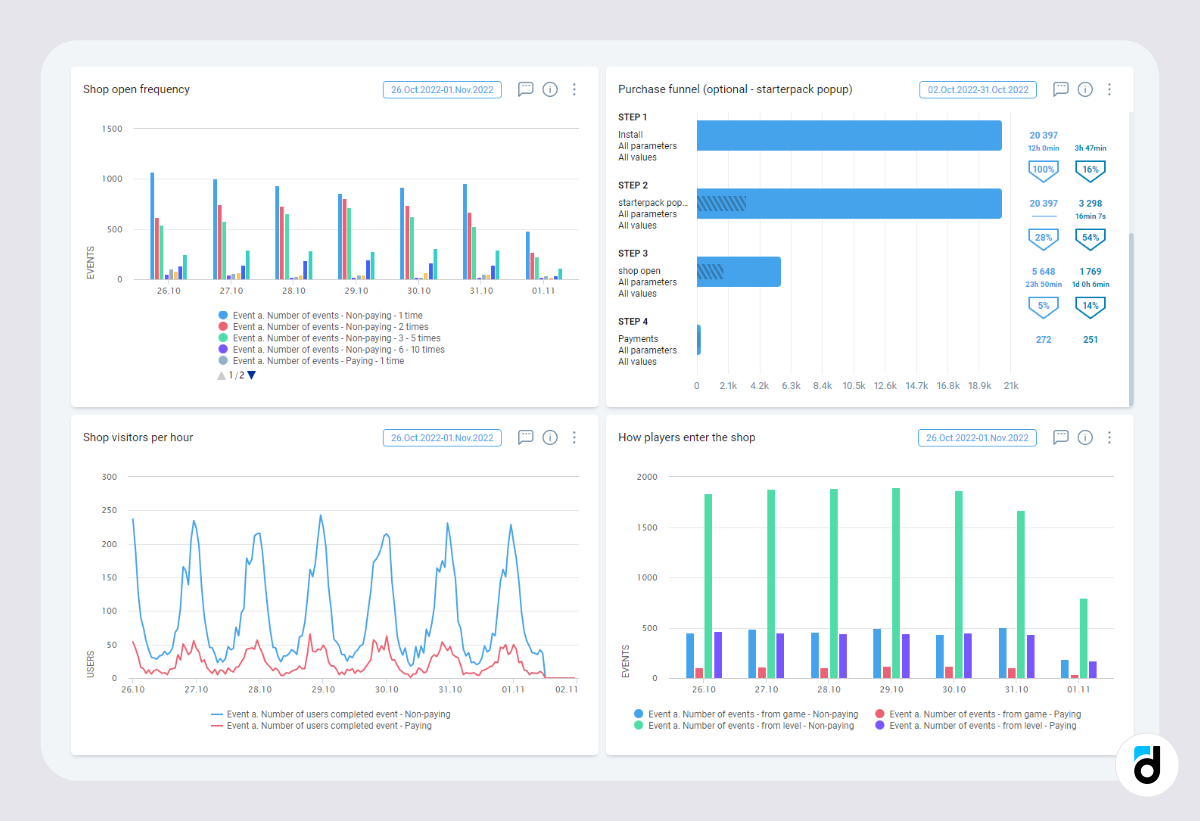
This is how it a real mobile app dashboard may look:
Let’s Create a Dashboard
Now let’s look at the process of building a dashboard using the devtodev analytics platform.
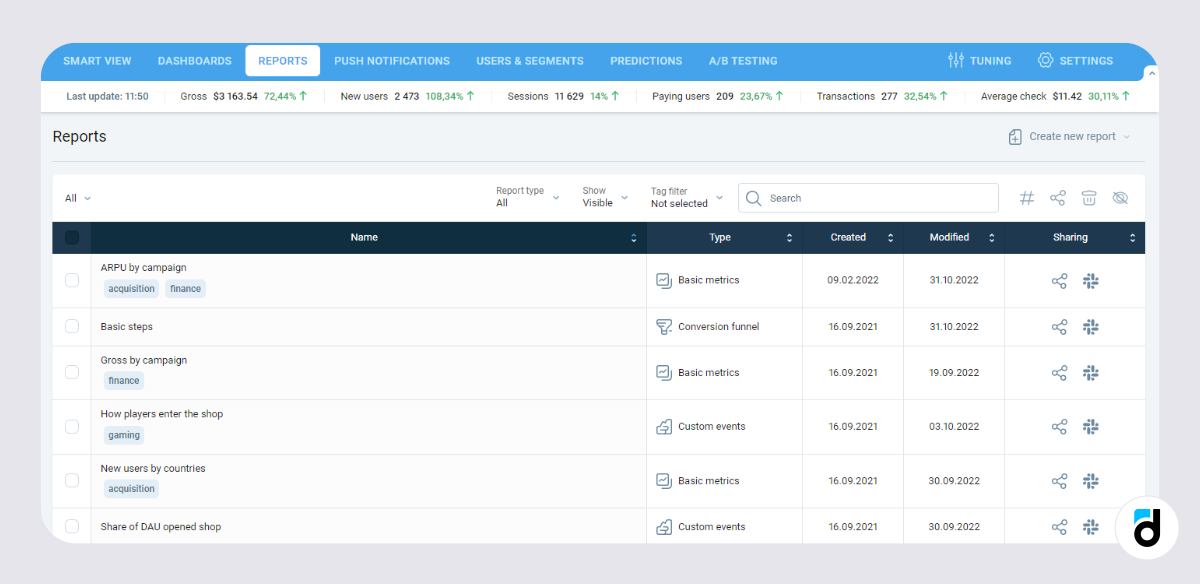
1. Open your Space or app. Click Dashboards -> Create new dashboard.
2. Add saved reports from the Basic metrics, Custom events, Conversion funnels, SQL, or create new ones.
3. And actually that’s it!
Your reports and widgets will appear on the dashboard. After the dashboard has been created, you are free to add up to 20 widgets to it—simply click Add widget in the hamburger menu of the dashboard in the top right corner.
Read more: Retention is Dropping - What to Do?
Some Useful Actions
-
You can customize each widget (change it, add description, rename it, move, or copy).
-
You can manage permissions (editor, viewer, owner).
-
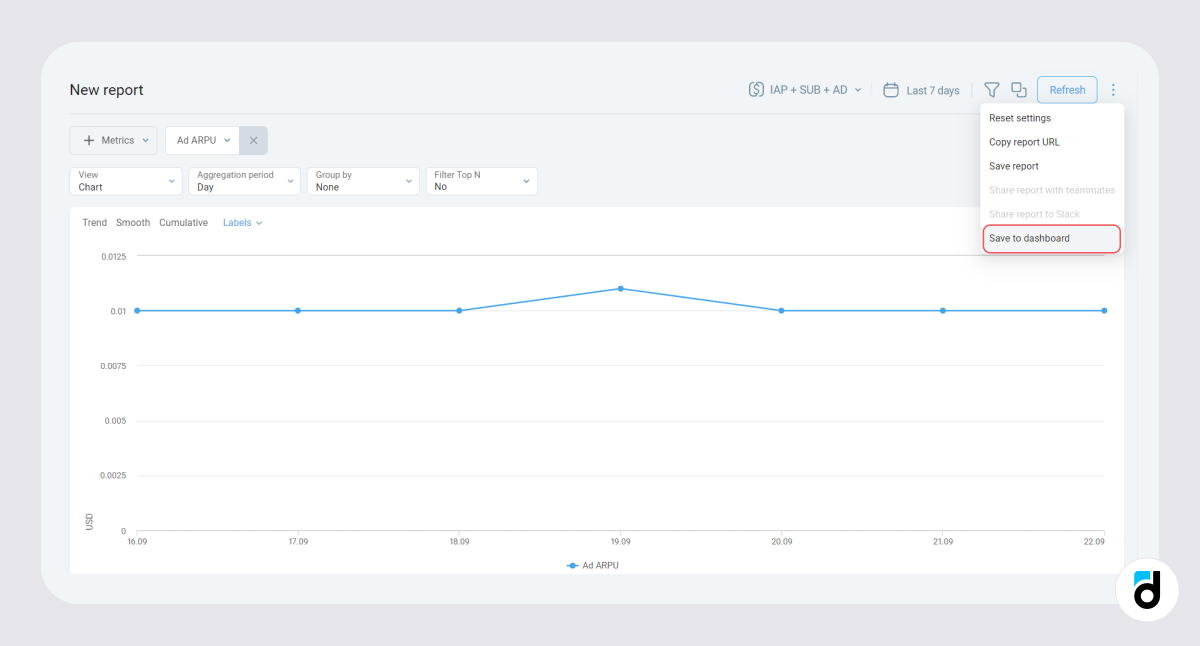
When building a report, you can save it straight to the dashboard.
-
You can comment on your own or a shared dashboard. Also, you can mention a colleague and they will receive a bell and email notification.
-
Change the date range of all widgets at a time.
Data is what your web product performance and business decisions rely on. Data works if you track it and use it. Dashboards help you and your entire team become data-driven and reap the benefits.


: The Basics")
: The Basics")


 in Mobile Games")
 in Mobile Games")


")
")


")
")


")
")


 Tactics for Mobile Games")
 Tactics for Mobile Games")


