
In the last article, we talked about the SQL commands required to calculate DAU, WAU, and MAU. Now let's learn how to find the main monetization metrics for this audience using SQL.
To determine the revenue from your product you may need the following metrics:
Gross – the amount of payments for a certain period.
Paying Users – the number of all unique users active for a certain period who have made at least one payment.
Transactions – the total number of transactions for a certain period.
Average check – average payment amount. Average check = gross / transactions.
ARPPU (Average Revenue Per Paying User) – one of the most important monetization metrics. It is necessary in order to assess the paying users reaction to the value of the project. ARPPU is calculated as revenue for a selected time period divided by the number of users who made a purchase (Paying Users).
Read more: Main Metrics. Average Revenue Per Paying User
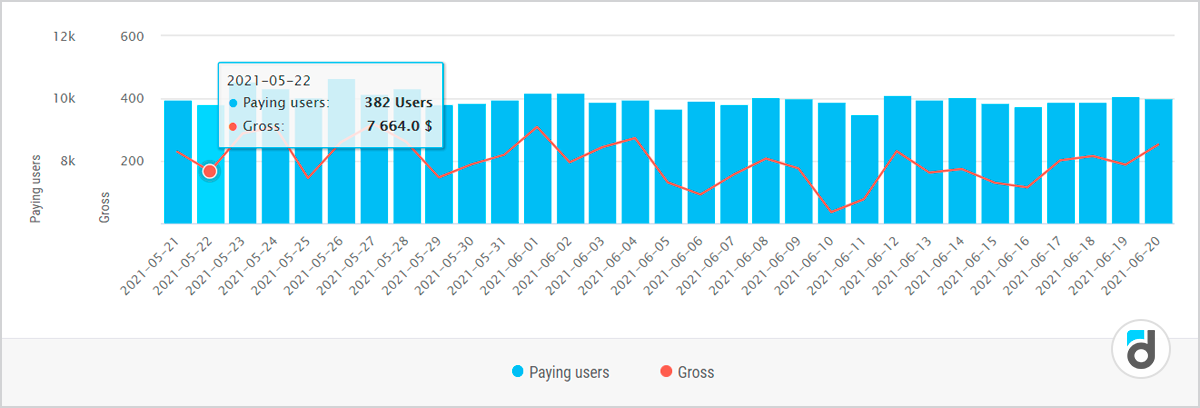
Monetization metrics in daily dynamics
Let's calculate the main monetization metrics using SQL. Log in to your devtodev account and find the SQL Report in the demo project.
In devtodev, all app metrics are calculated automatically; also a huge variety of filters can be applied to them without using SQL.
Let's turn to the payments table, which contains all the data on payments made by users for real currency. The value of the priceusd parameter is equal to the value of the purchased product, converted from the local currency into USD at the time of the payment, and the devtodevid parameter is the user who triggered the payment event.
select to_char(eventtime, 'YYYY-mm-dd') as day
, sum(priceusd) as "Gross"
, count(devtodevid) as "Transactions"
,count(distinct devtodevid) as "Paying users"
,avg(priceusd) as "Average check"
,sum(priceusd)/count(distinct devtodevid)) as "ARPPU"
from p102968.payments
where eventtime>=current_date - interval '1 month'
and eventtime < current_date
and tester is false
and cheater is false
group by 1
order by 1 asc
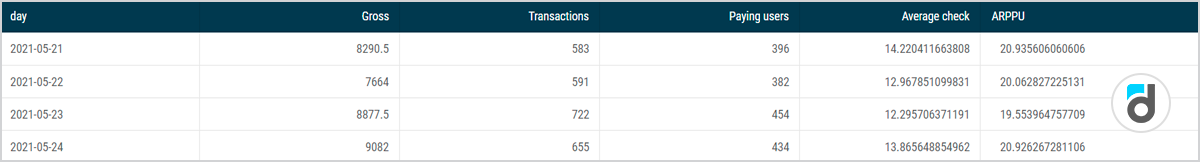
Then,
- Gross – sum(priceusd) – the sum of the priceusd parameter values;
- Transactions – count(devtodevid) – the number of events (payments);
- Paying users – count(distinct devtodevid) – the number of unique users who made a payment;
- Average check – avg(priceusd) – the average value of the priceusd parameter (can be calculated as sum(priceusd)/count(devtodevid));
- ARPPU – sum(priceusd)/count(distinct devtodevid) – the ratio of the sum of all payments to the number of paying users.
So, we can get the main monetization metrics just by using grouping and aggregation functions.
Top countries by Paying Users and their ARPPU
Now we want to find out countries with the highest number of paying users, as well as the average payment from each of these users. Let’s group our data from payments by the country parameter, which is also present in the table.
select country
, count(distinct devtodevid) as "Paying users"
, sum(priceusd)/(distinct devtodevid) as "ARPPU"
from p102968.payments
where eventtime>=current_date - interval '1 month'
and eventtime < current_date
and tester is false
and cheater is false
group by 1
order by 1 asc
group by country
order by "Paying users" desc
limit 5
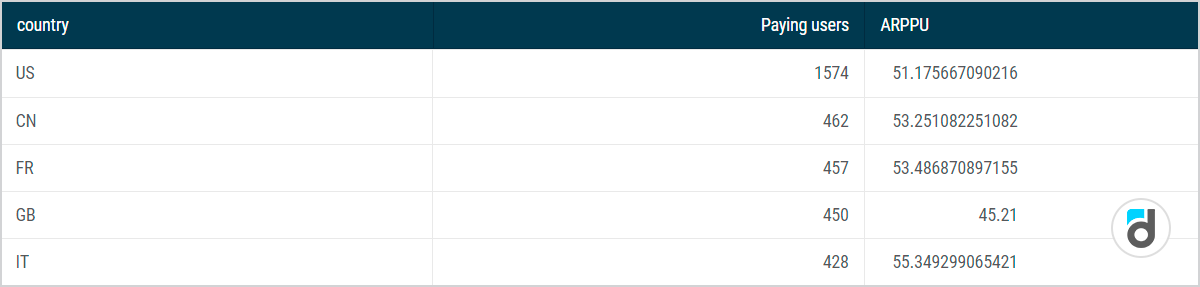
By adding limit 5 at the very end of the query, we have limited the number of output lines in the result. The query is executed in full, counting in select and preparing all data for output, sorts it, and, at the end, leaves only N lines.
Thus, if we sort data in ascending order, limit 5 will display a list of countries with the lowest number of paying users in the last month.
Let’s say that detailed statistics for the first 5 countries are analyzed separately on one dashboard, and on the other you need to show the next 5 countries (6-10) by the number of paying users. For this, add at the end of the request:
limit 5 offset 5
If you want to leave all but the first 5 countries, the limit command can be dropped out.
To add the query result to the dashboard in a tabular form, we can format this data by changing select:
'$'||round((sum(priceusd)/count(distinct devtodevid))::numeric,2)||'per paying user' as "ARPPU"
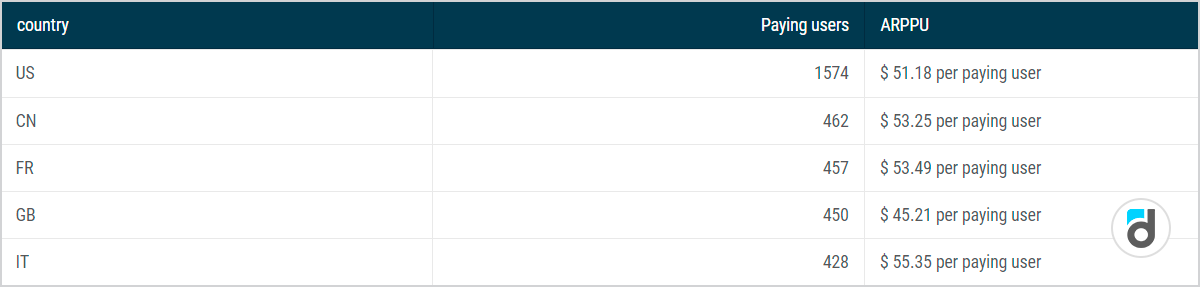
The first thing we did was add the $ sign to the ARPPU value. Then we add a line with ‘per paying user’ in single quotes and use the || operator to concatenate the string value with the calculated ARPPU value.
We don’t recommend formatting the data if you plan to further process it in another query or, for example, using spreadsheets.