
Devtodev is helping you keep in touch with what’s happening in the game market. Every month we publish an overview of reports on the most popular games worldwide, top-grossing games, successful releases, favorite video game types, trends, etc. This overview was prepared by Dmitriy Byshonkov, the author of the GameDev Reports by the devtodev Telegram channel. You can also read the January and February reports.
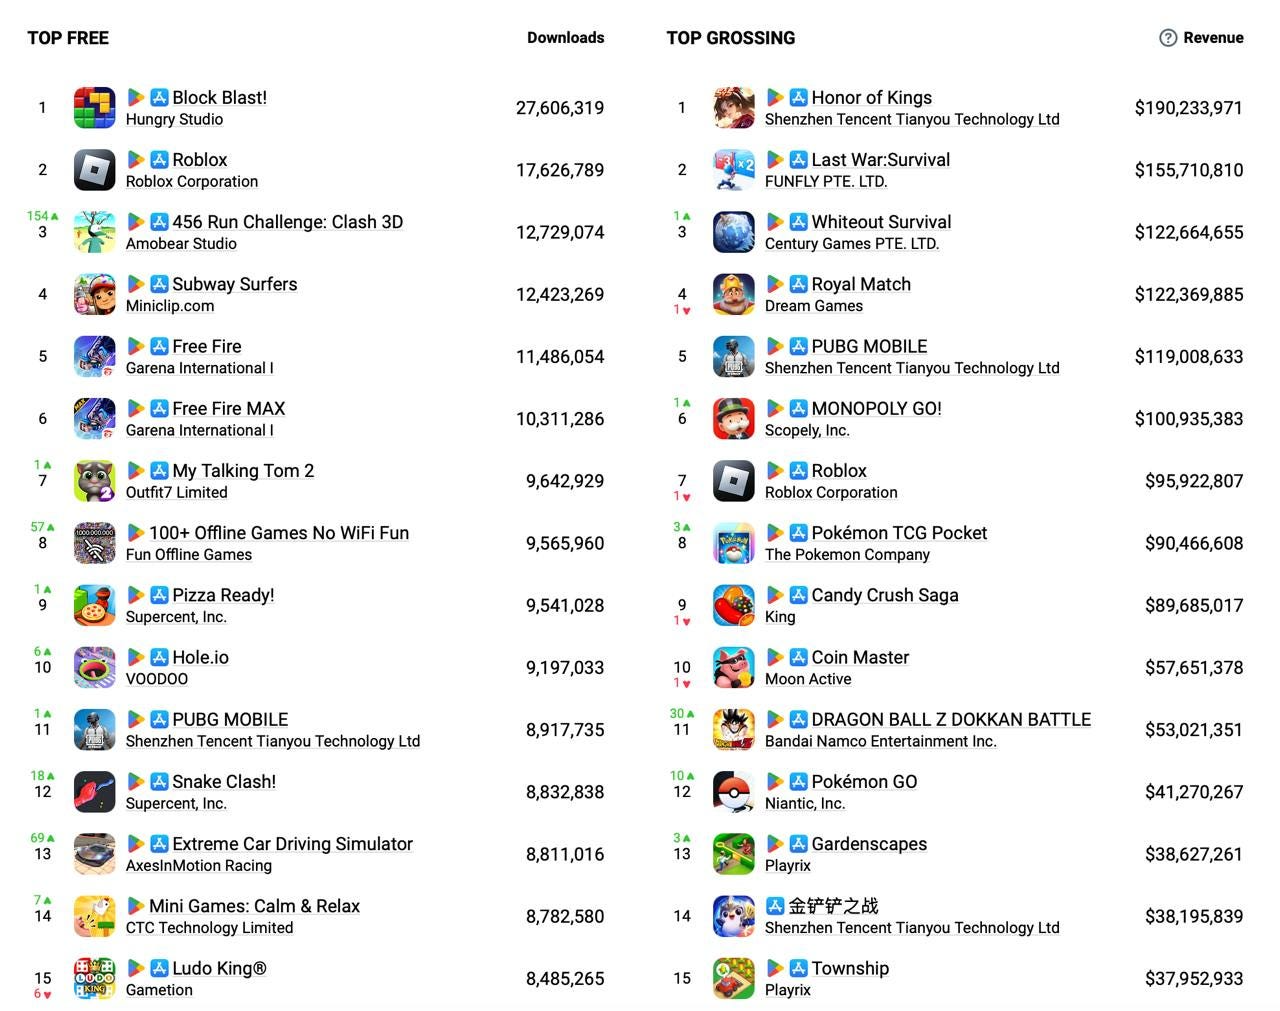
AppMagic: Top Mobile Games by Revenue and Downloads in February 2025
AppMagic provides revenue data after deducting store commissions and taxes. Revenue from Android stores in China is not included.
Revenue
-
Honor of Kings repeats its January success. In February, the game earned $190.2 million.
-
Last War: Survival takes second place in revenue ($155.7 million), followed by Whiteout Survival in third place ($122.6 million).
-
Pokemon TCG Pocket returned to a positive revenue trend - in February, the game earned $90.4 million compared to $66.2 million in January.
-
Against the backdrop of its 10th-anniversary celebration, Dragon Ball Z: Dokkan Battle's revenue grew significantly. In February, the game earned $53 million - a record since July 2020
-
Pokemon GO also shows good results - after January's revenue decline, the project returned to the top 15, earning $41.27 million.
Downloads
- Block Blast! (27.6 million downloads) remains the leader.
- February saw many newcomers in the top 15. 456 Run Challenge: Clash 3D climbed to 3rd place - a hypercasual game based on "Squid Game" from Vietnamese Amobear Studio. The game was downloaded 12.7 million times.
- 100+ Offline Games No WiFi Fun also returned to the top 15 (9.5 million installations, 8th place) and Extreme Car Driving Simulator made it to the list (8.8 million installations, 13th place). Interestingly, Extreme Car Driving Simulator was released in July 2014, but set a download record in February 2025.
Games & Numbers (February 19 - March 4, 2025)

PC/Console Games
-
According to GameDiscoverCo, Monster Hunter Wilds sold over 4 million copies on PC and PlayStation 5 within its first few days. As of March 2, the game generated over $150 million in revenue on Steam, including $69.1 million on its debut day. During the weekend, the game reached a peak concurrent player count of 1.384 million.
- Tekken 8 has sold 3 million copies. Bandai Namco Entertainment says that the game is outperforming its predecessor in sales.
- The developers of Pacific Drive announced that the game has sold 1 million copies, a milestone achieved in one year.
- The indie horror game Mouthwashing reported reaching 500,000 copies sold.
- NetEase revealed that the audience for Marvel Rivals has surpassed 40 million players.
- The audience for NetEase's Where Winds Meet reached 15 million users. The game is currently available only in China on PC and mobile devices.
- Palworld reached 32 million players in its first year after release on PC, PlayStation, and Xbox. This number doesn’t reflect sales, as the game was included in Xbox Game Pass from launch.
- The beta of Mecha BREAK hit a peak of 317,000 concurrent users (CCU) on Steam, though the project received negative reviews overall. Most criticism came from China (73% of reviews were negative), while English-language reviews were 80% positive.
- over the hill gained over 200,000 wishlists within a month. In its first five days alone, it accumulated its initial 100,000 wishlists.
Mobile Games
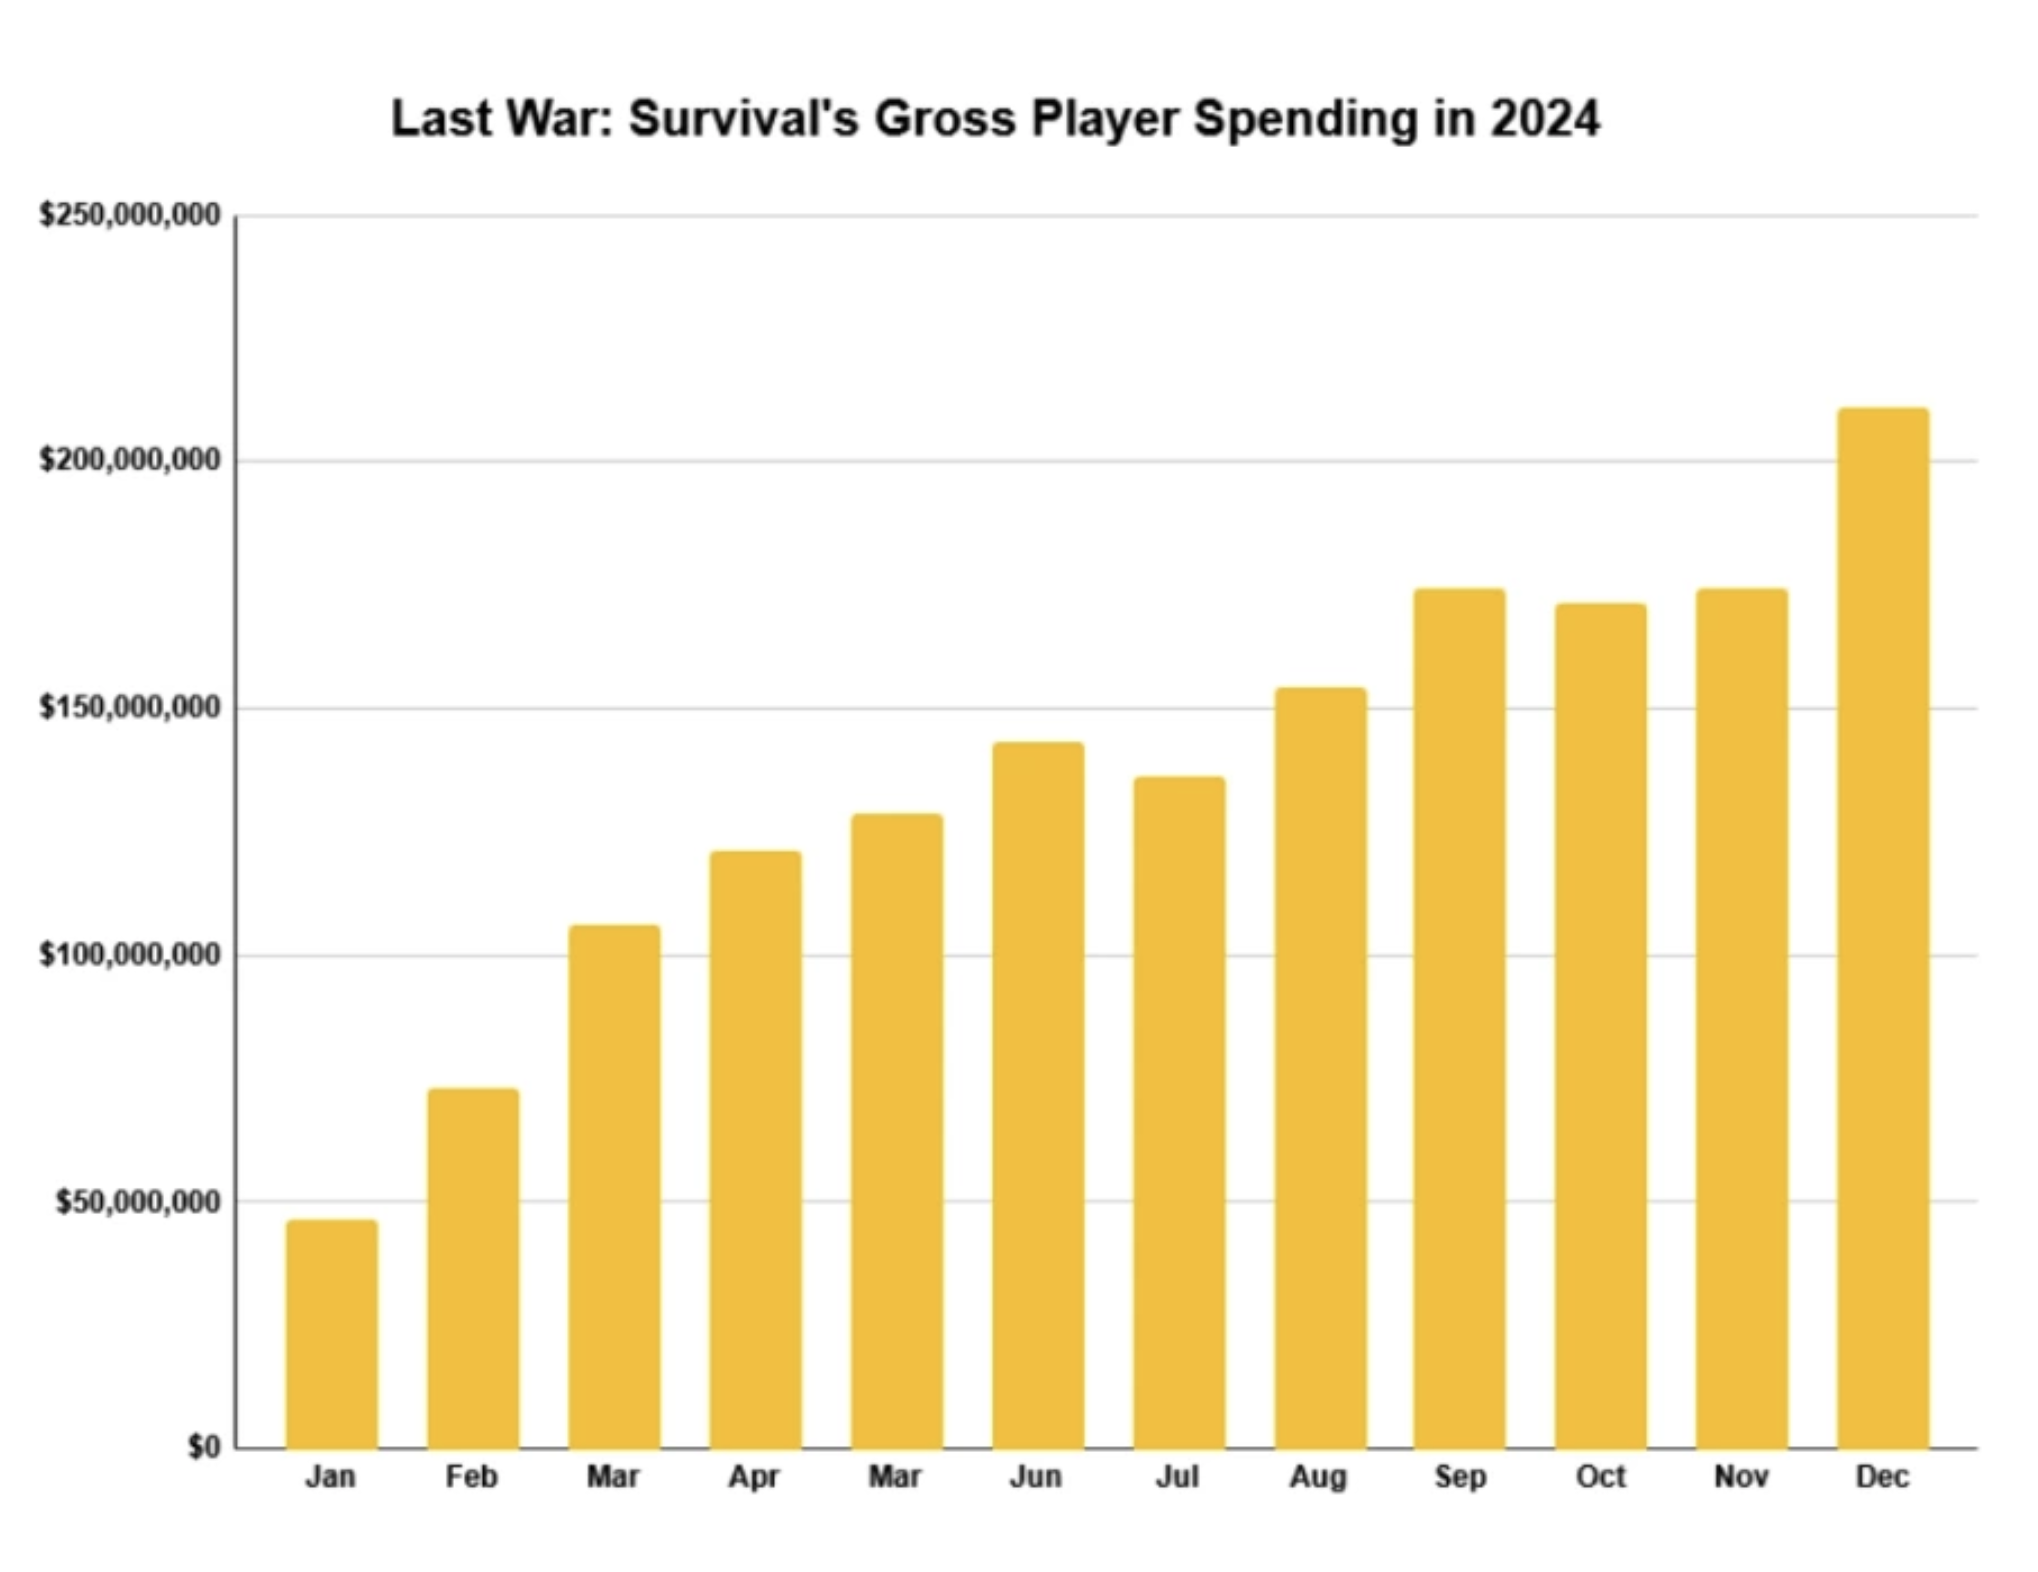
- Gross revenue for Last War: Survival surpassed $2 billion as of February 15, 2025, according to AppMagic. In January alone, the game earned a record $212 million (gross).
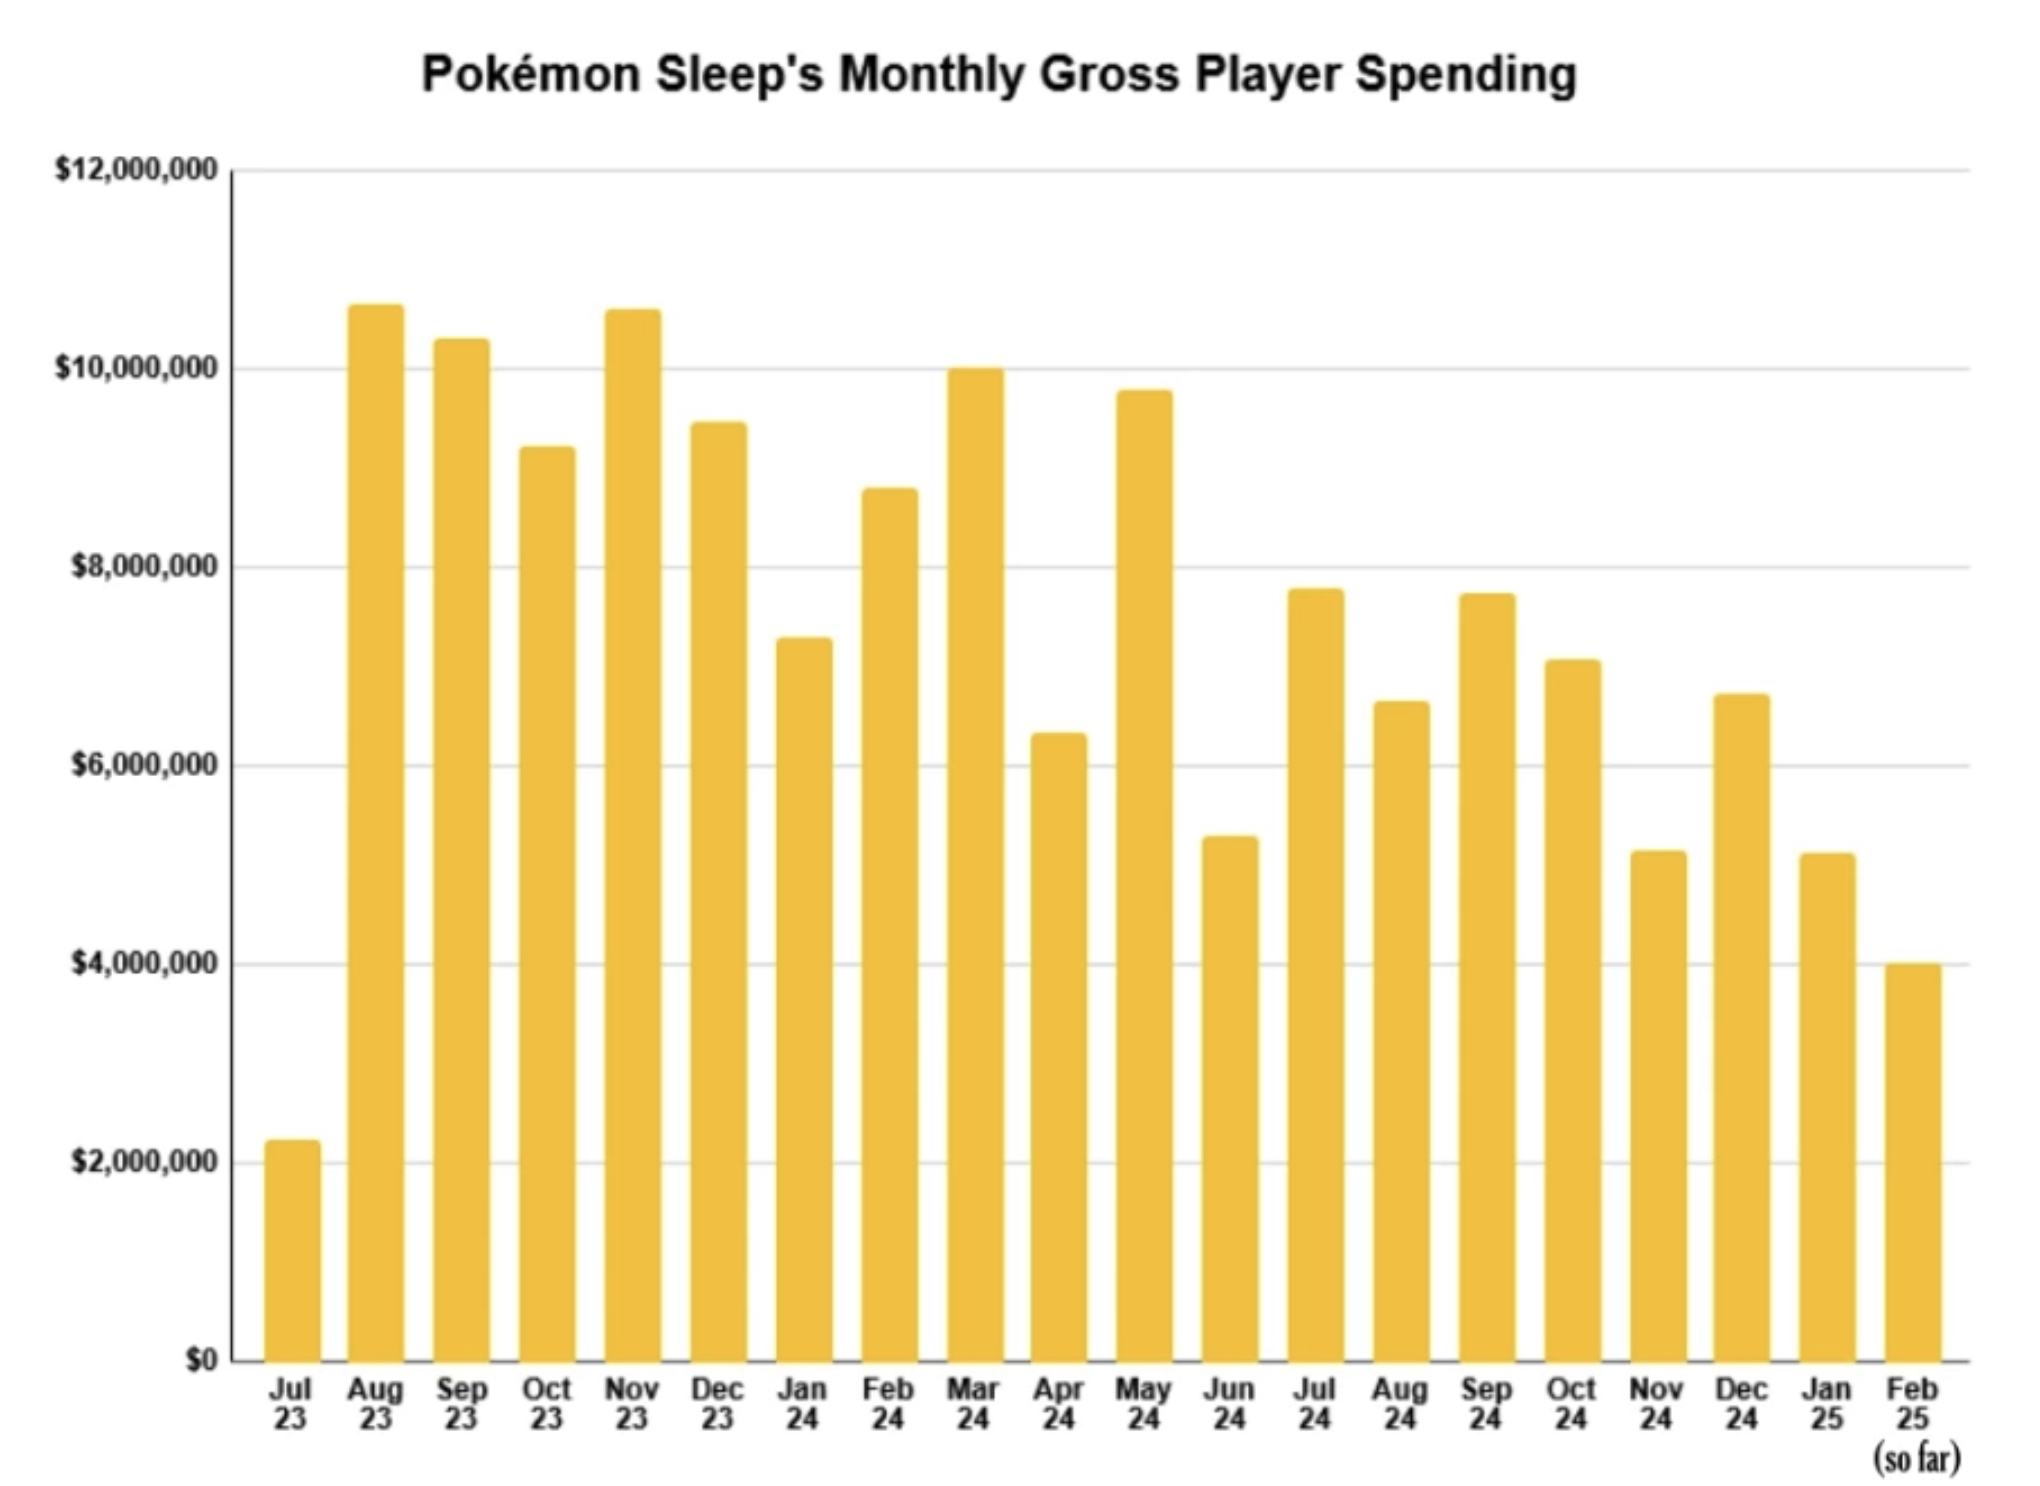
- Pokemon Sleep reached $150 million in revenue; however, its revenue trend is declining.
- Pokemon TCG Pocket has been downloaded over 100 million times, as announced by the developers on their X account.
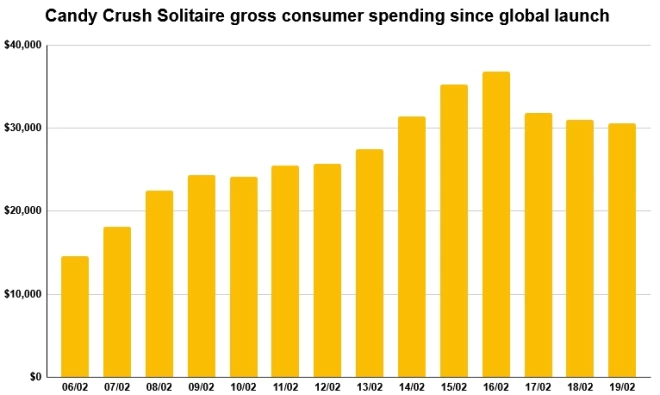
- Candy Crush Solitaire generated $379,000 in revenue during its first two weeks post-launch, according to AppMagic. This figure is before taxes and platform fees.
Gaming Platforms
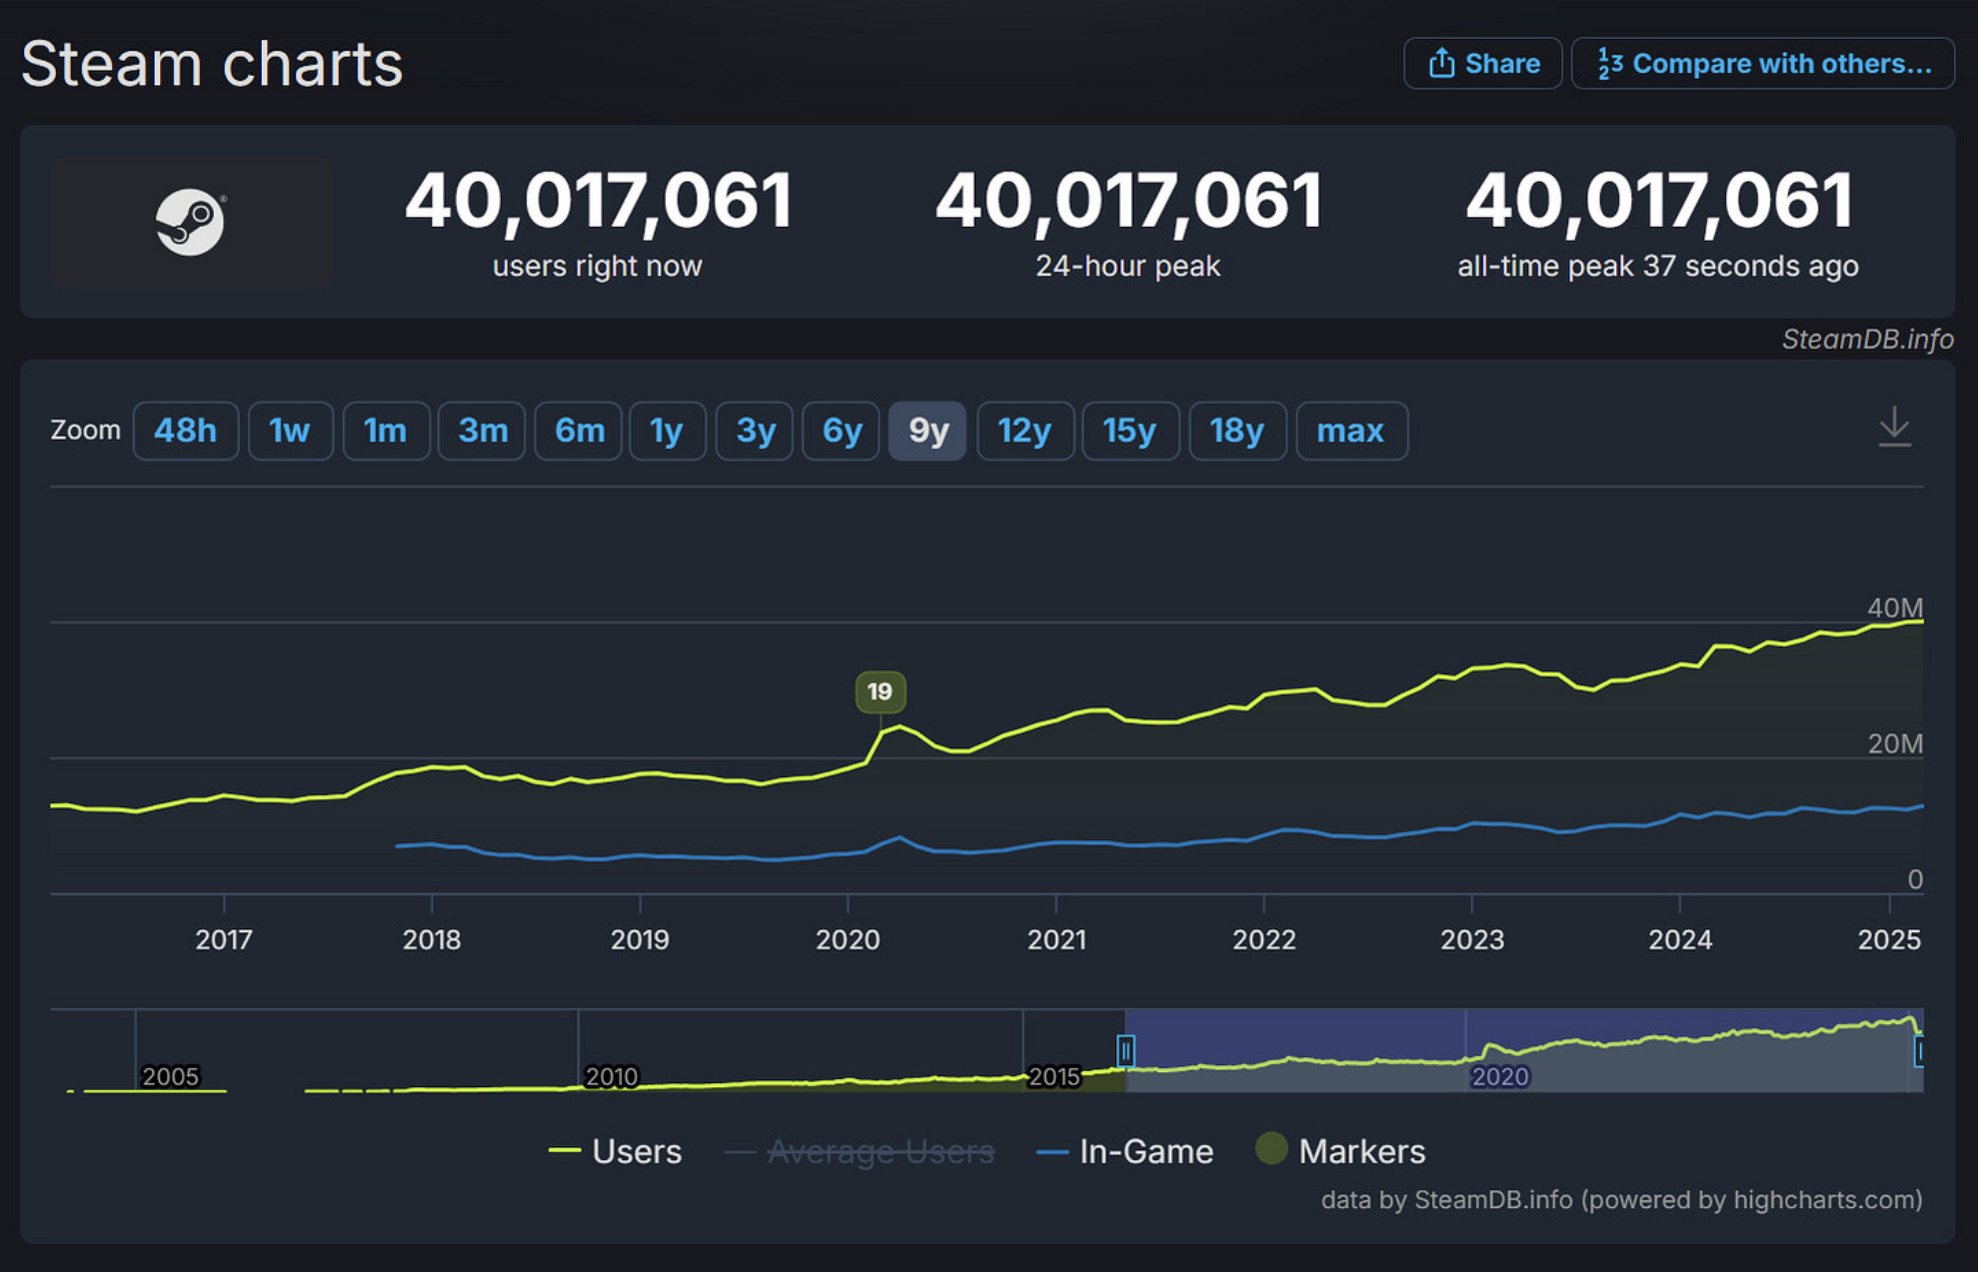
Steam set a new CCU record with 40 million users online simultaneously. Of these, 12.6 million were actively playing games at the time.
- According to IDC estimates, Valve sold over 4 million Steam Deck units over the past three years. In total, portable PCs (including Steam Deck, Asus ROG Ally, Lenovo Legion Go, and MSI Claw) have sold a combined total of 6 million units.
Big Games Machine: How gamers watch YouTube in 2025 in the USA
-
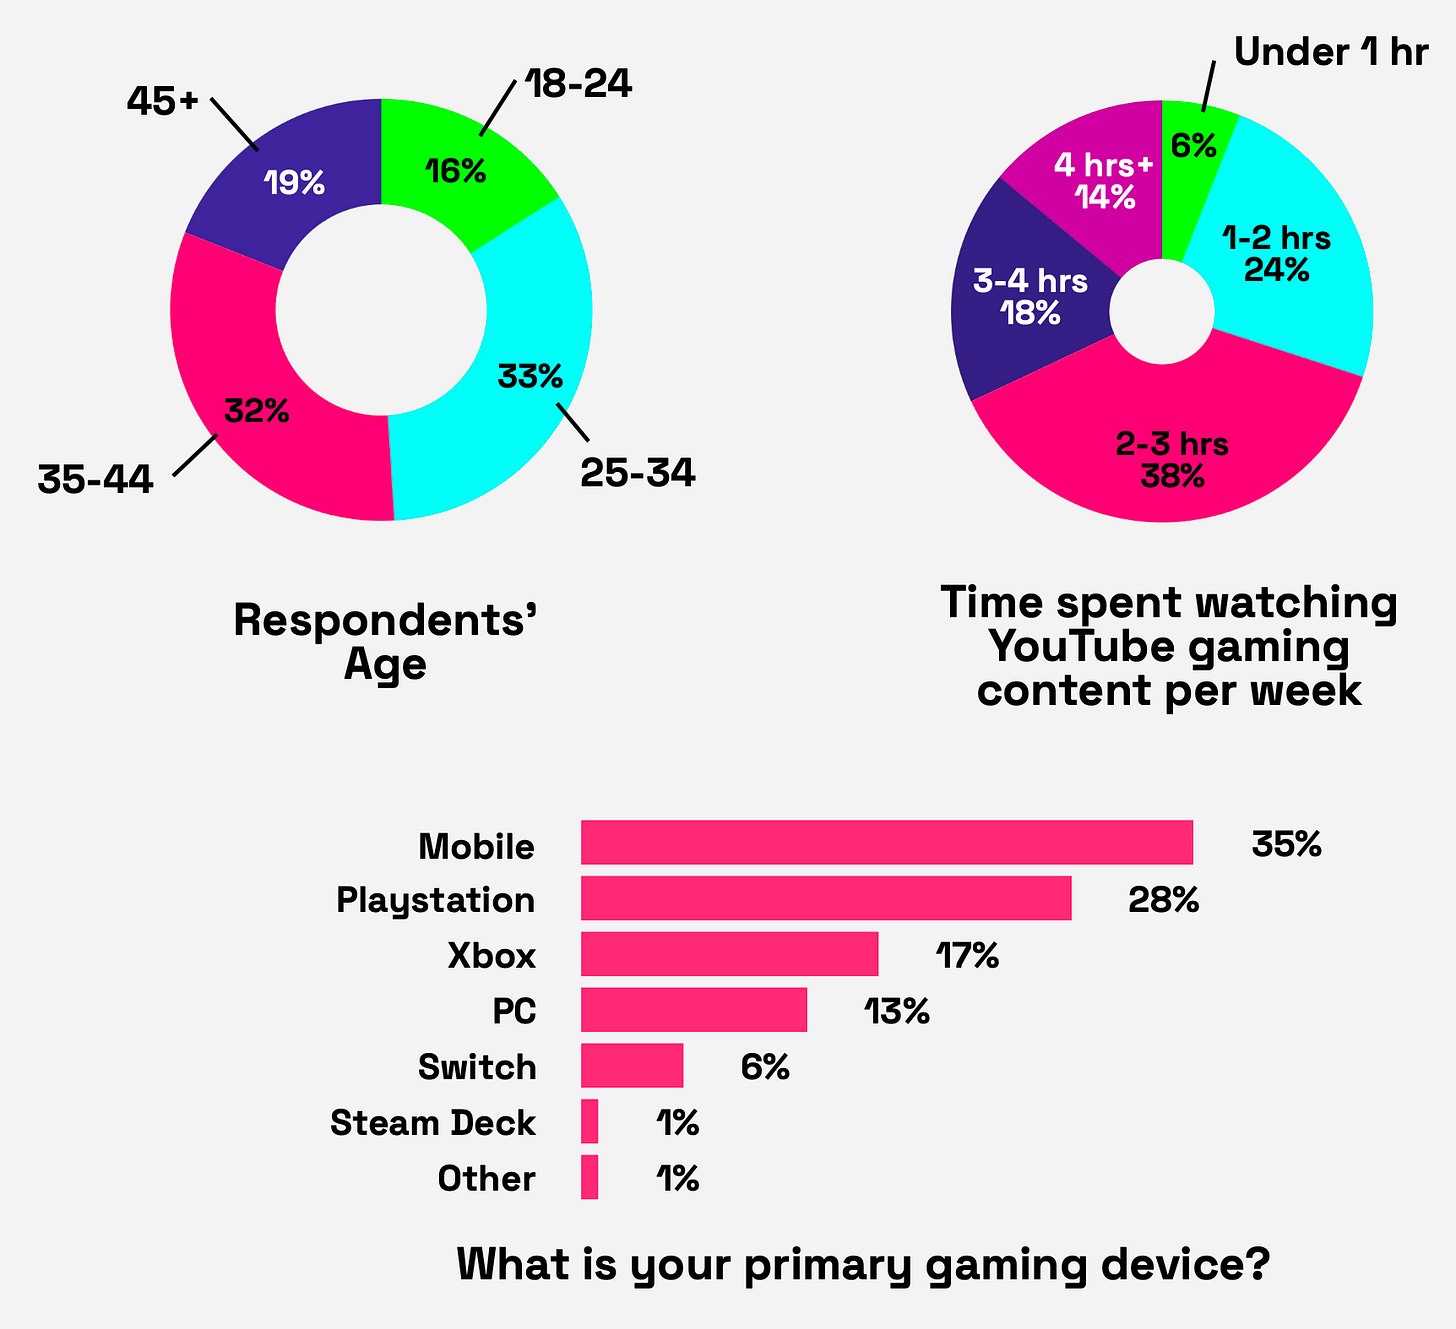
The survey involved 1050 players from the USA who watch YouTube for more than 30 minutes per week. An equal number of men and women participated in the survey. For most respondents, mobile devices are the main platform (35%); PlayStation comes second (28%); Xbox is third; PC is fourth (13%).
-
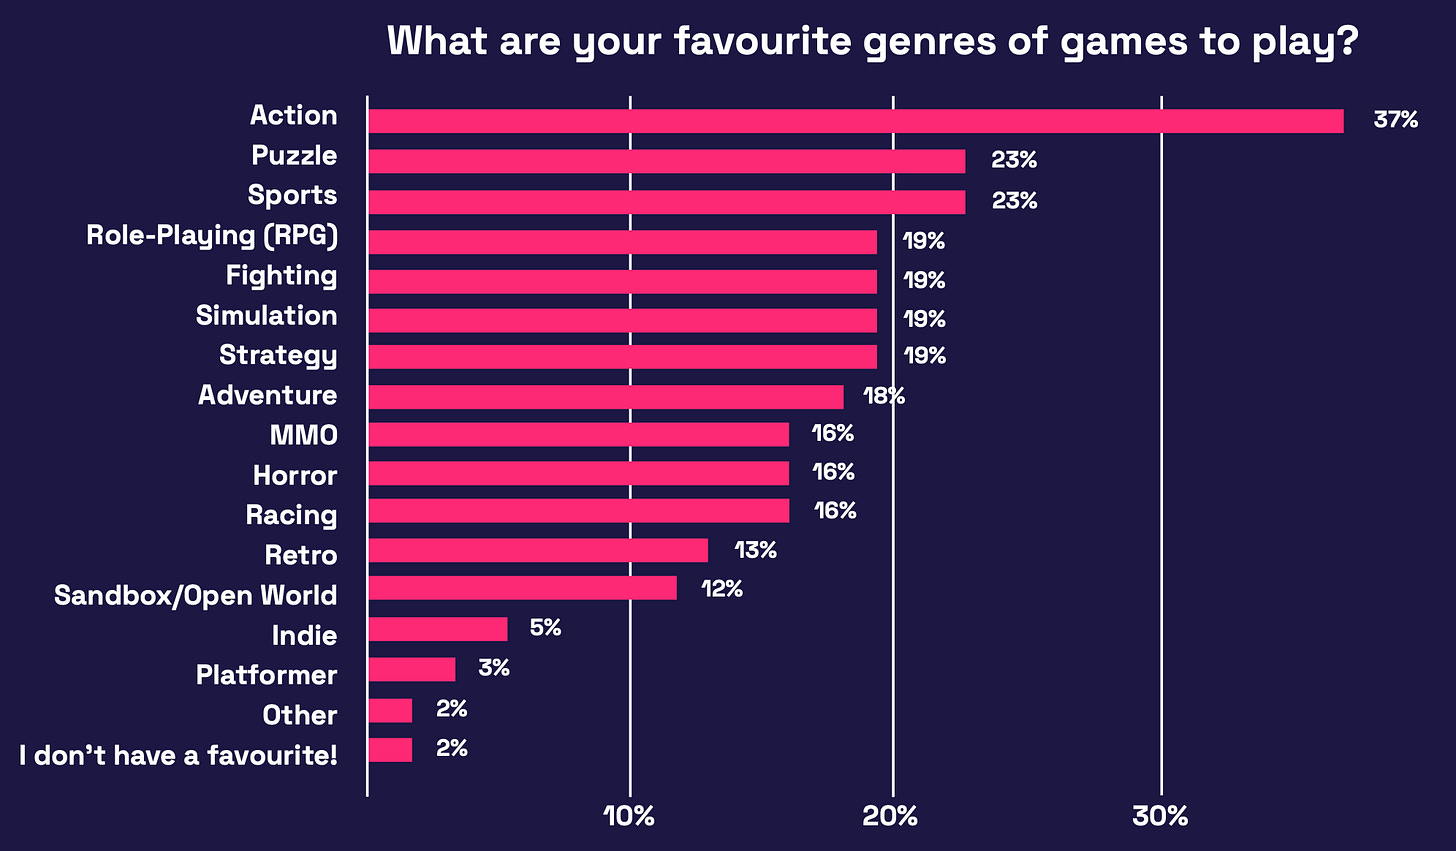
Users have different genre preferences. The most popular genres among respondents are action (37%), puzzles (23%), sports games (23%), RPG, fighting games, simulators, and strategies (19% each).
- The survey showed that young people watch YouTube the most. 45% of respondents watch 1-3 hours of gaming streams on the platform per week. 16% spend more than 4 hours watching gaming streams.
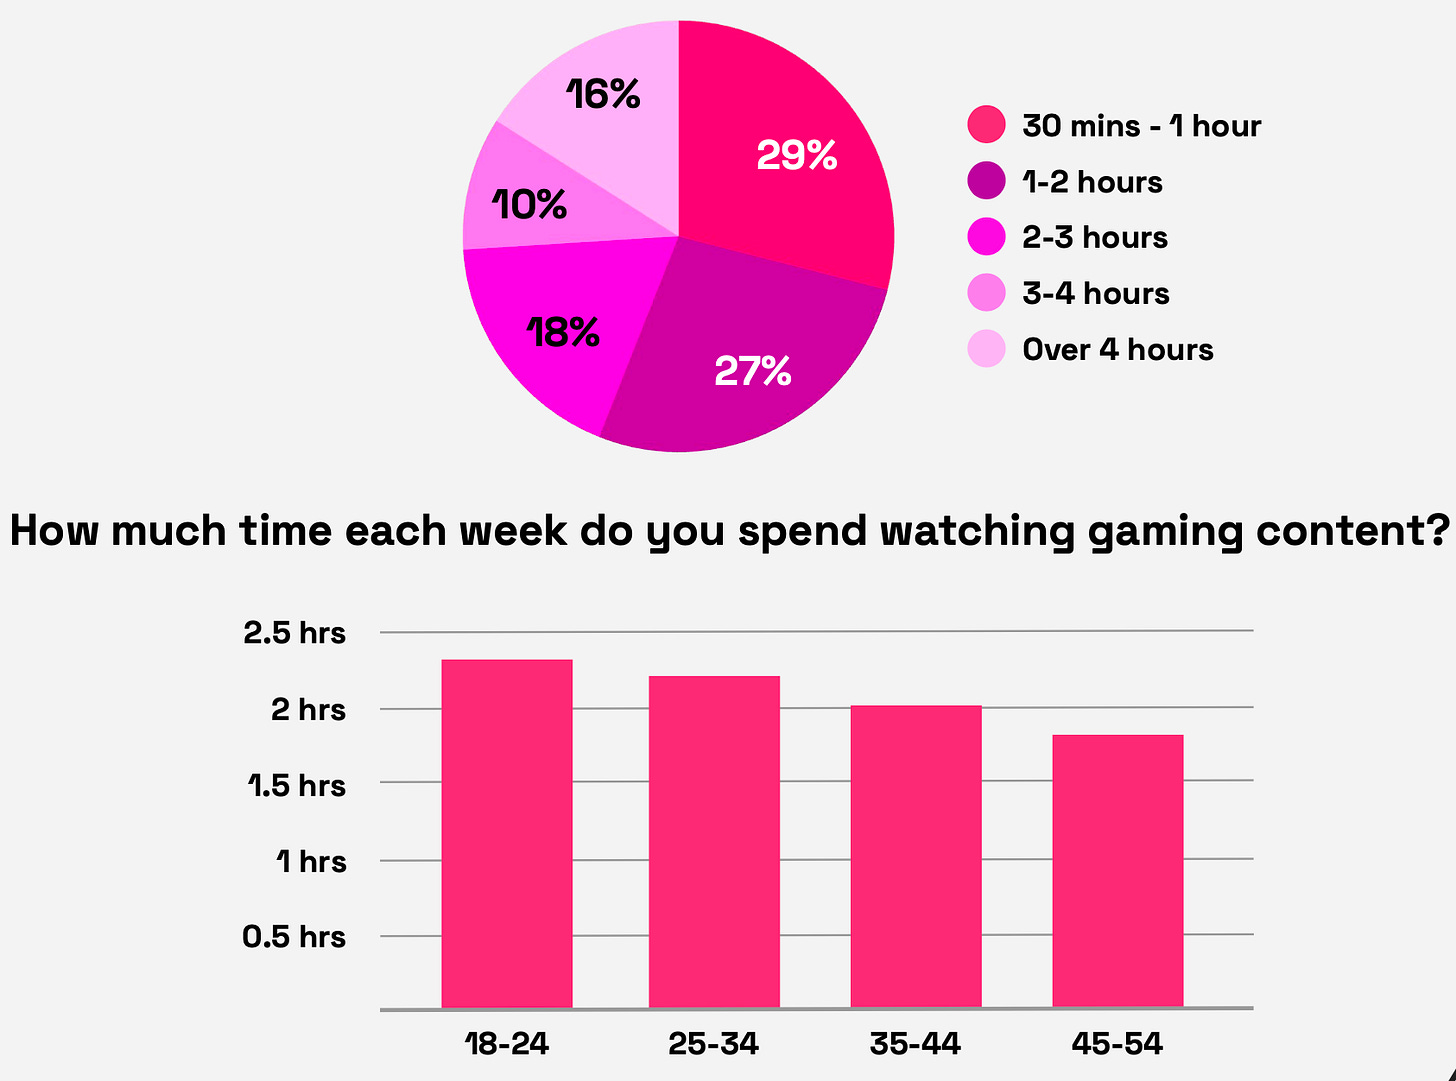
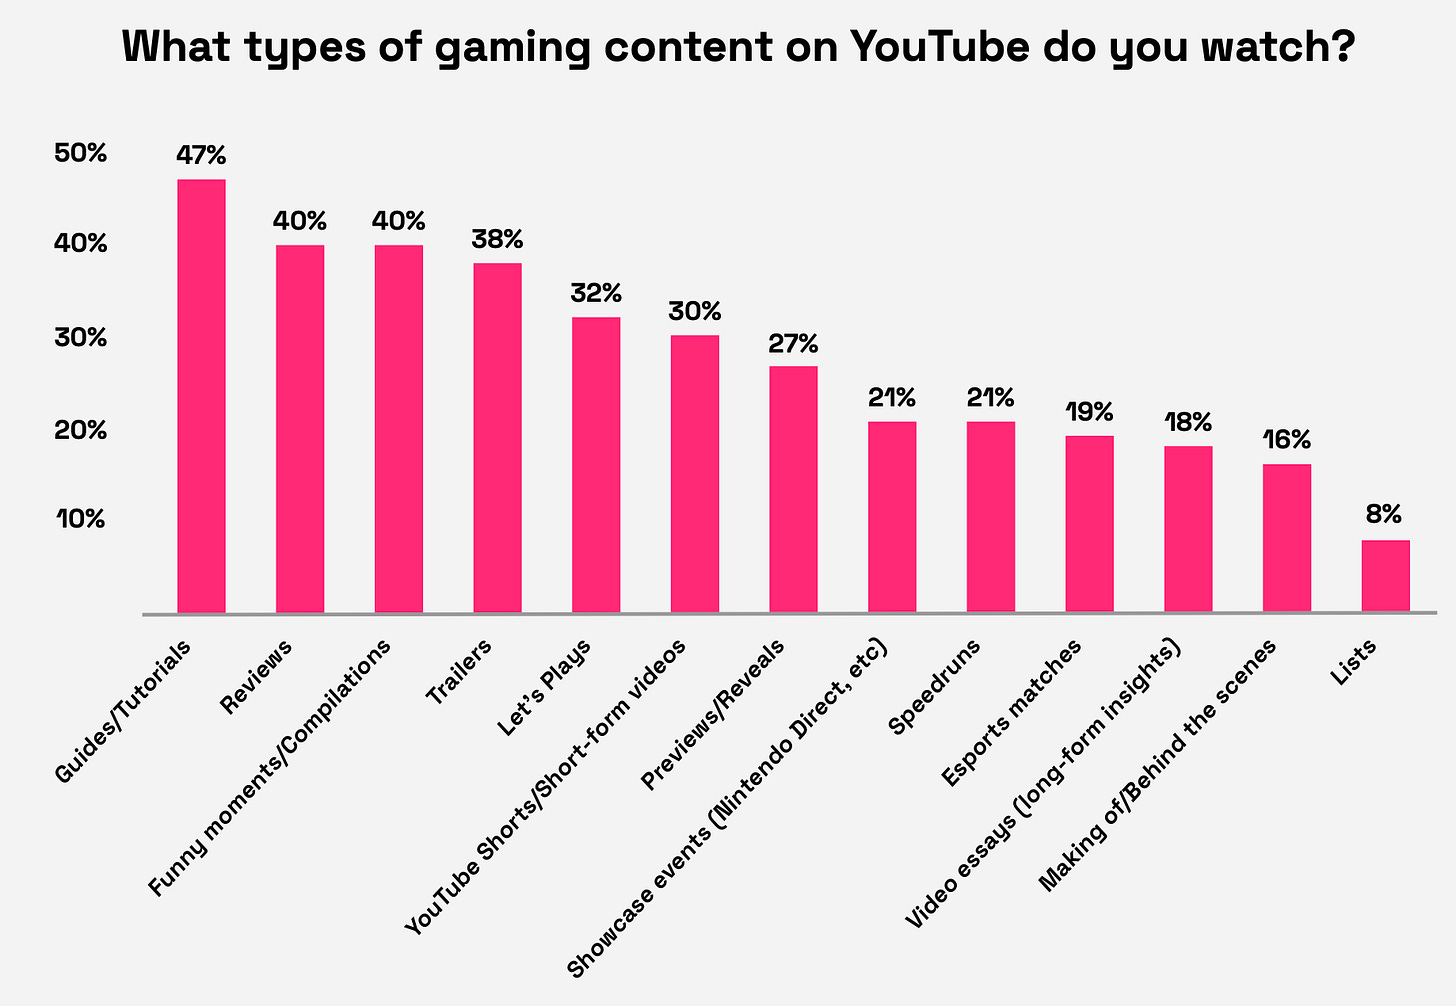
- The most popular categories among users are guides or tutorials (47%), reviews (40%), and compilations of funny or cool moments from games (40%).
- Users aged 18 to 24 are 2.5 times more likely to watch "Let's Play" videos than players aged 45-55.
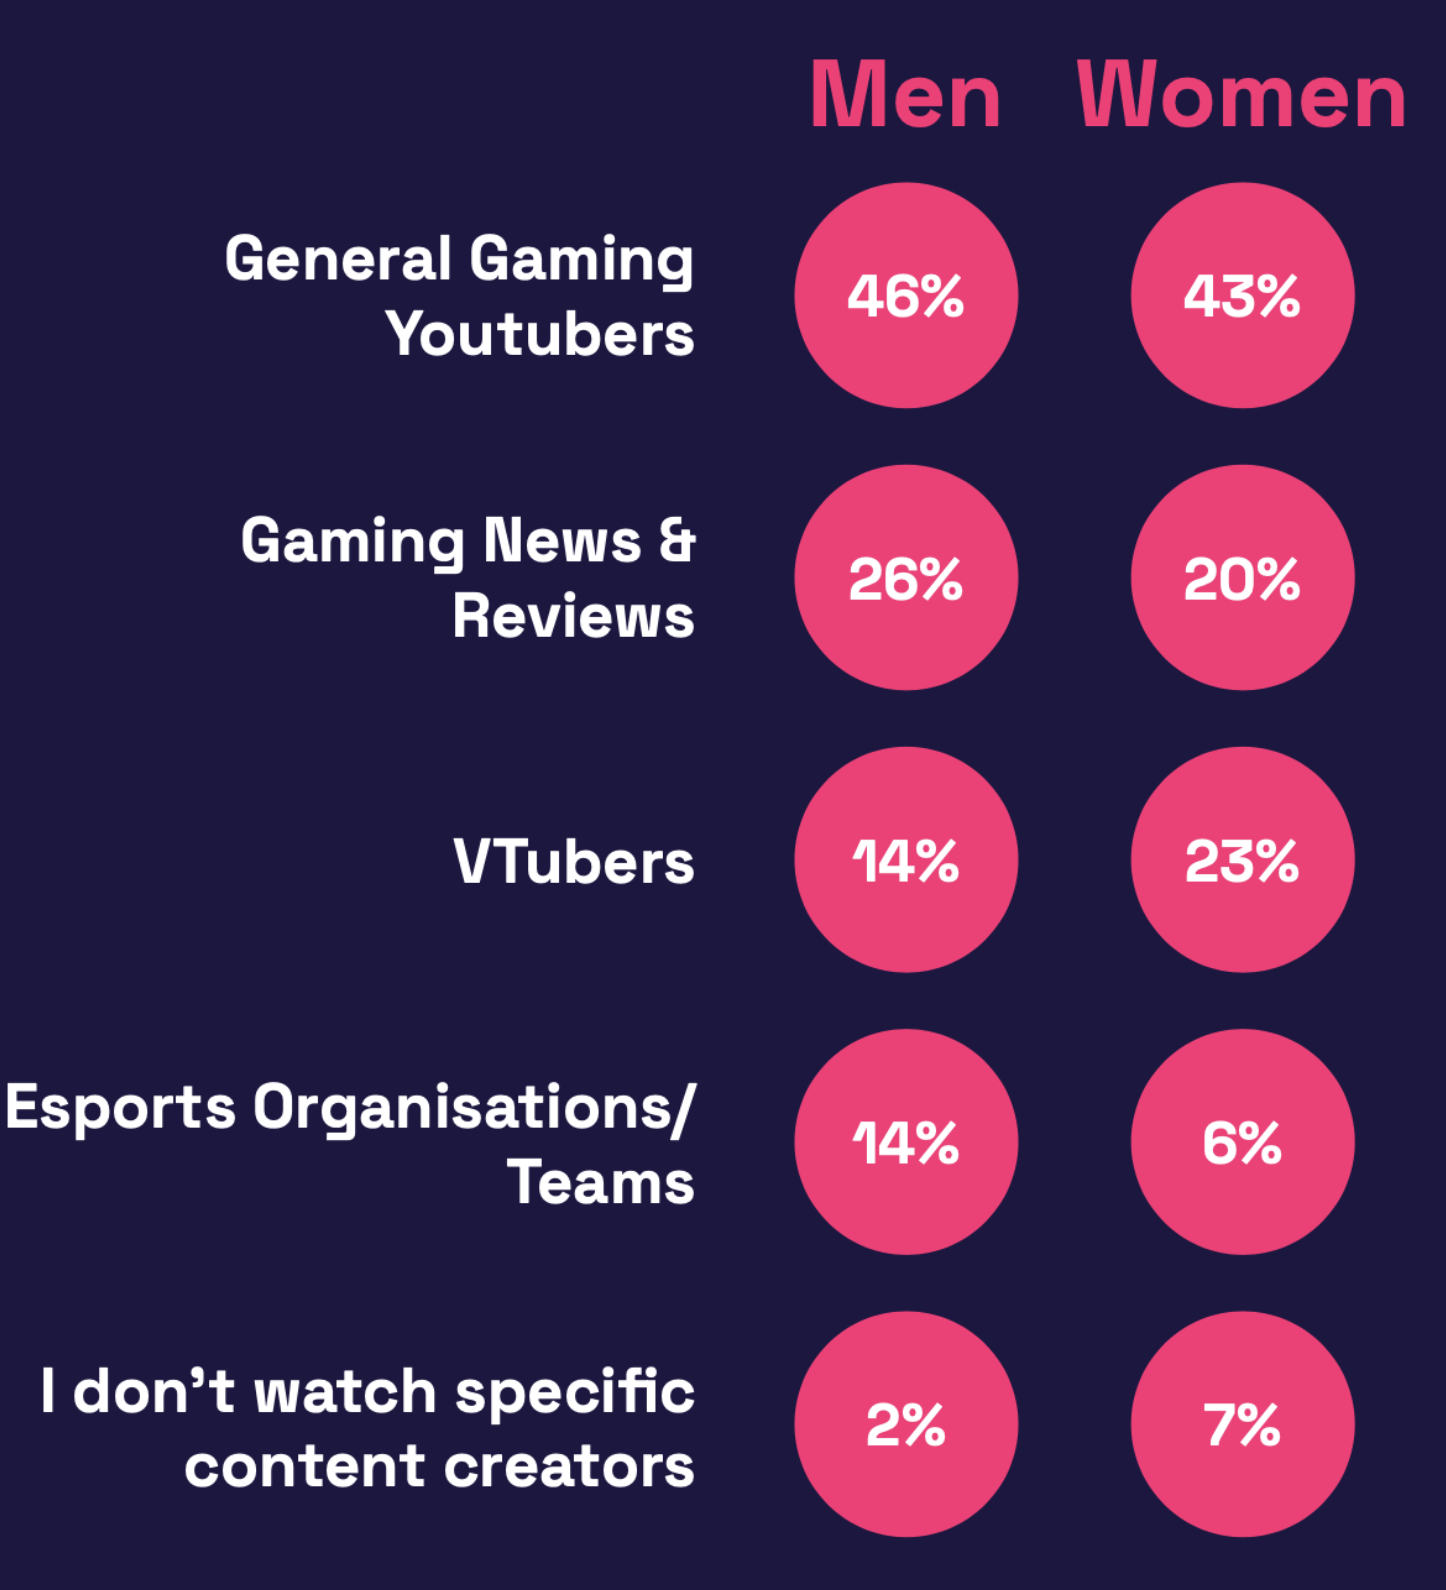
- Compilations of funny/cool moments are more popular among the female audience. Men, on the other hand, are twice as likely to watch esports videos.
-
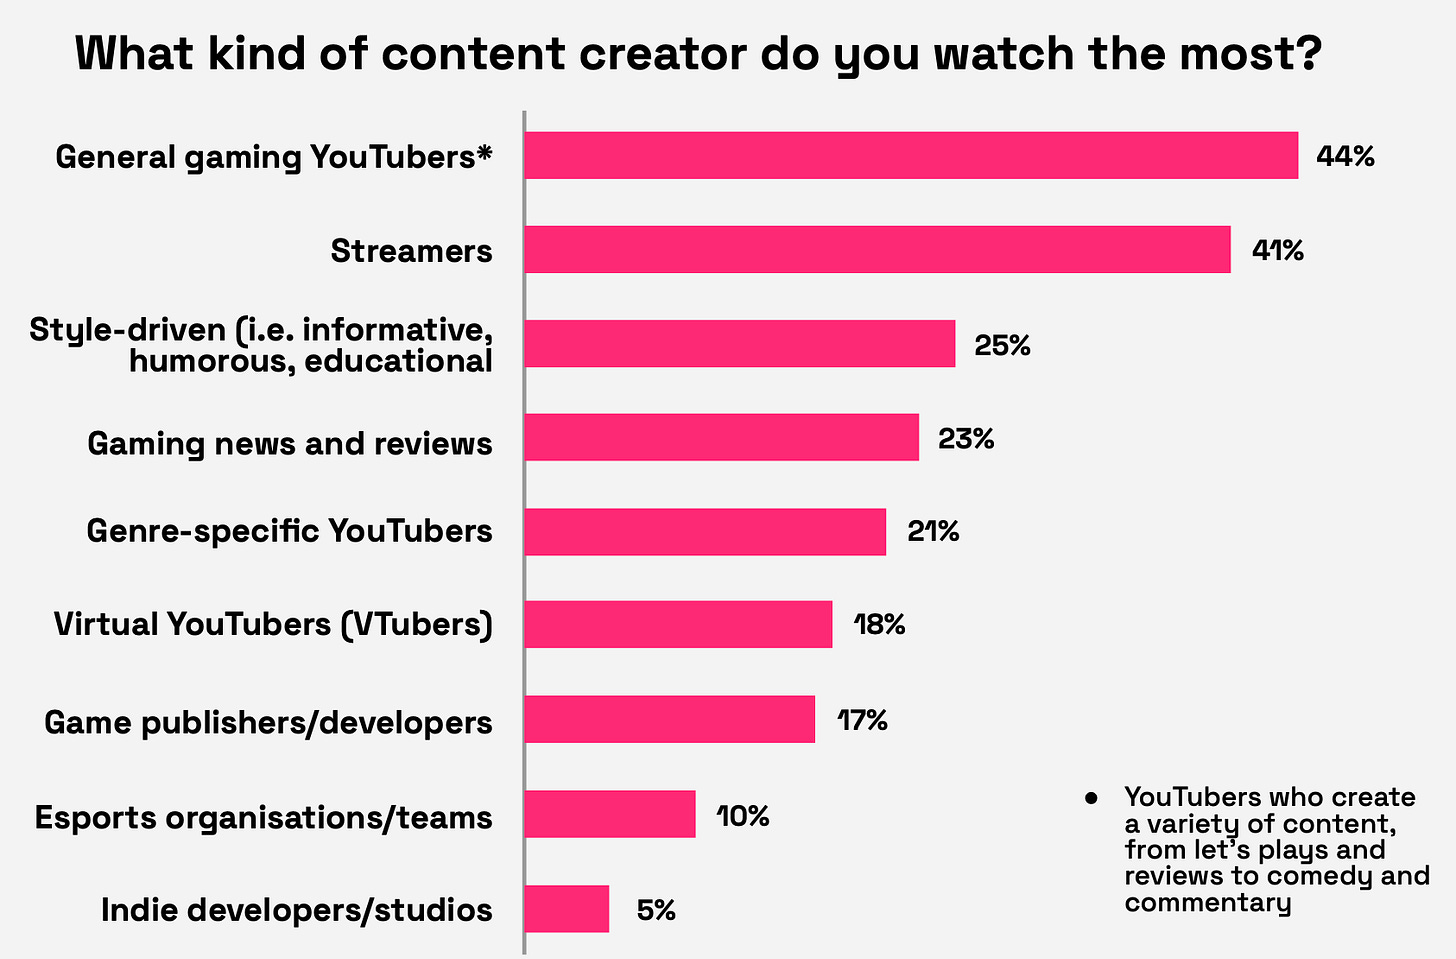
21% of respondents mainly watch only streamers who create content for games or genres they're familiar with. The majority of respondents watch diverse streamers producing different types of content.
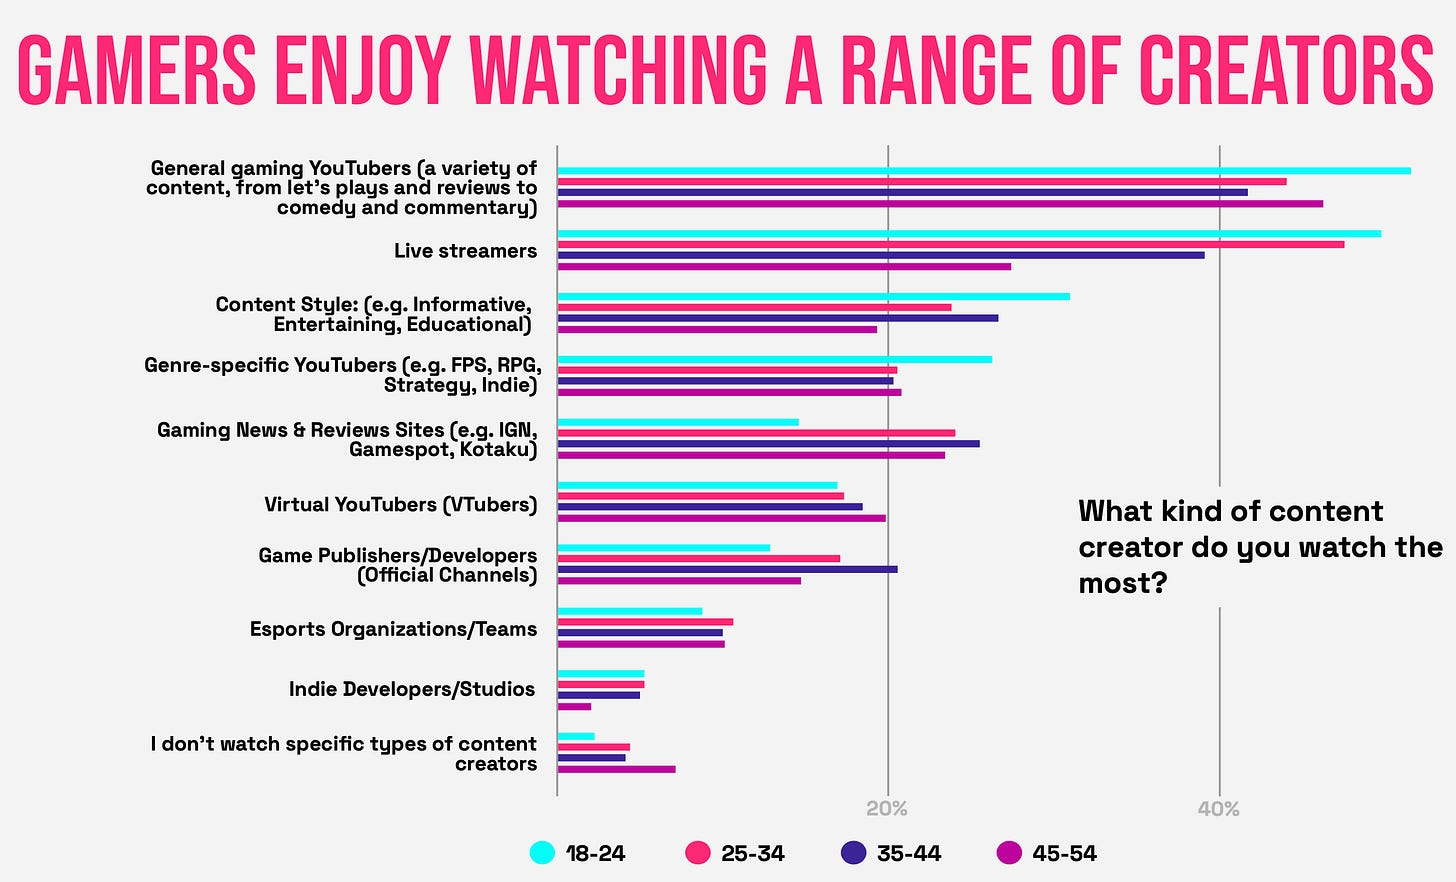
- The survey also showed that men are slightly more interested in gaming news and reviews, as well as esports competitions, than women. Women, in turn, are more likely to watch VTubers.
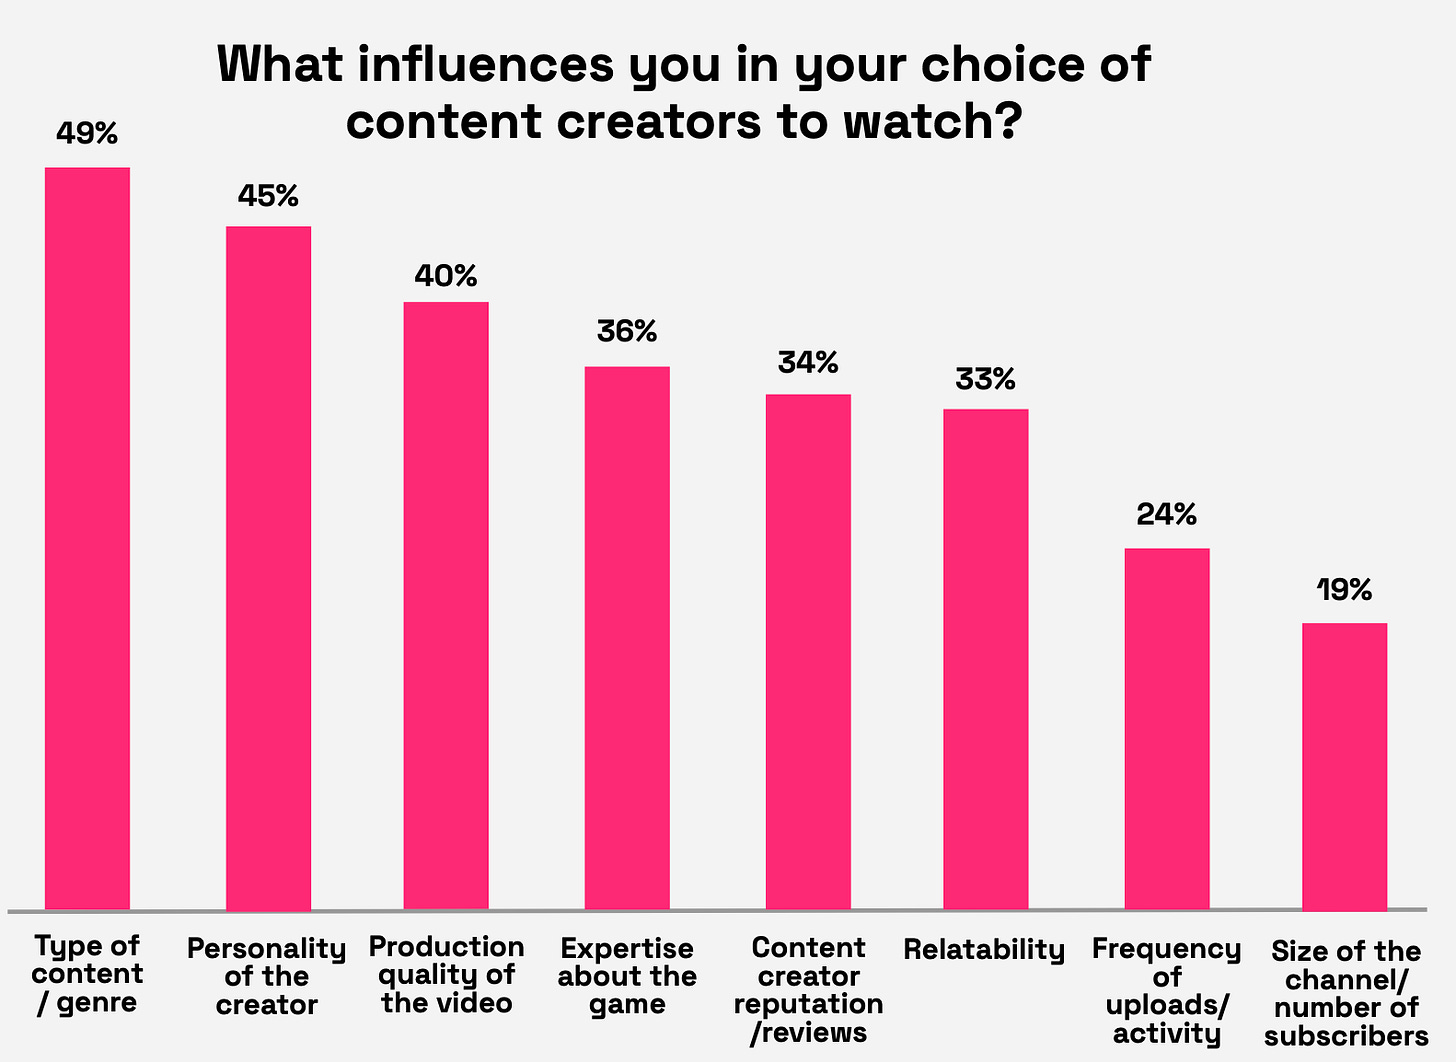
- When choosing a content creator, people rely on the type of content or genre the person works in (49%). For 45%, the creator's personality is important, 40% look at the quality of videos, 36% pay attention to how well the creator plays. Reputation (34%) and relatability (33%) are also important.
-
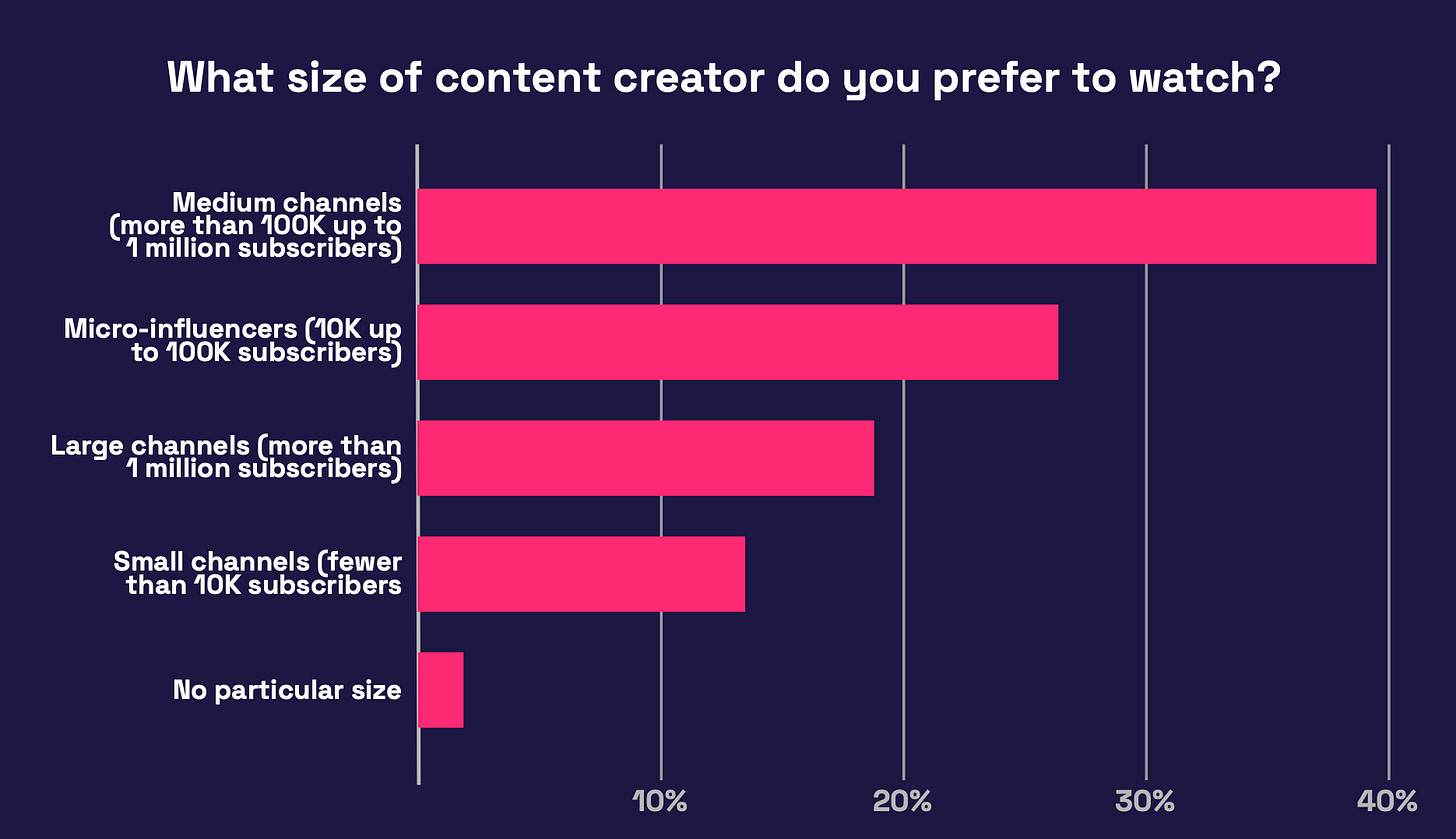
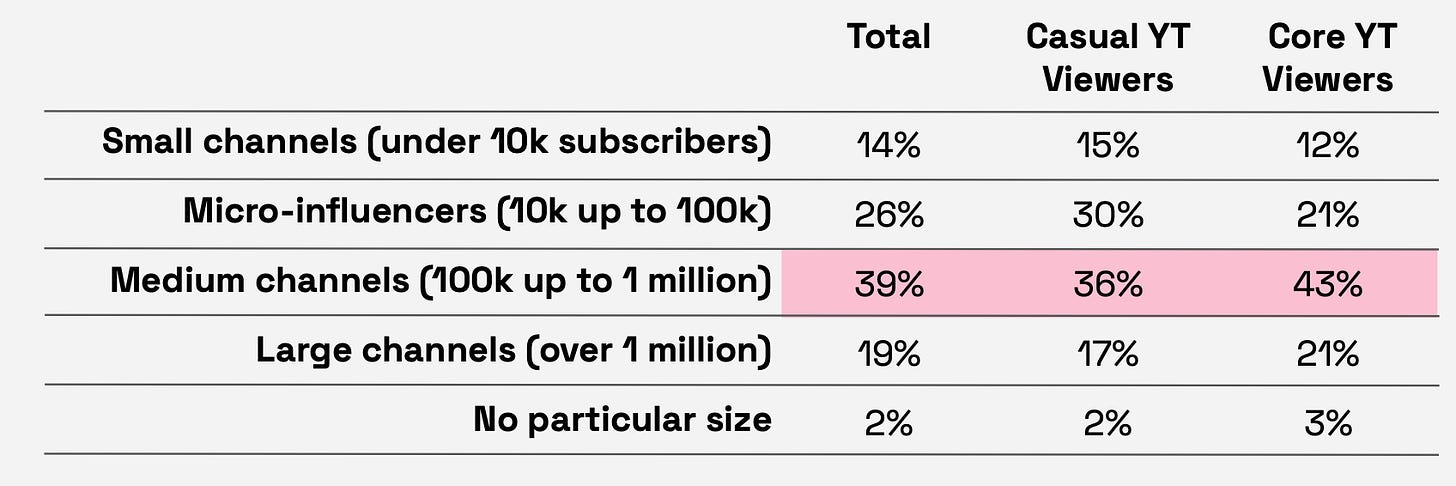
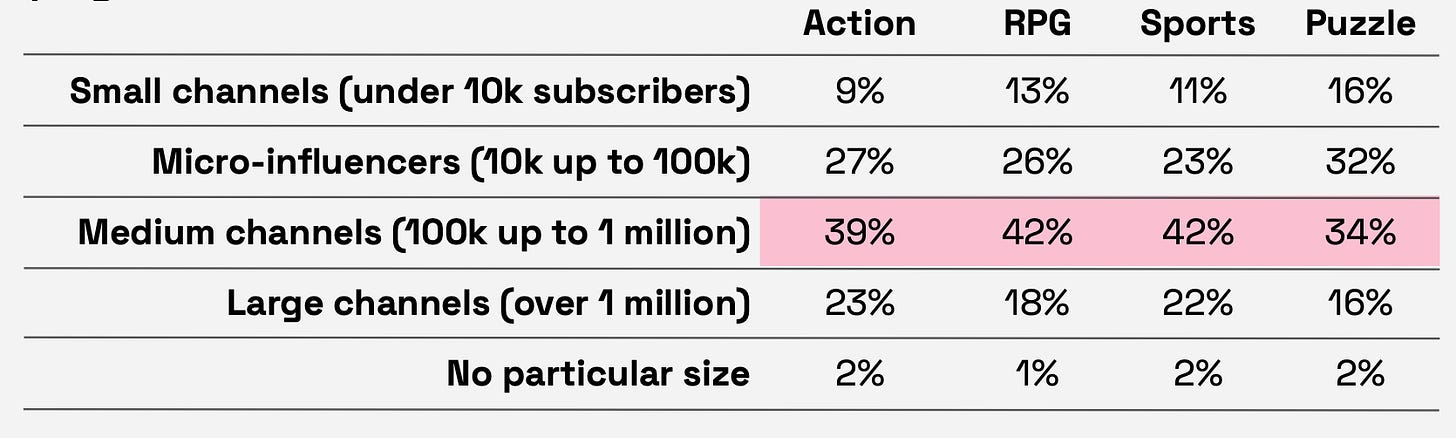
Audience size, as it turned out, is not very important to people. Most people indicated they prefer to watch medium-sized creators (from 100 thousand to a million subscribers) and micro-influencers (from 10 to 100 thousand subscribers).
-
Small channels are equally popular among both casual YouTube audiences (those who watch gaming content less than 2 hours a week) and YouTube enthusiasts.
-
Large YouTube channels are generally more popular among fans of action and sports games. This might be because these genres typically have a wider audience, making it easier to gain subscribers.
-
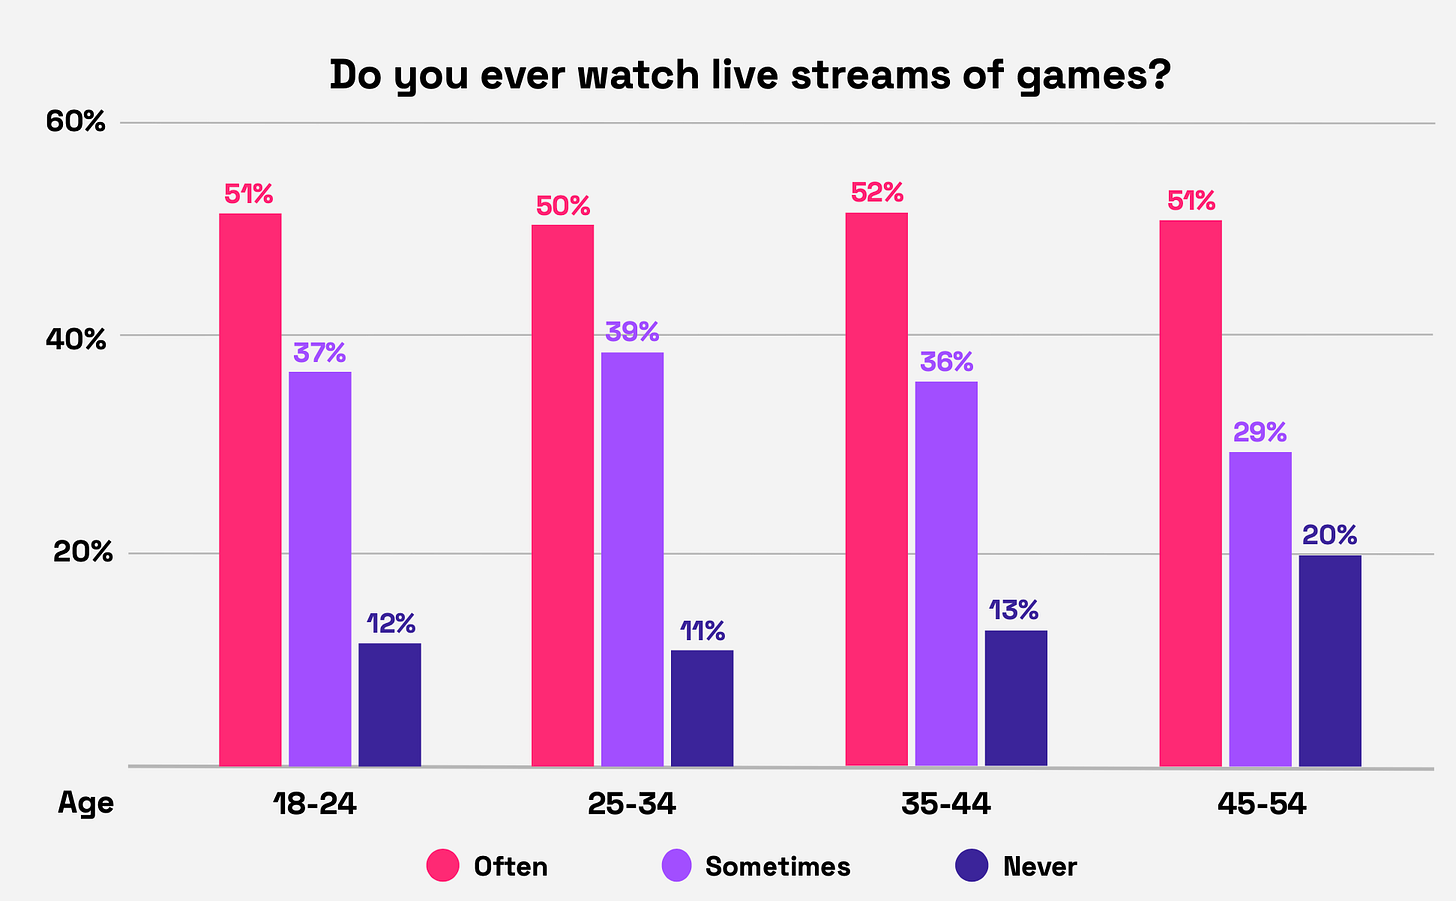
8 out of 10 gamers watch live streams. Among the audience aged 18 to 24, it's 9 out of 10.
-
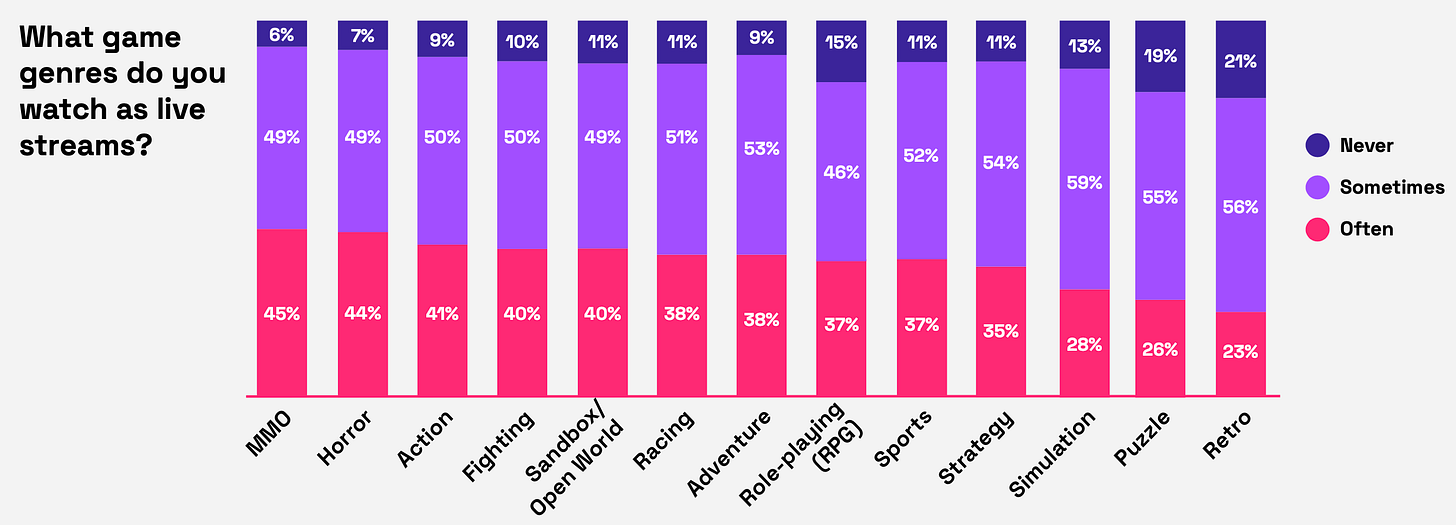
As the survey showed, people of all genres like to watch streams. Though, they are least popular among players of puzzles, simulators, and strategies.
-
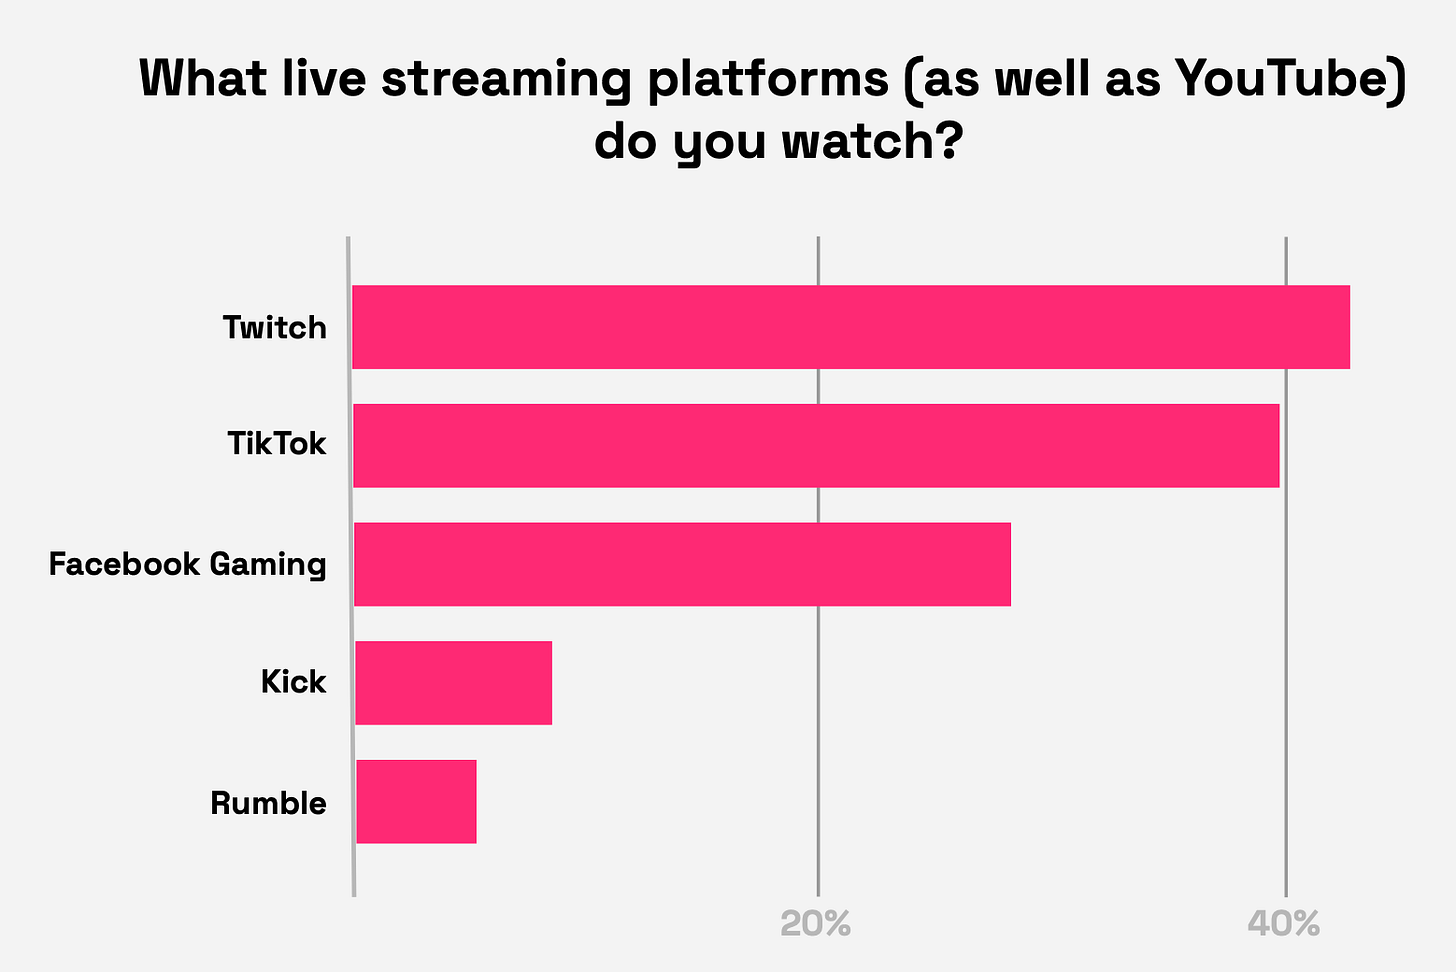
The influence of TikTok as a platform for watching gaming content is increasing. TikTok has closely approached Twitch (a platform specializing in this) in terms of popularity.
-
46% of people who named PlayStation as their main platform watch live game broadcasts on TikTok. The platform is also popular among the female audience - 41% said they watch live broadcasts there.
SocialPeta: Mobile Game Marketing in 2024

General Market Overview
-
In 2024, the number of advertisers in the market increased by 60.4% to 259.7 thousand companies. The growth was stronger only in 2023 (+70.1% YoY). SocialPeta expects this figure to grow even more in 2025.
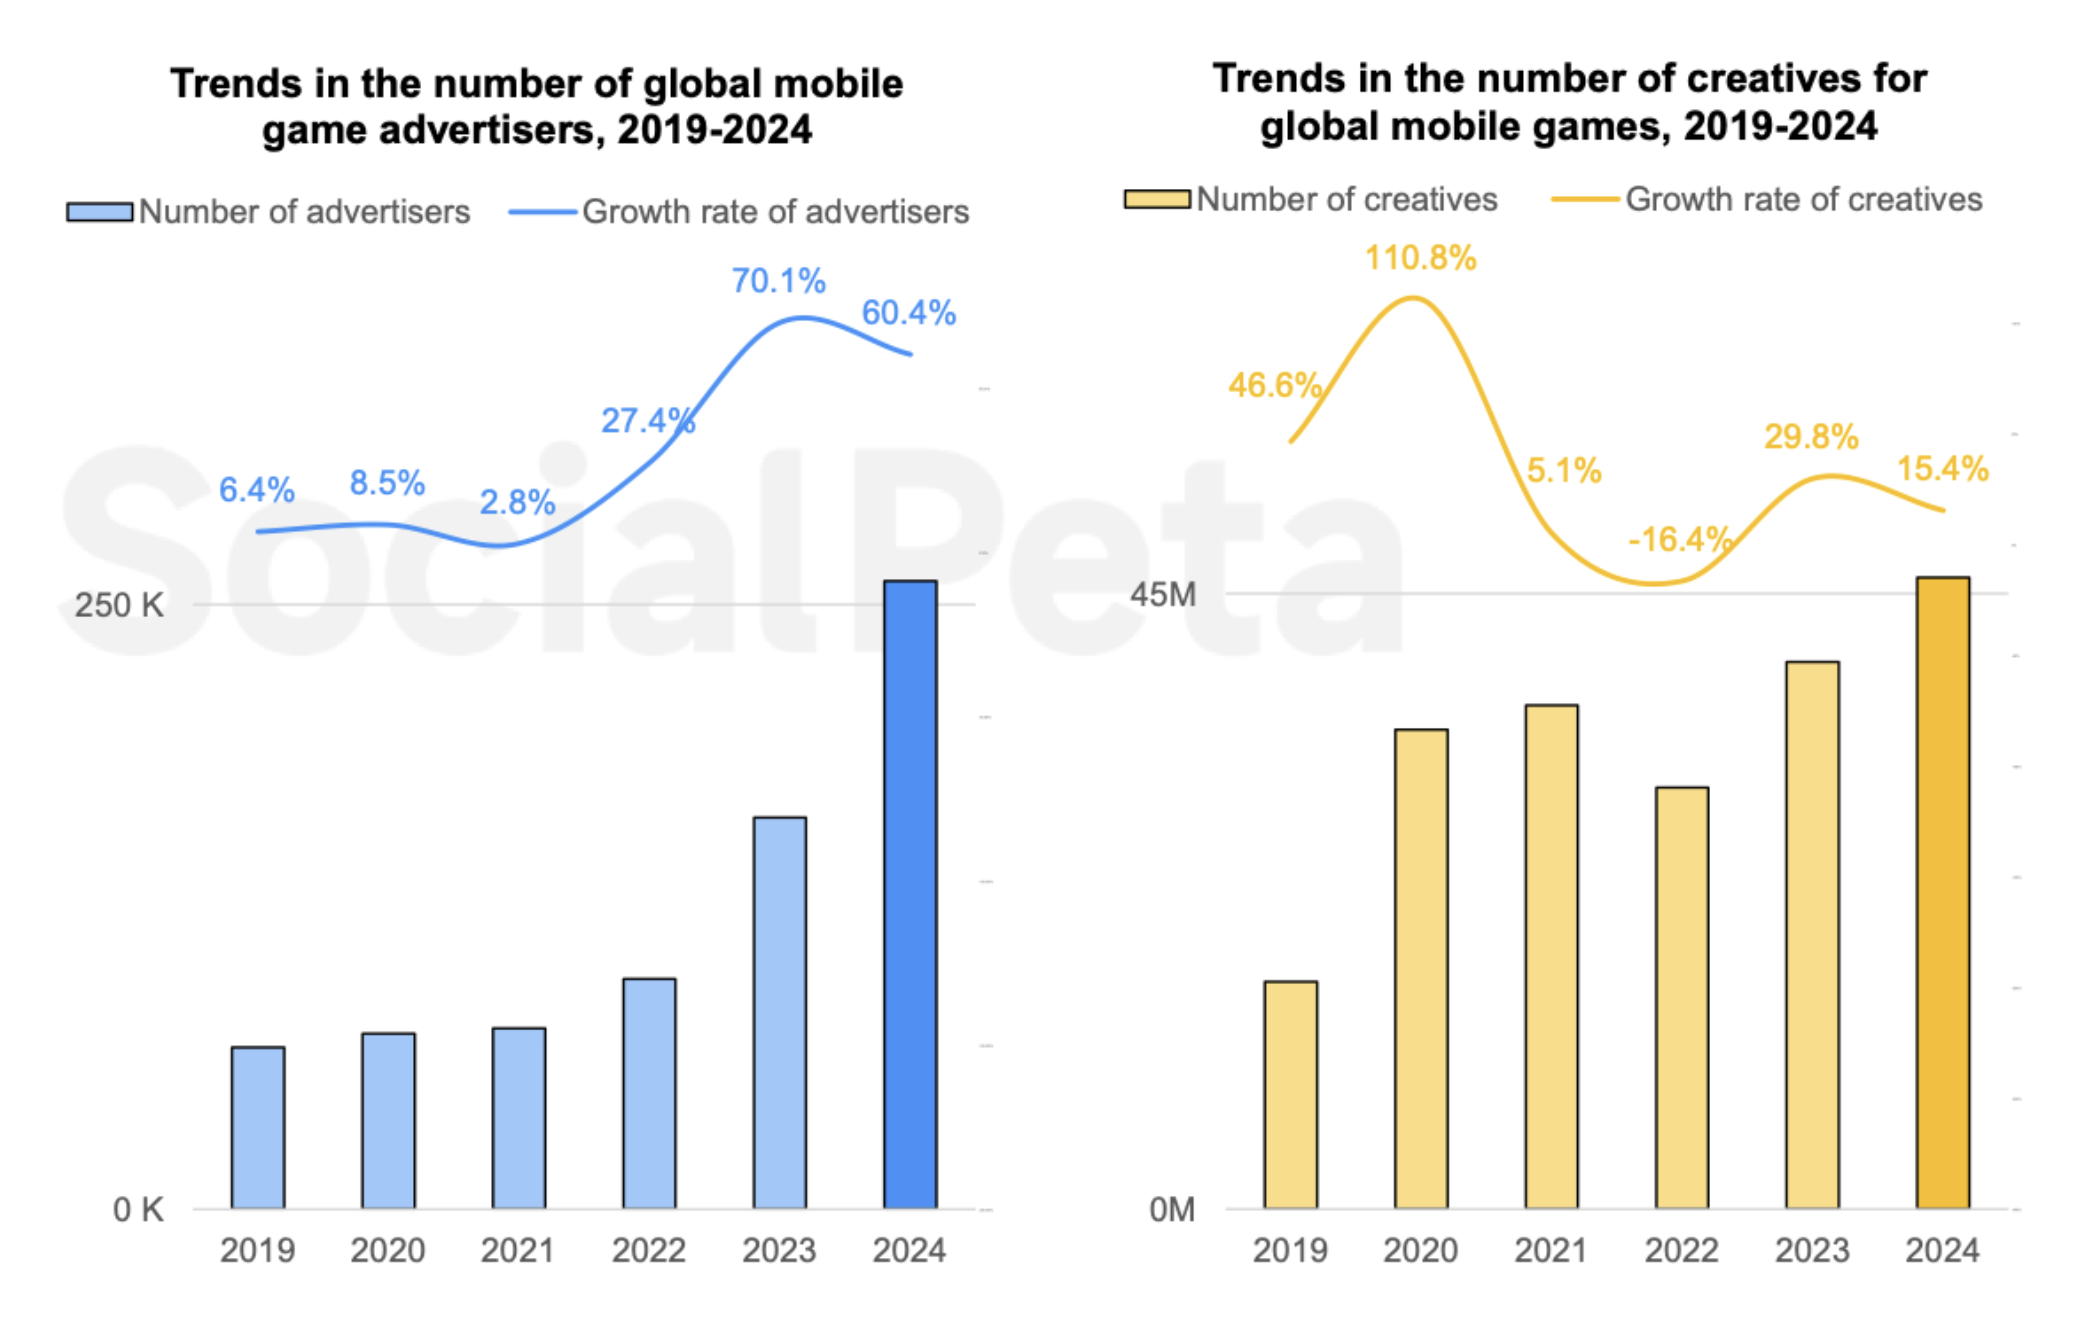
- The number of creatives grew by 15.4% and reached 46.2 million.
- The average monthly number of advertisers in the mobile gaming market in 2024 increased by 34.7% to 66.1 thousand publishers.
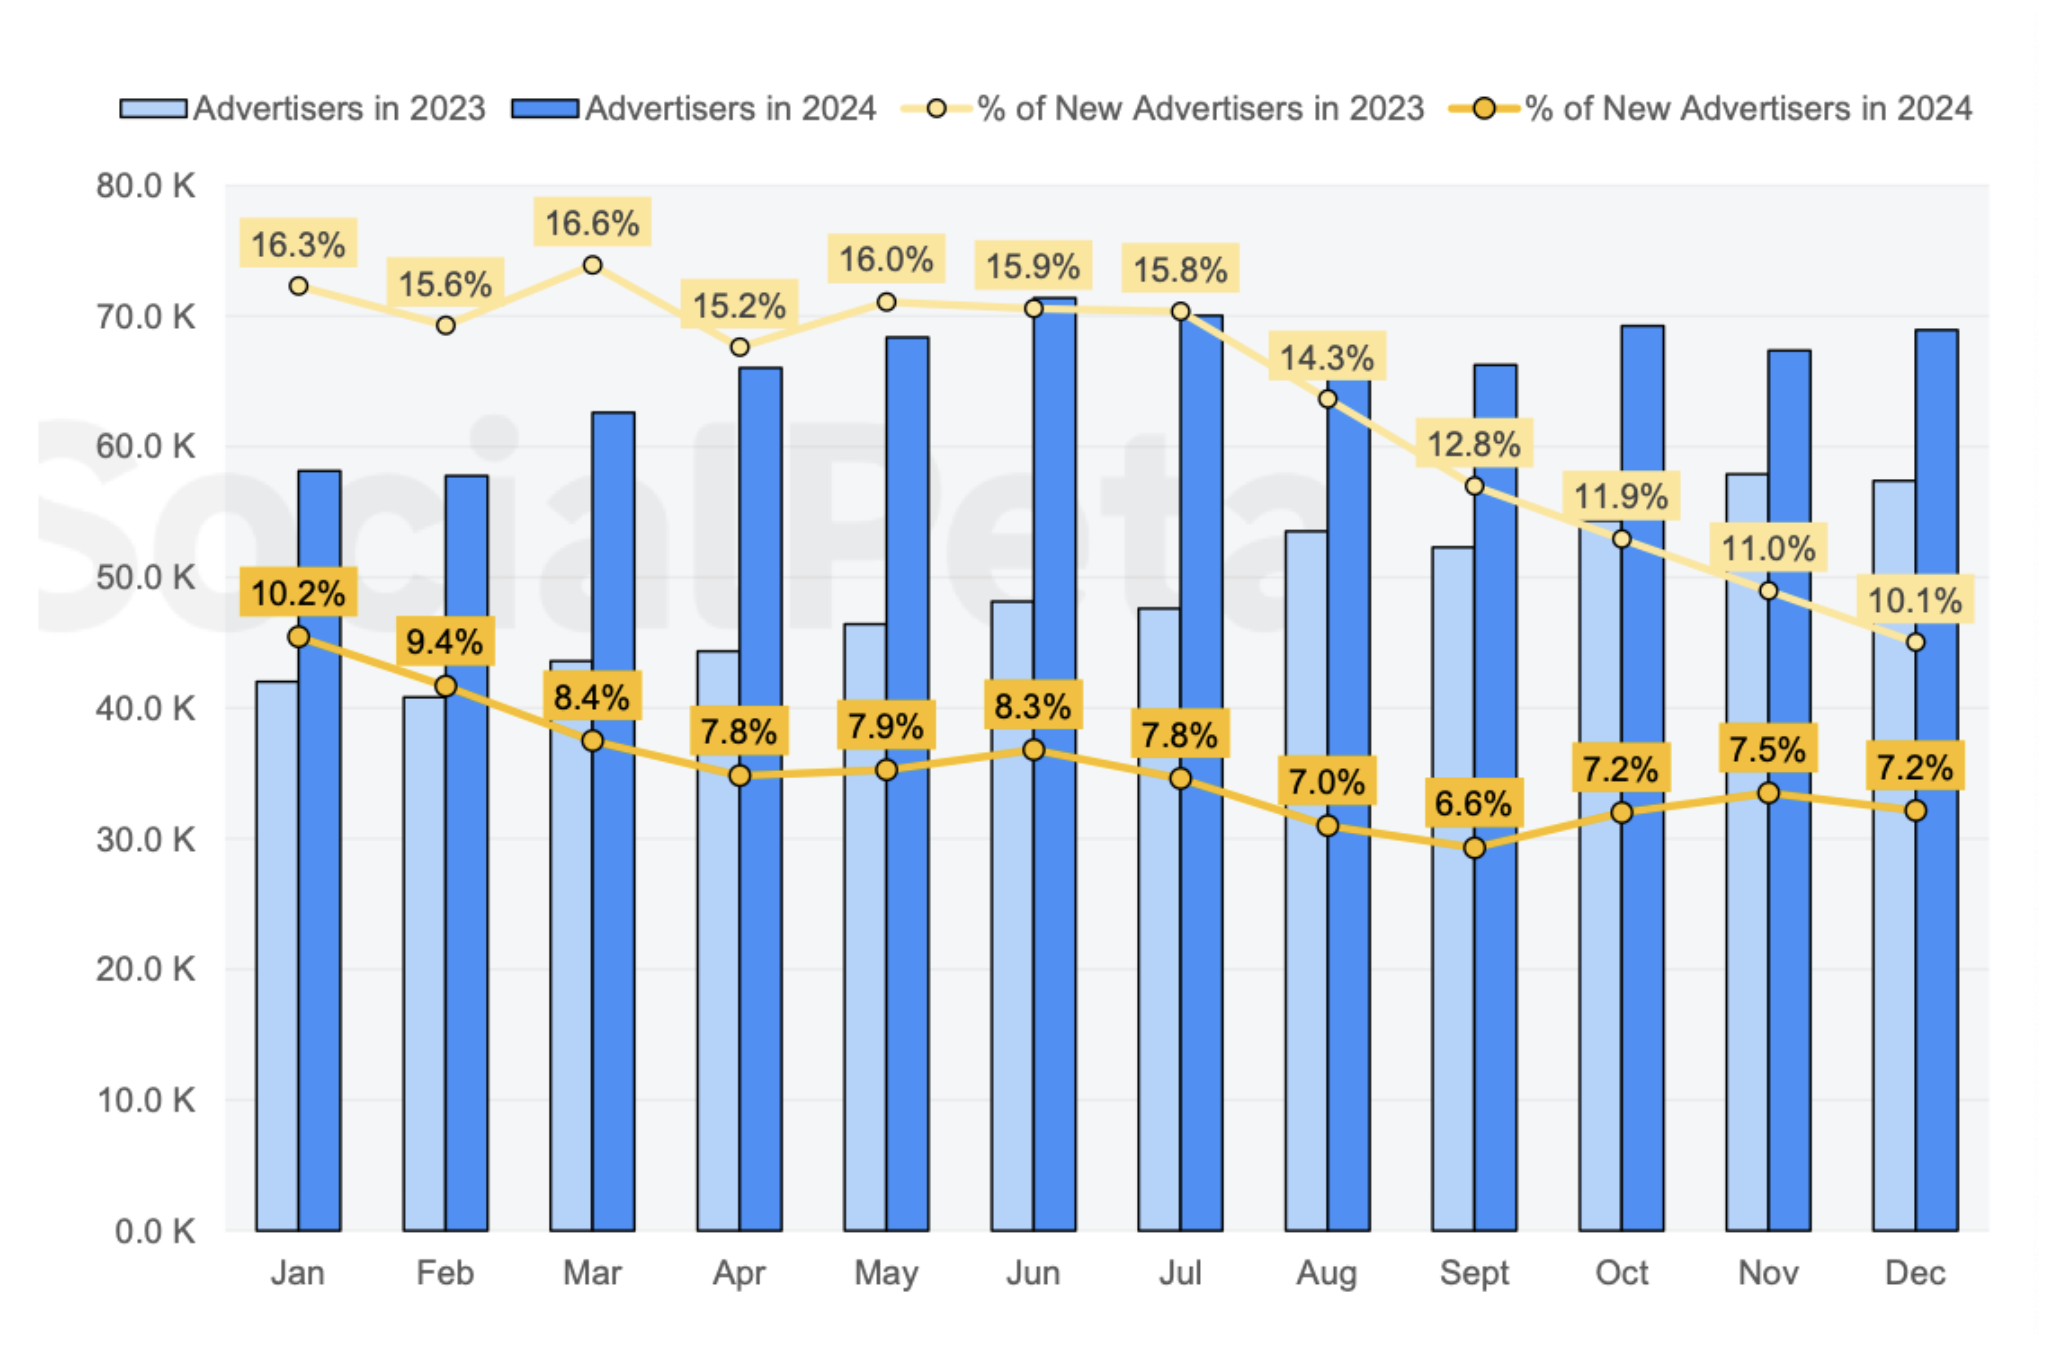
- At the same time, the share of new advertisers significantly decreased compared to 2024. Activity is mainly concentrated among already established companies.
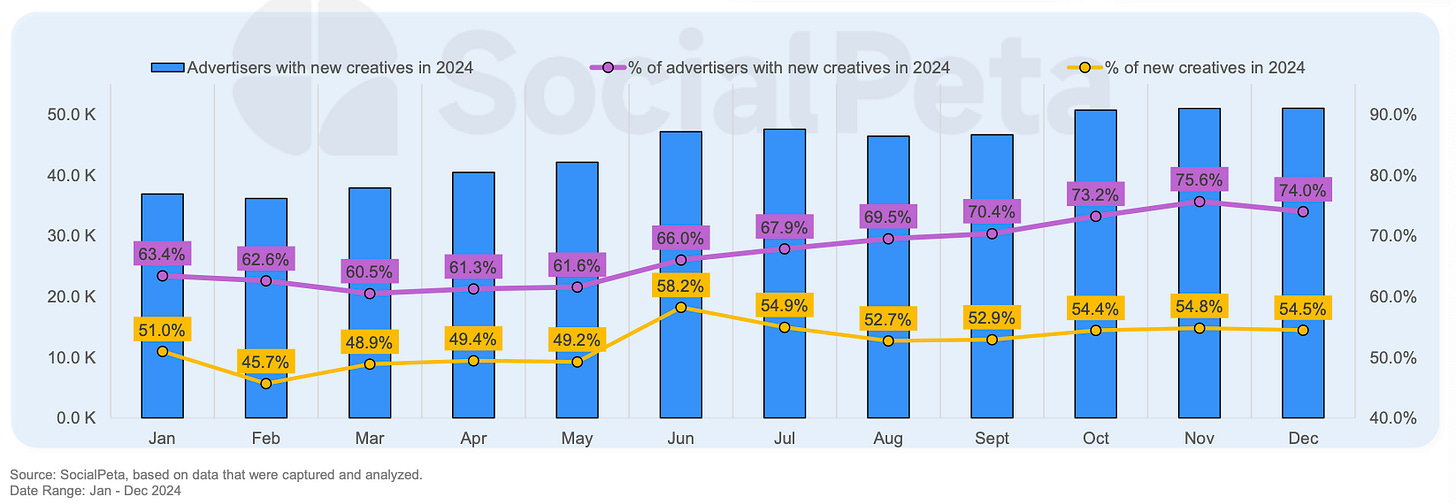
- Throughout 2024, the share of advertisers with new creatives increased. The share of new creatives from the total volume within the year amounted to 52.2%.
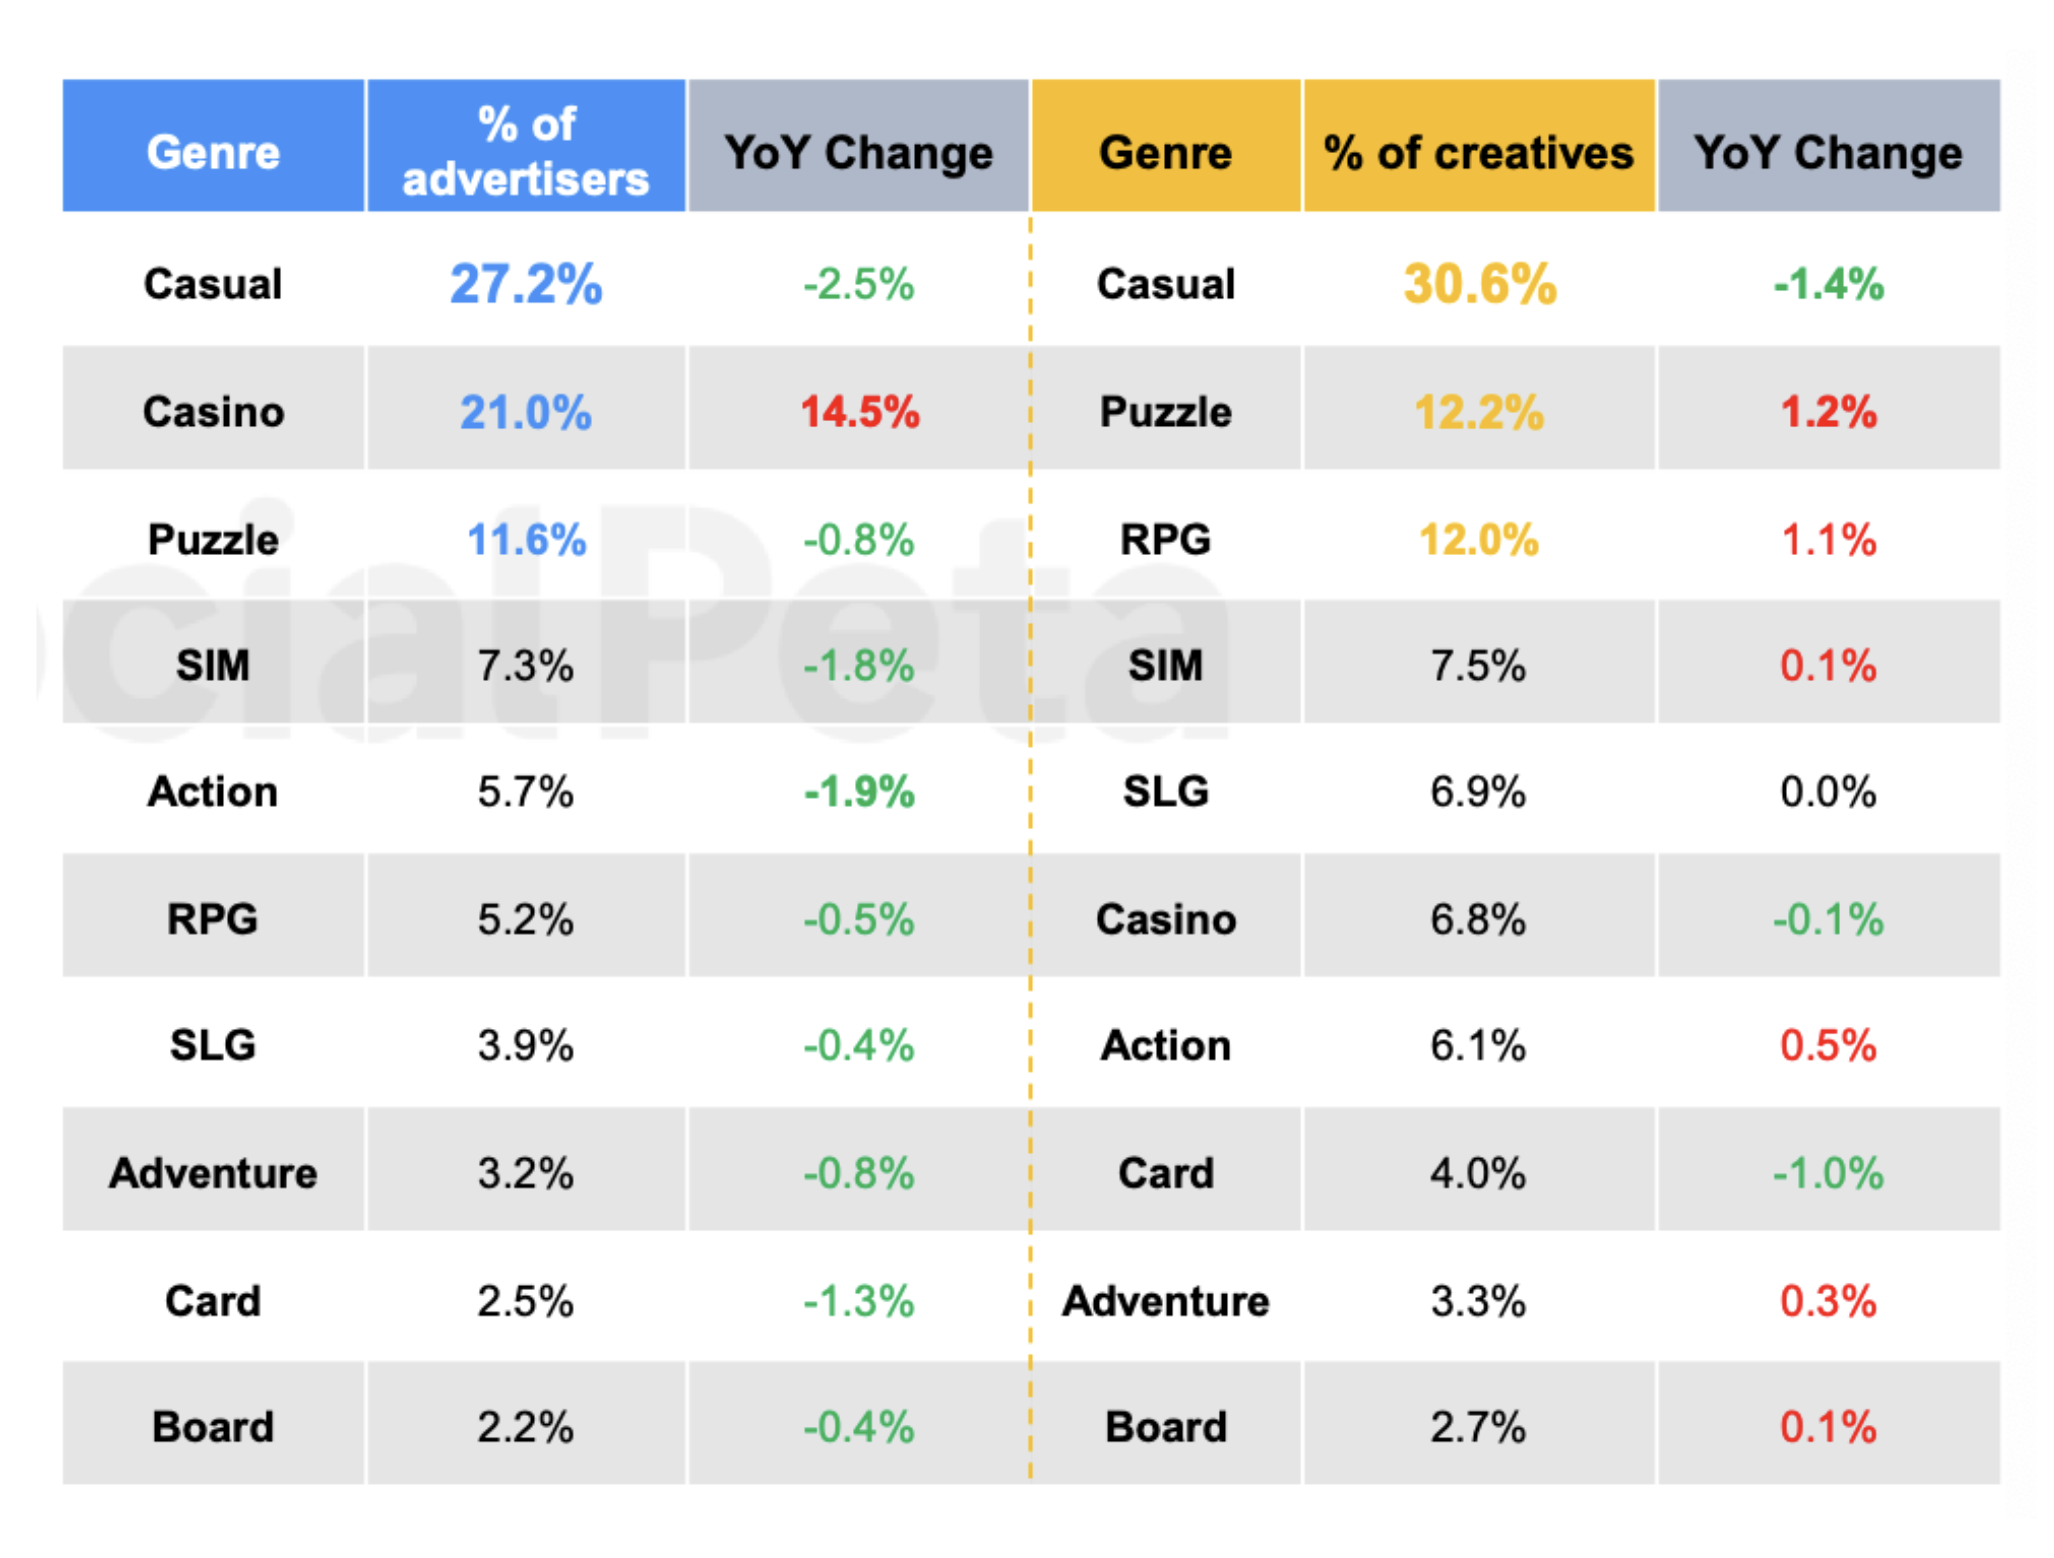
- Most advertisers are in the casual segment (27.2% of the total), casino (21%), and puzzles (11.6%). Most creatives are produced by casual project authors (30.6% of the total volume), puzzles (12.2%), and RPGs (12%).
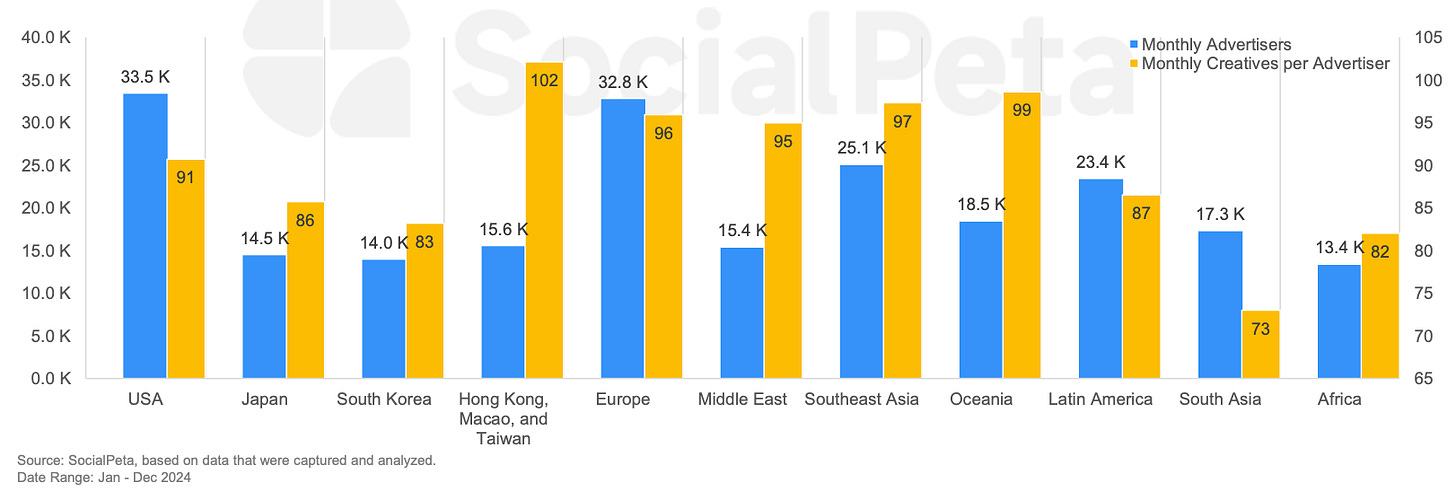
- The USA is the region with the largest number of advertisers, while Hong Kong, Macau, and Taiwan are the countries with the highest average number of creatives per advertiser.
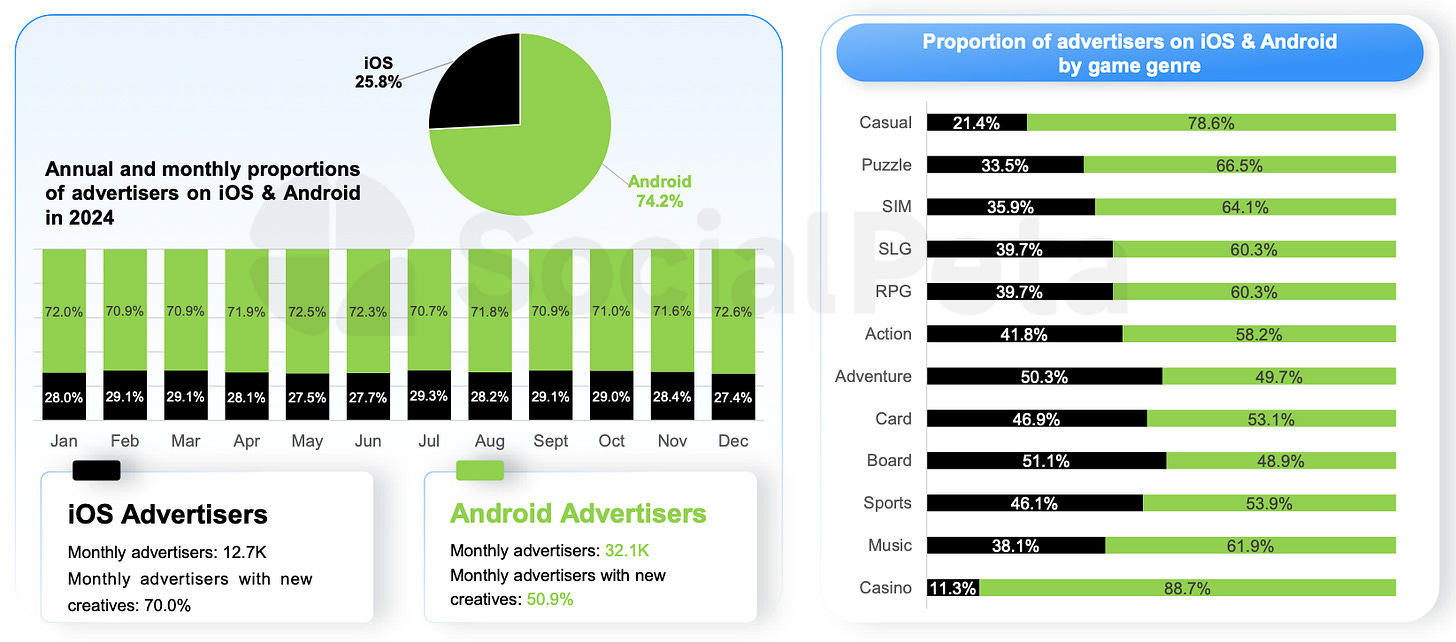
- Android accounts for 74.2% of all advertisers, while iOS accounts for 25.8%. Interestingly, iOS has a higher share in some genres (board games, adventure).
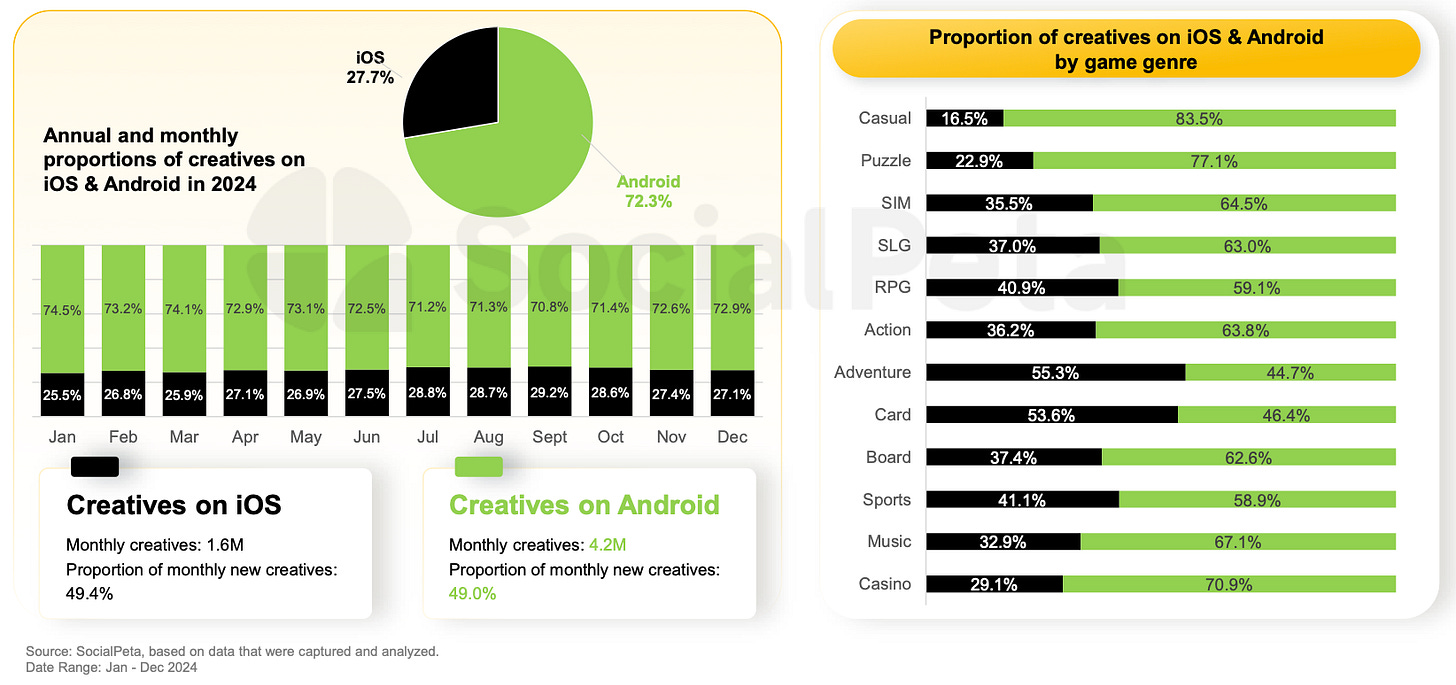
- Android accounts for 72.3% of all creatives on the market. The share of new creatives is almost equal between iOS and Android—49% each.
- In 2024, the share of video creatives decreased (from 74.1% in 2023 to 67.2% in 2024), while static creatives increased (from 21.6% in 2023 to 27.5% in 2024).
❗️ This may be related to AI adoption.
- Nevertheless, video ads remain leaders in terms of impressions volume.
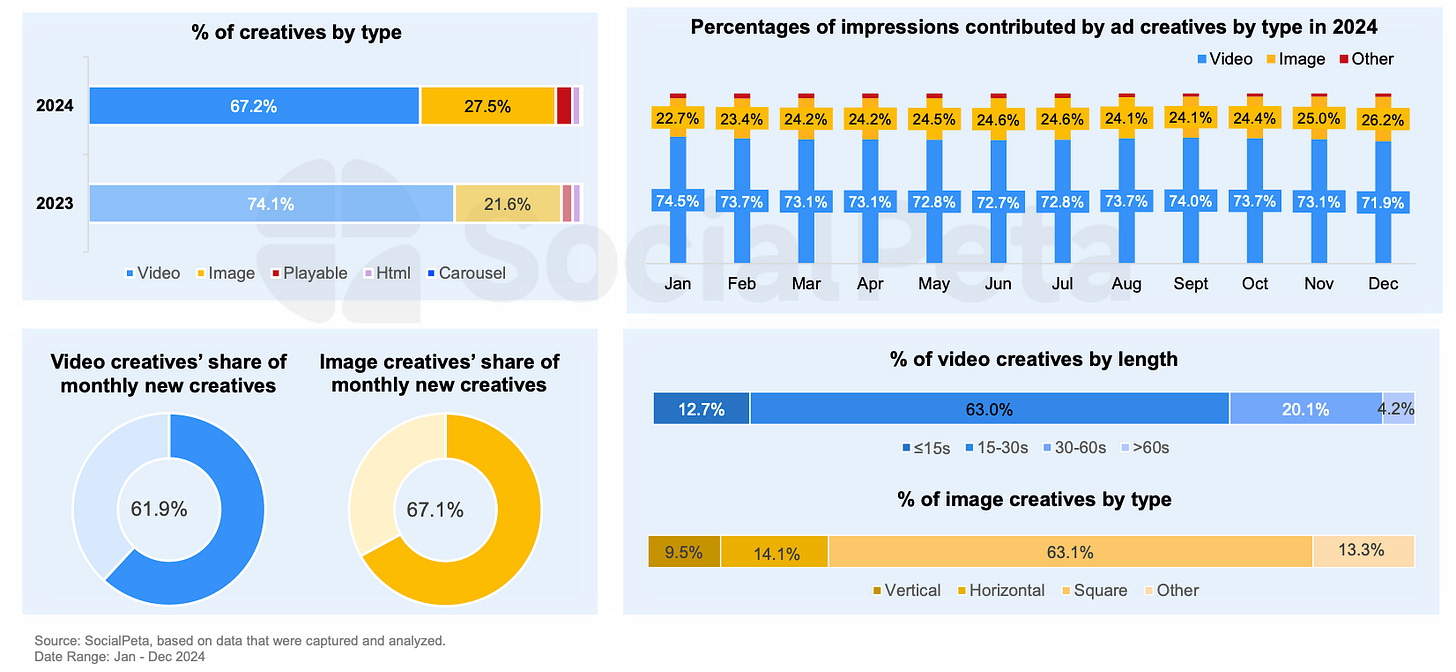
- Most video creatives on the market are between 15 and 30 seconds long. Most static images in advertising are square-shaped.
Leaders in 2024
-
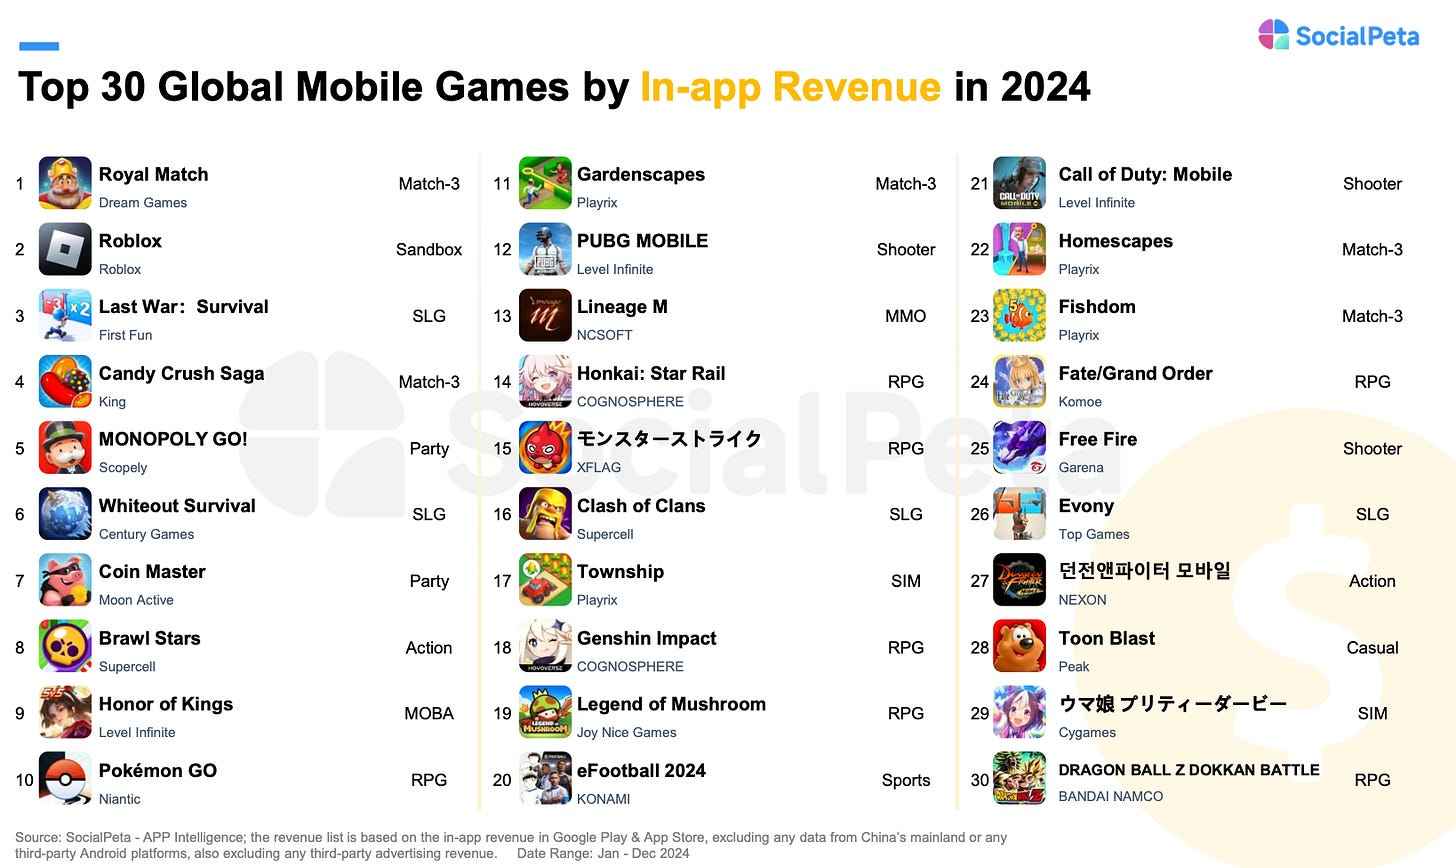
Royal Match, Roblox, Last War: Survival—top-3 by IAP revenue in 2024.
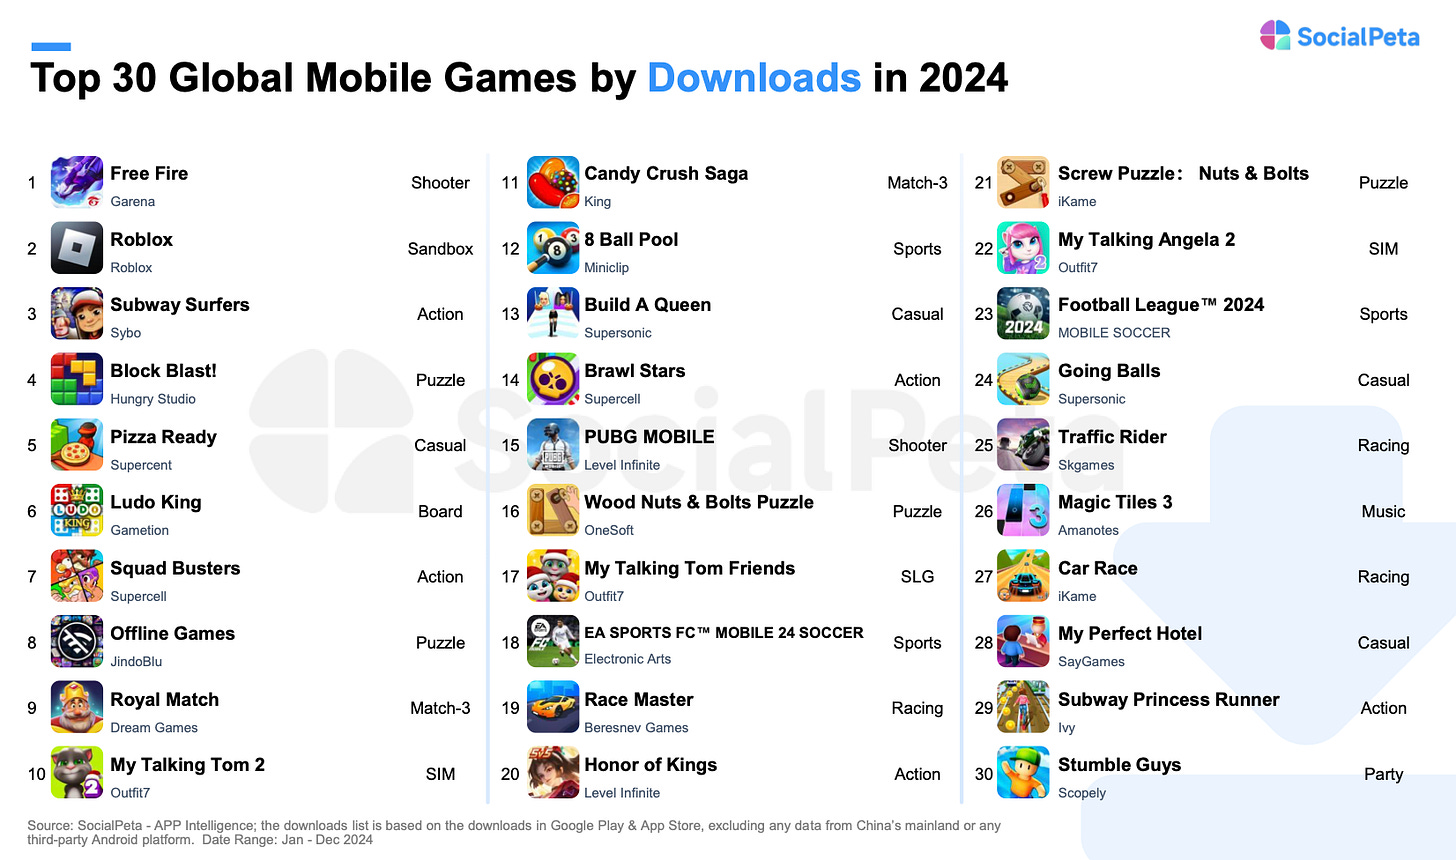
- Leaders by downloads—Garena Free Fire, Roblox, and Subway Surfers.
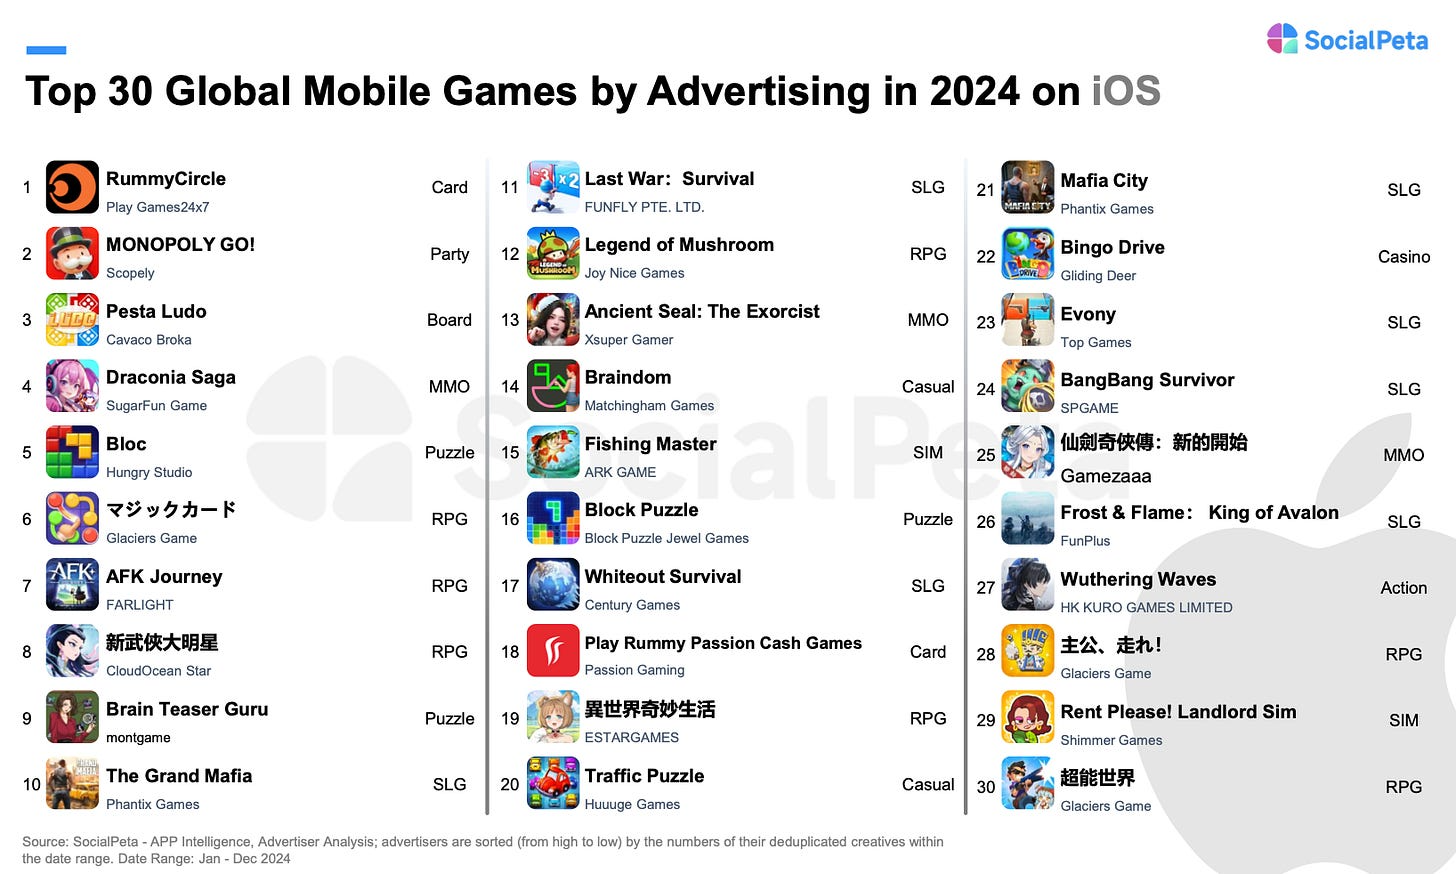
- Leaders in advertising on iOS are unusual: RummyCircle, MONOPOLY GO!, and Pesta Ludo.
- On Android, too, there are unexpected names among advertising leaders—Jewel Abyss, The Grand Mafia, and Block Blast!.
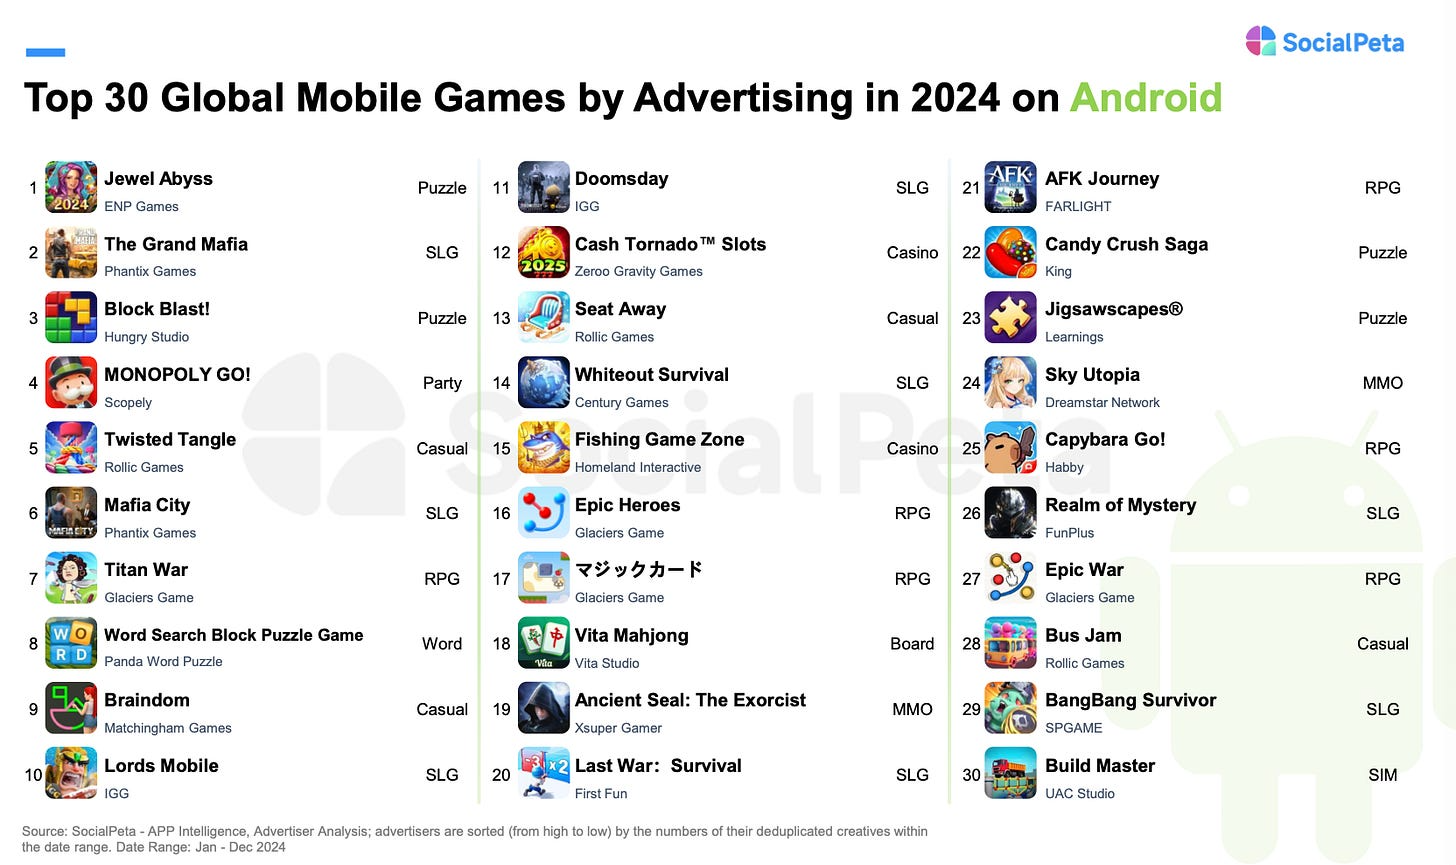
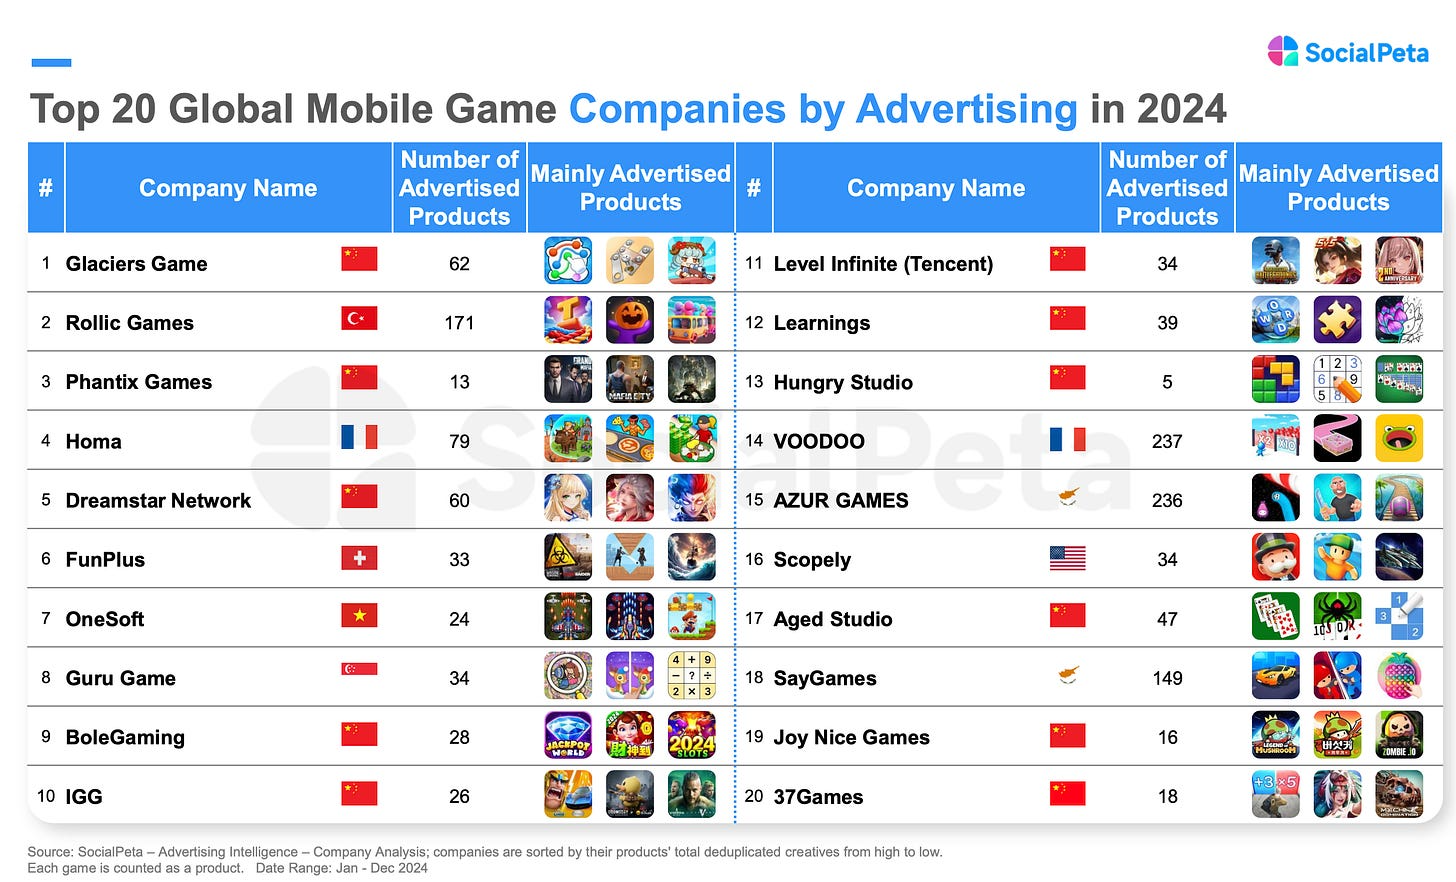
- Glaciers Game, Rollic Game, and Phantix Games—most active advertisers in the mobile market in 2024. Out of 20 companies, 11 on the list are from China; if FunPlus is included, then it’s 12.
Marketing Trends in Key Regions
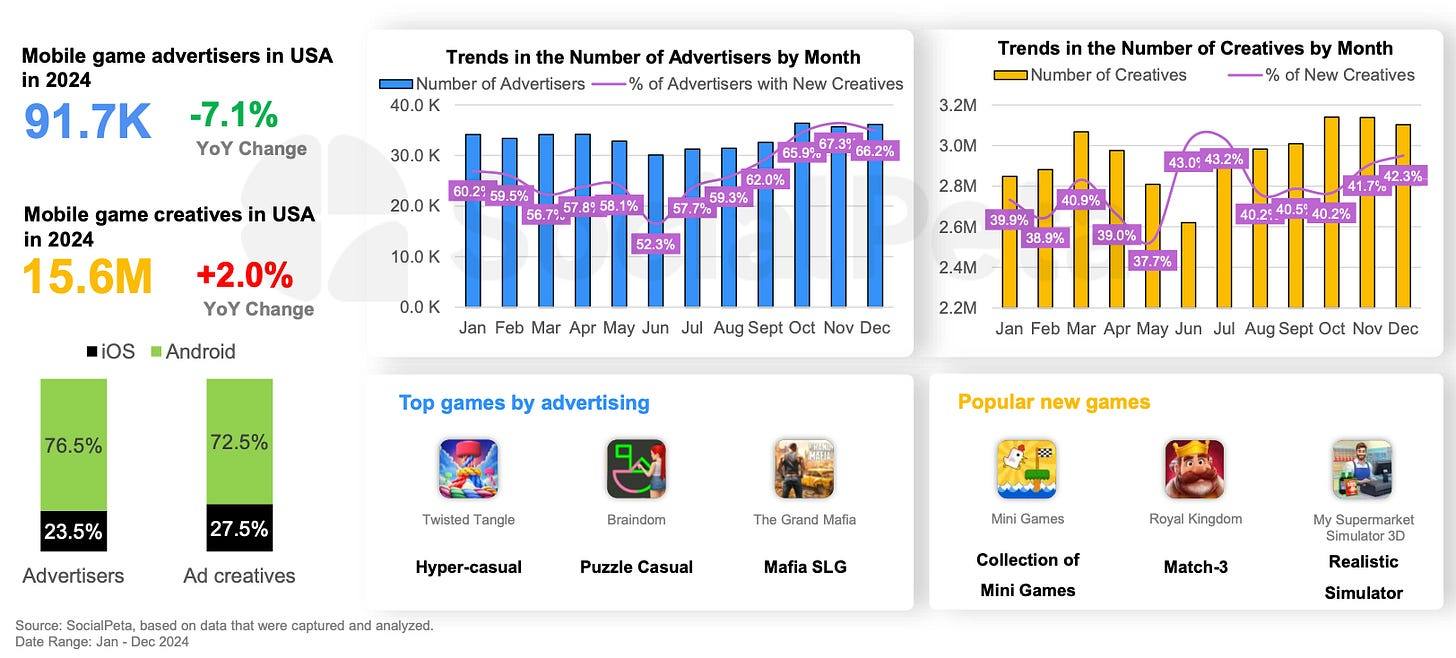
- The USA is the only region where the number of advertisers decreased in 2024; however, the number of creatives grew, with casual games accounting for 35% of all creative volume.
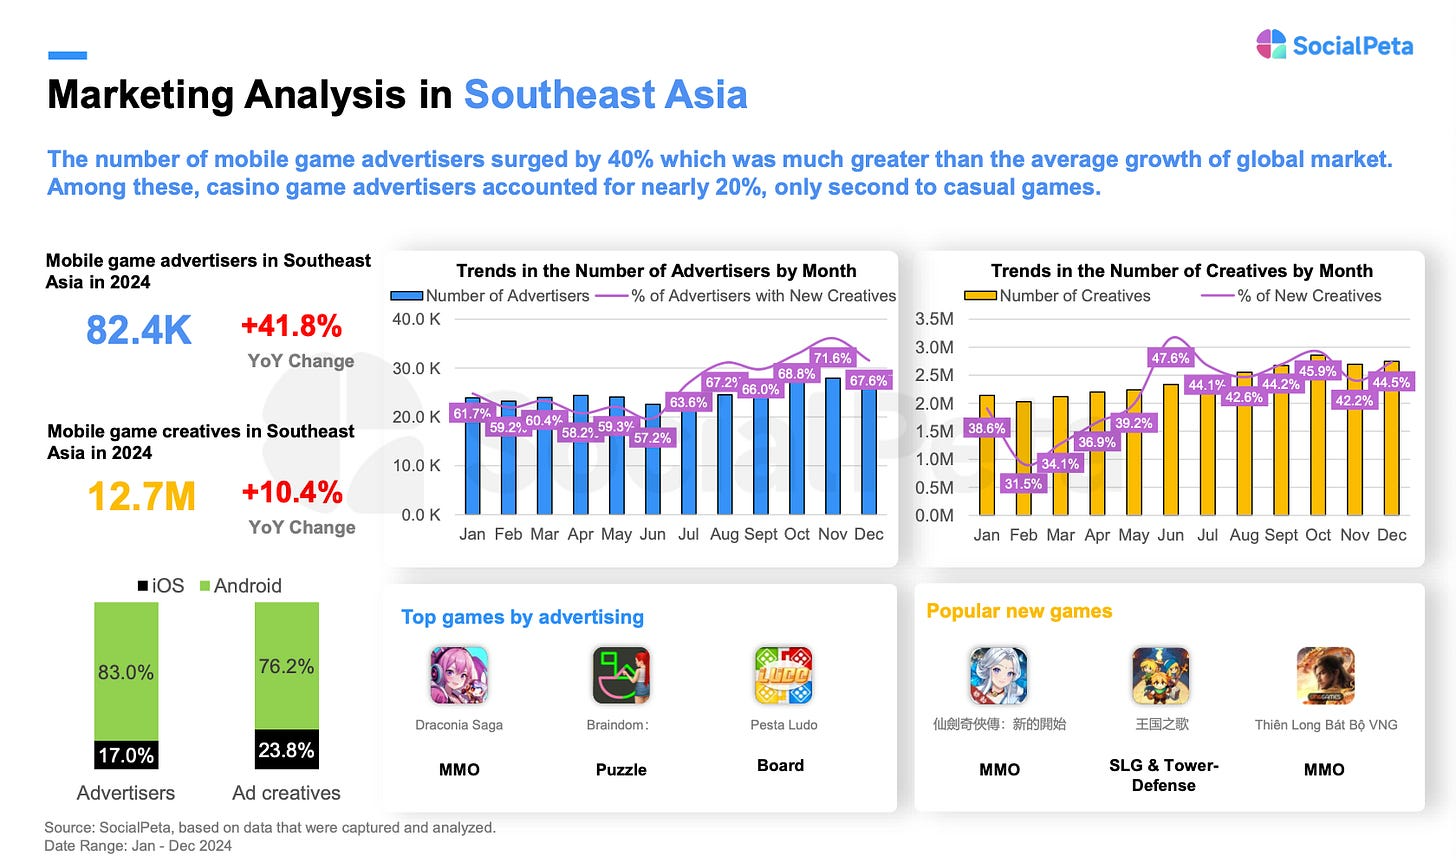
- Southeast Asia is growing rapidly in terms of advertisers—their number increased by 41.8% in 2024. SocialPeta notes that casino ranks second among advertisers in this region; other Asian countries are also growing but at slower rates.
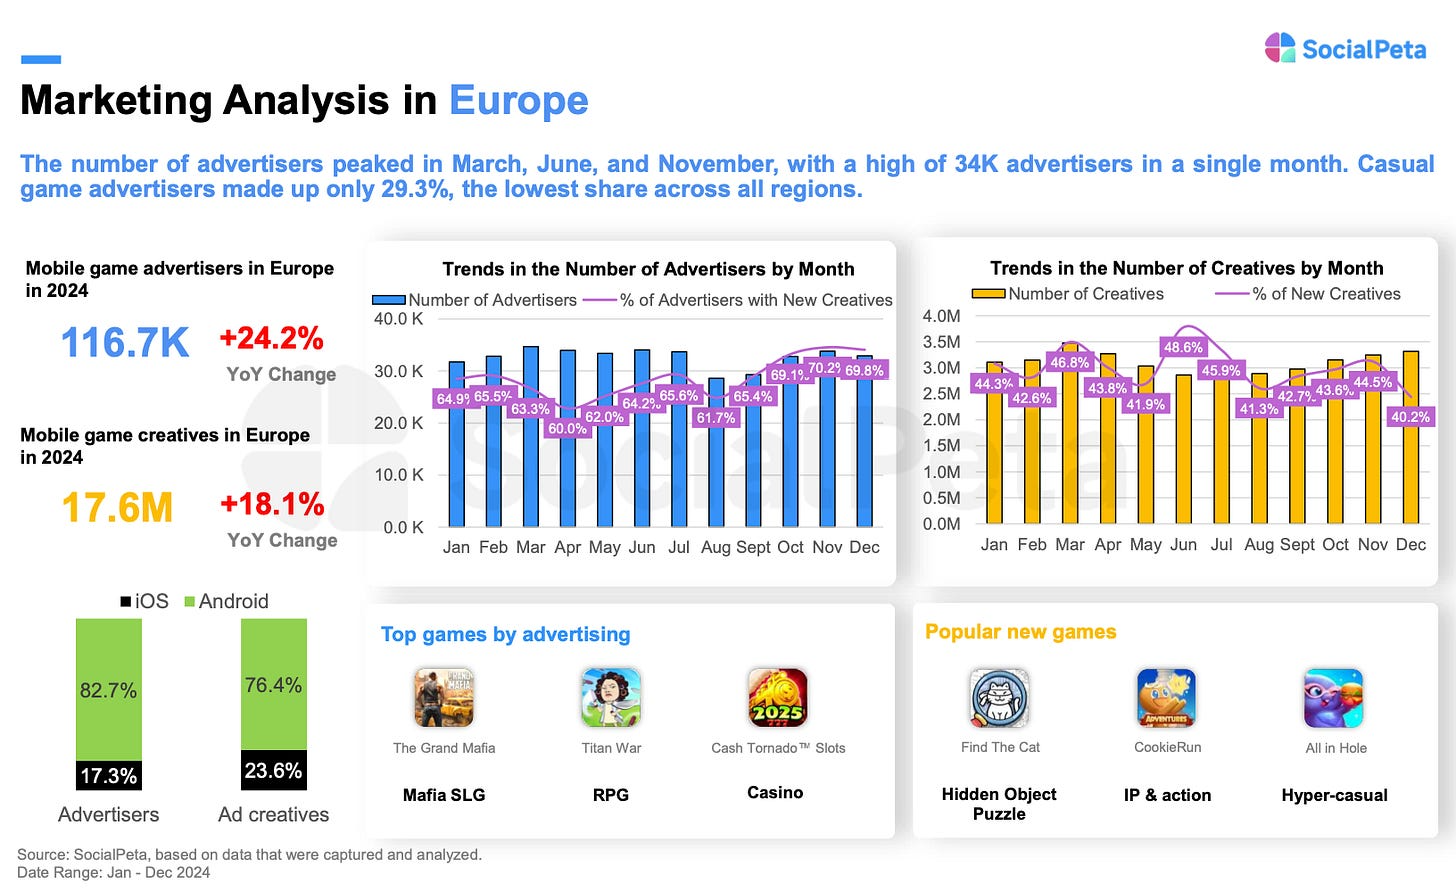
- The number of advertisers significantly increased in Europe (+24.2% compared to 2023), and almost as much growth occurred in creative numbers over 2024 (+18.1%, totaling 17.6 million).
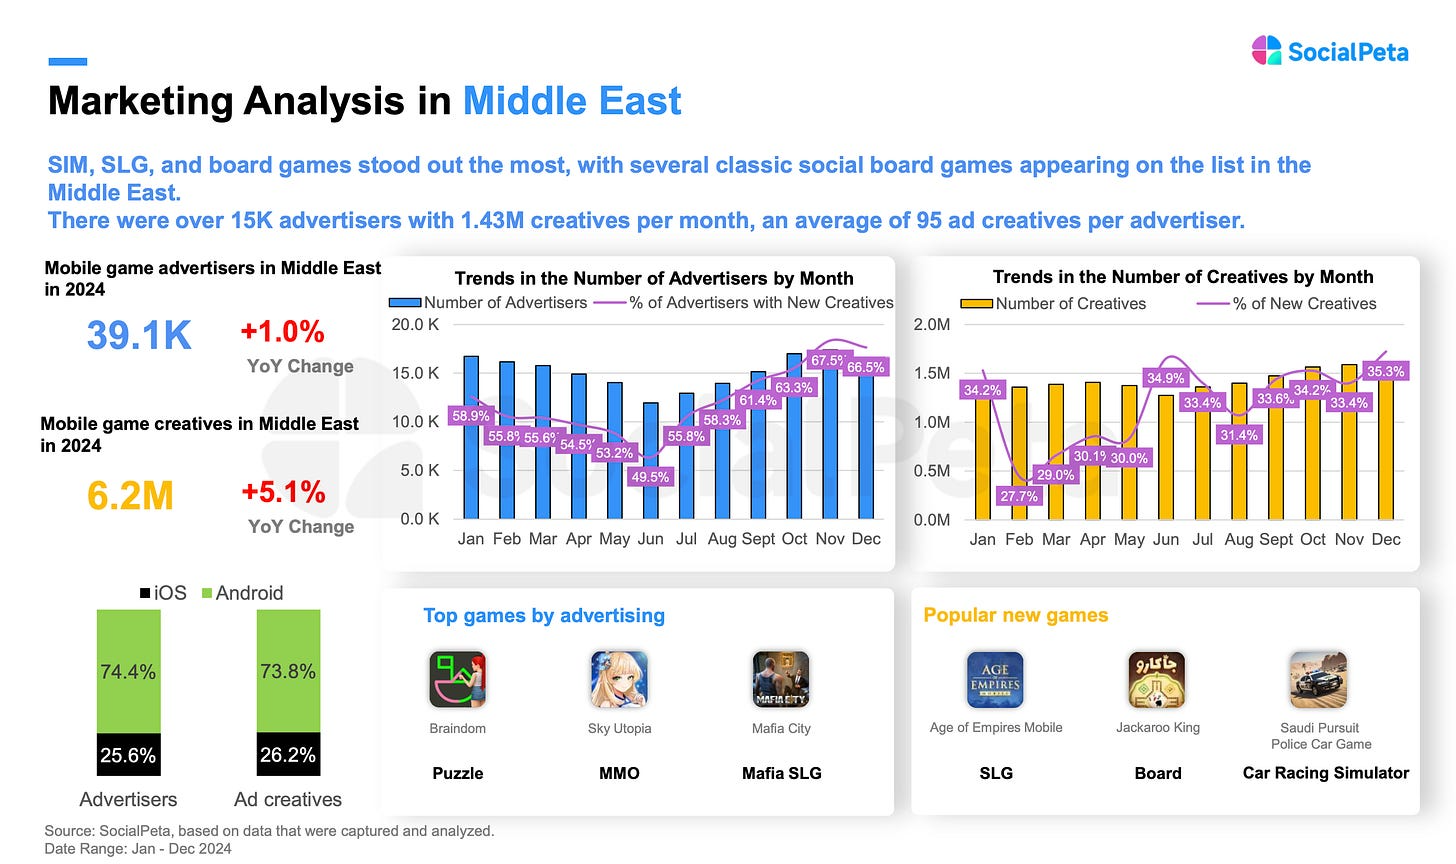
- The Middle East advertising market lags behind Southeast Asia or Europe regarding growth metrics.
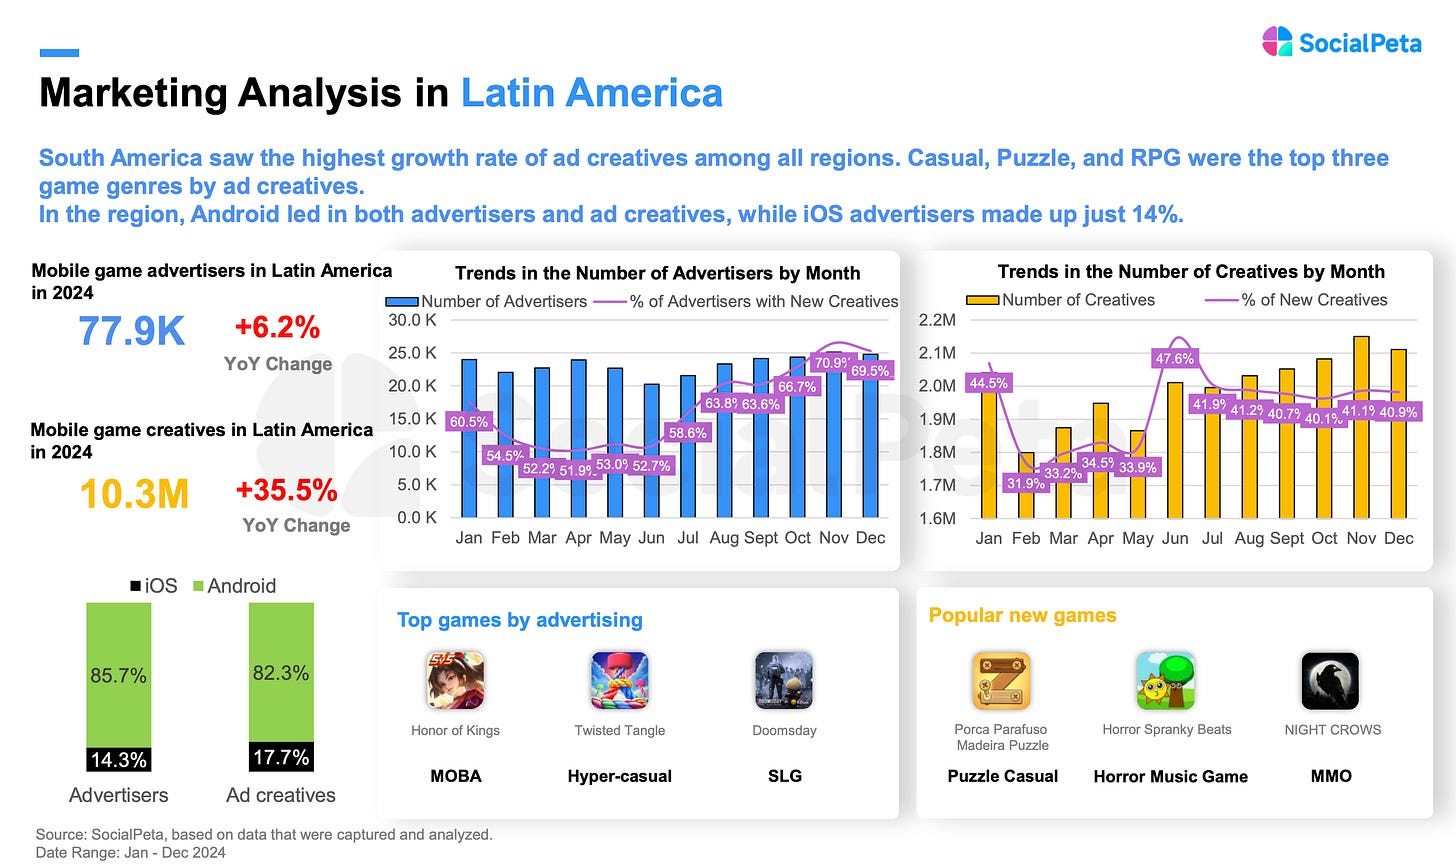
- Latin America also shows growth both in creative numbers (+35.5% YoY) and advertiser numbers (+6.2%).
ERA: The UK Entertainment market in 2024 - games are no longer the largest segment
The company has shared preliminary figures previously, but now it has released a full report. The report includes data from 2015 that cover video, music & gaming segments, and I will focus on the gaming market figures.
Overall state of the Entertainment Market in the UK
-
The UK's combined market for music, video, and games reached £12 billion in 2024. The market has been growing since 2015.
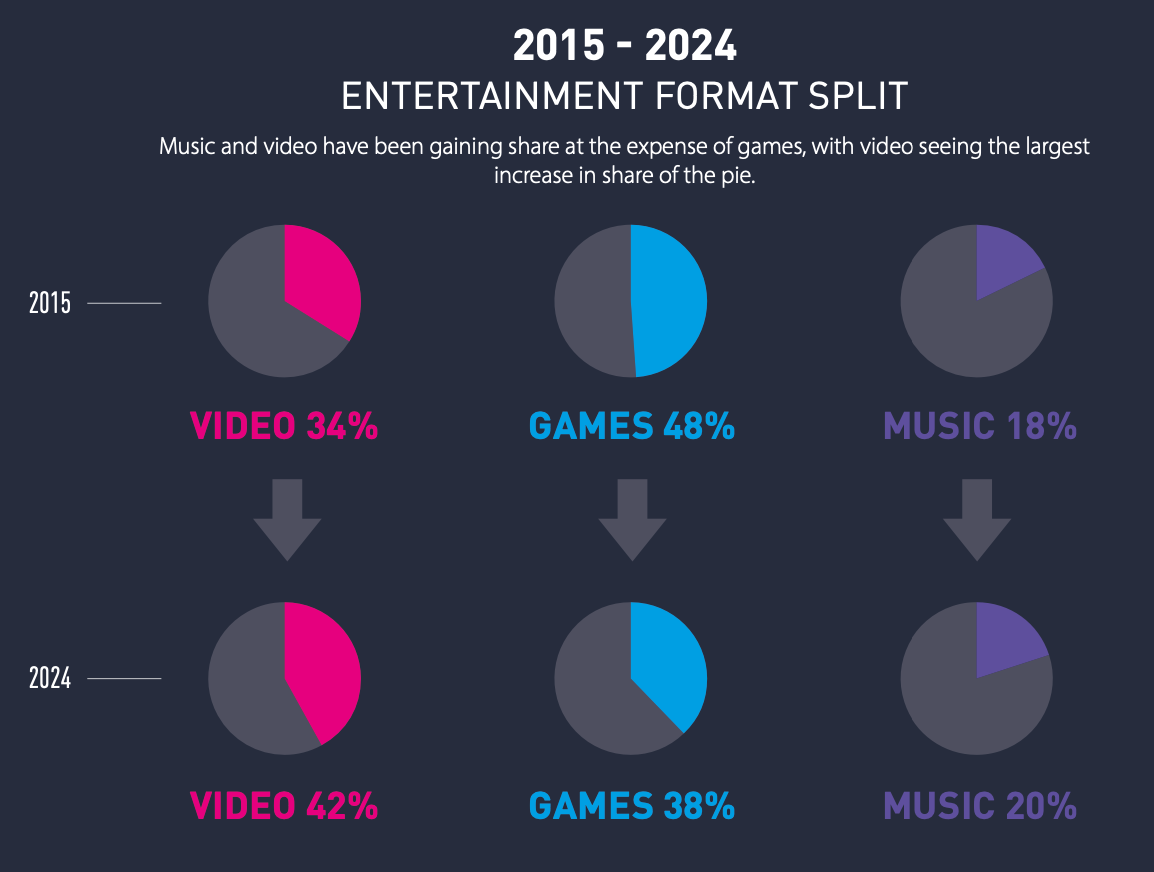
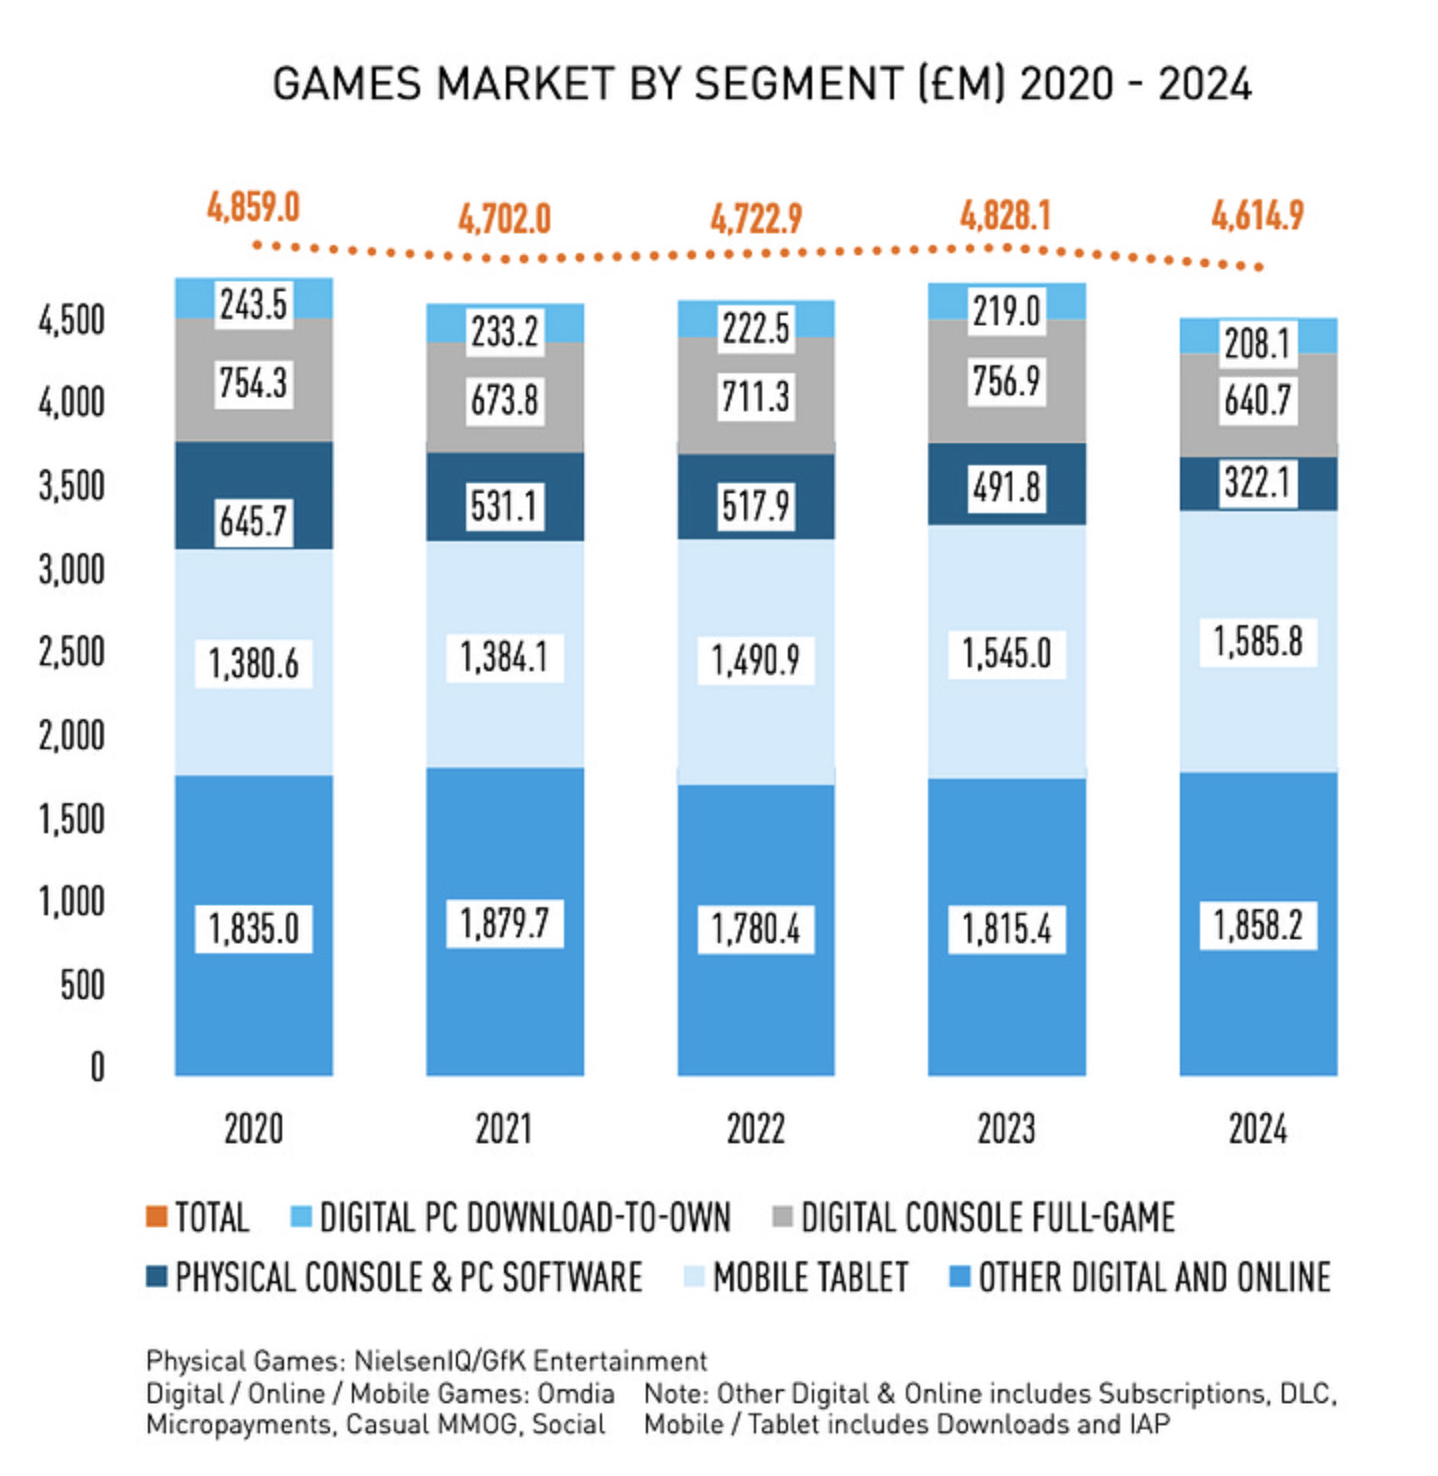
- For the first time since 2015, games are no longer the largest segment of the market. The gaming market decreased from £4.828 billion in 2023 to £4.615 billion in 2024. The video market leads with £5.002 billion in 2024.
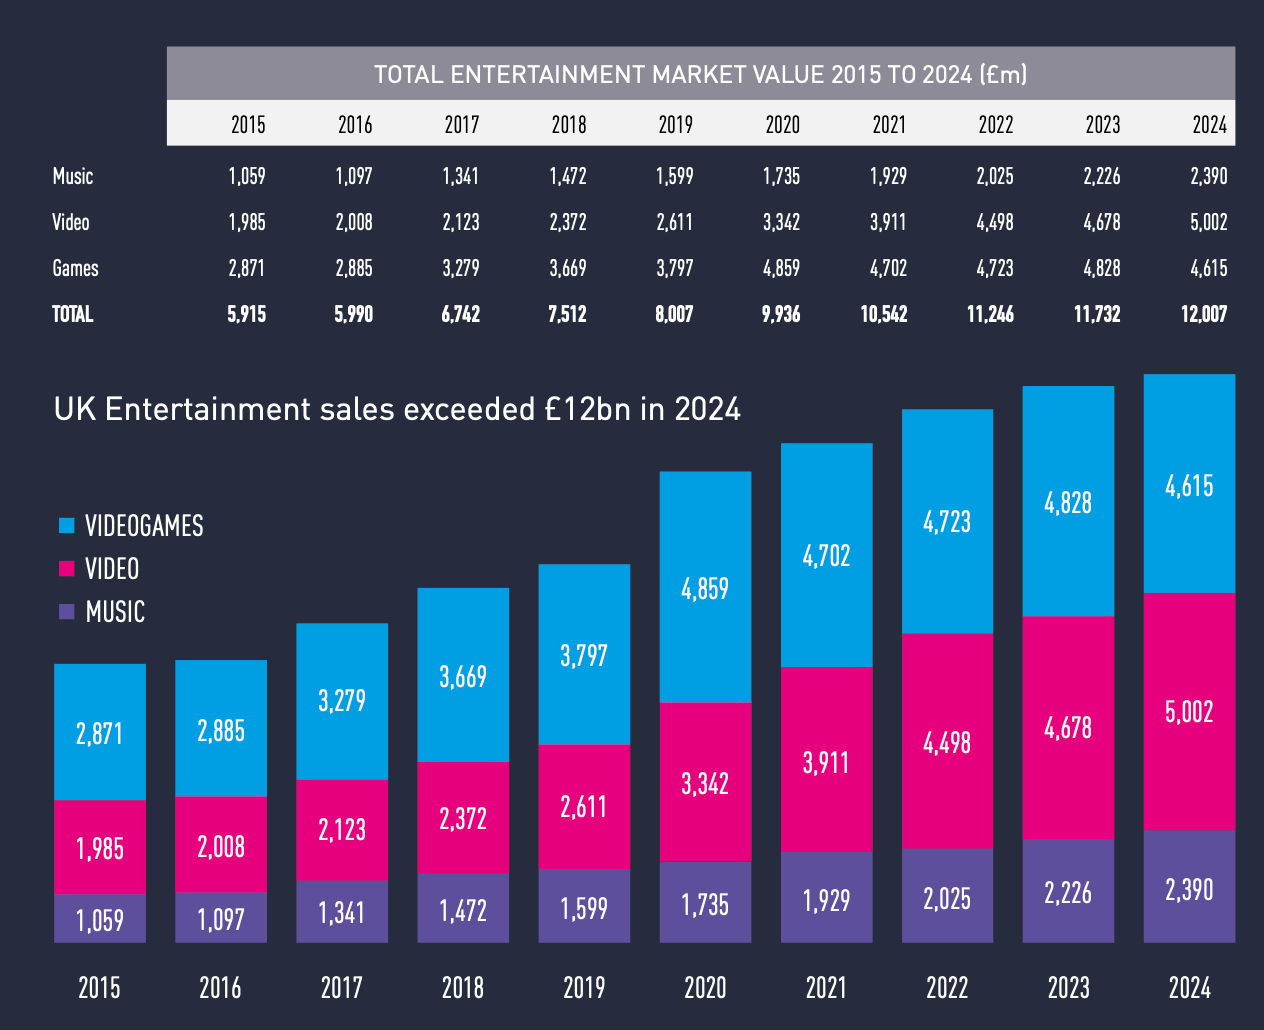
- The share of games in the UK's overall revenue decreased from 48% in 2015 to 38% in 2024. Meanwhile, the share of video content revenue grew from 34% to 42%, and the music market's share increased from 18% to 20%.
- The growth in the UK's entertainment segment occurred due to digital content. In 2015, physical distribution accounted for 44% of sales, but this figure dropped to 7% in 2024.
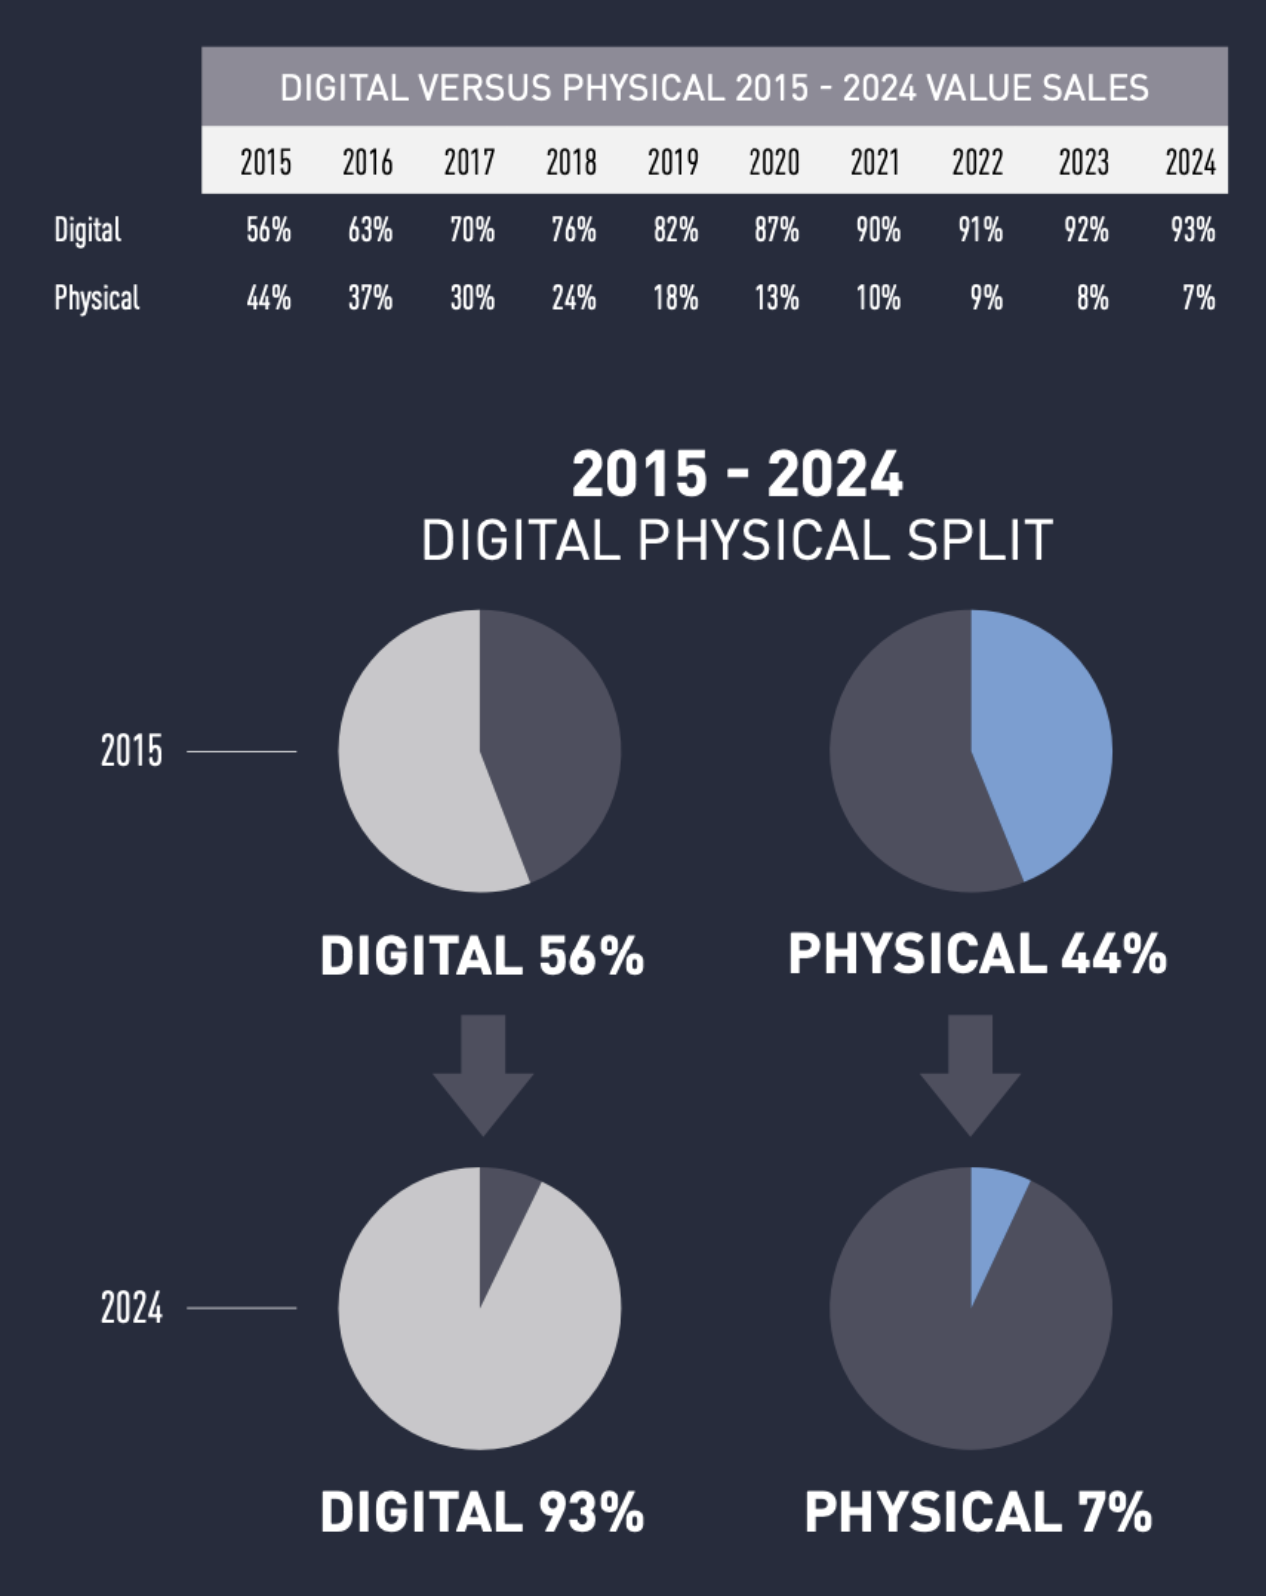
- £9.32 out of every £10 spent by British people on entertainment goes to digital content.
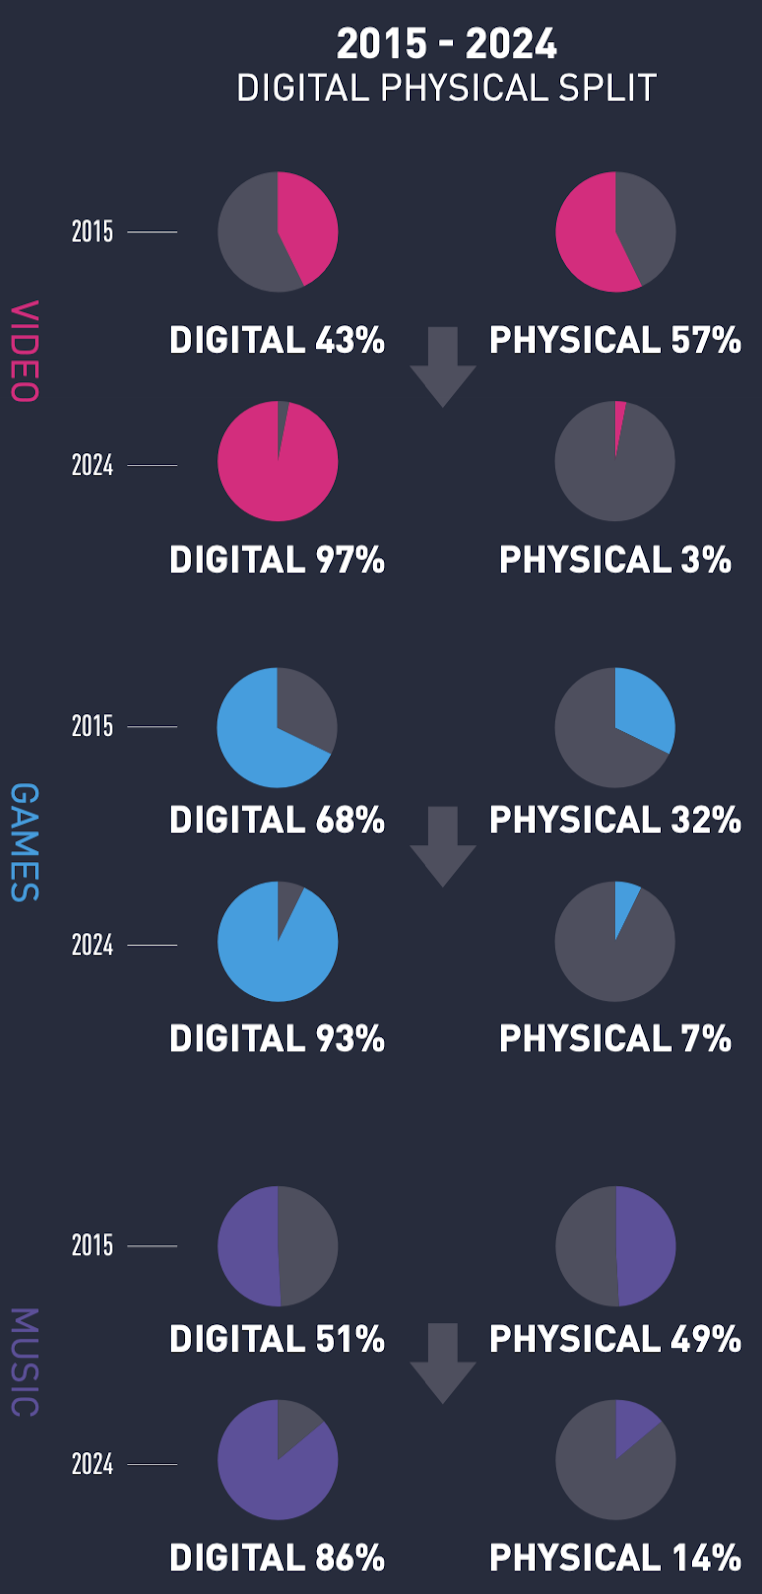
- Digitalization had the most significant impact on the video market, with only 3% of sales coming from physical copies in 2024. In games, physical sales accounted for 7%, and in music, 14%.
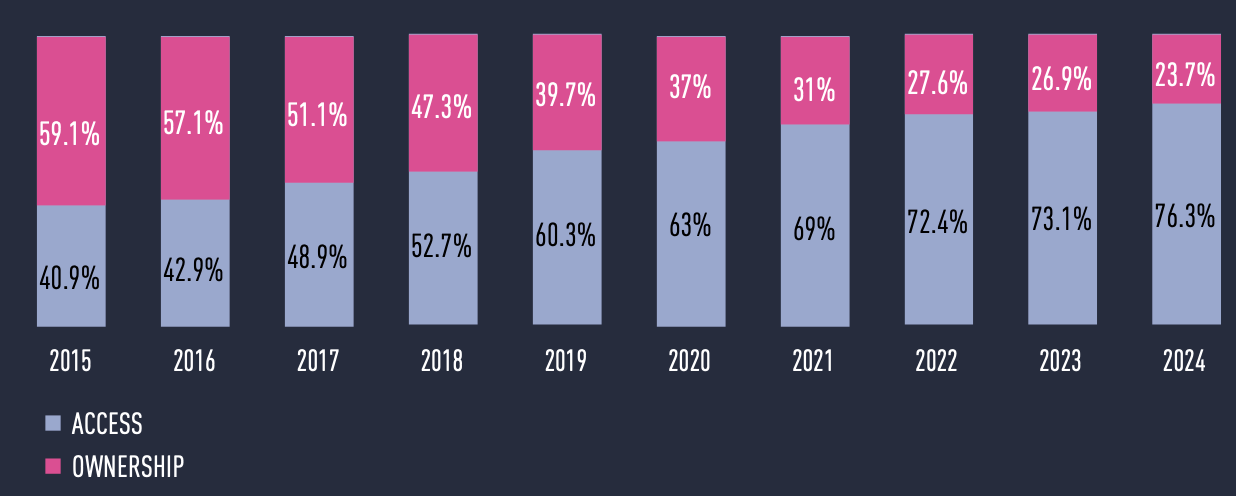
- With the rise of digitalization, the share of revenue from subscription services also grew. In 2024, they accounted for 76.3% of the entire entertainment segment's revenue in the UK.
❗️ERA also provides figures for the gaming market, noting that 55% of the UK gaming market's revenue comes from content rental. The company includes the entire mobile market, including microtransactions, in "rental." I don't entirely agree with this approach, so I won't highlight these figures.
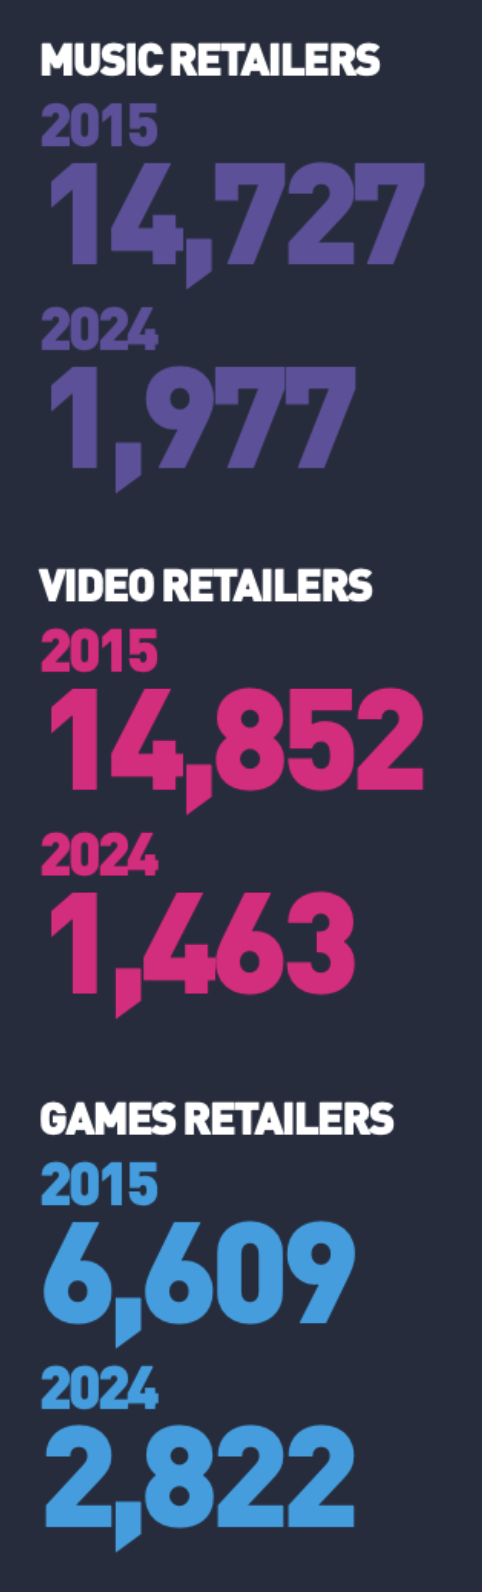
- The number of retailers selling entertainment content in the UK has significantly decreased since 2015, with music stores being the most affected.
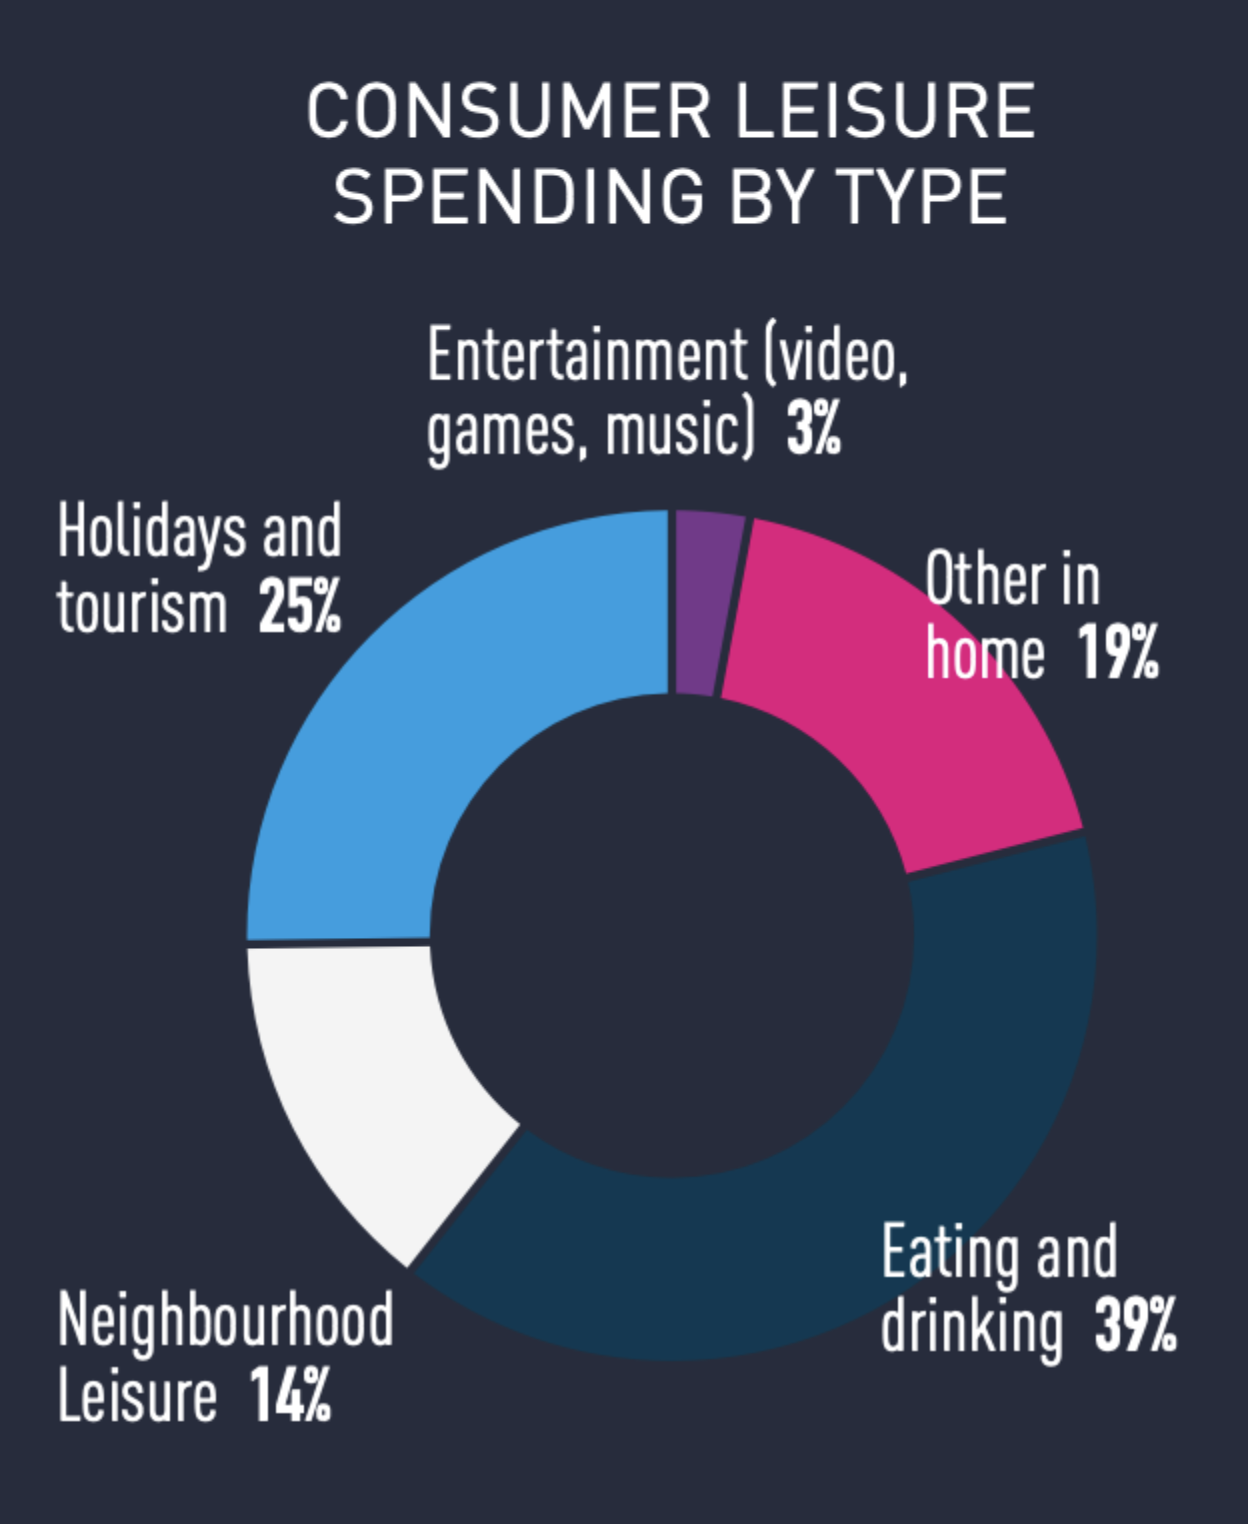
- People in the UK are spending more money on leisure, both at home and outside.
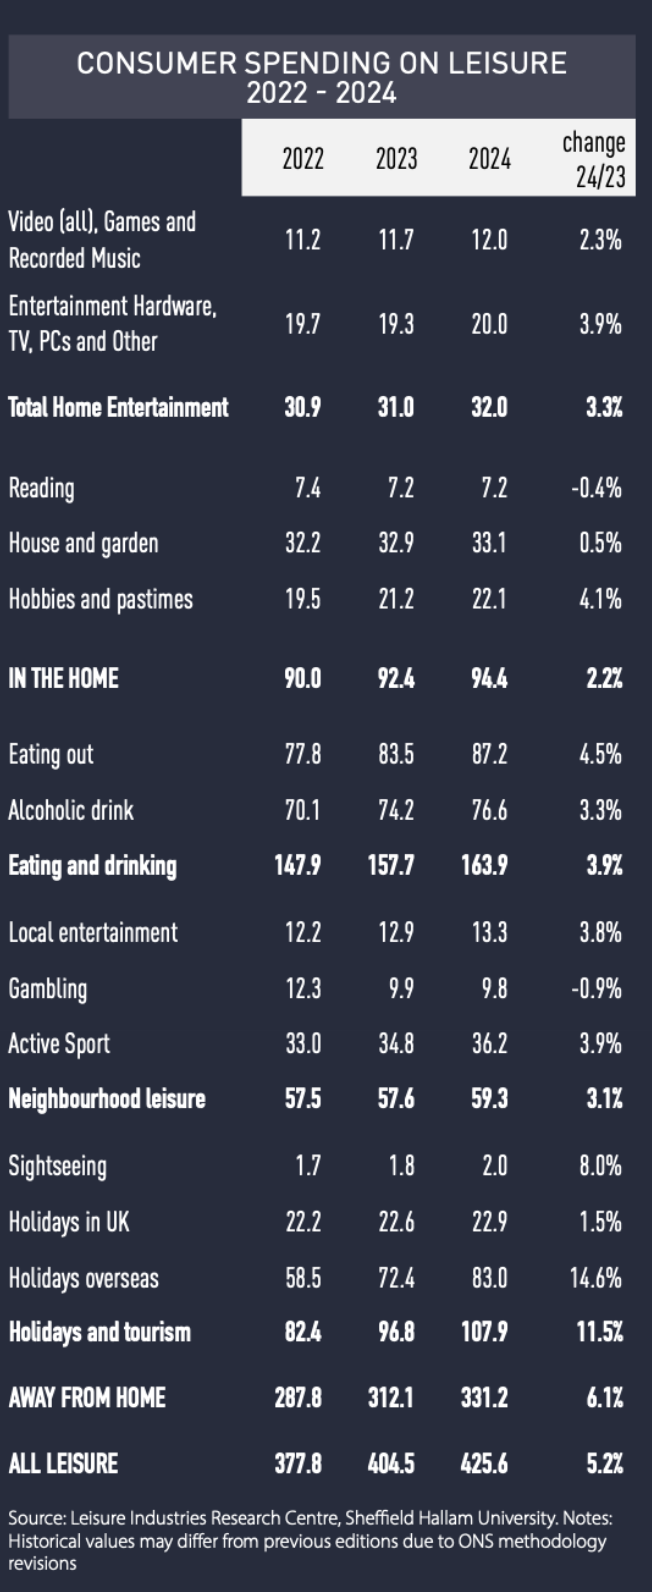
- However, British people spend only 3% of their funds on games, music, and video entertainment. The largest share goes to food and drinks (39%).
Gaming industry in the UK in 2024
-
The overall gaming market size decreased by 4.4% to £4.61 billion.
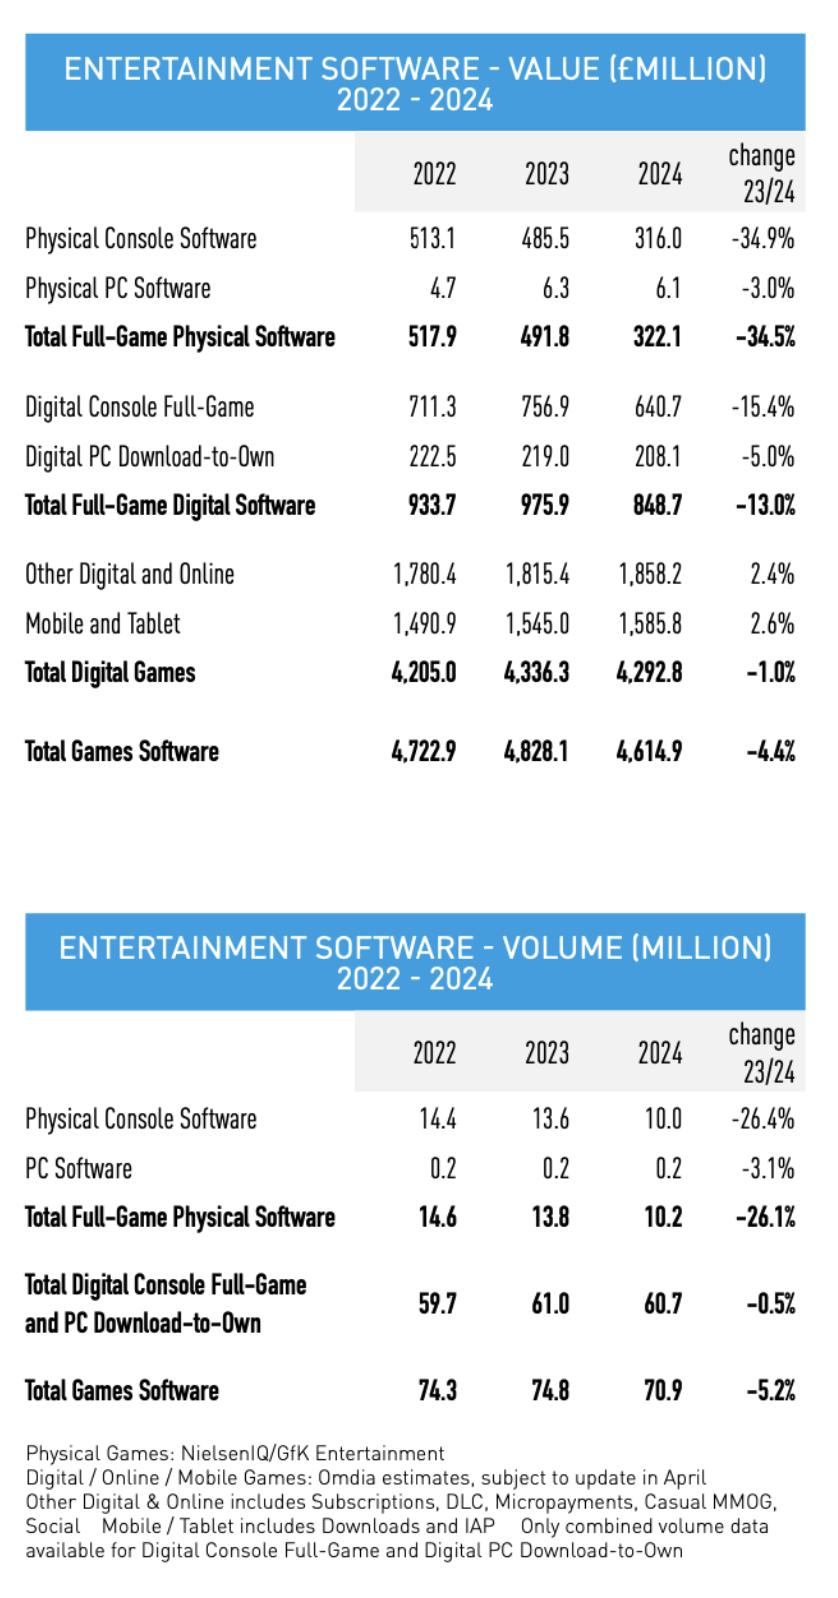
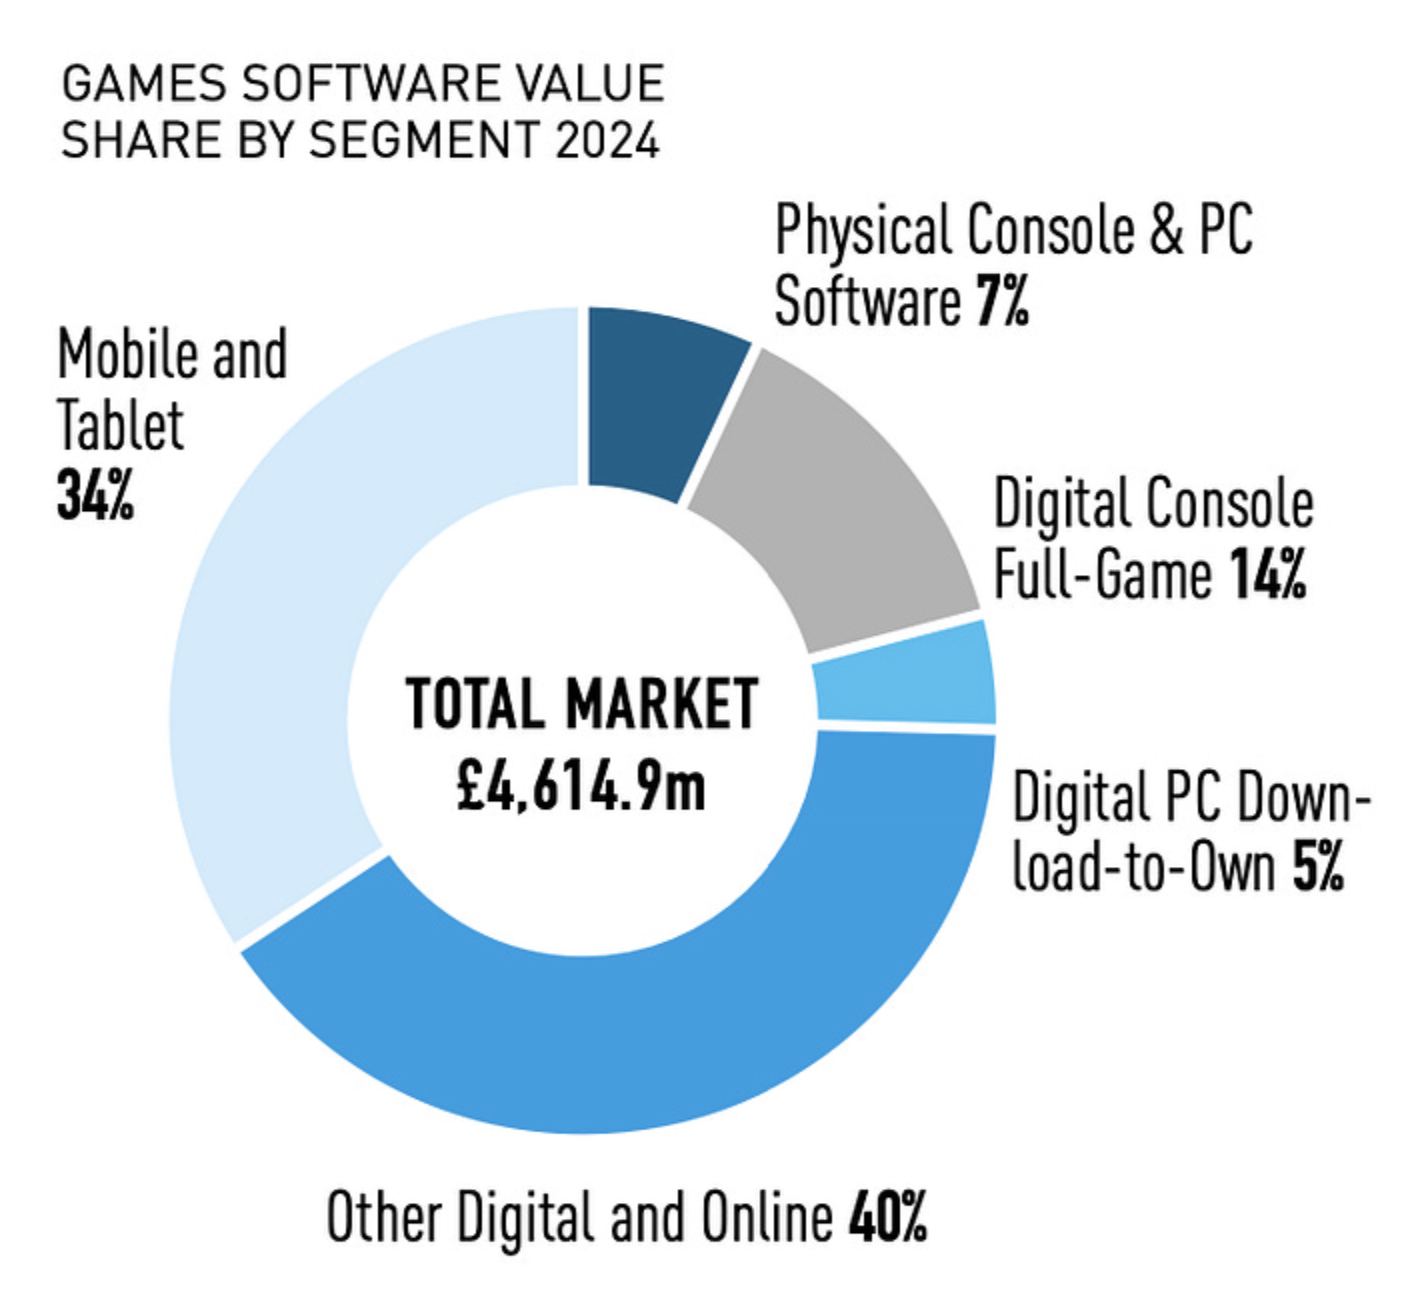
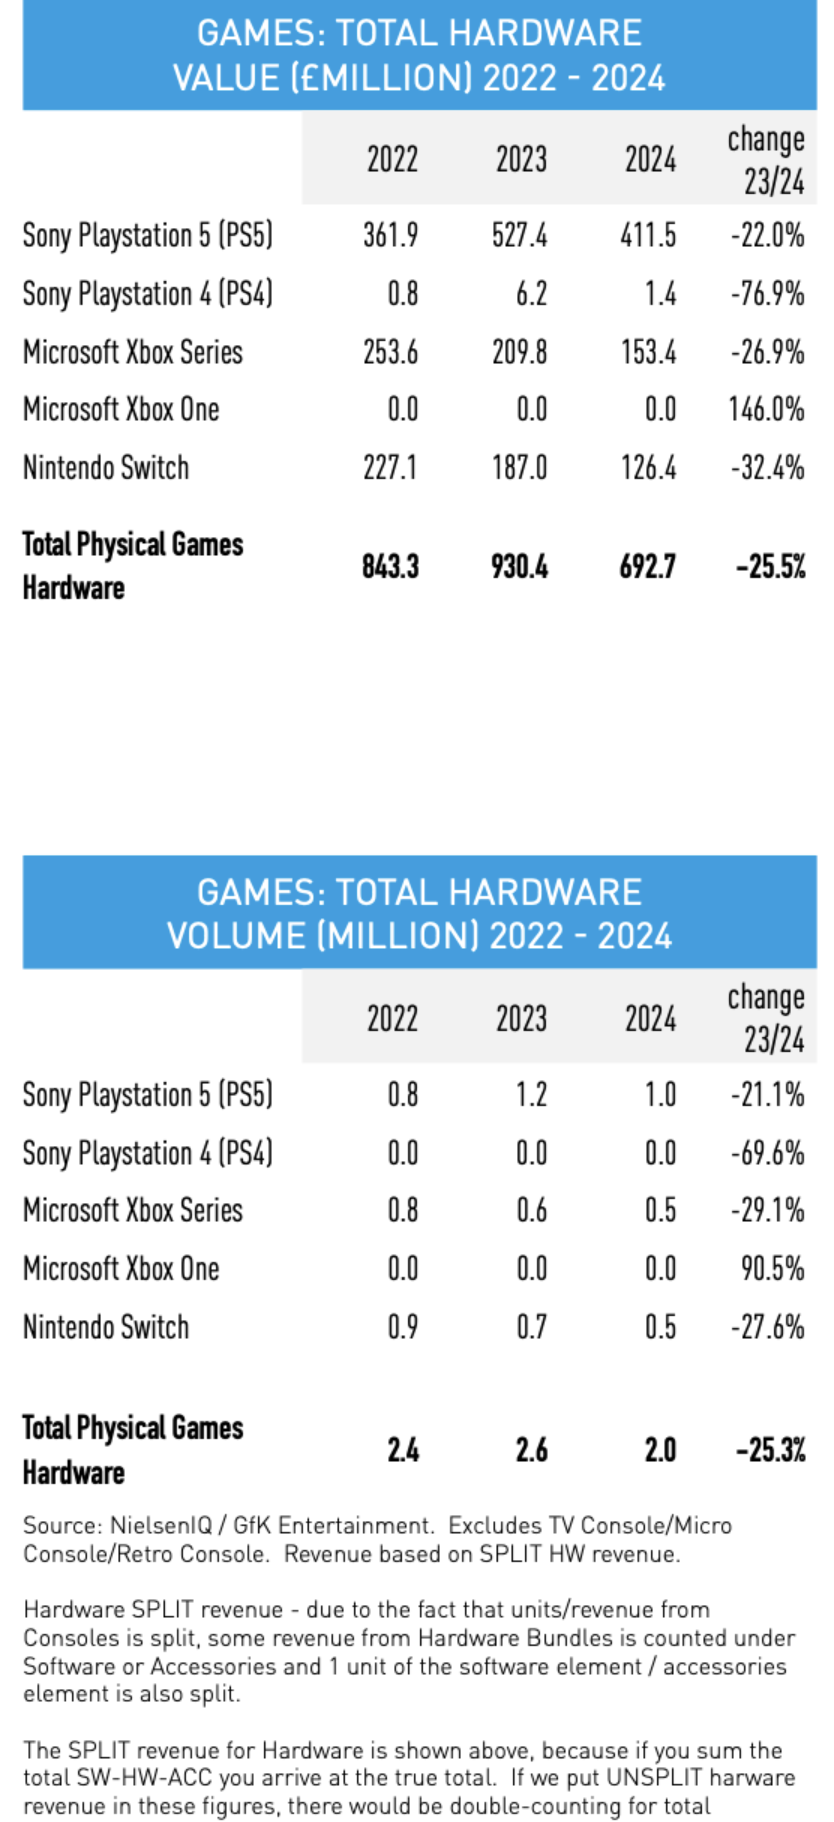
- Digital content sales decreased by 1% to £4.29 billion. Physical sales fell by 34.5% to £322 million. Retail sales of gaming hardware decreased by 25.5% to £693 million.
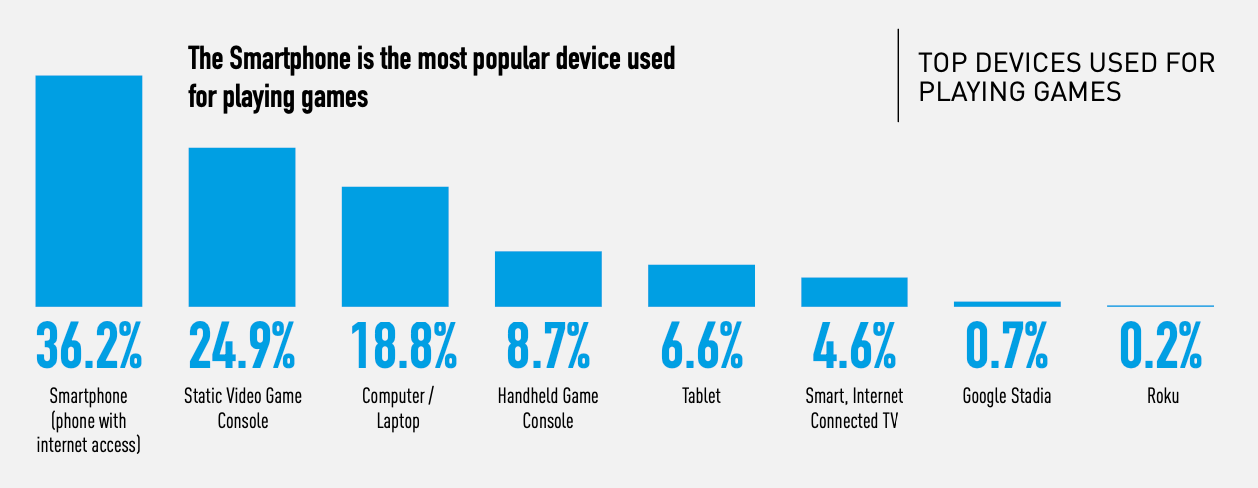
- 36.2% of British gamers play on mobile phones; 24.9% on home consoles, and 18.8% on PC.
-
PlayStation Plus (53.6% of respondents use it) and Xbox Game Pass (33.6%) are the most popular subscription services in the market.
-
A significant portion of the UK gaming market's revenue comes from subscriptions and microtransactions in PC and console games—40%. Mobile game microtransactions are second in revenue at 34%.
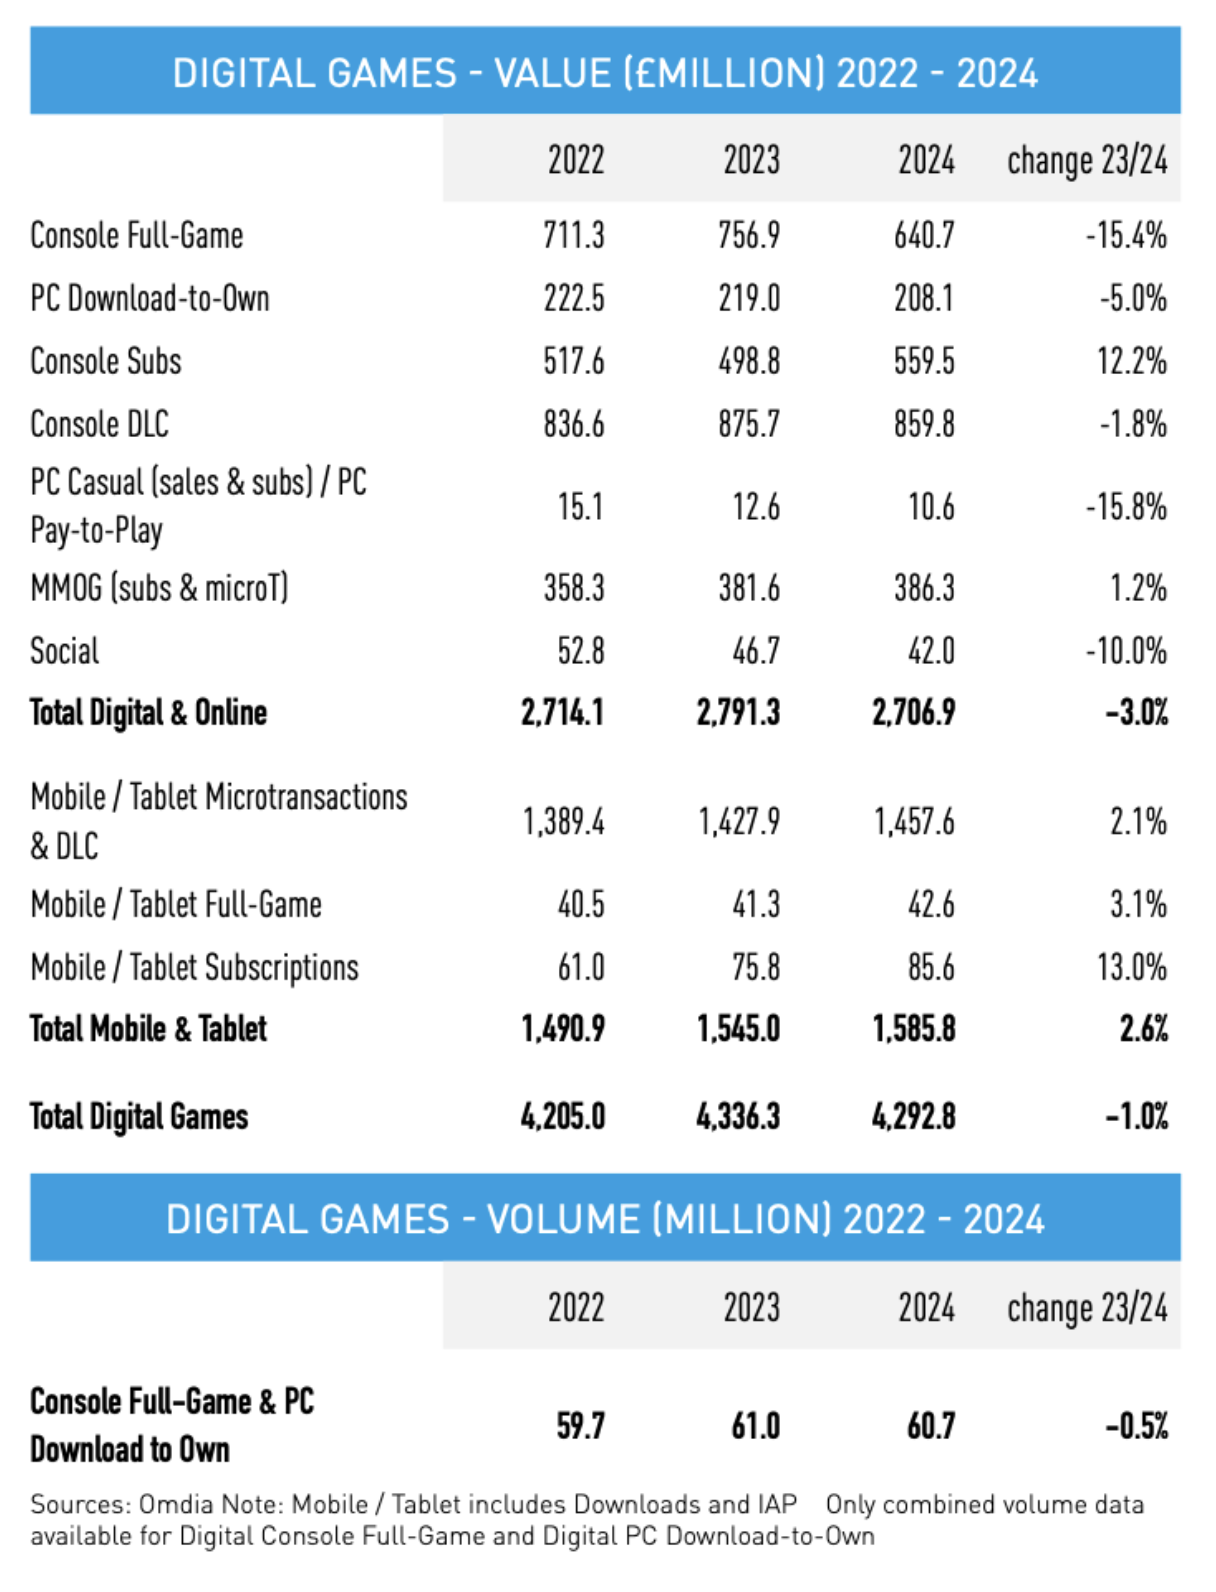
Digital Gaming Market in the UK
-
In 2024, spending on console subscriptions increased by 12.2% to £559.5 million.
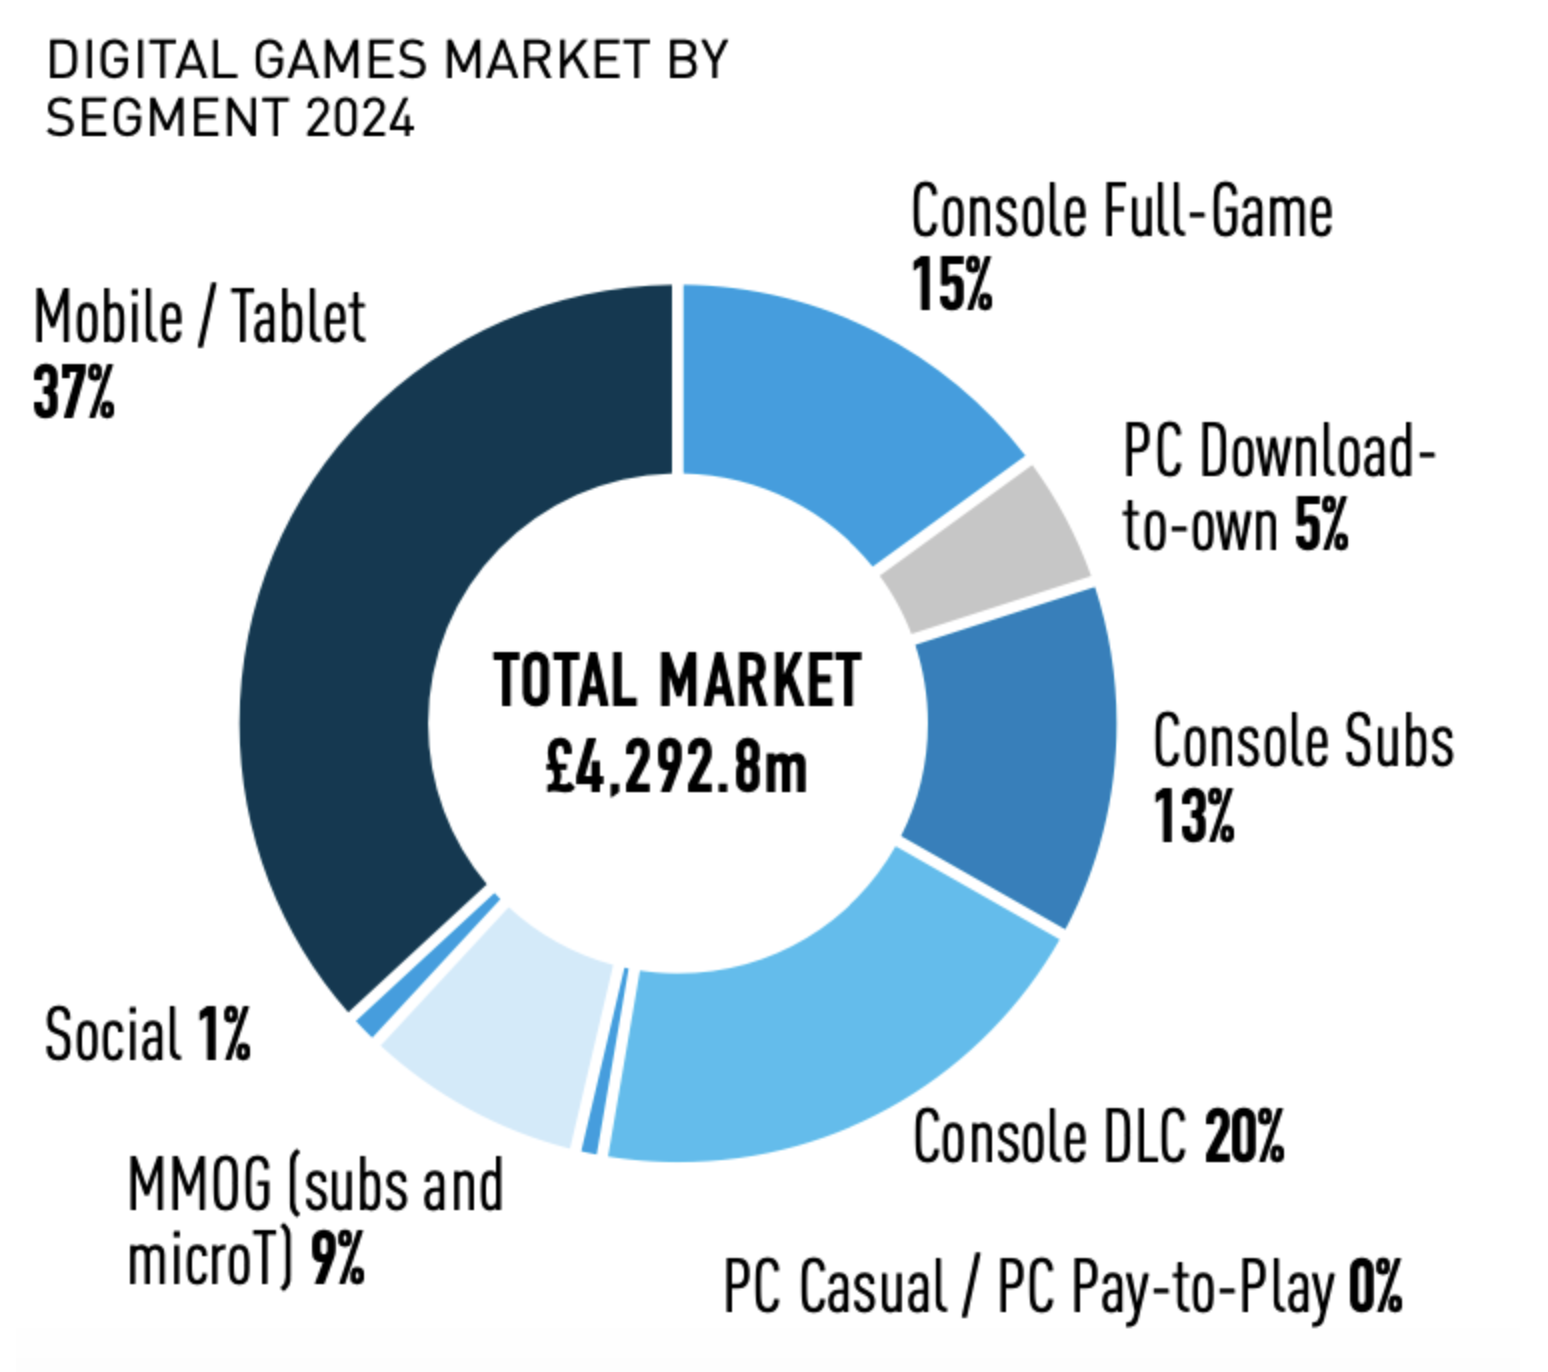
- Console game sales declined the most (by 15.4%), as did casual PC game sales (by 15.8%). The latter is a smaller segment, but poor console game sales resulted in over £100 million in lost revenue.
- The mobile segment performed well in 2024, growing by 2.6% to £1.585 billion. Revenue from microtransactions increased by 2.1% (to £1.457 billion); full game sales rose by 3.1% (to £42.6 million); and subscription revenue grew by 13% (to £85.6 million).
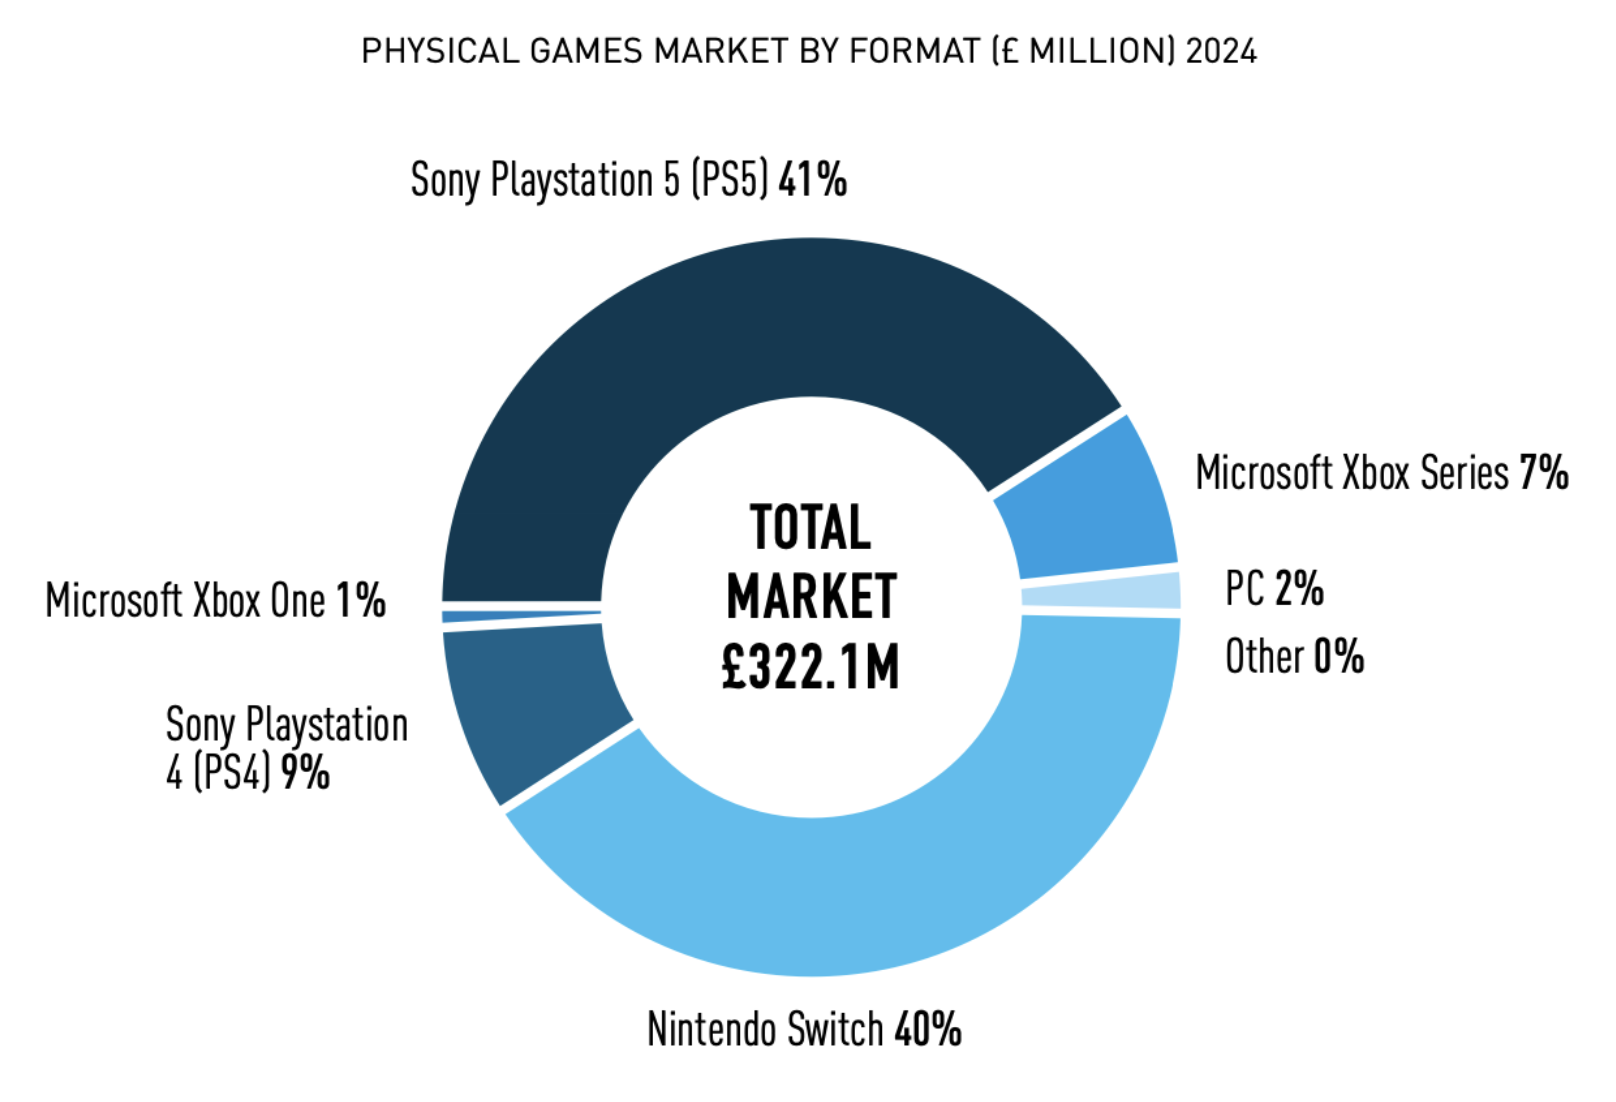
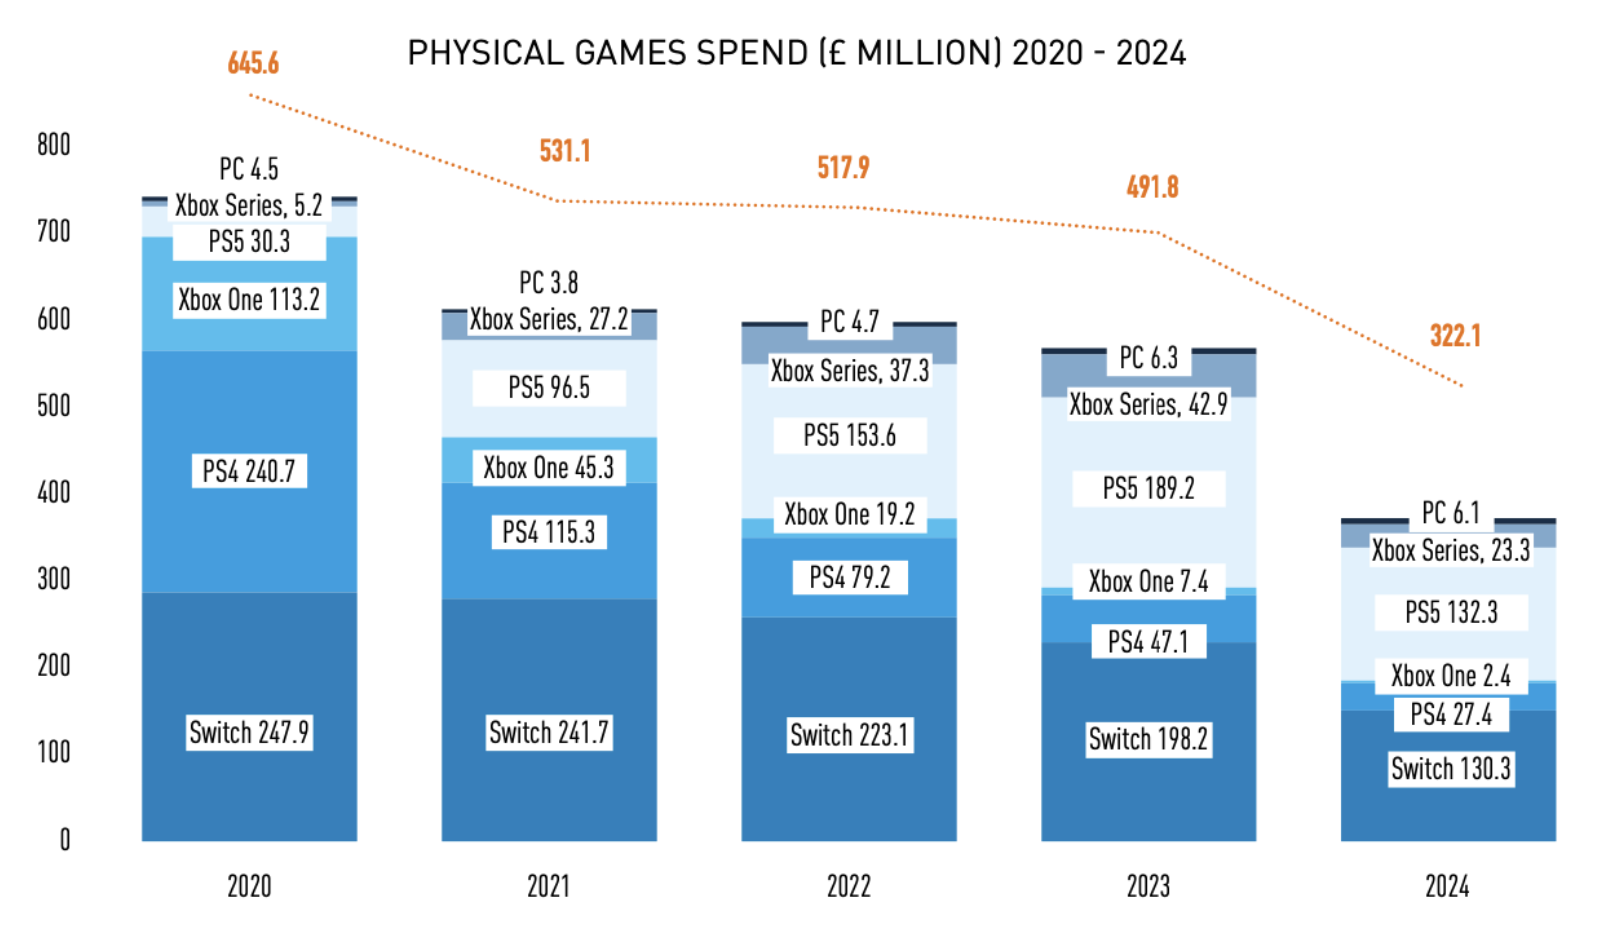
Physical Gaming Market in the UK
-
Home console sales in the UK fell by 34.9% in monetary terms and by 26.4% in unit numbers in 2024.
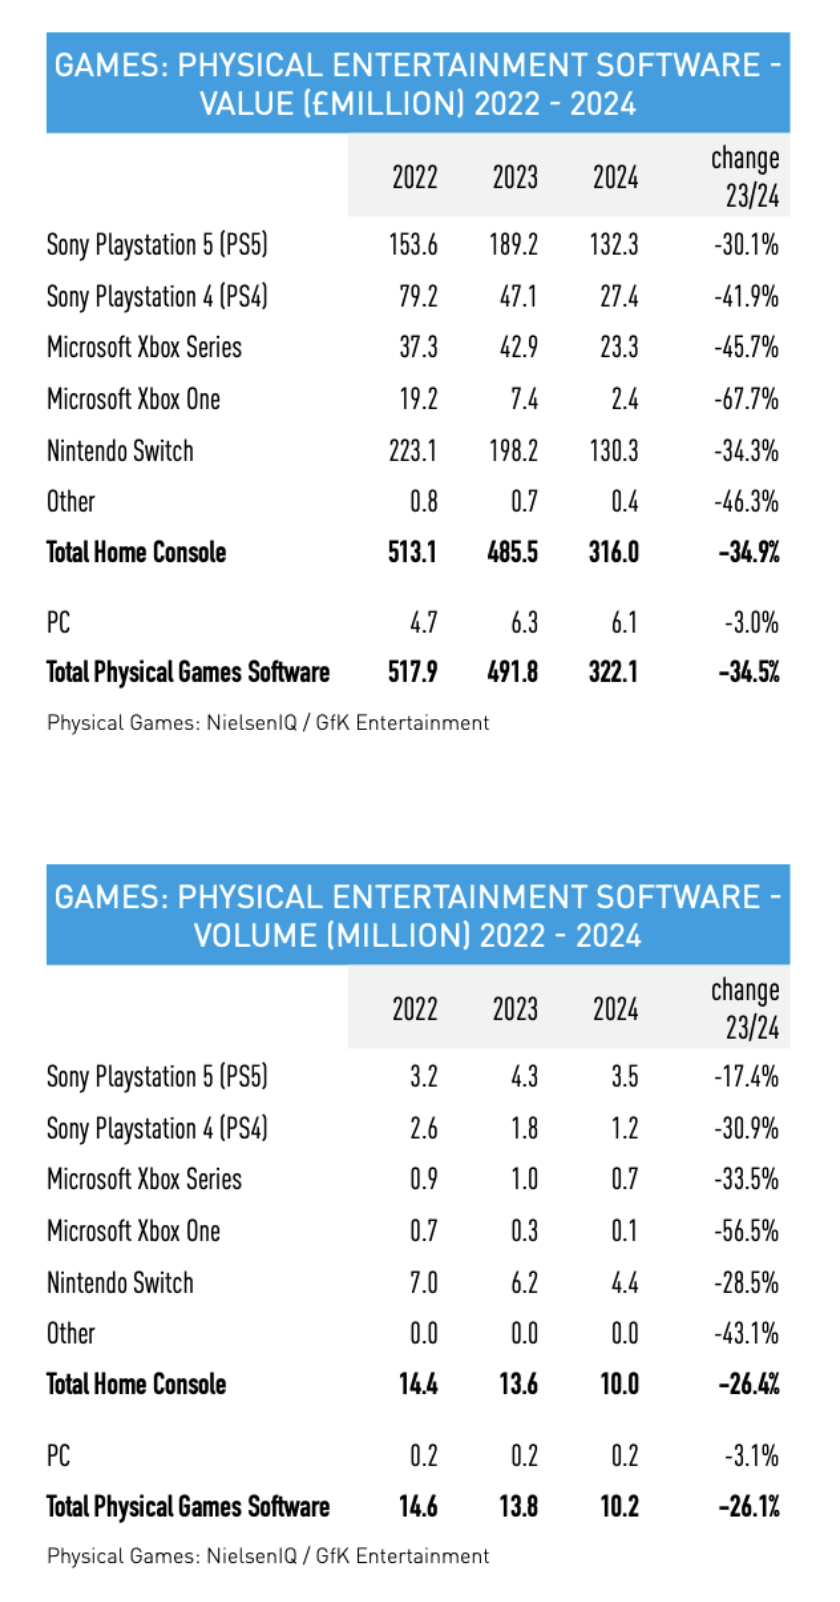
- Physical game sales decreased by 34.5% in monetary terms. The PlayStation 5 accounted for 41% of all sold copies, and the Nintendo Switch accounted for 40%.
- Retail gaming revenue plummeted in 2024, even compared to the negative trends of recent years.
-
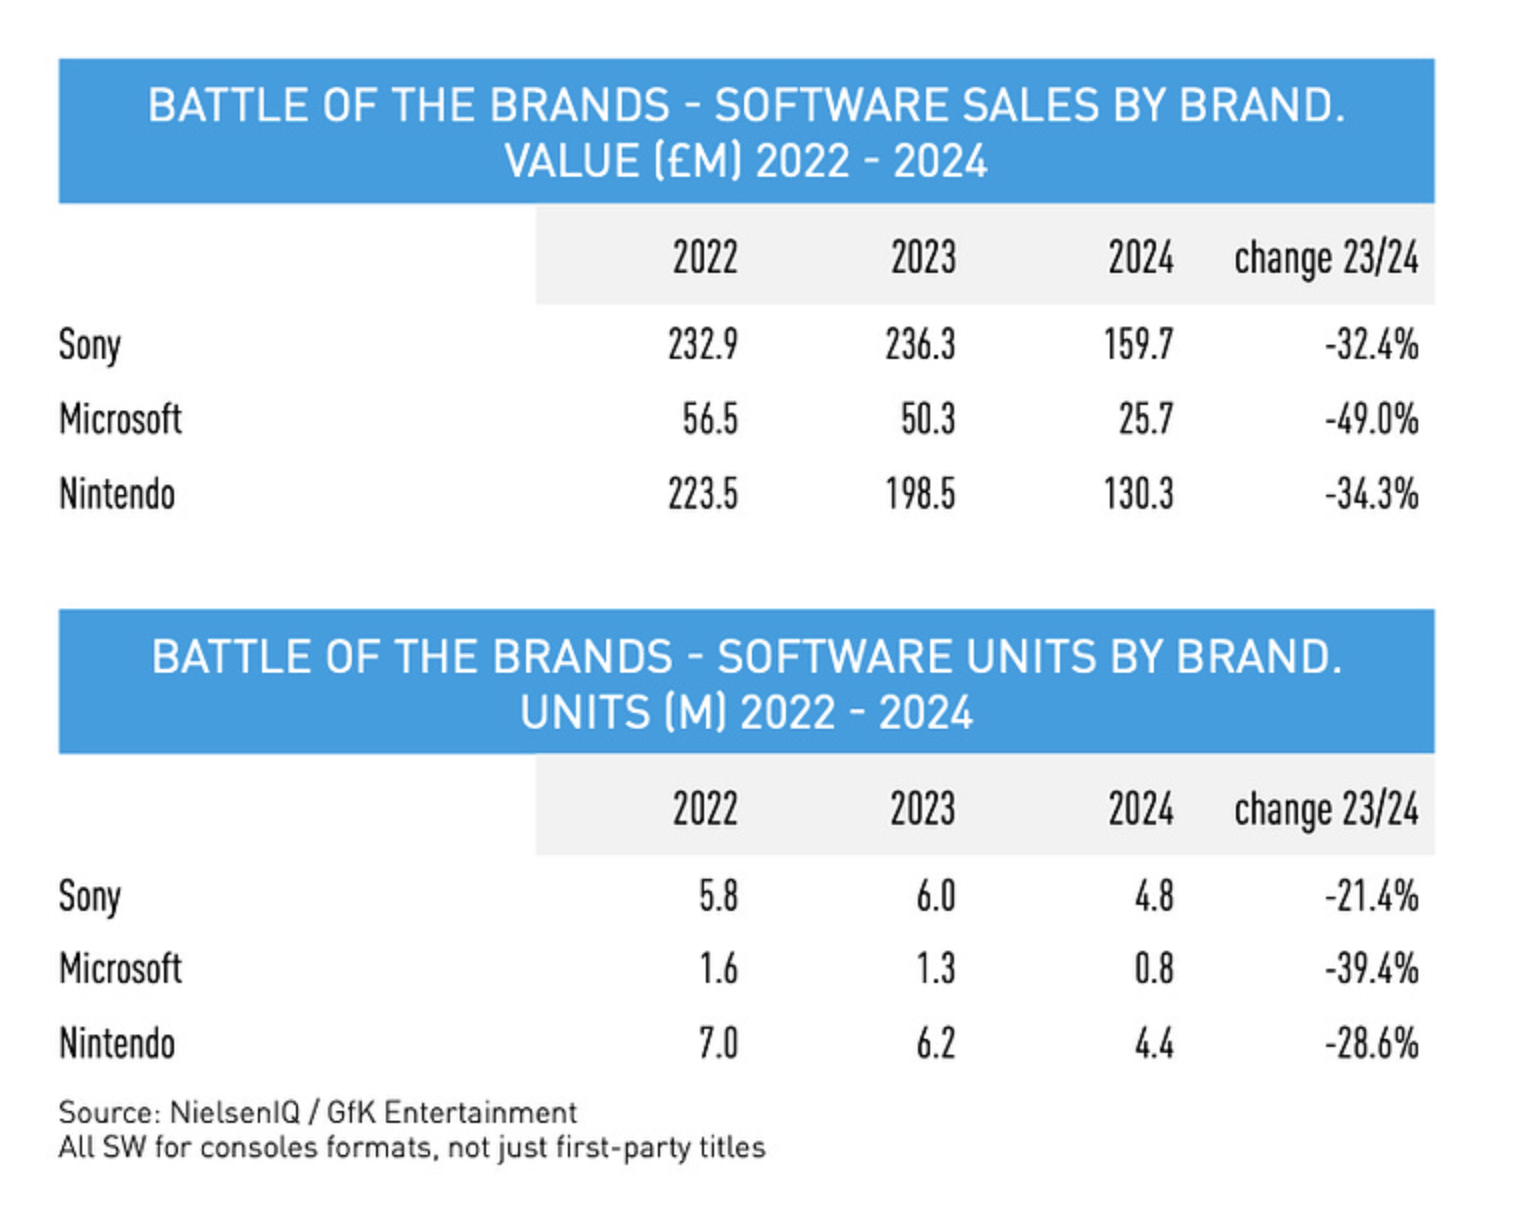
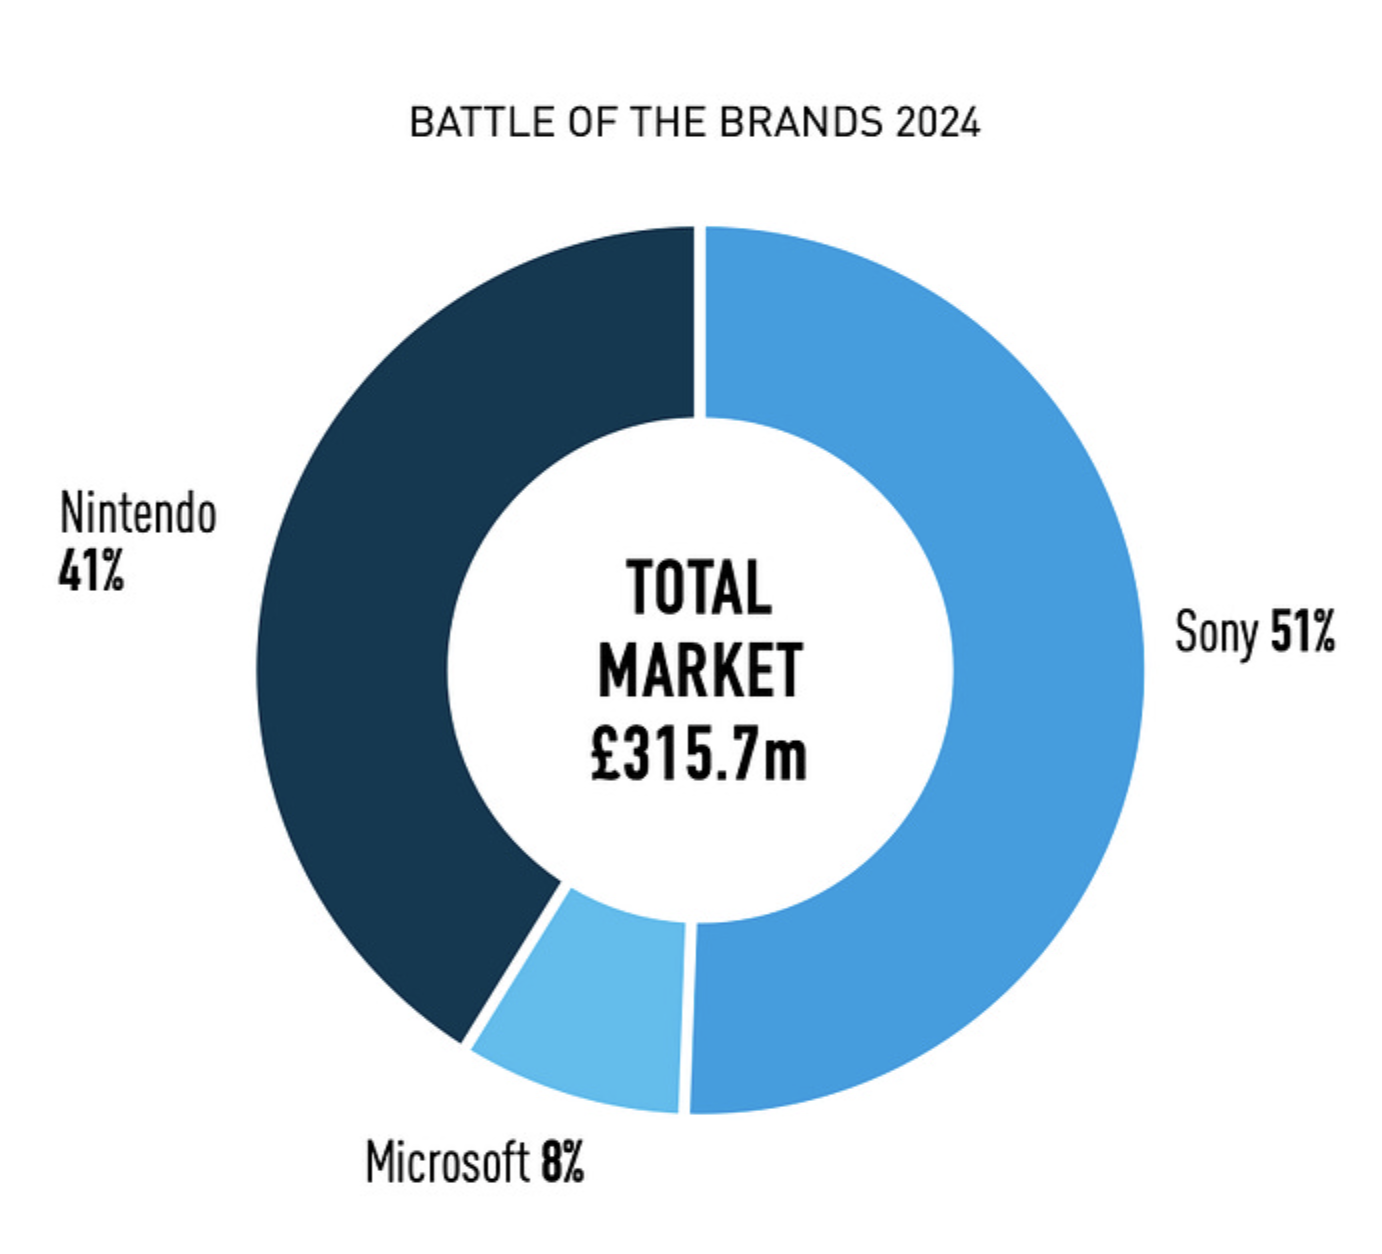
Looking at game sales, Sony holds 51% of the UK market, Nintendo has 41%, and Microsoft has 8%.
-
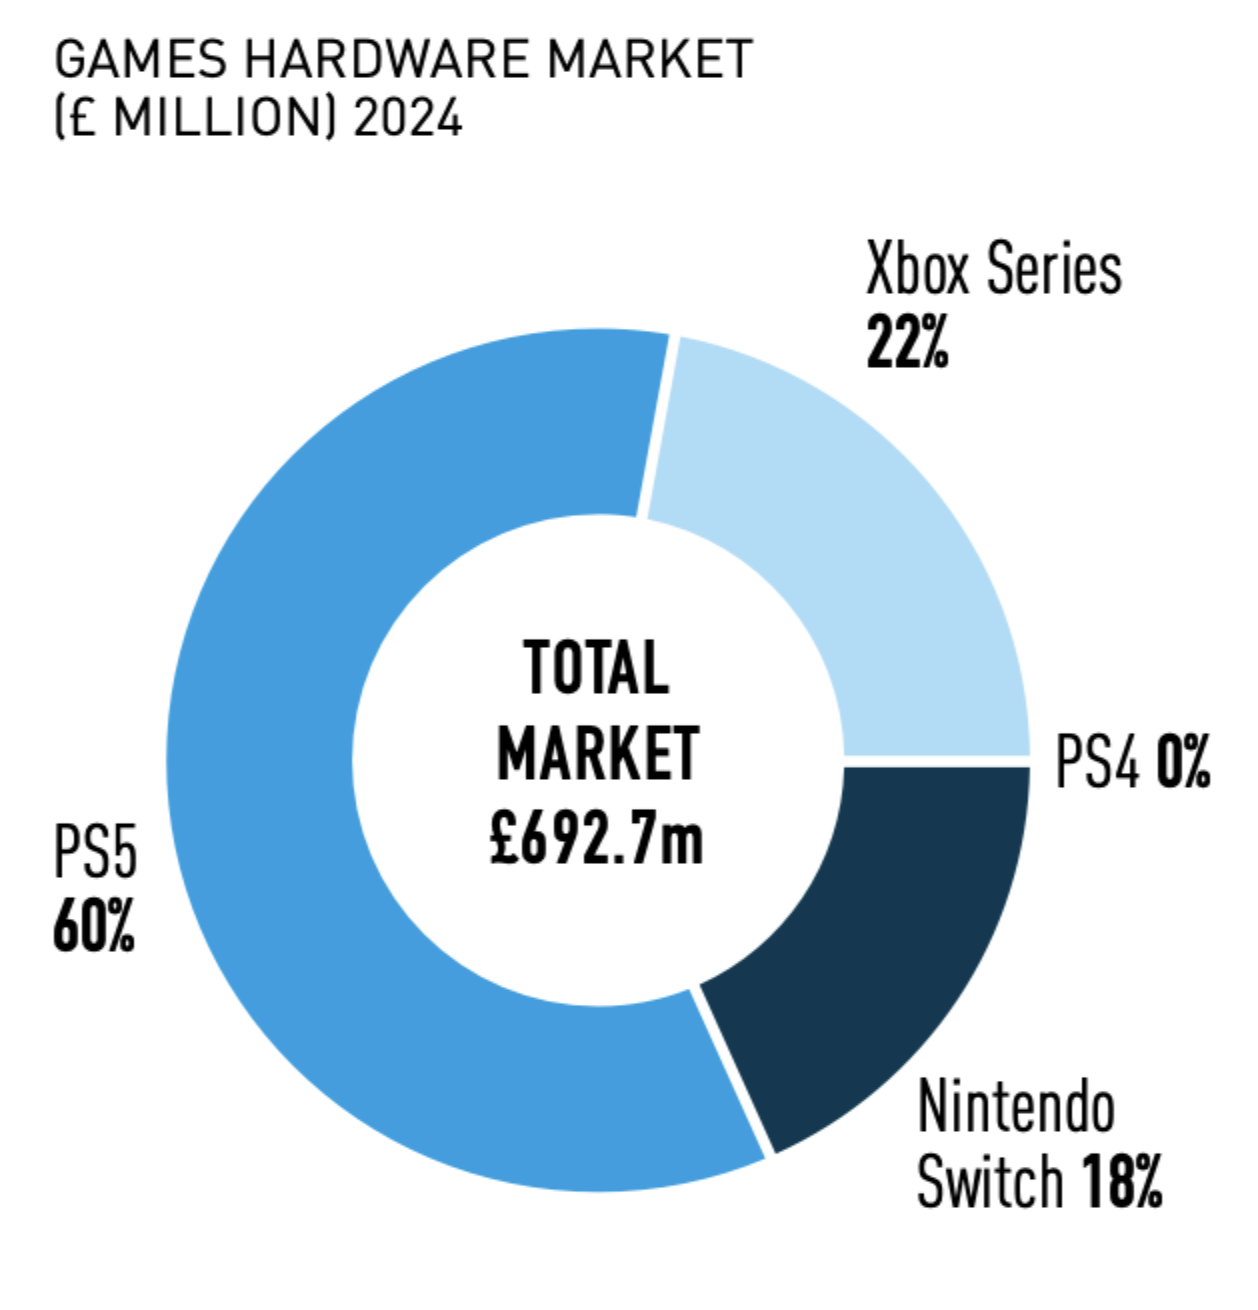
In hardware sales, the PlayStation 5 was the leading console in the UK market in 2024, accounting for 60% of all sales. The Xbox Series had 22%, and the Nintendo Switch had 18%.
-
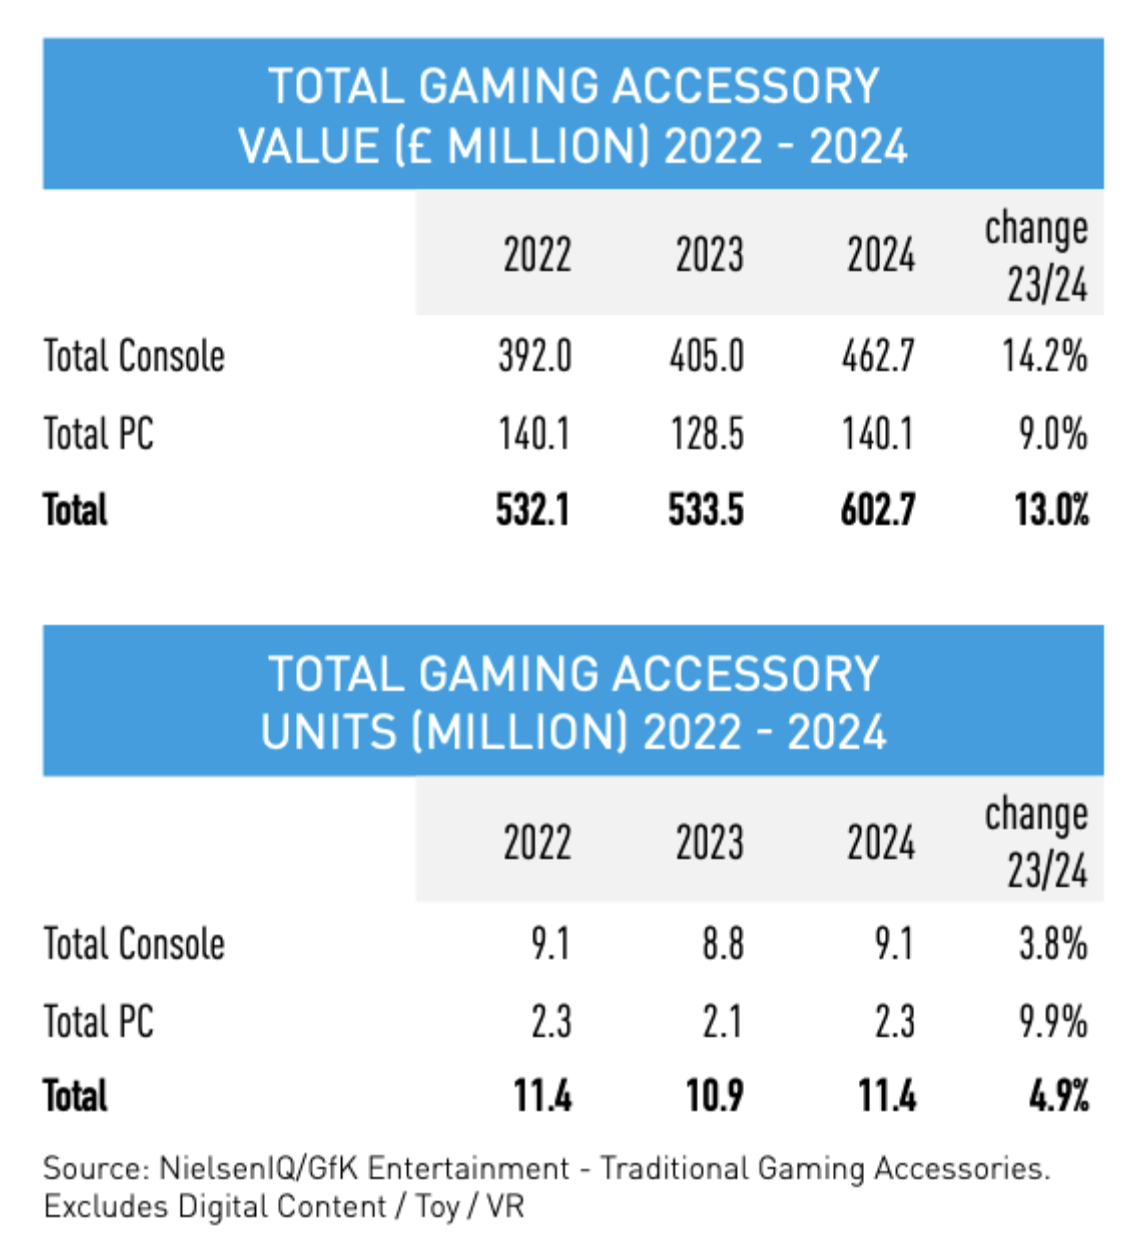
One of the few bright spots in 2024 was the accessories market. Revenue increased by 13% to £602.7 million, and the number of units sold rose to 11.4 million (a 4.9% increase).
-
The average price of a physical game copy in 2024 decreased by 11.4% to £31.63. The average cost of a digital copy fell by 12.6% to £13.98.
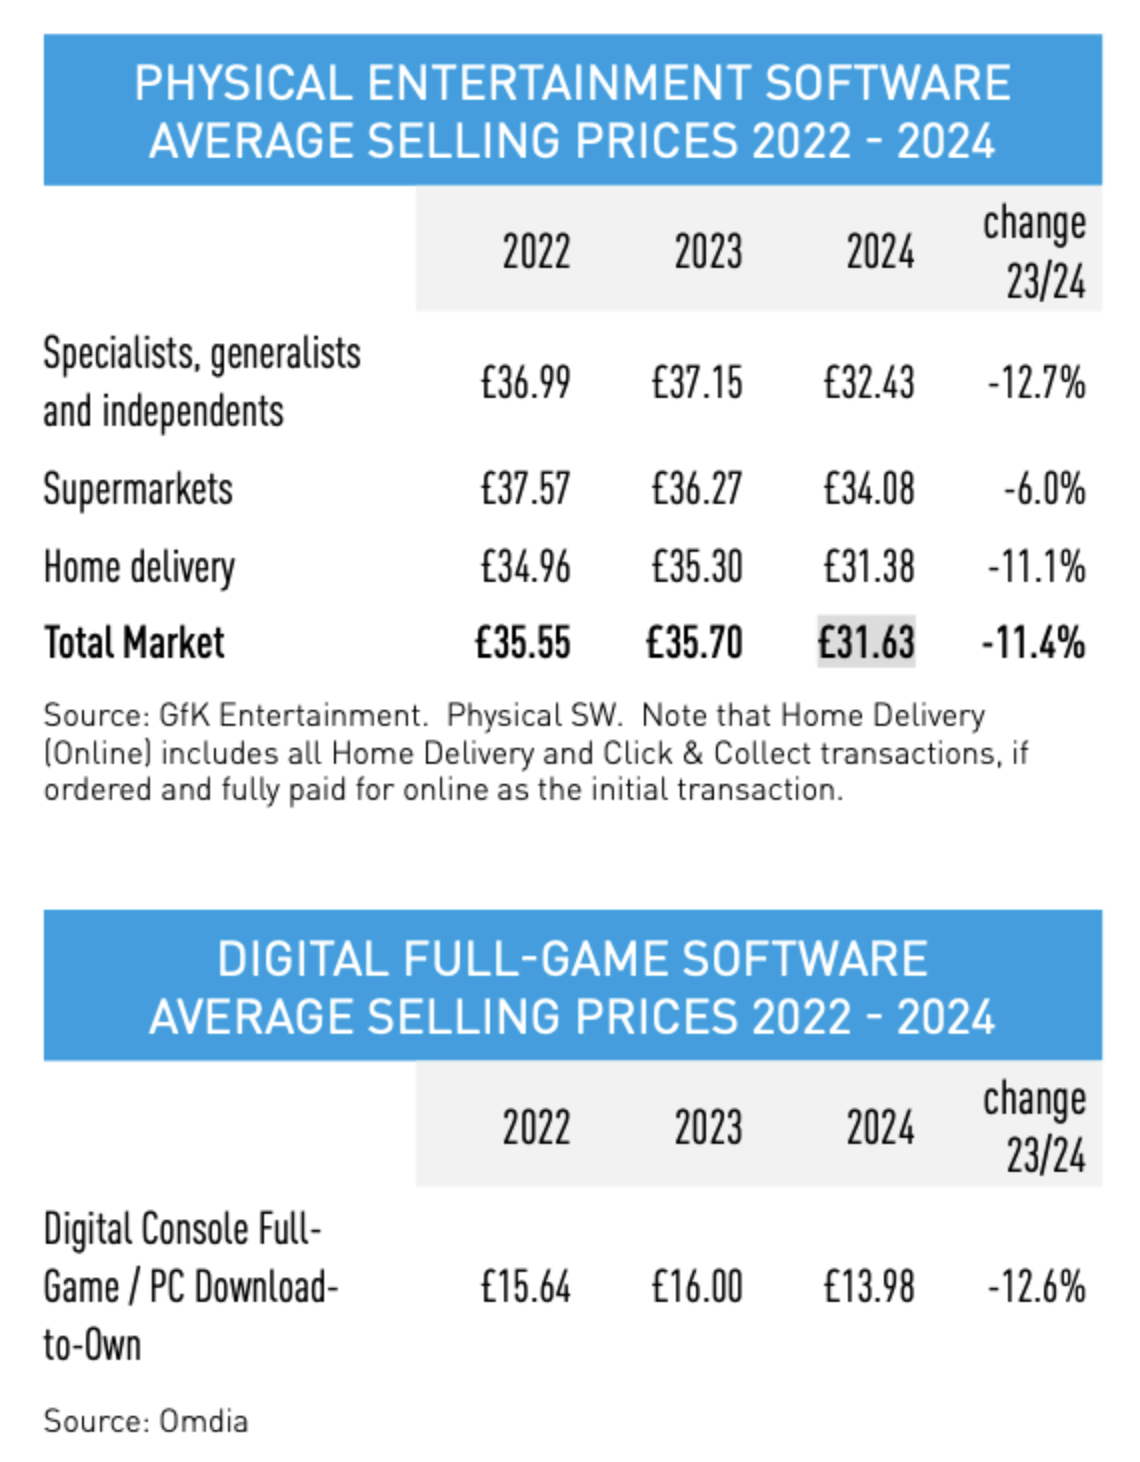
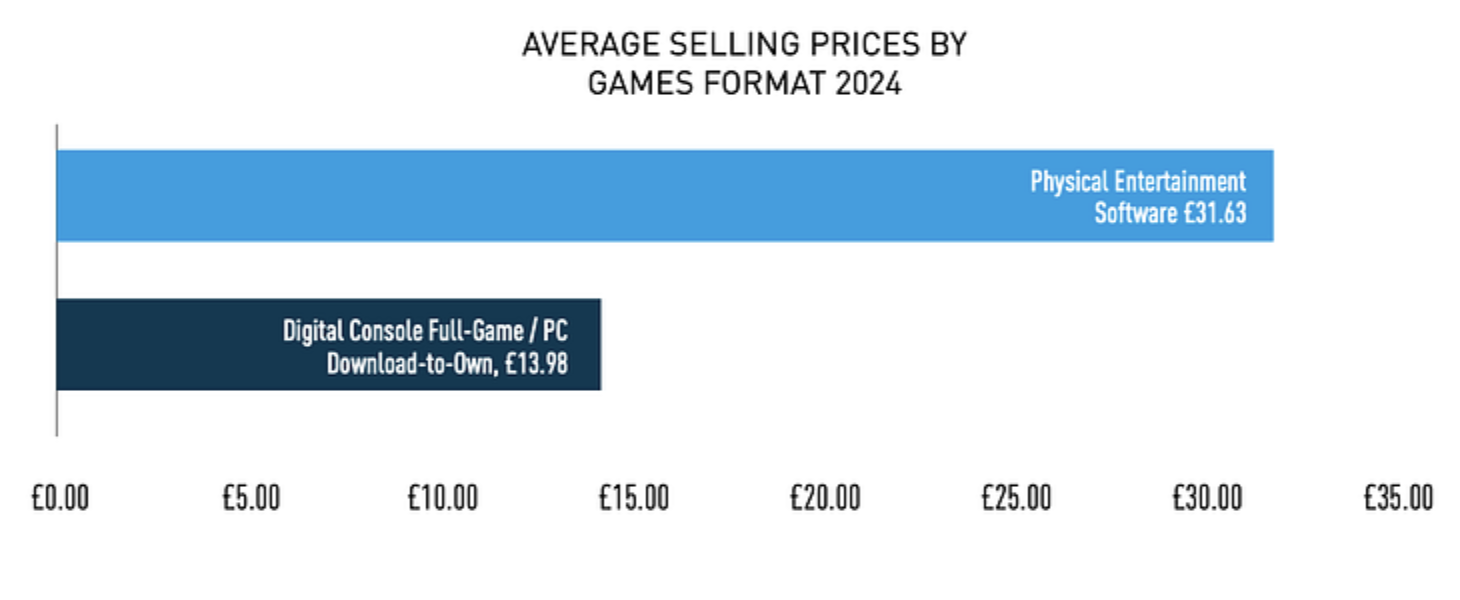
❗️It's important to note that predominantly major releases (with high prices) are sold in physical format, while digital formats offer more price diversity.
2024 charts in the UK
-
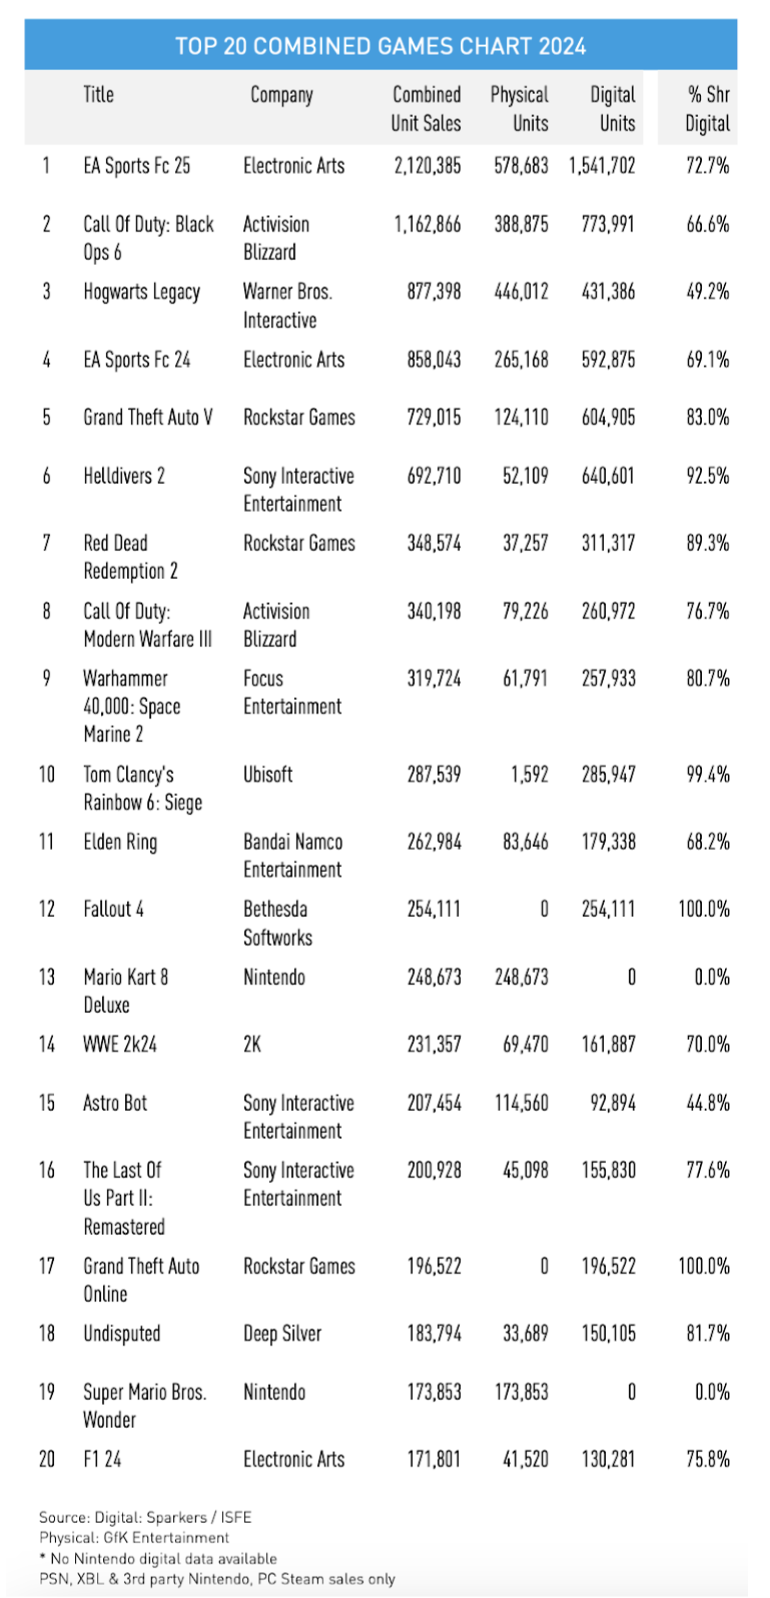
EA Sports FC 25, Call of Duty: Black Ops 6, and Hogwarts Legacy were the best-selling games of 2024. Notably, Hogwarts Legacy had less than 50% digital sales.
-
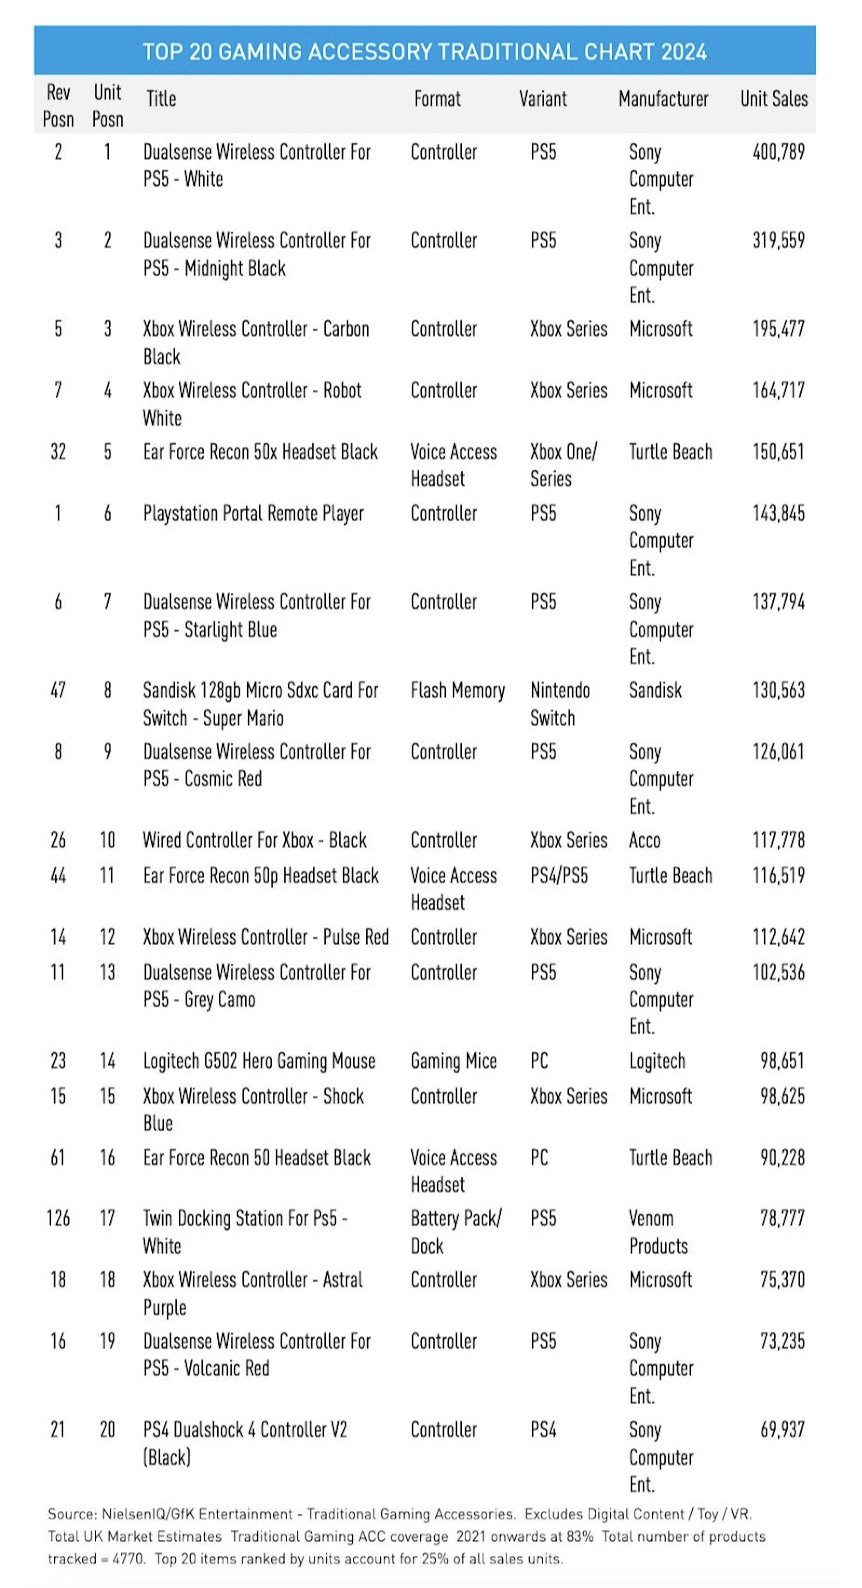
The DualSense controller was the best-selling accessory in the UK market by a significant margin.
Newzoo: The Gaming Market in 2024-2027
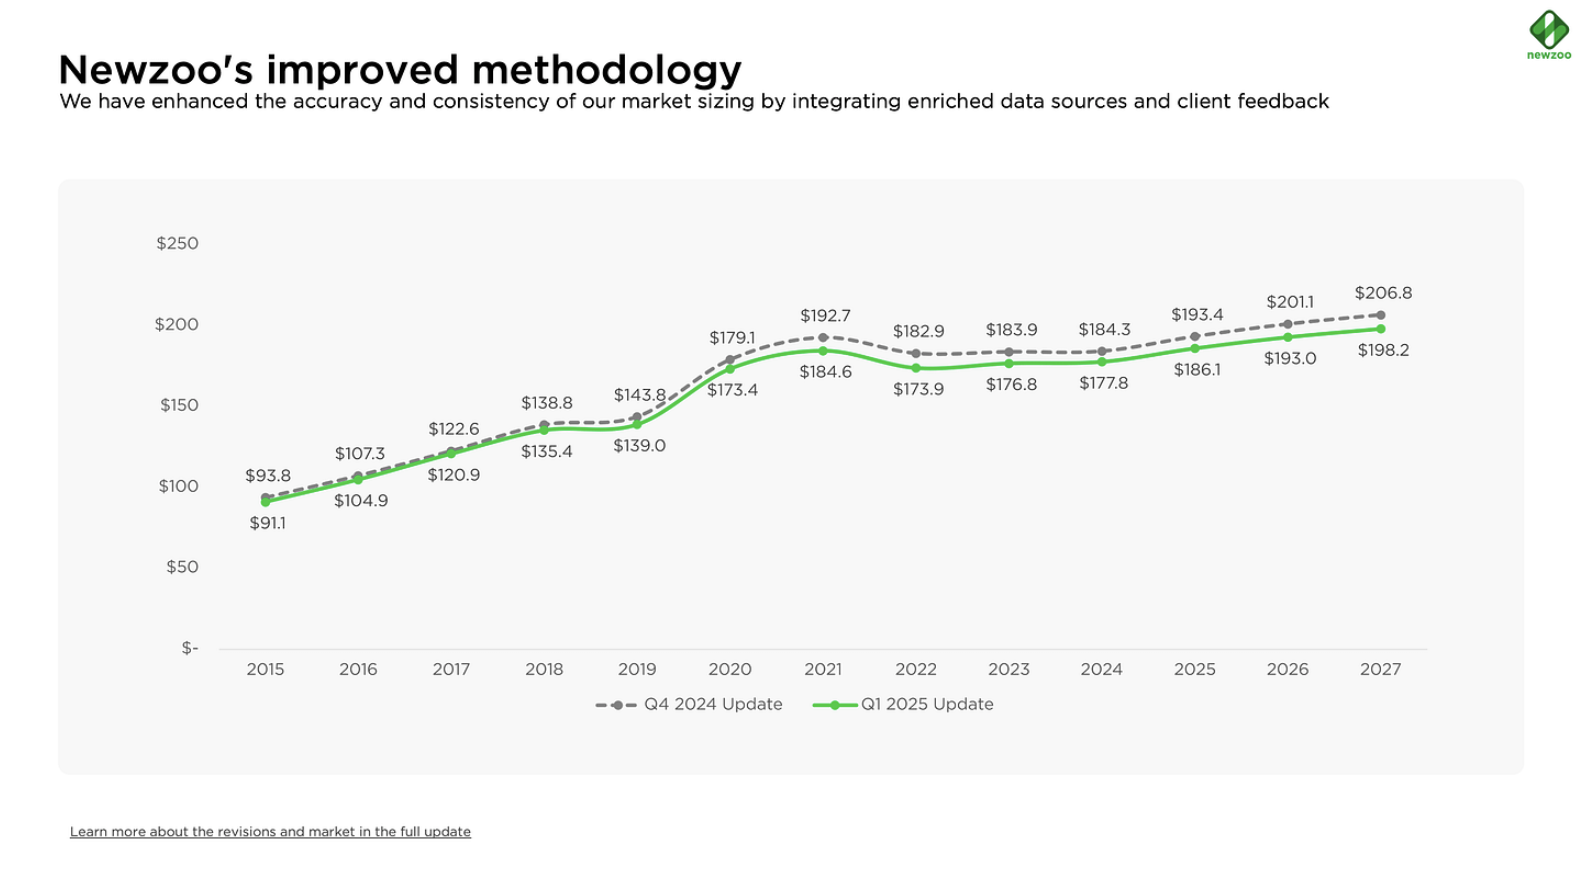
Newzoo updated its data collection methodology in Q1'25 and increased the number of sources. The figures should now better reflect reality.
Market-adjusted figures
-
The gaming market's volume was $177.9 billion in 2024 (previously reported as $184.3 billion).
- PC revenue decreased by 10% after adjustment (from $41.5 billion to $37.3 billion); console revenue decreased by 15% (from $50.3 billion to $42.8 billion); mobile revenue increased by 6% (from $92.5 billion to $97.6 billion).
- In 2024, the market grew by 0.6% compared to 2023. Considering global inflation, real revenue decreased.
- The mobile gaming market grew by 2.8% due to the recovery of Western markets. The console segment fell by 3.9%. The PC market grew by 0.1%.
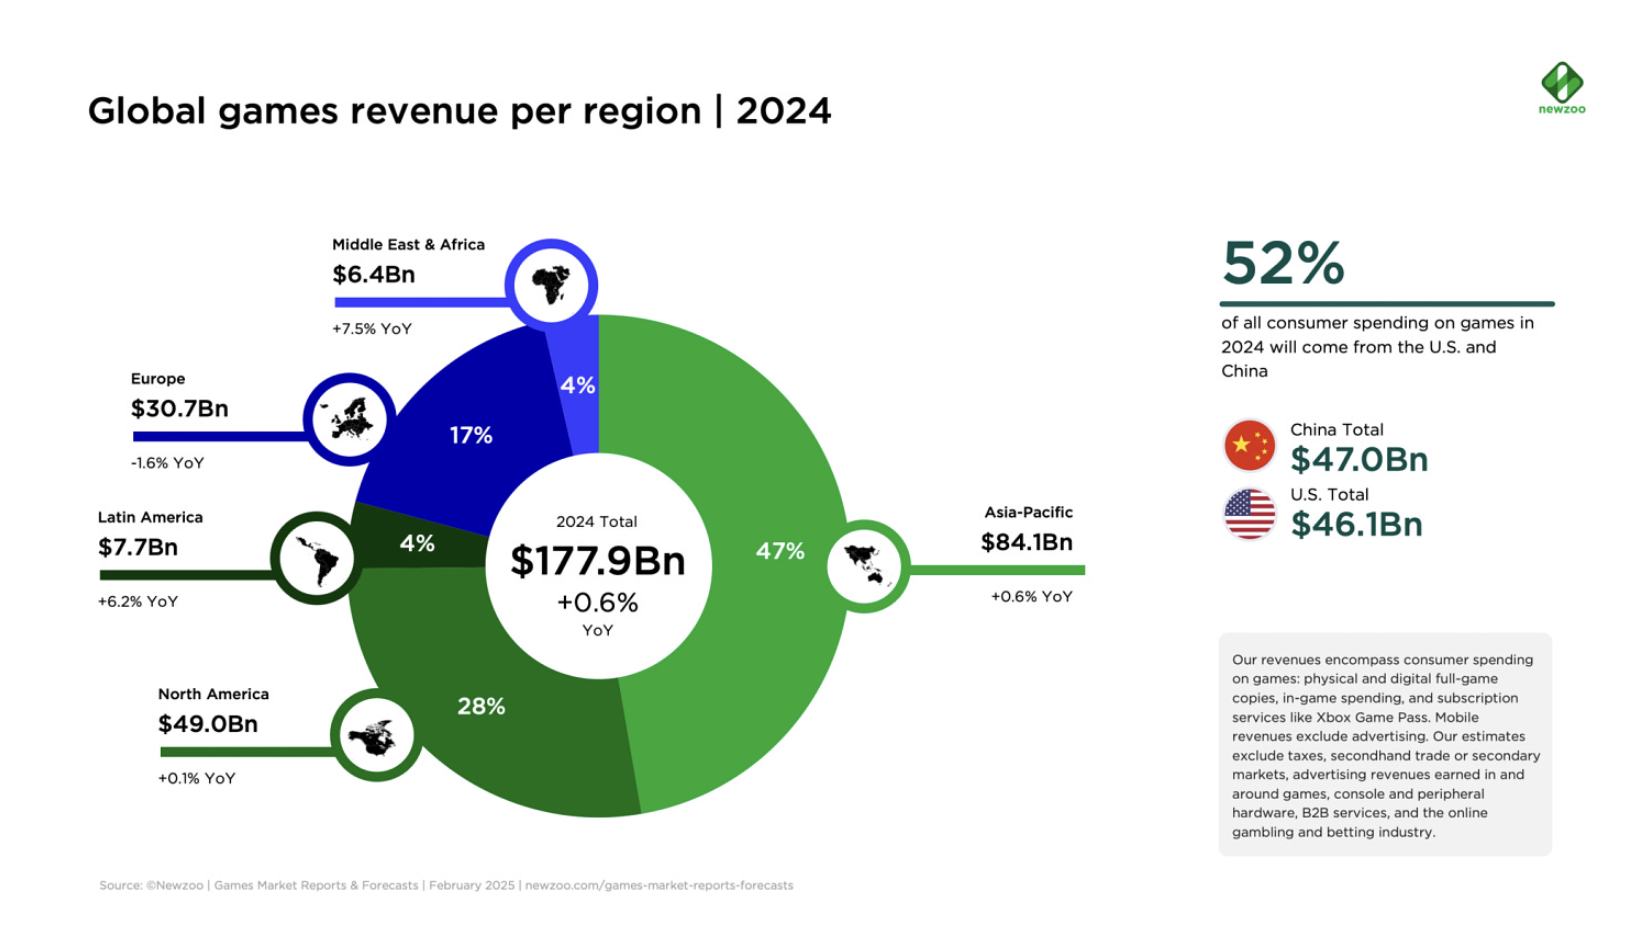
- By the end of 2024, 52% of the total market volume came from China ($47 billion) and the U.S. ($46.1 billion). 47% of all revenue came from the Asia-Pacific region.
Forecast to 2027
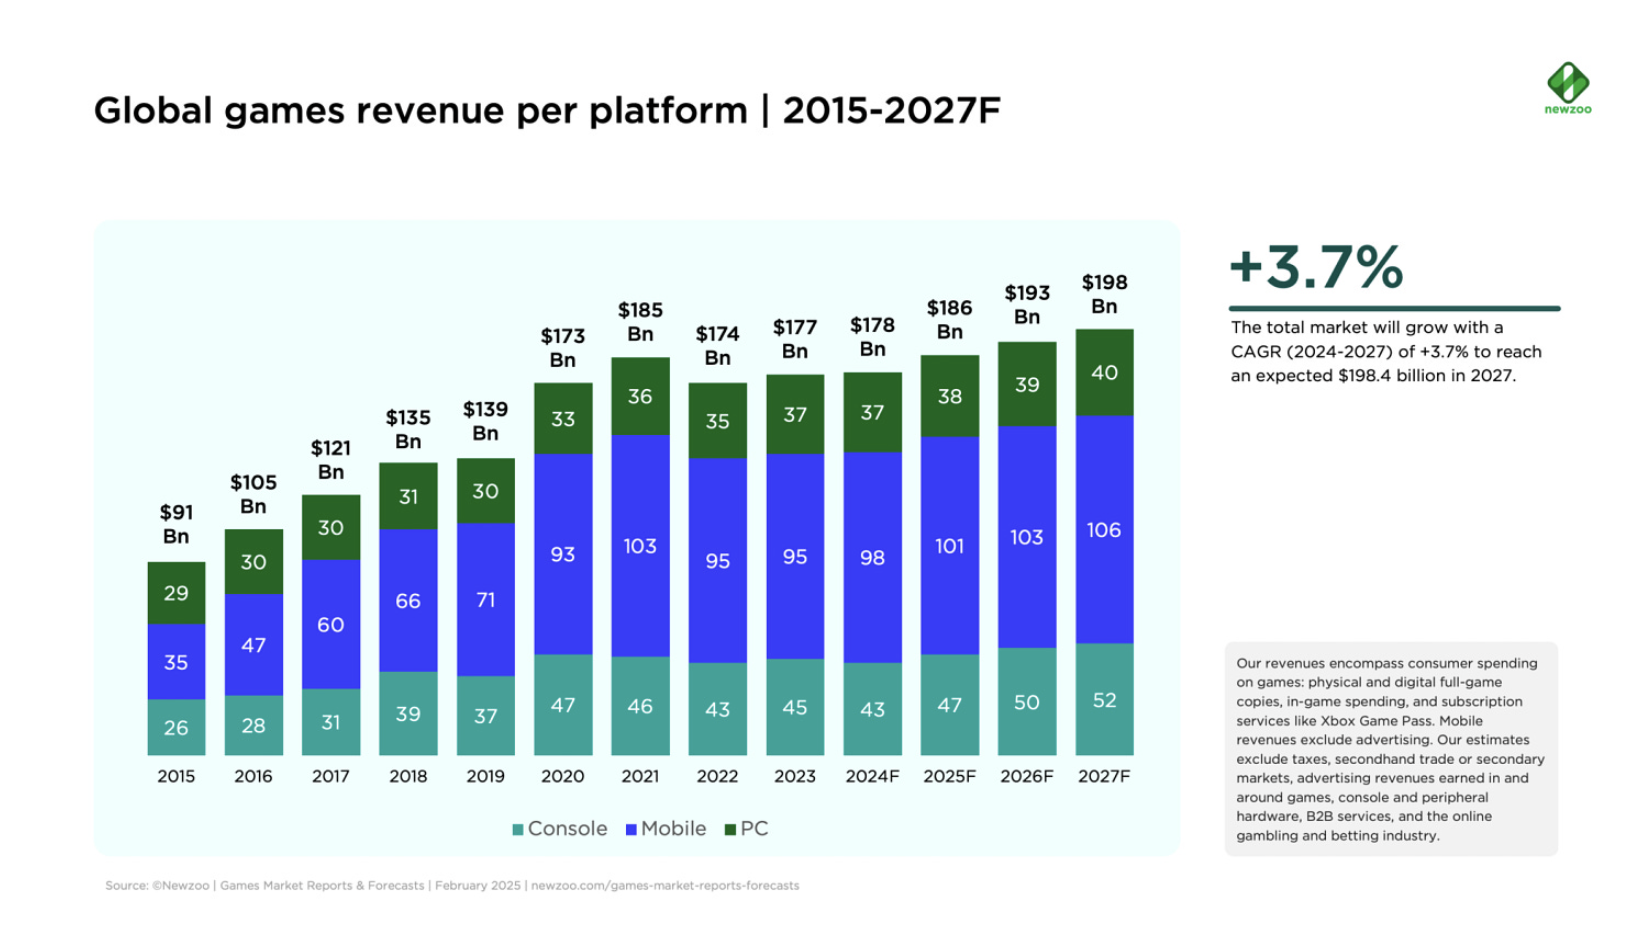
- Newzoo estimates the gaming market's annual growth prospects at 3.7% per year.
- By 2027, the gaming market should reach $198B. Previously, Newzoo forecasted a volume of $206,8B.
- The PC segment will grow largely organically. Newzoo notes that D2C payment methods are a potential growth point for the mobile segment. Companies will be able to pay less to intermediaries, resulting in more investment in user acquisition. The most obvious growth point for consoles is the release of Grand Theft Auto VI, which will lead to a large number of players transitioning to new consoles.
Niko Partners - Forecast for Asia and MENA Markets in 2025
-
The total size of the Asia and MENA markets is expected to reach $89 billion in 2025. These countries are home to 1.76 billion gamers.
-
Niko Partners forecasts that China's gaming market will reach $50 billion in 2025, with two-thirds of this generated by mobile games. The PC/console segment will continue to grow actively.
-
Thailand's market will reach $2 billion, India's market will reach $1 billion (+14.7% YoY), and the Philippines will surpass $500 million in revenue.
-
Niko Partners believes that major Asian markets (Japan and South Korea) will not grow in 2025. Positive figures will be seen only in 2026.
-
More than one billion gamers in Asia and MENA watch gaming and esports streams, which is one of the main ways to discover new projects and markets in these regions.
-
Niko Partners expects the console segment of the market to outpace the growth of mobile and PC segments in 2025. Two reasons for this: Grand Theft Auto VI and Nintendo Switch 2.
-
Analysts at the company are confident that tariffs on products from China will not affect gaming consoles.
The company also shared the accuracy of its forecasts for previous periods. Niko Partners overestimated the mobile market but underestimated the PC market.
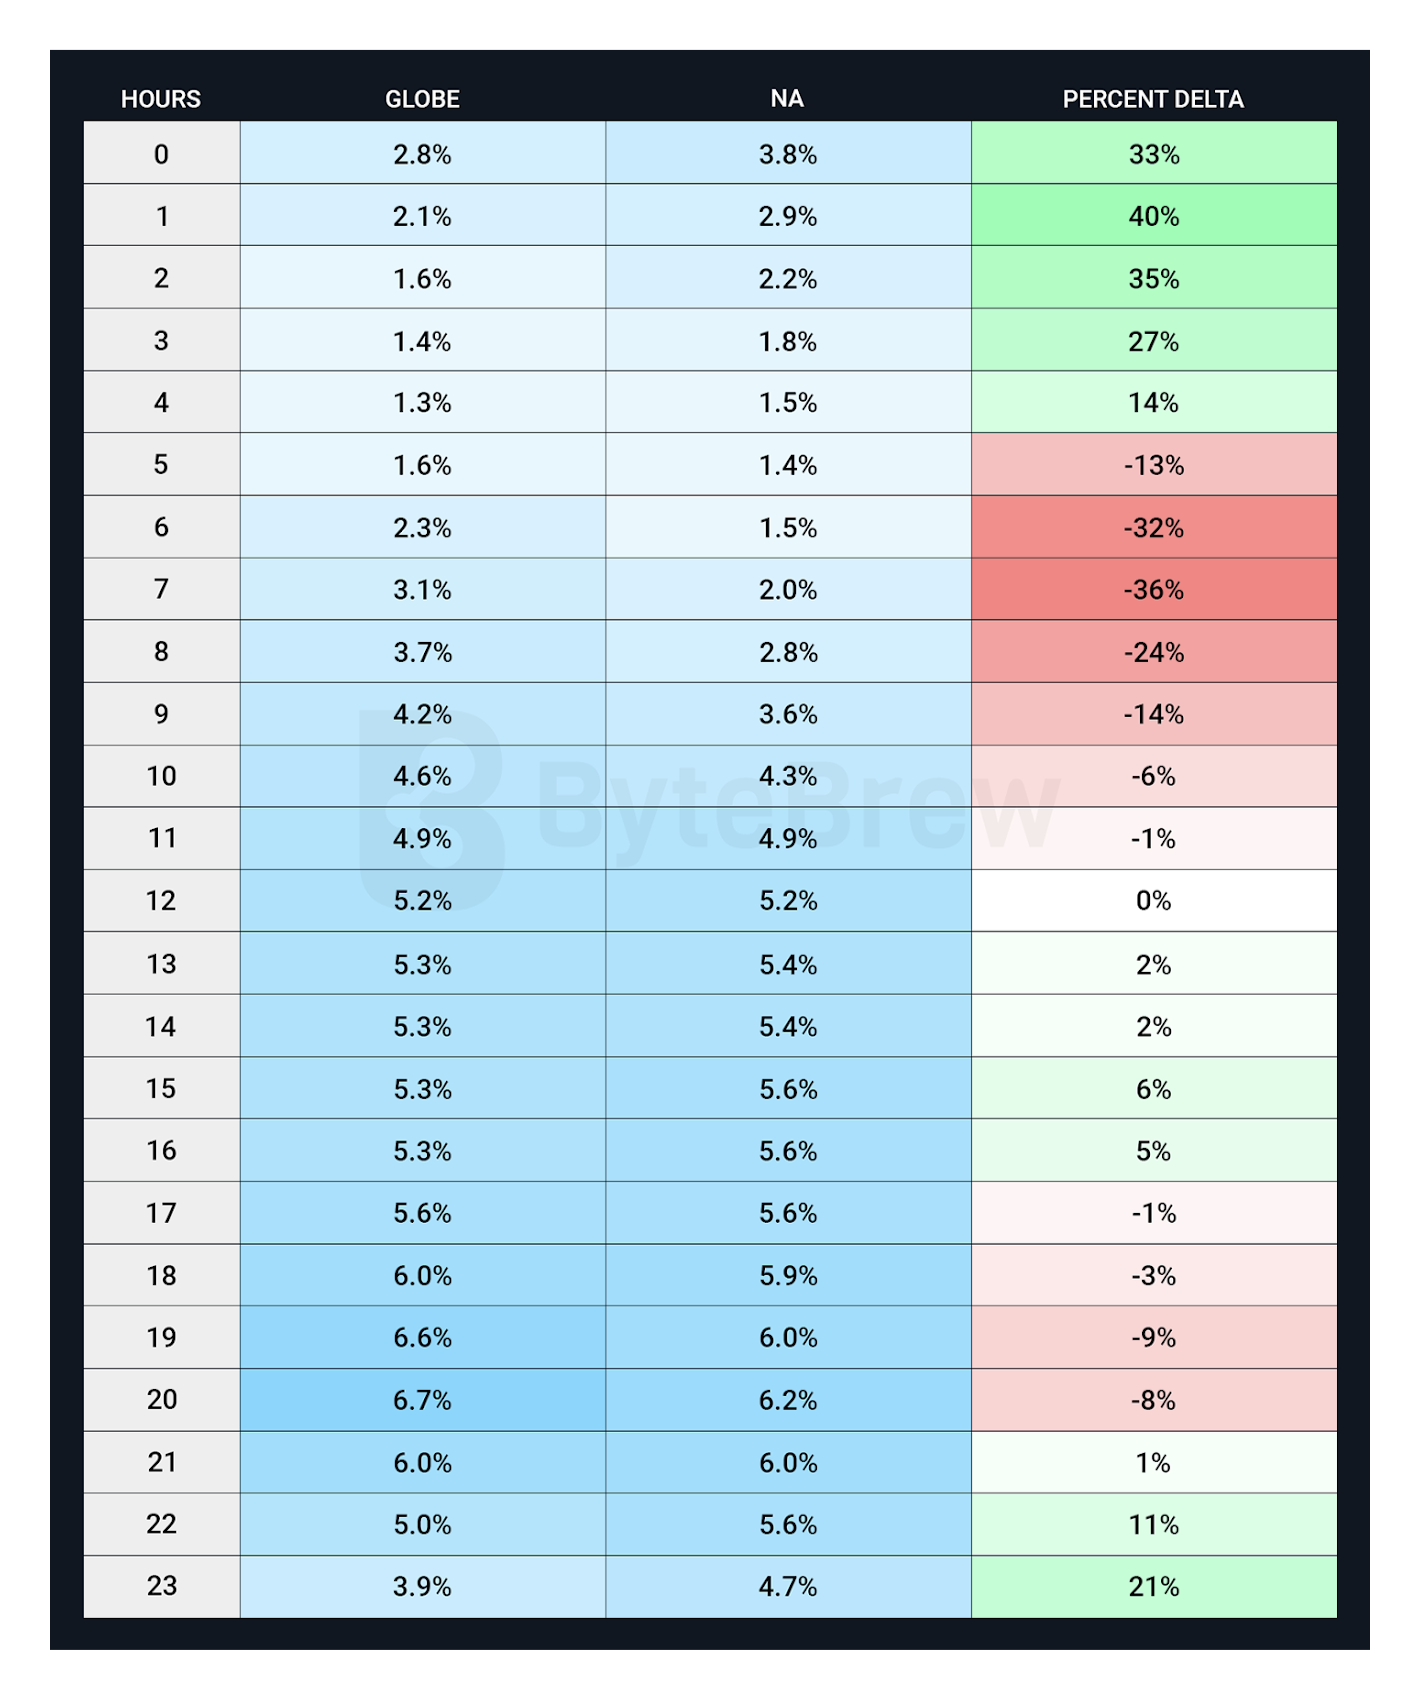
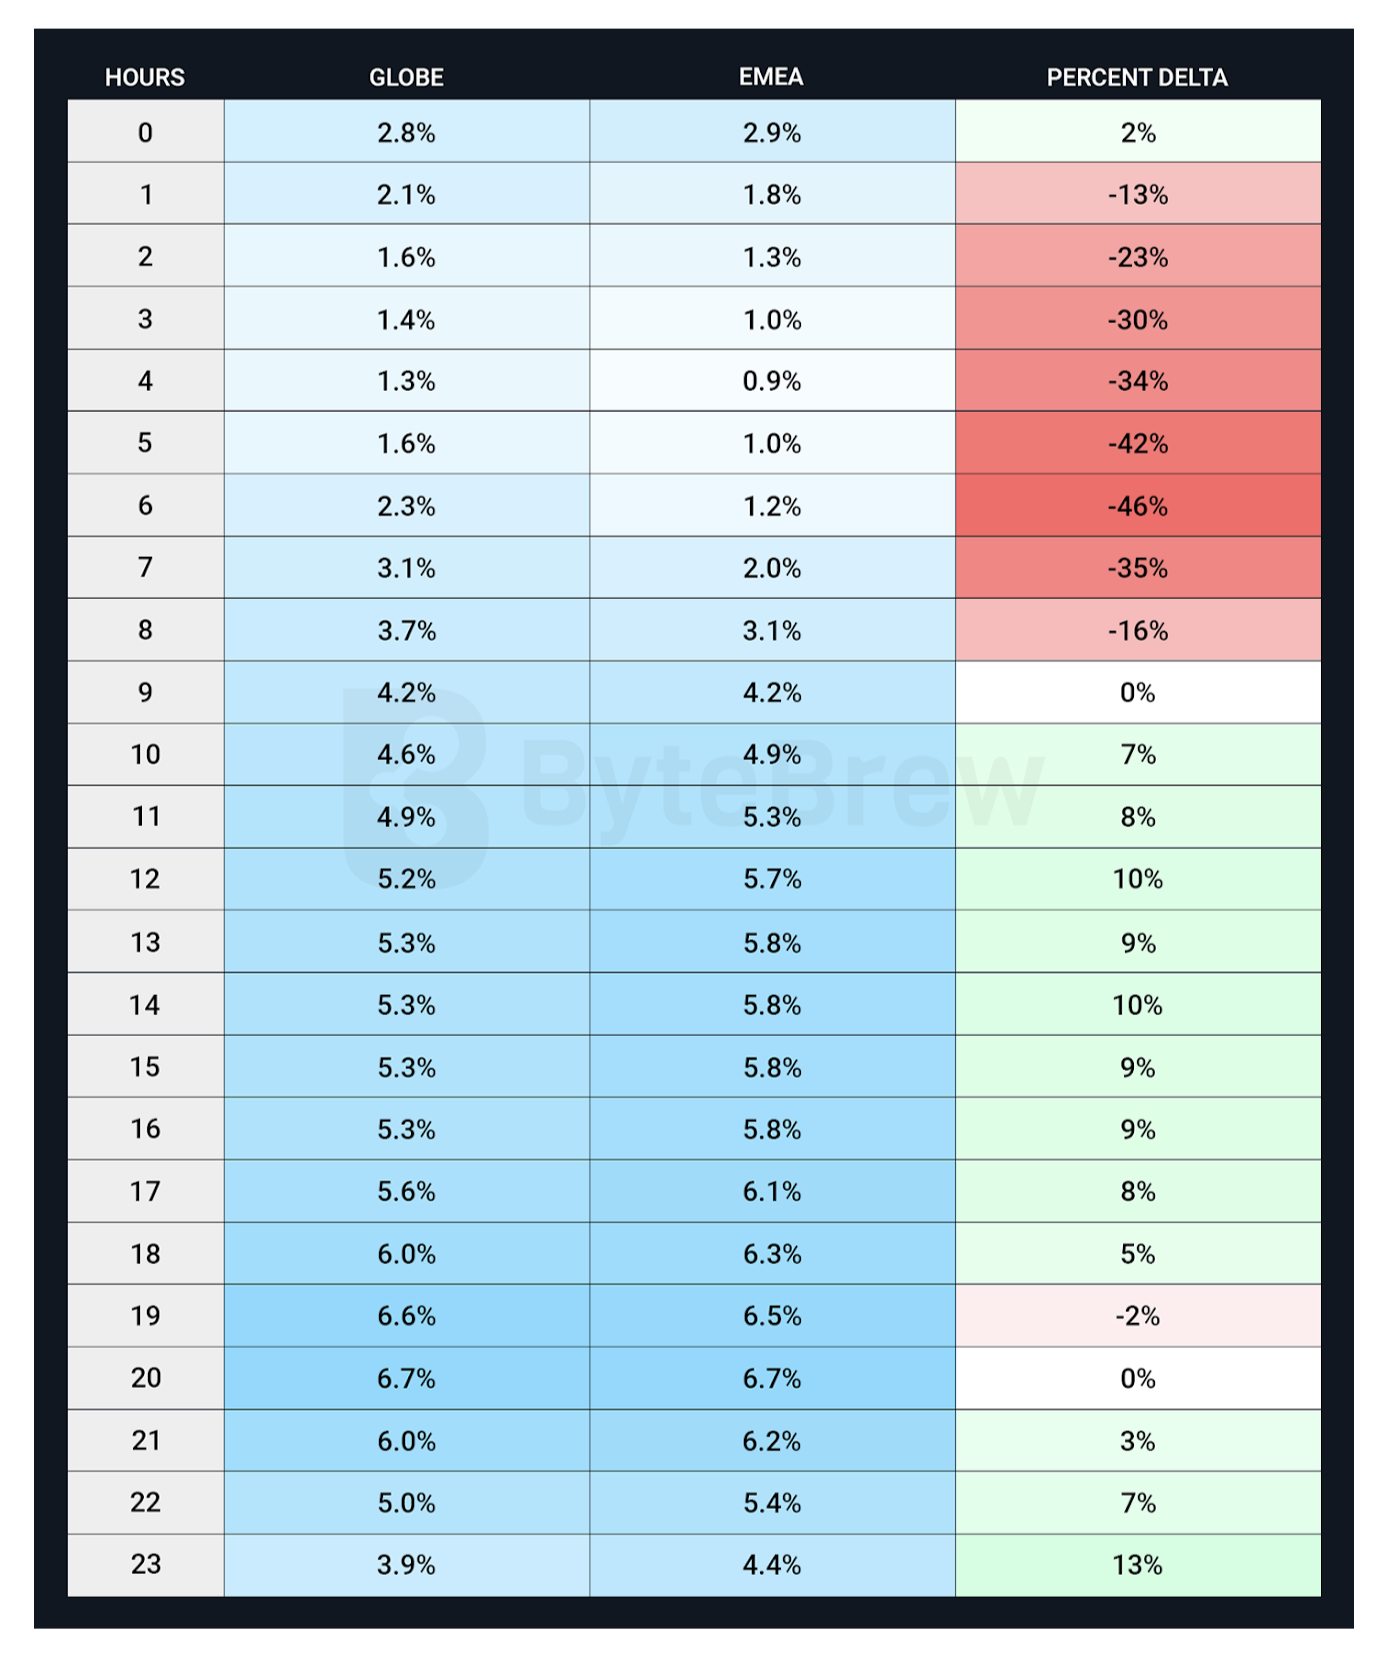
ByteBrew: What time do mobile users play Games
- The analytics platform analyzed over 1 billion active users across 185 countries. For regions, data variability is +/- 1 hour of timezone.
-
Peak user activity occurs at 8 PM, with the least activity at 4 AM.
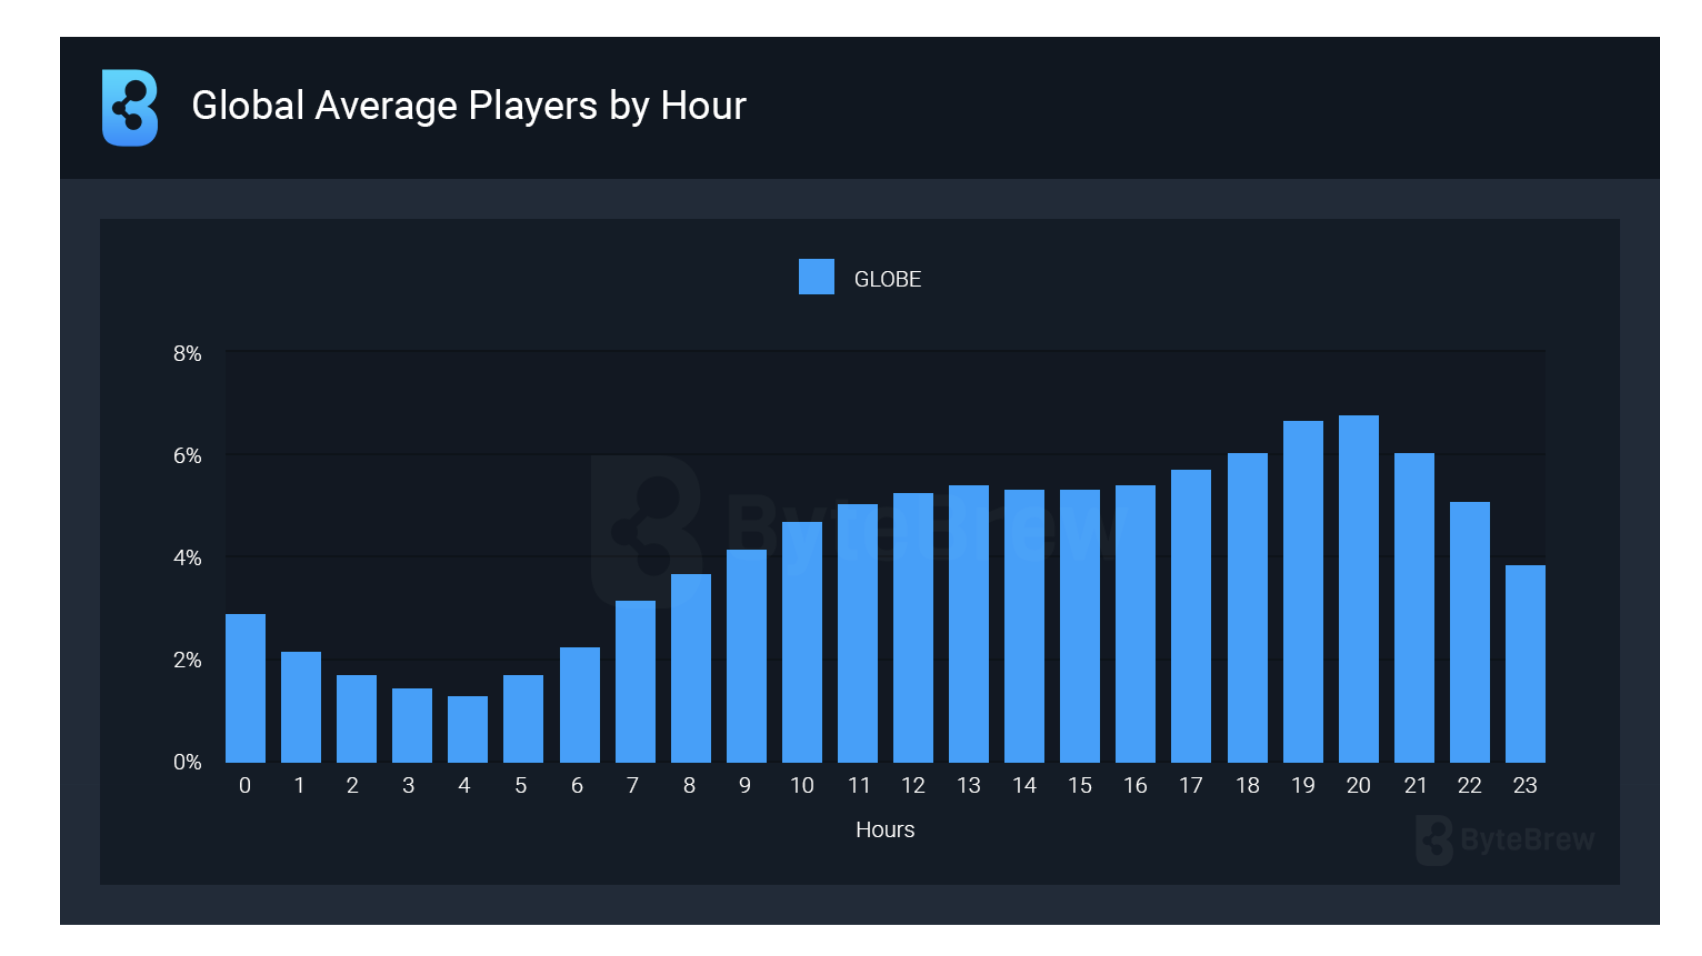
- The company recommends launching in-game events between 2 PM and 4 PM UTC, as users are most active during this time.
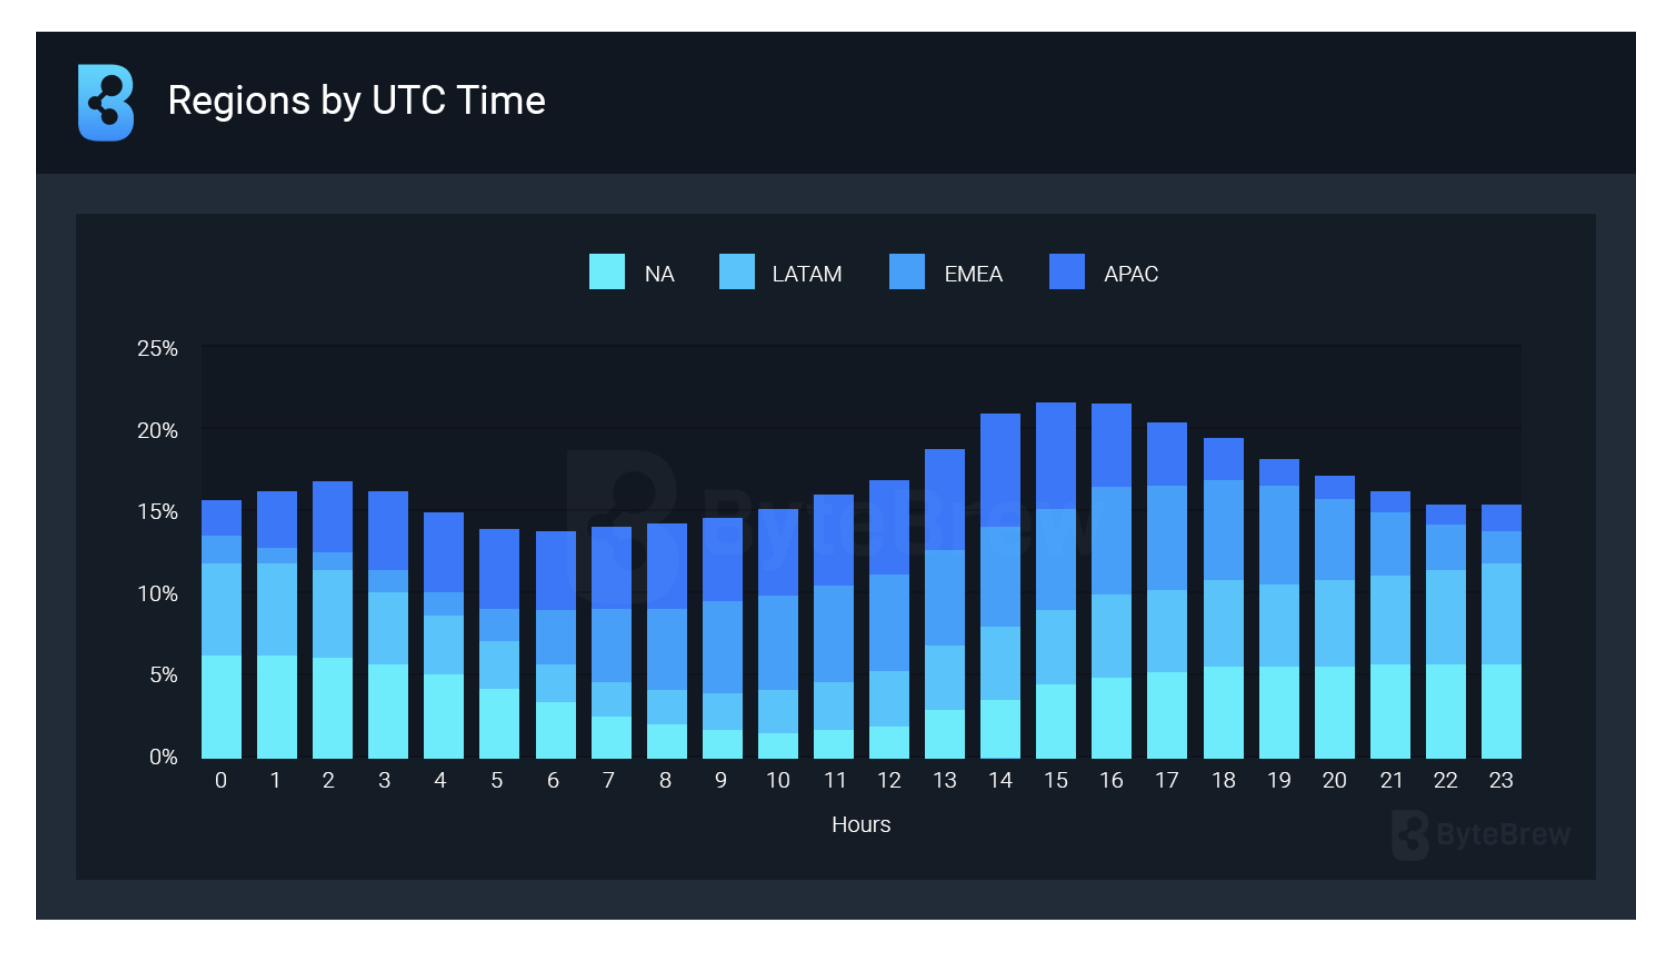
User Behavior in North America
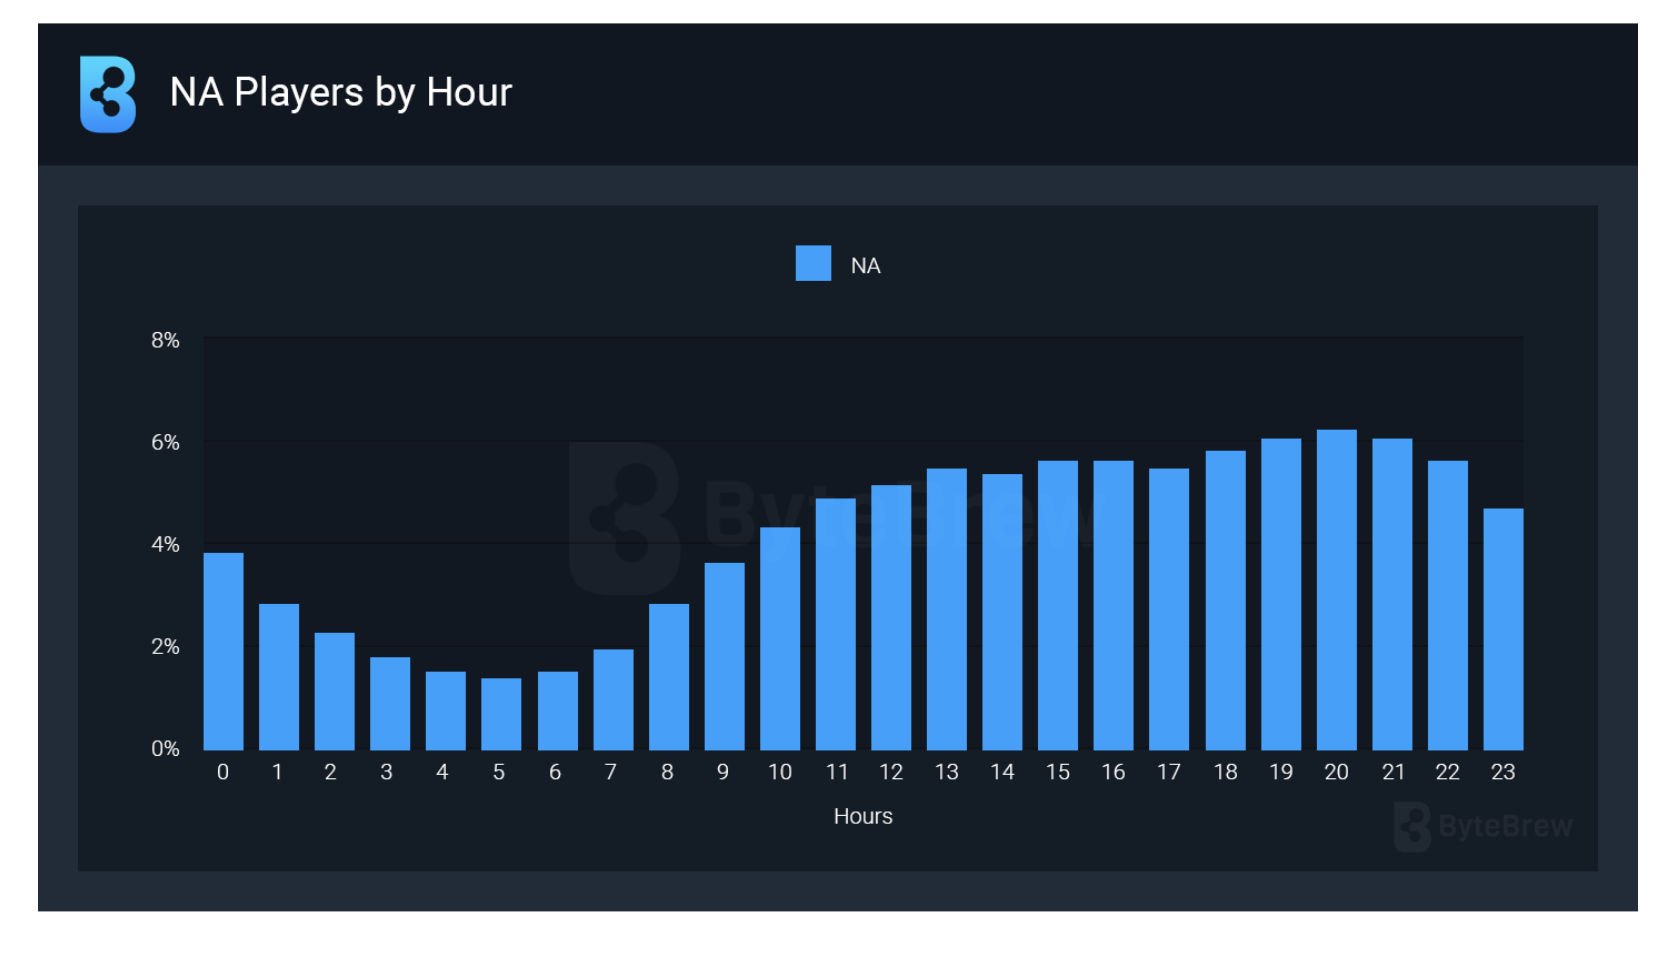
-
In North America, the most active hours are from 7 PM to 9 PM.
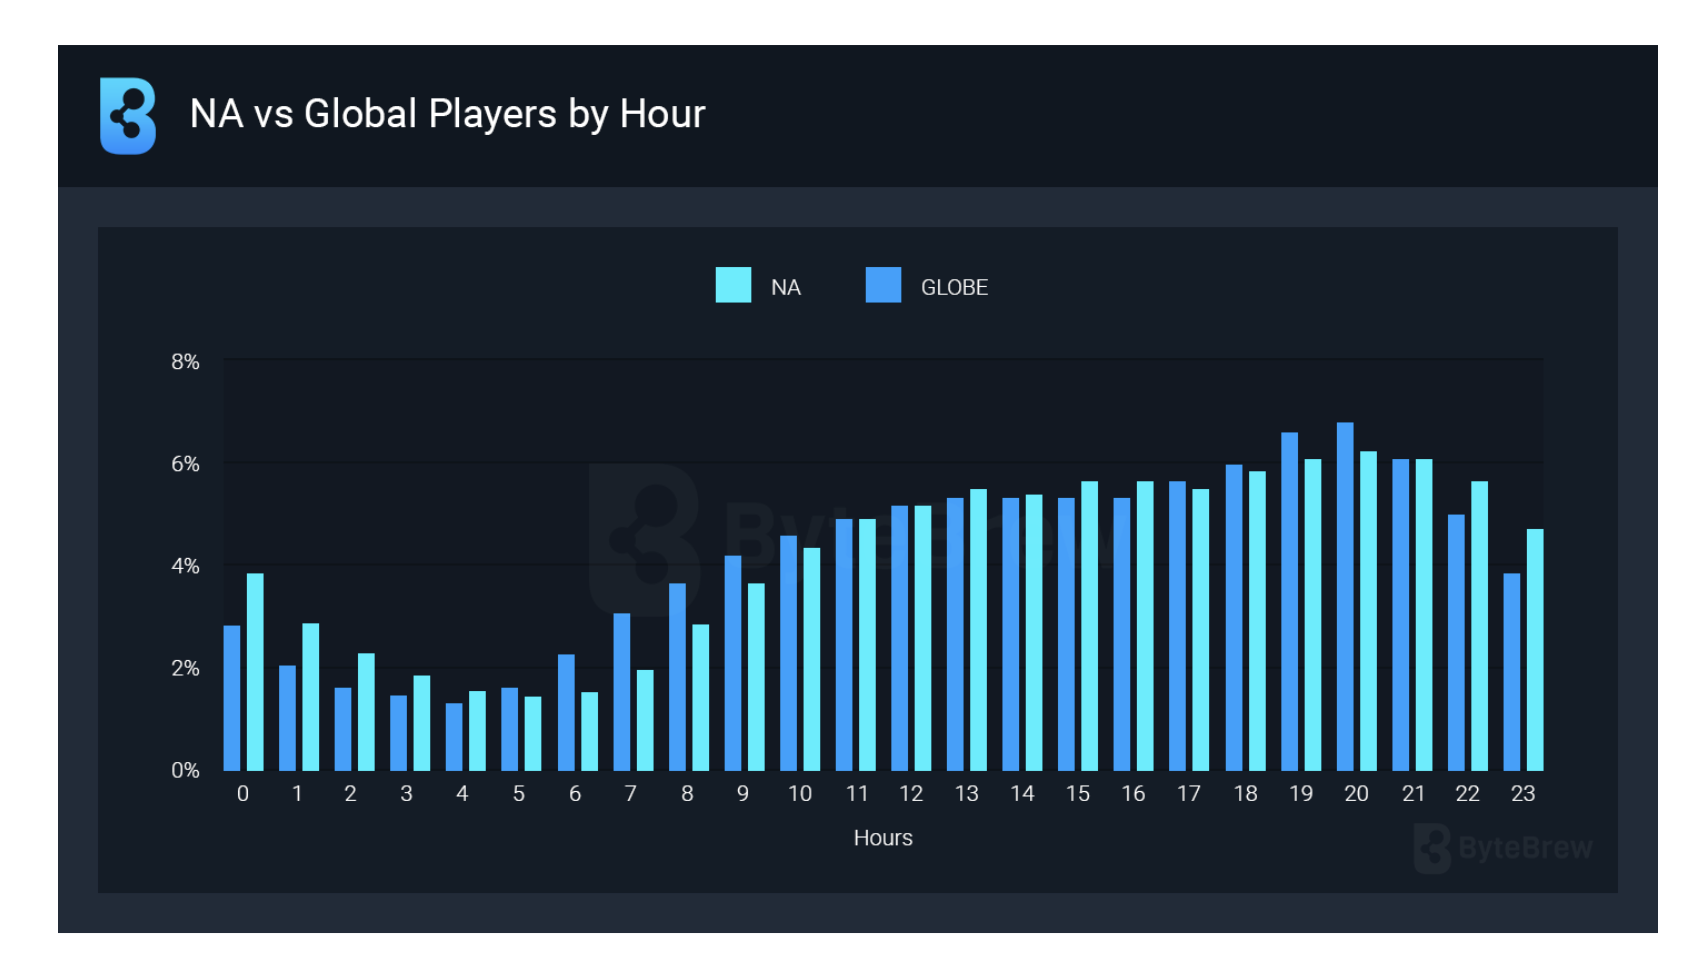
- Compared to the rest of the world, North American users play 40% more often between midnight and 2 AM.
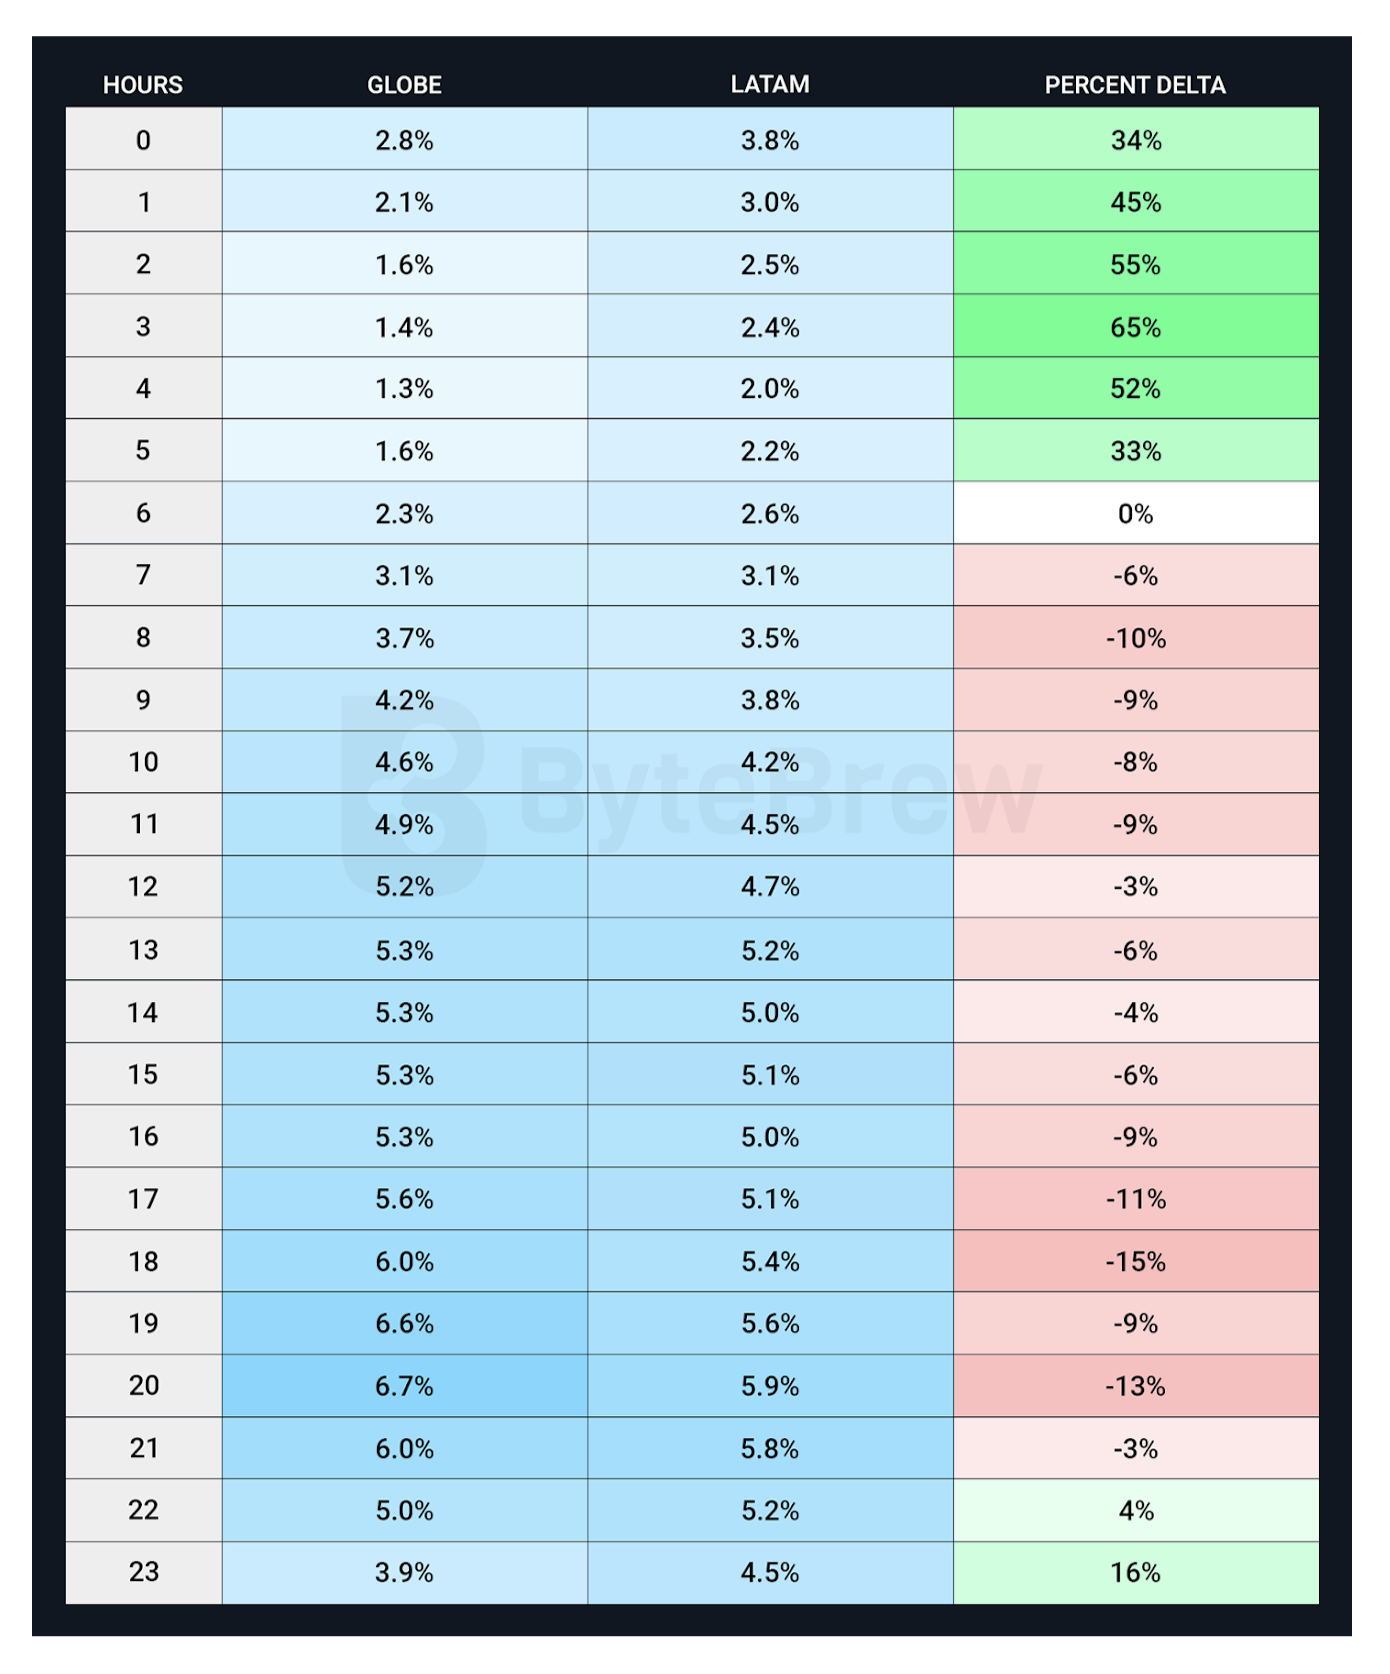
User Behavior in Latin America
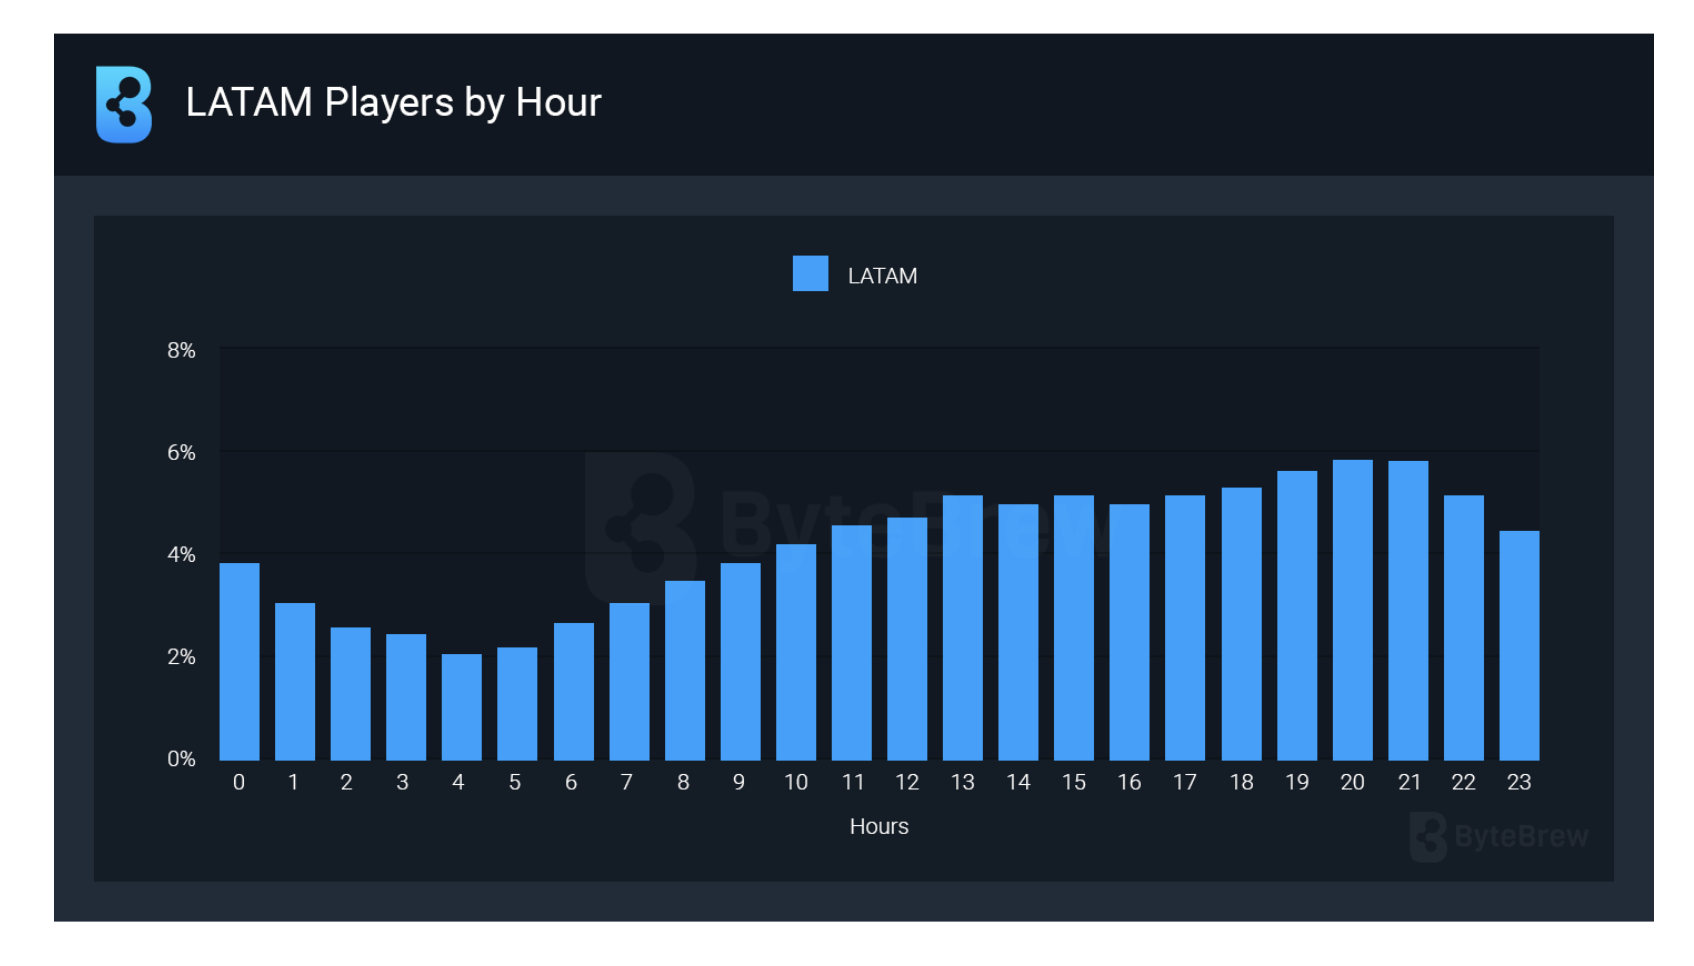
- In Latin America, user activity increases in the early morning hours, starting around 5-6 AM.
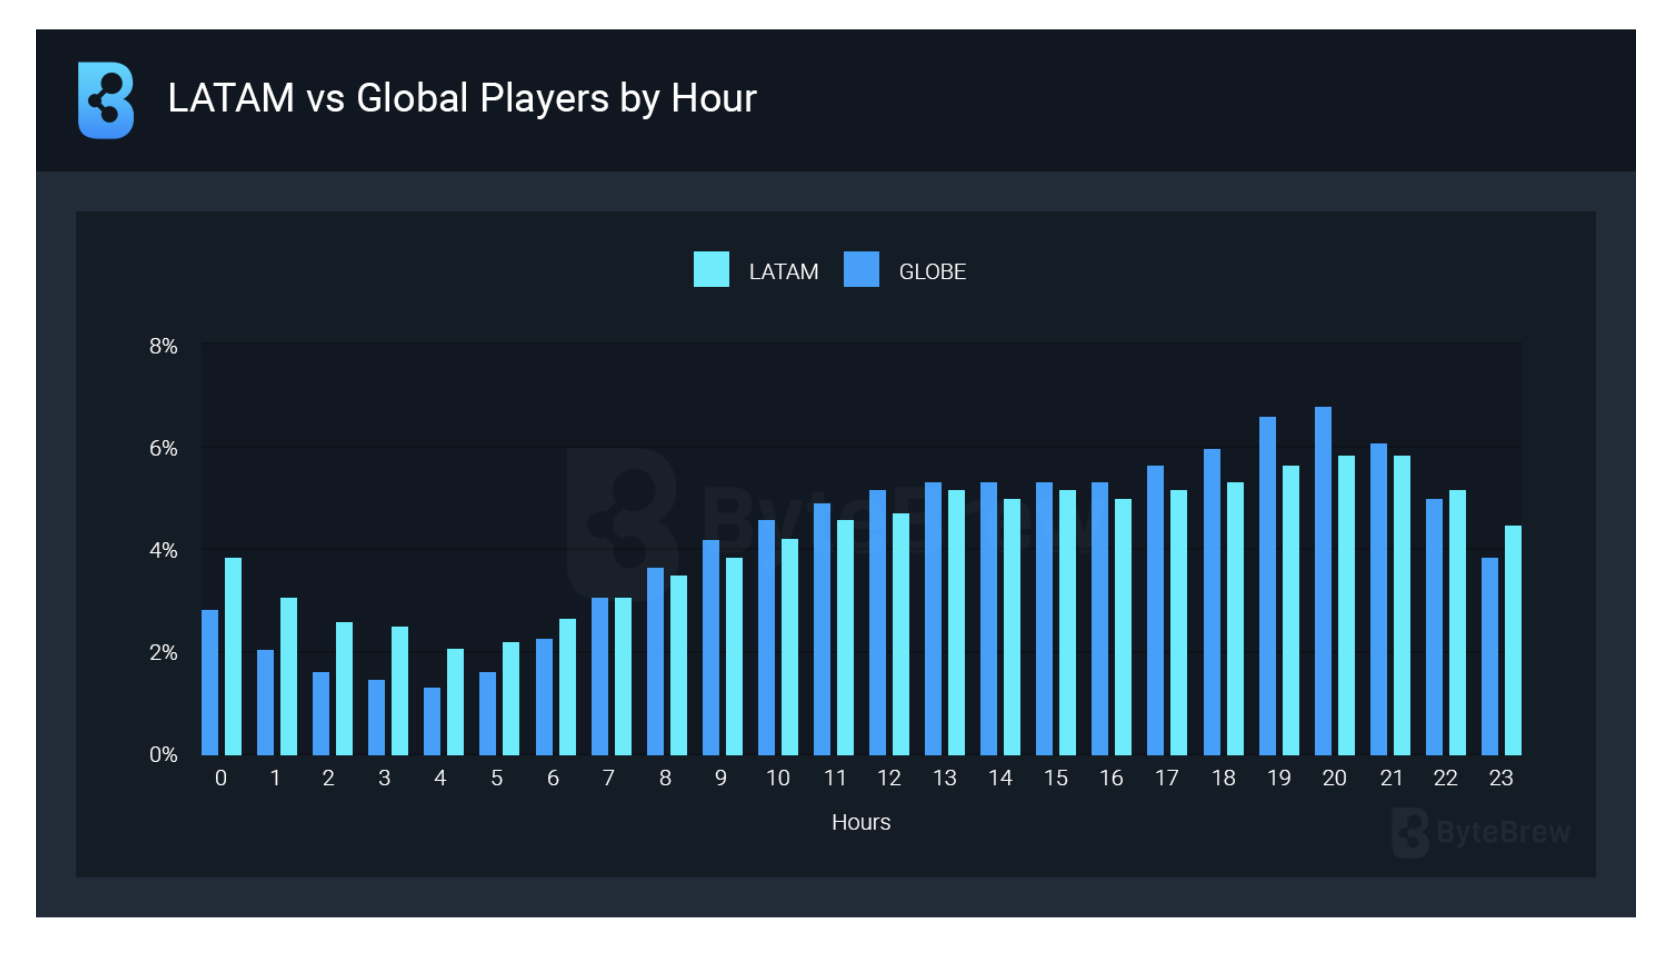
- In Latin America, 65% more people play during late-night hours (from 1 AM to 4 AM).
User Behavior in the EMEA Region
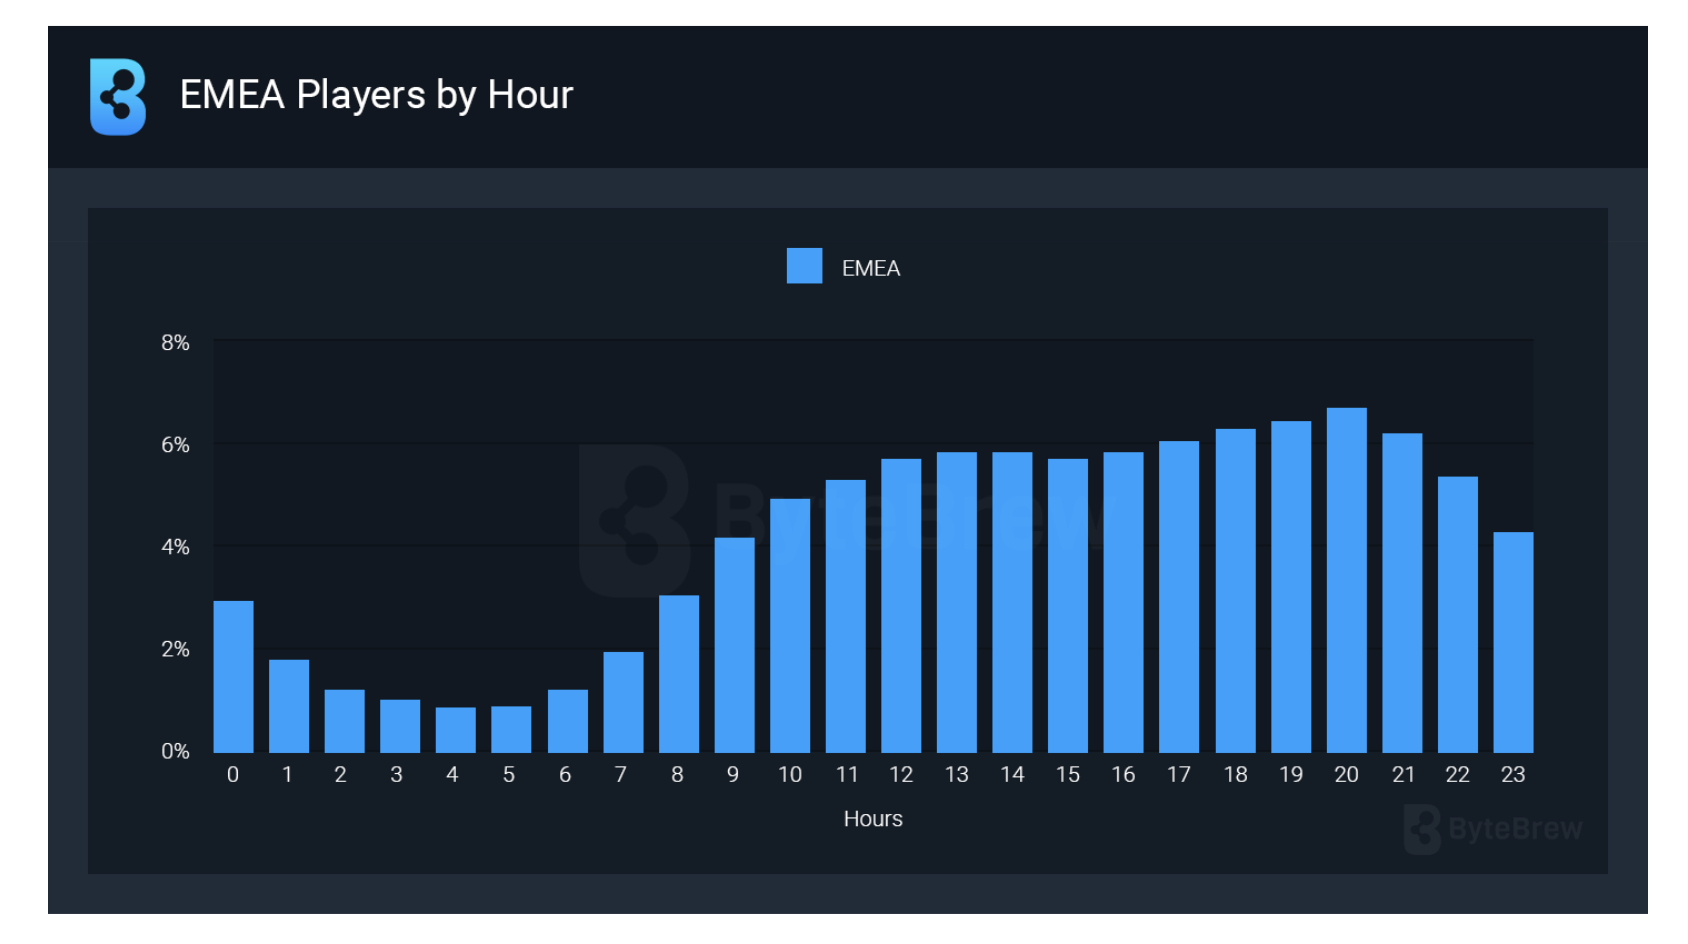
- Players in the EMEA region play significantly less at night and in the morning compared to global trends.
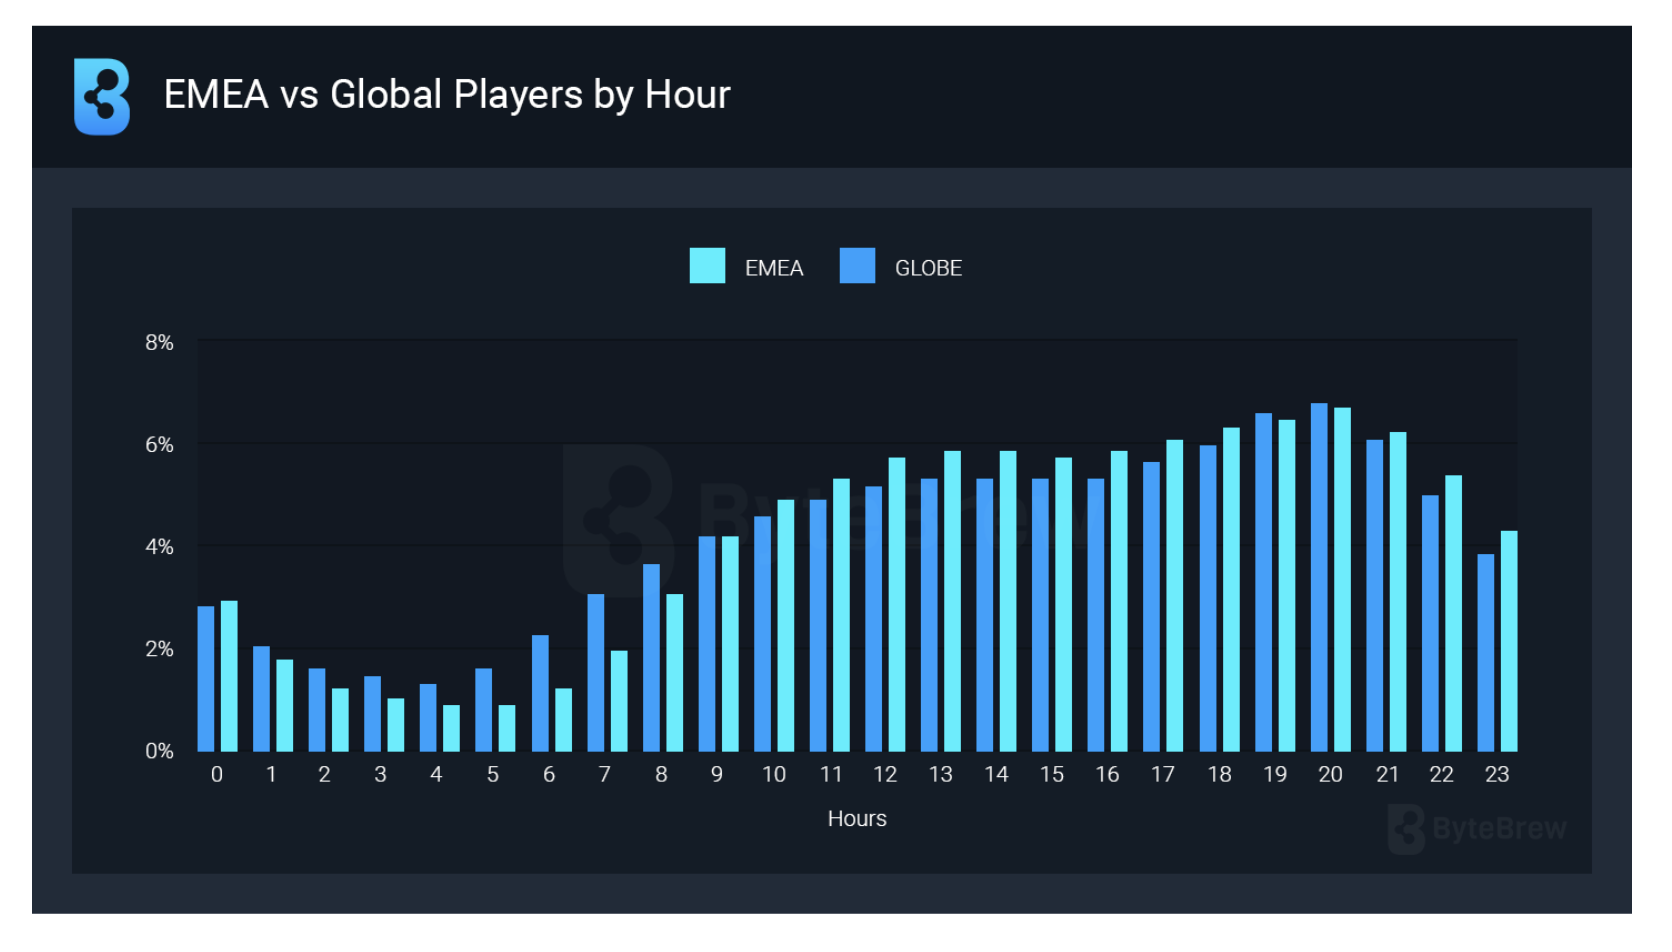
- From 4 AM to 7 AM, user activity in the EMEA region is 46% lower than global trends.
User Behavior in the Asia-Pacific Region
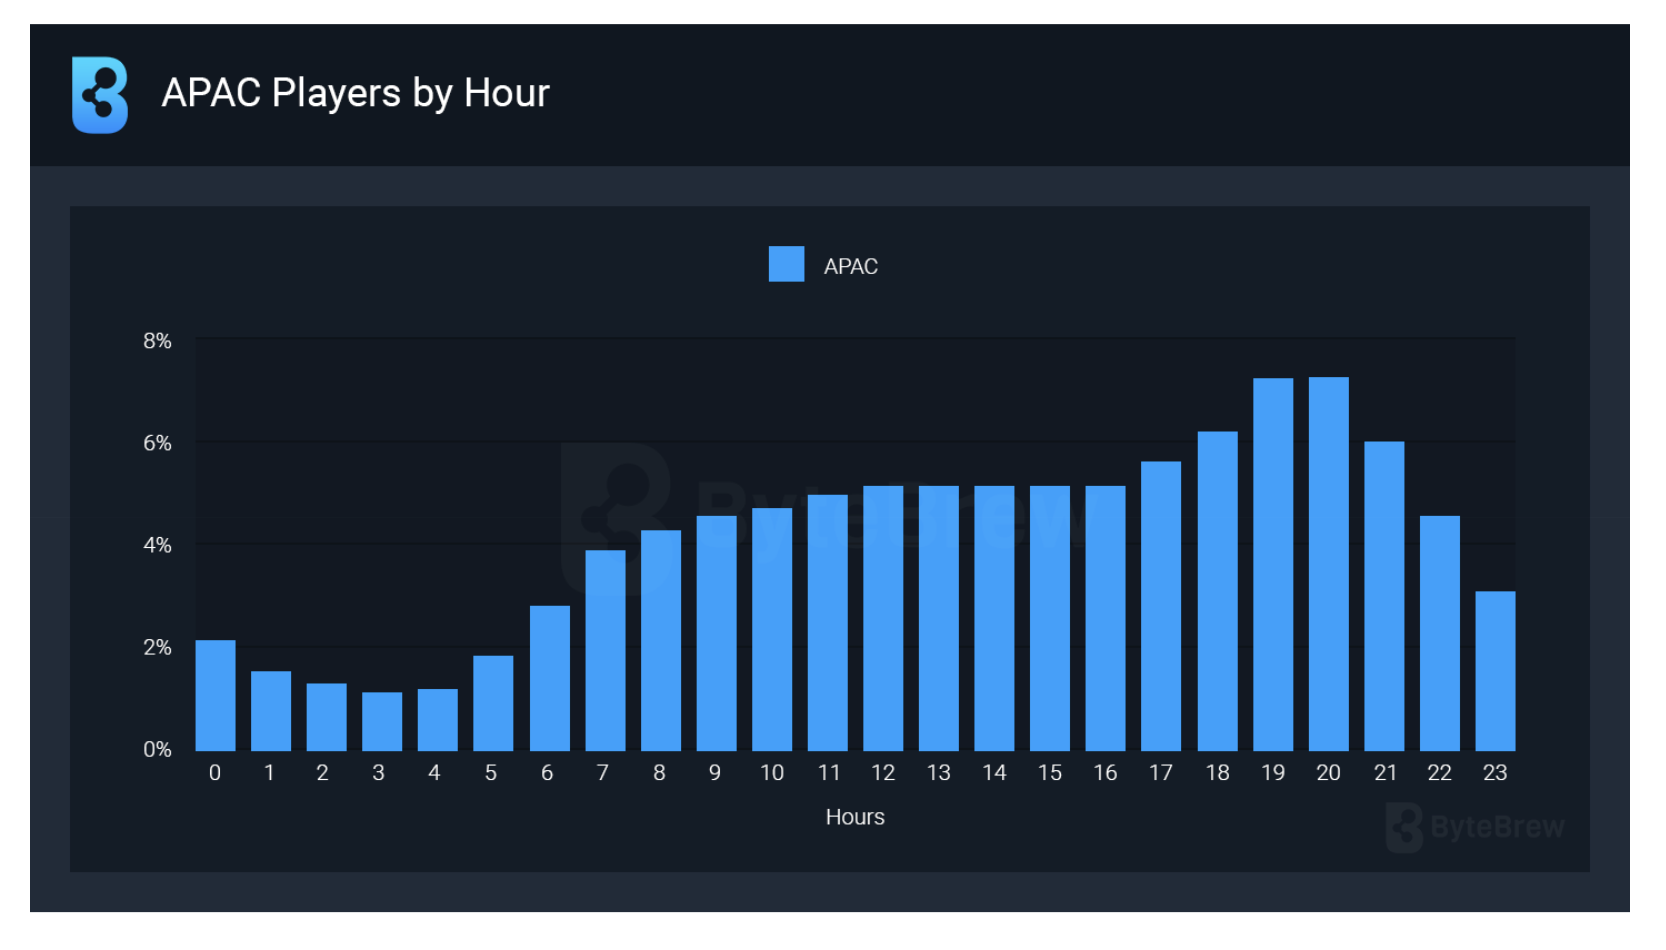
- The peak activity hour in the APAC region occurs earlier than in other regions, at 7 PM.
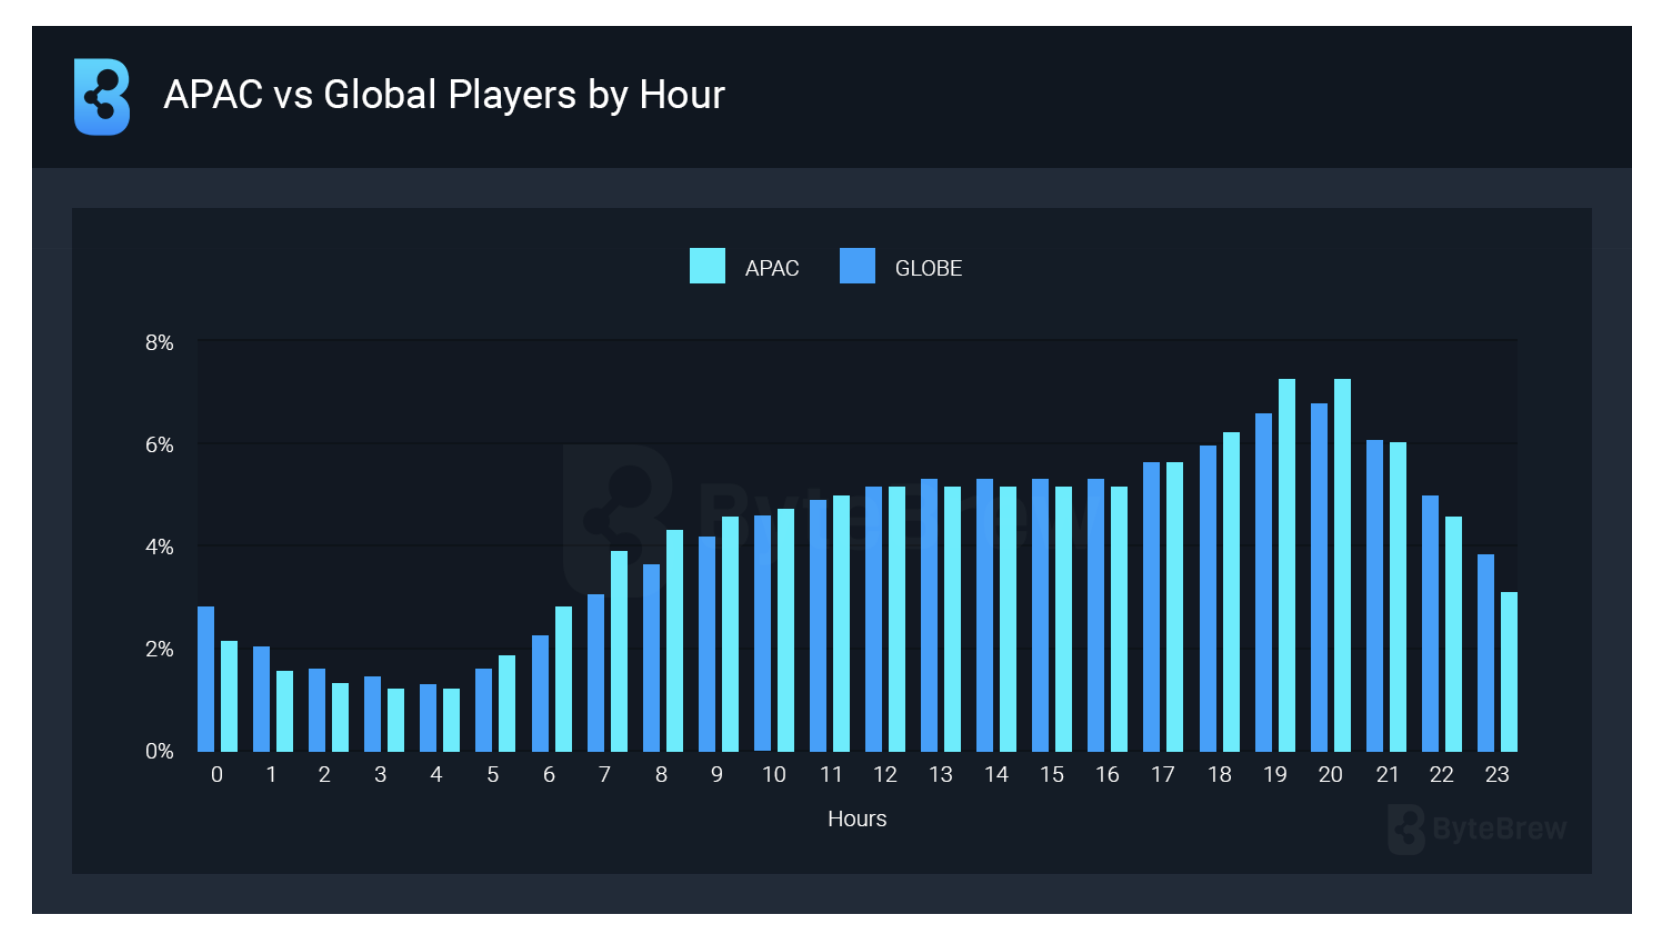
-
During peak hours, Asian users play 7.2% to 10% more than in other regions. They are also more active from 6 AM to 7 AM (by about 27%). This is offset by reduced activity during late-night hours (from midnight to 2 AM).
Newzoo & Carry1st: African Gaming Market is growing at 6 times faster rate compared to worldwide numbers
- According to the companies' research, the African market reached $1.8 billion in 2024, which is a 12.4% increase from the previous year. The average global growth rate is 2.1% YoY, meaning Africa's growth rate is 6 times larger.
- The total number of gamers in Africa reached 349 million in 2024. Most of them play on mobile devices (304 million). In 2024, this figure increased by 32 million, representing a 10% YoY growth in the audience.
- Mobile games account for about 90% of the region's total revenue, approximately $1.6 billion.
- Egypt ($368 million), Nigeria ($300 million), and South Africa ($278 million) are the largest markets in the region.
- Eritrea and Niger are the fastest-growing countries in terms of revenue in the region.
Unity: The Gaming Industry in 2025

Back from the GDC - and straight to the important reports!
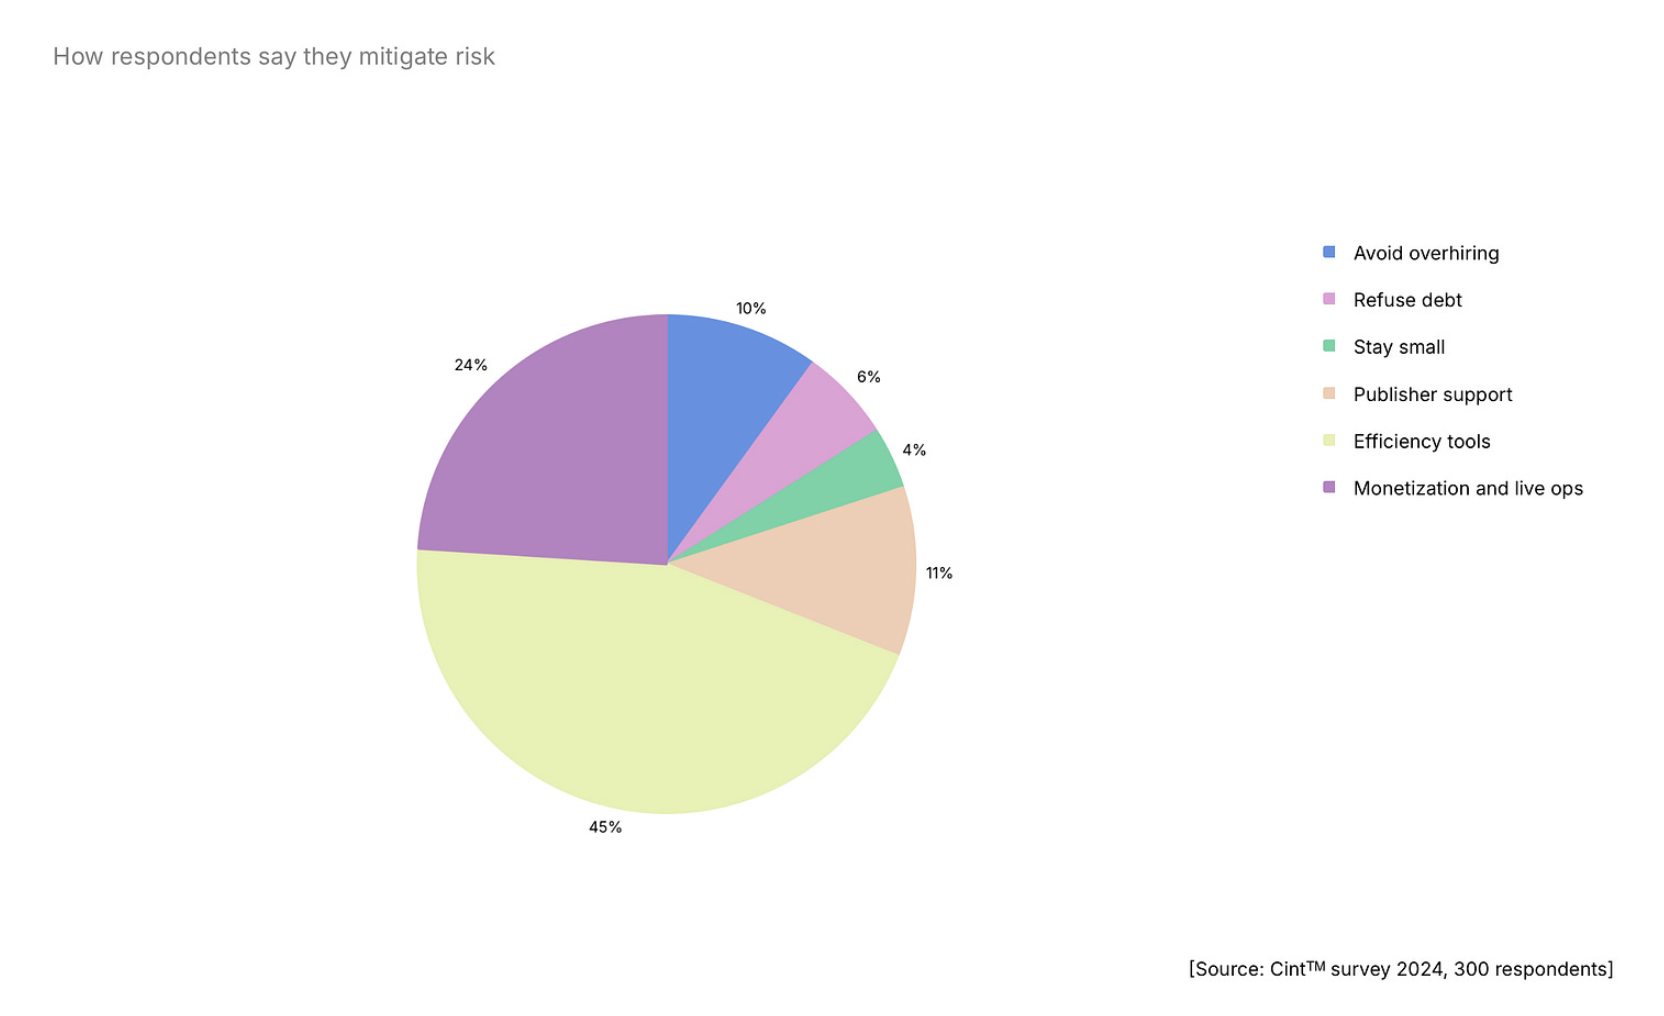
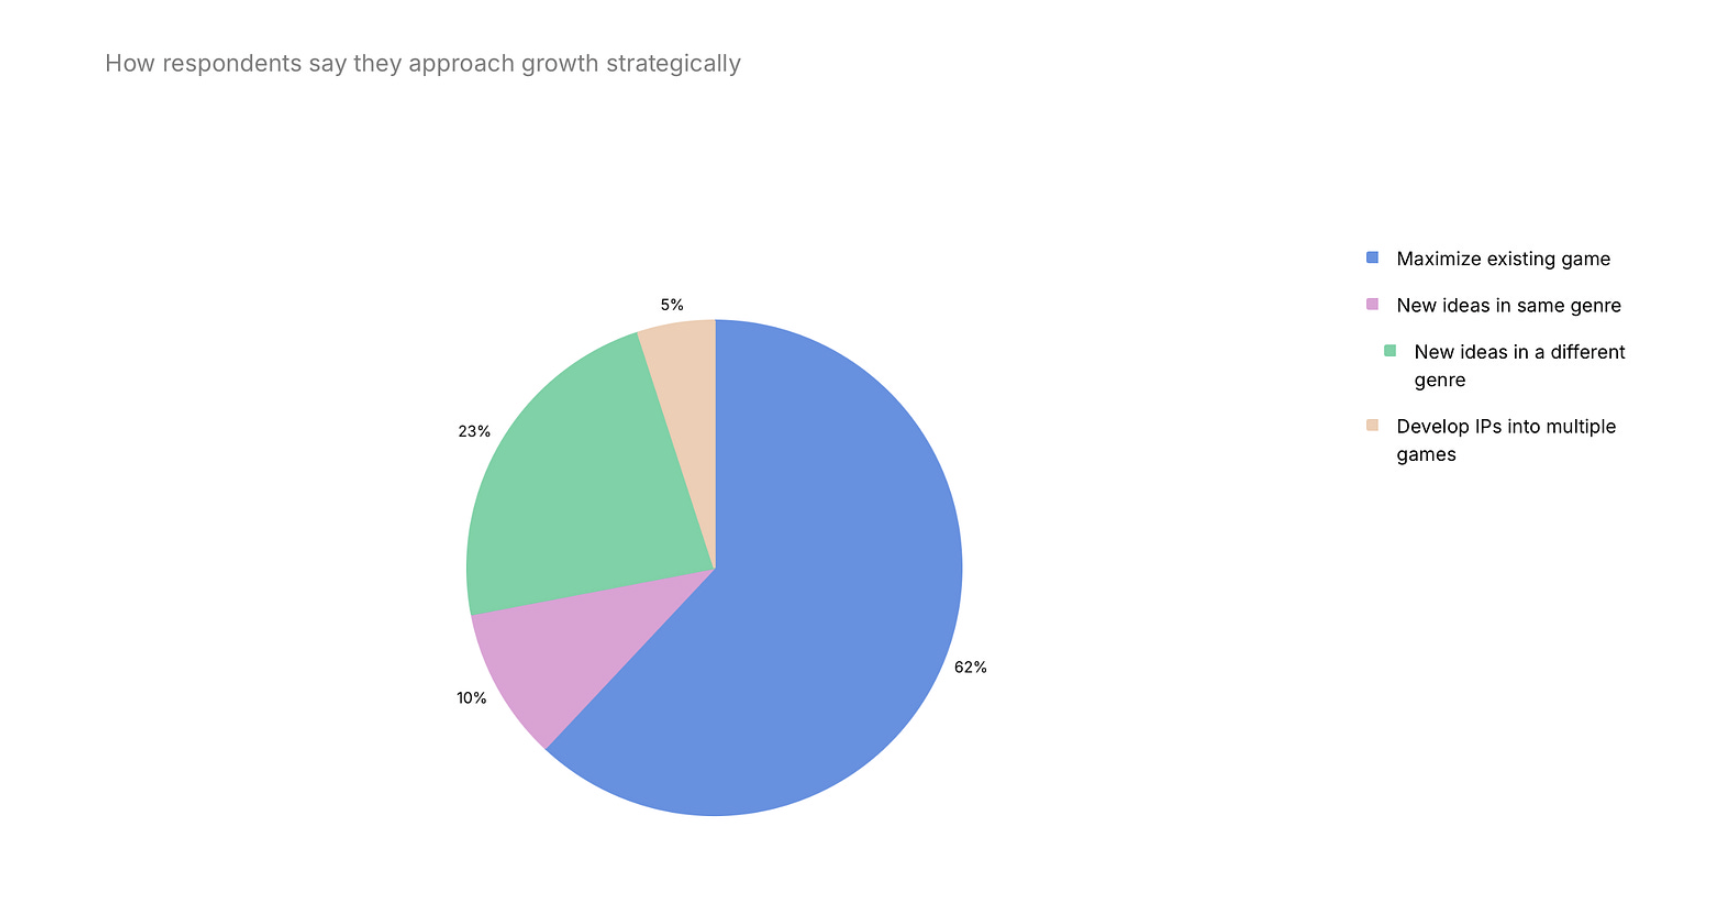
Trend 1: Developers are Reducing Expenses—and Risks
-
45% of developers are trying to use tools more efficiently (and use tools to increase efficiency). 24% note that they focus more on achieving results through operations and additional monetization.
- The majority of developers—62%—prefer to develop existing projects. 23% plan to move into new genres; 10% plan to make games in the same genre, and 5% want to build their own IP.
- The request for what should change in the industry is diverse. There are calls for more advanced end-to-end technology stacks (55%), better tools (51%), and larger audiences (44%).
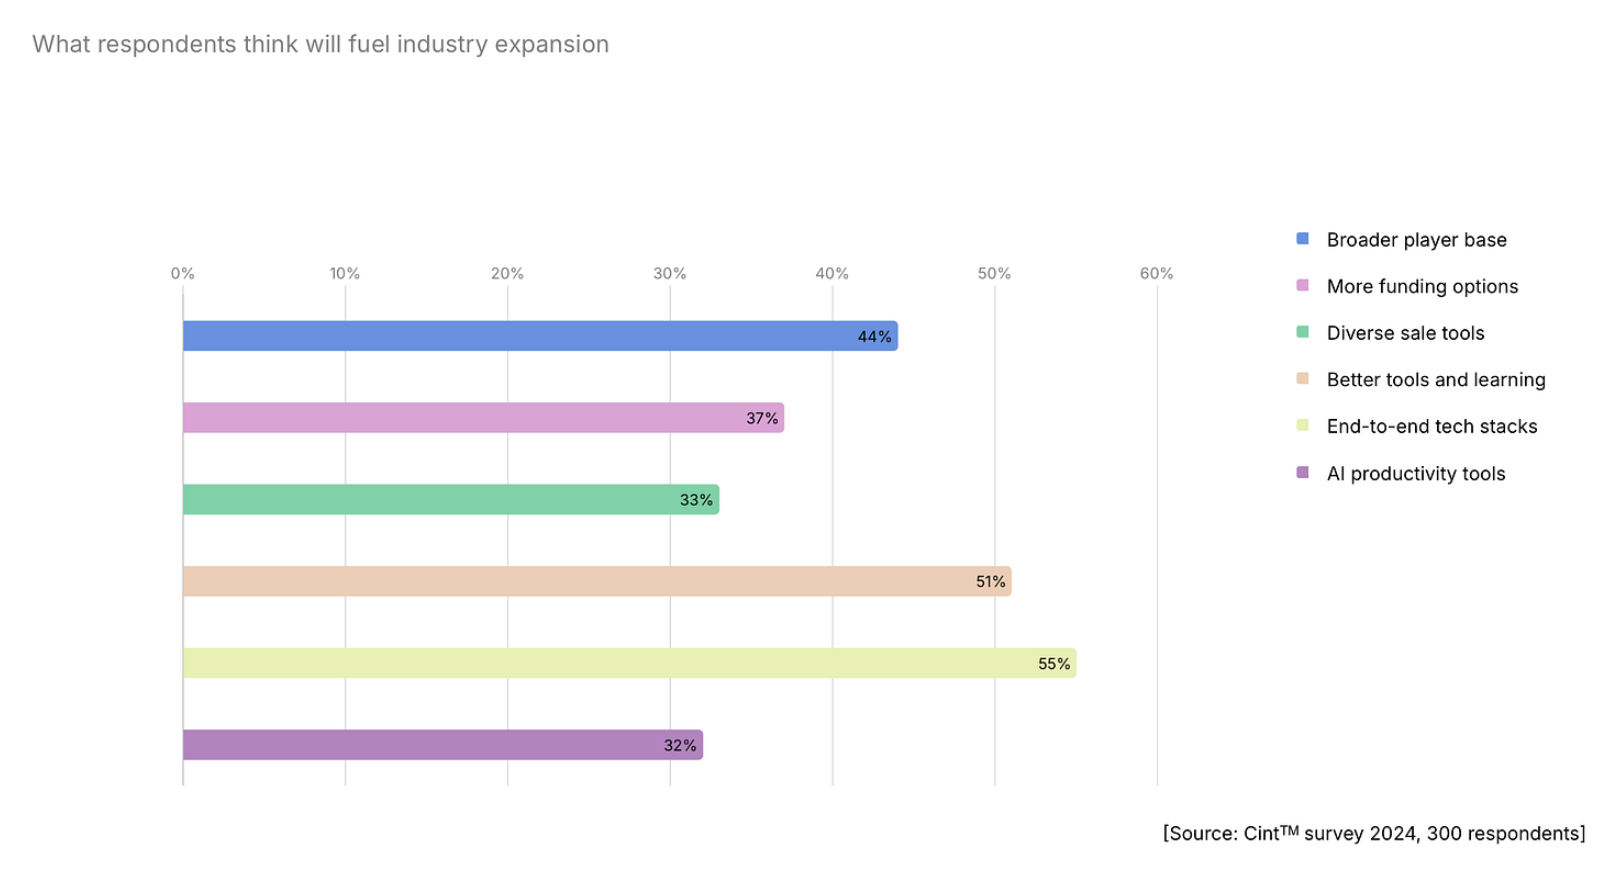
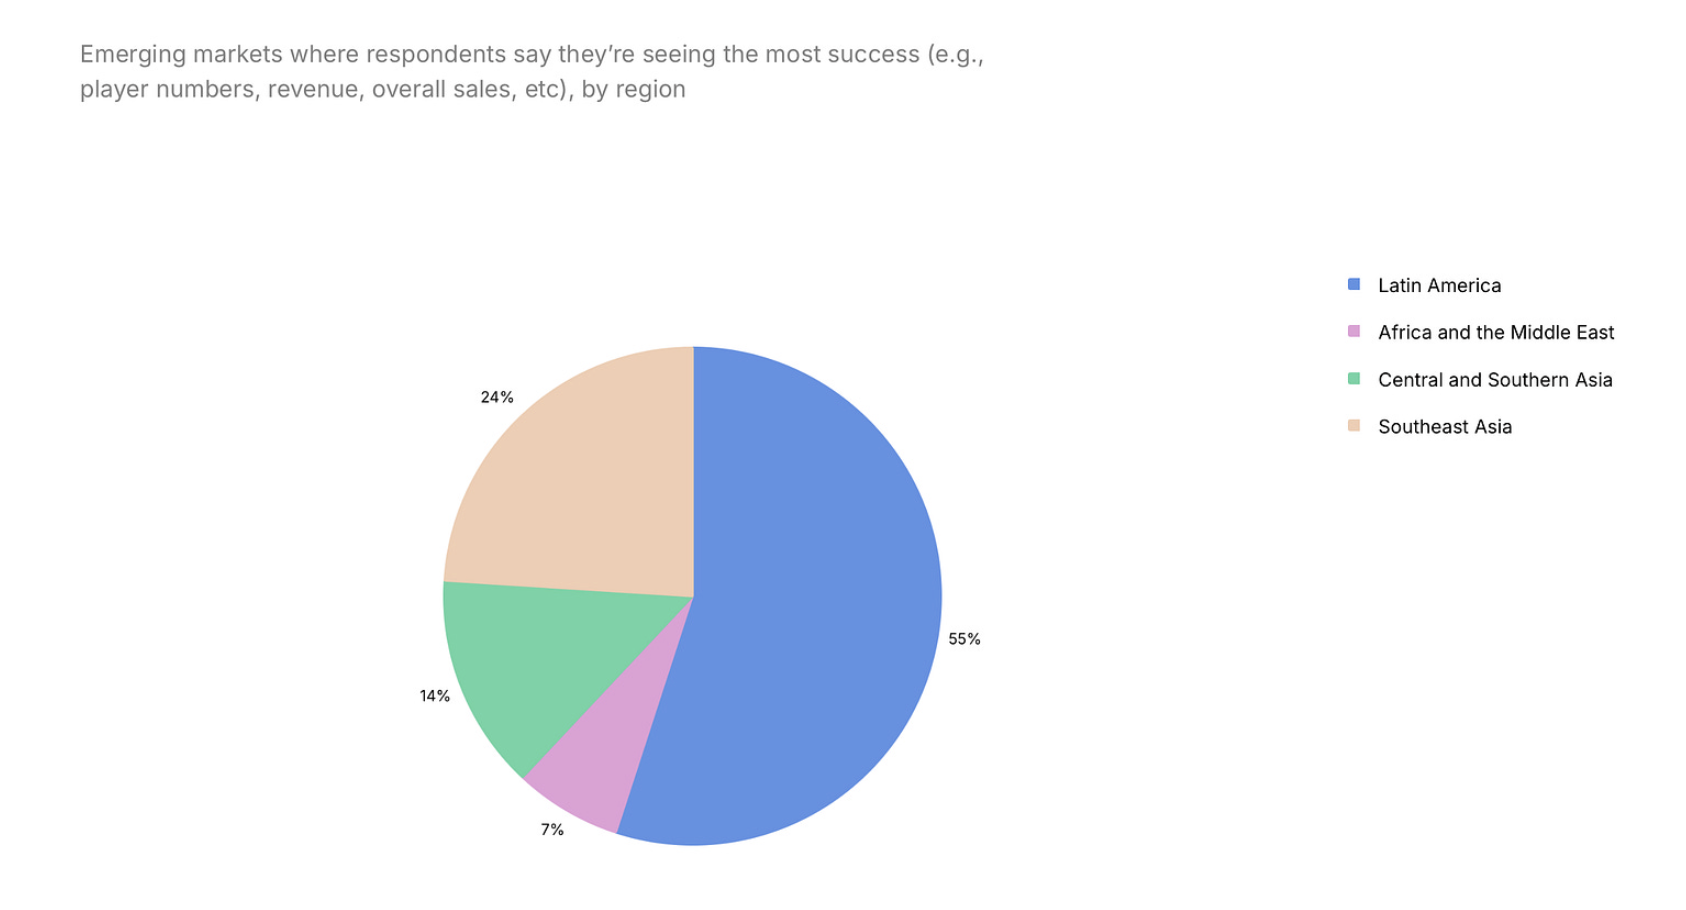
- Emerging markets where surveyed developers see the greatest growth are Latin America (55%) and Southeast Asia (24%).
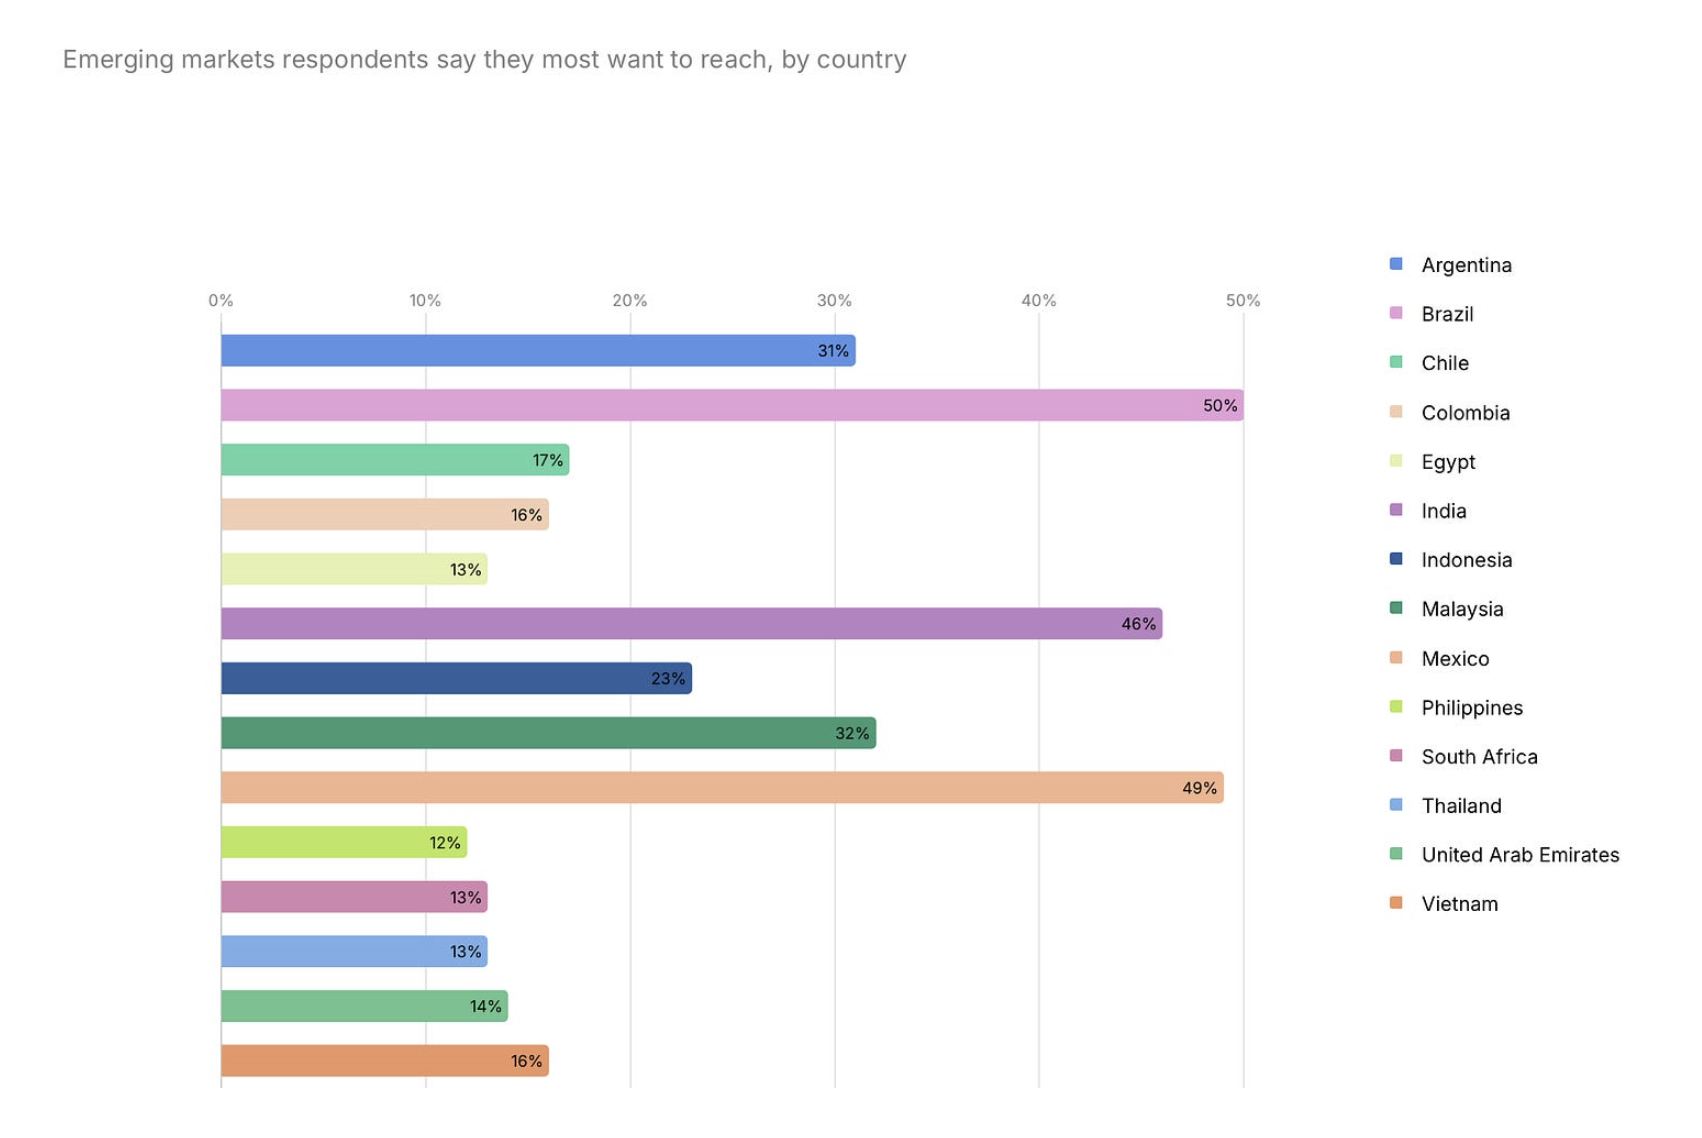
- Brazil, Mexico, India are leaders in the list of most interesting countries for developers.
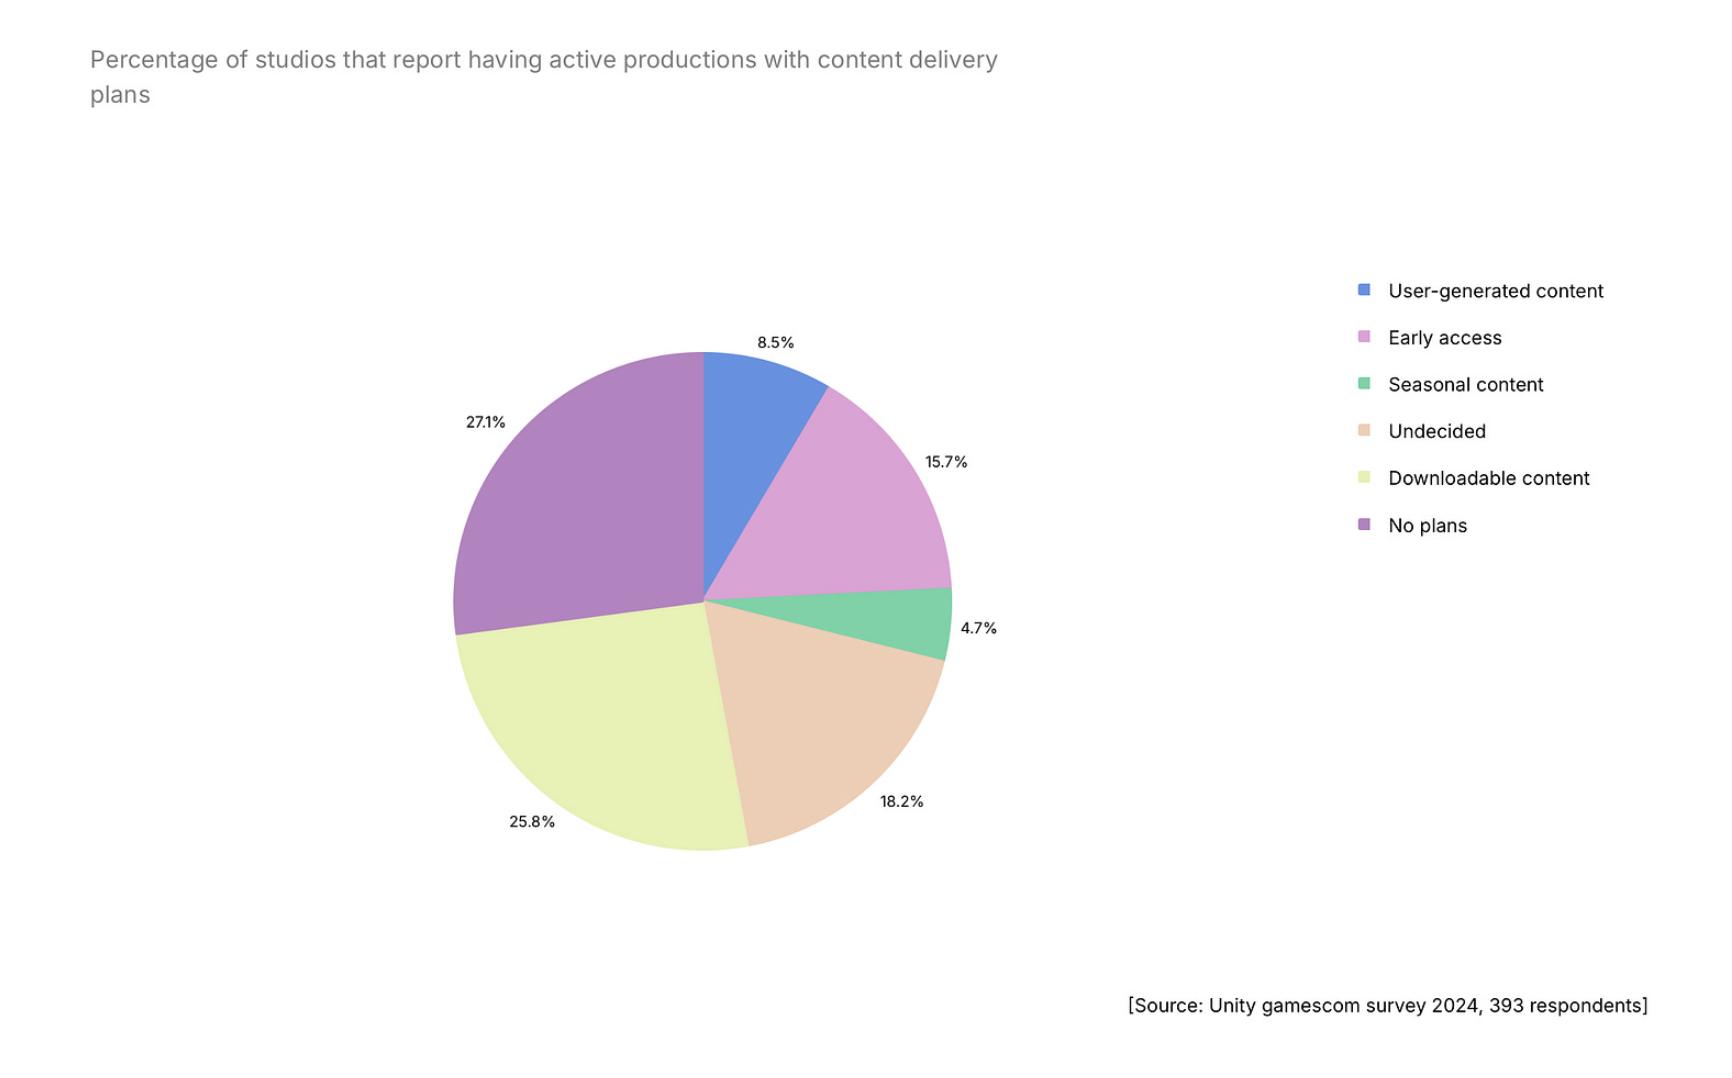
- 55% of developers plan to support their projects with content after release. 27% do not plan to do this (likely premium games developers), and 18% are still unsure, as it depends on the project's success.
Trend 2: Studios are experimenting with multiplayer gaming experiences
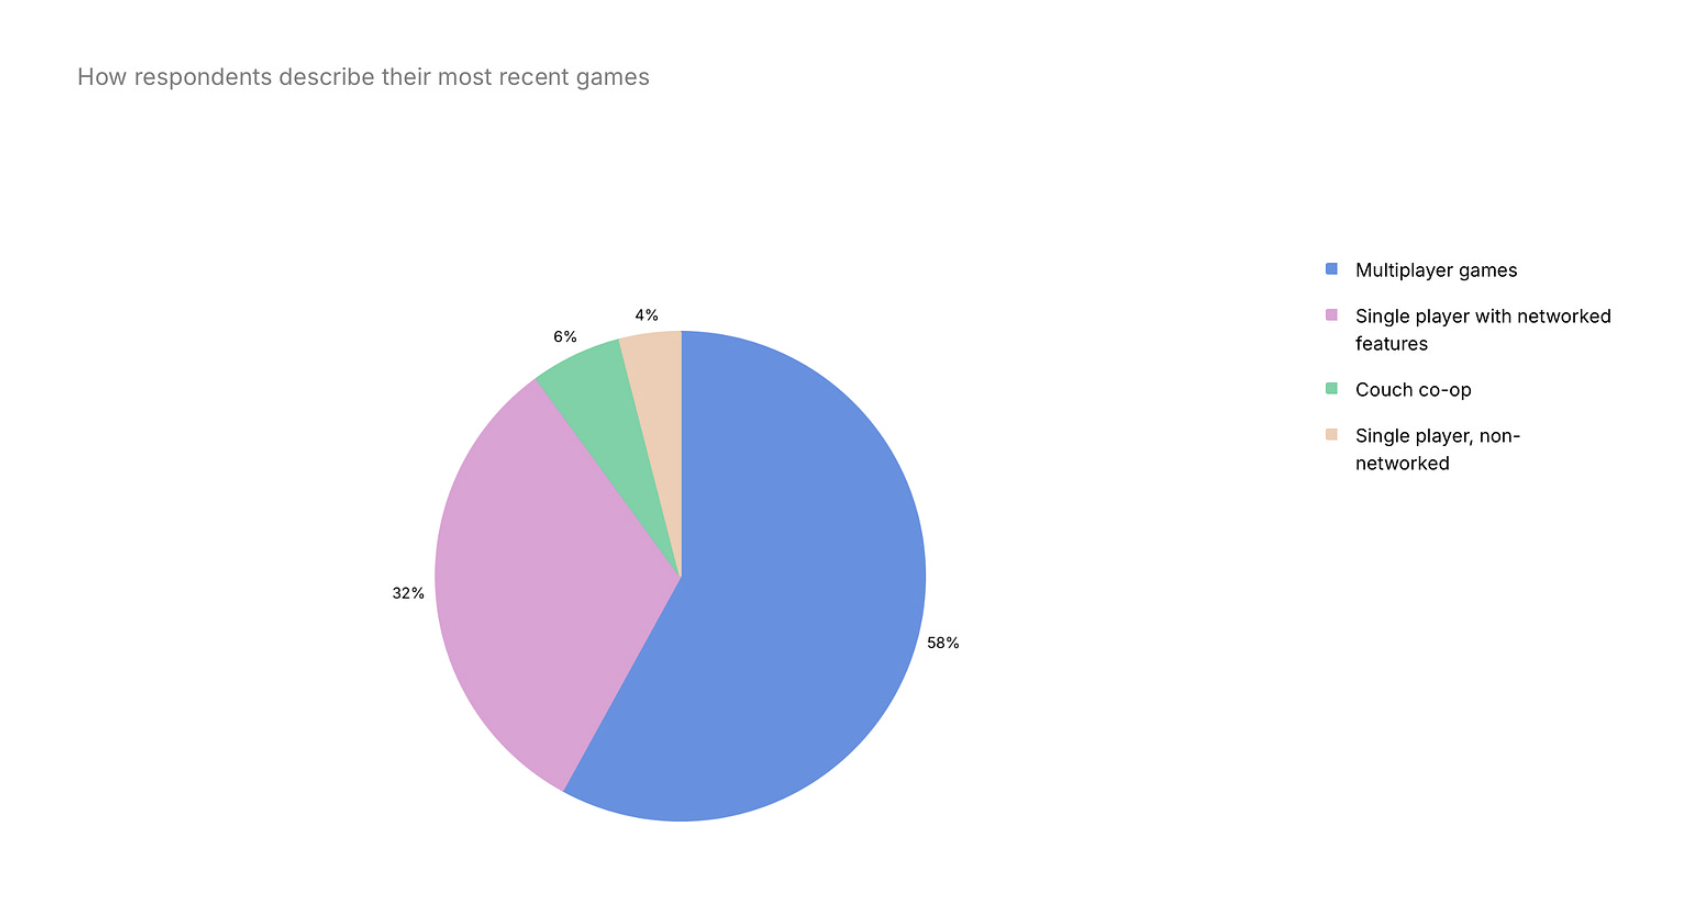
- 58% of developers are working on projects with full multiplayer capabilities. 32% are making single-player games with network functionality. 6% are working on cooperative projects that allow play on a single screen. Only 4% of developers do not see multiplayer in any form in their projects.
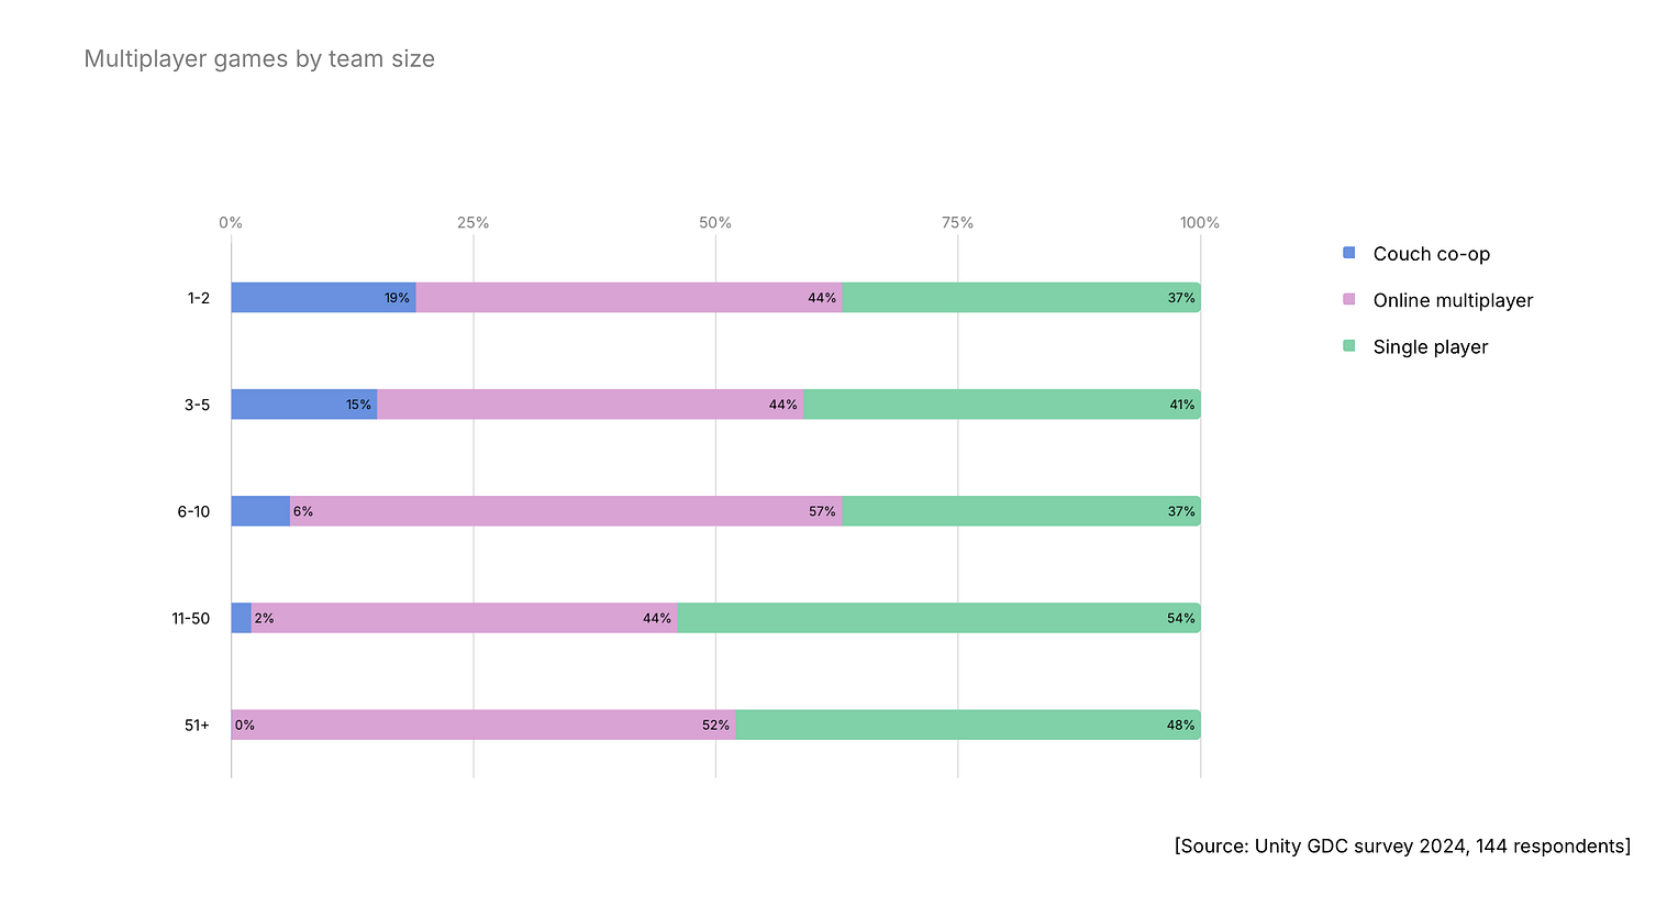
- Multiplayer projects are being made by teams of all sizes. 20% of teams with 1-2 people include multiplayer functionality in their games.
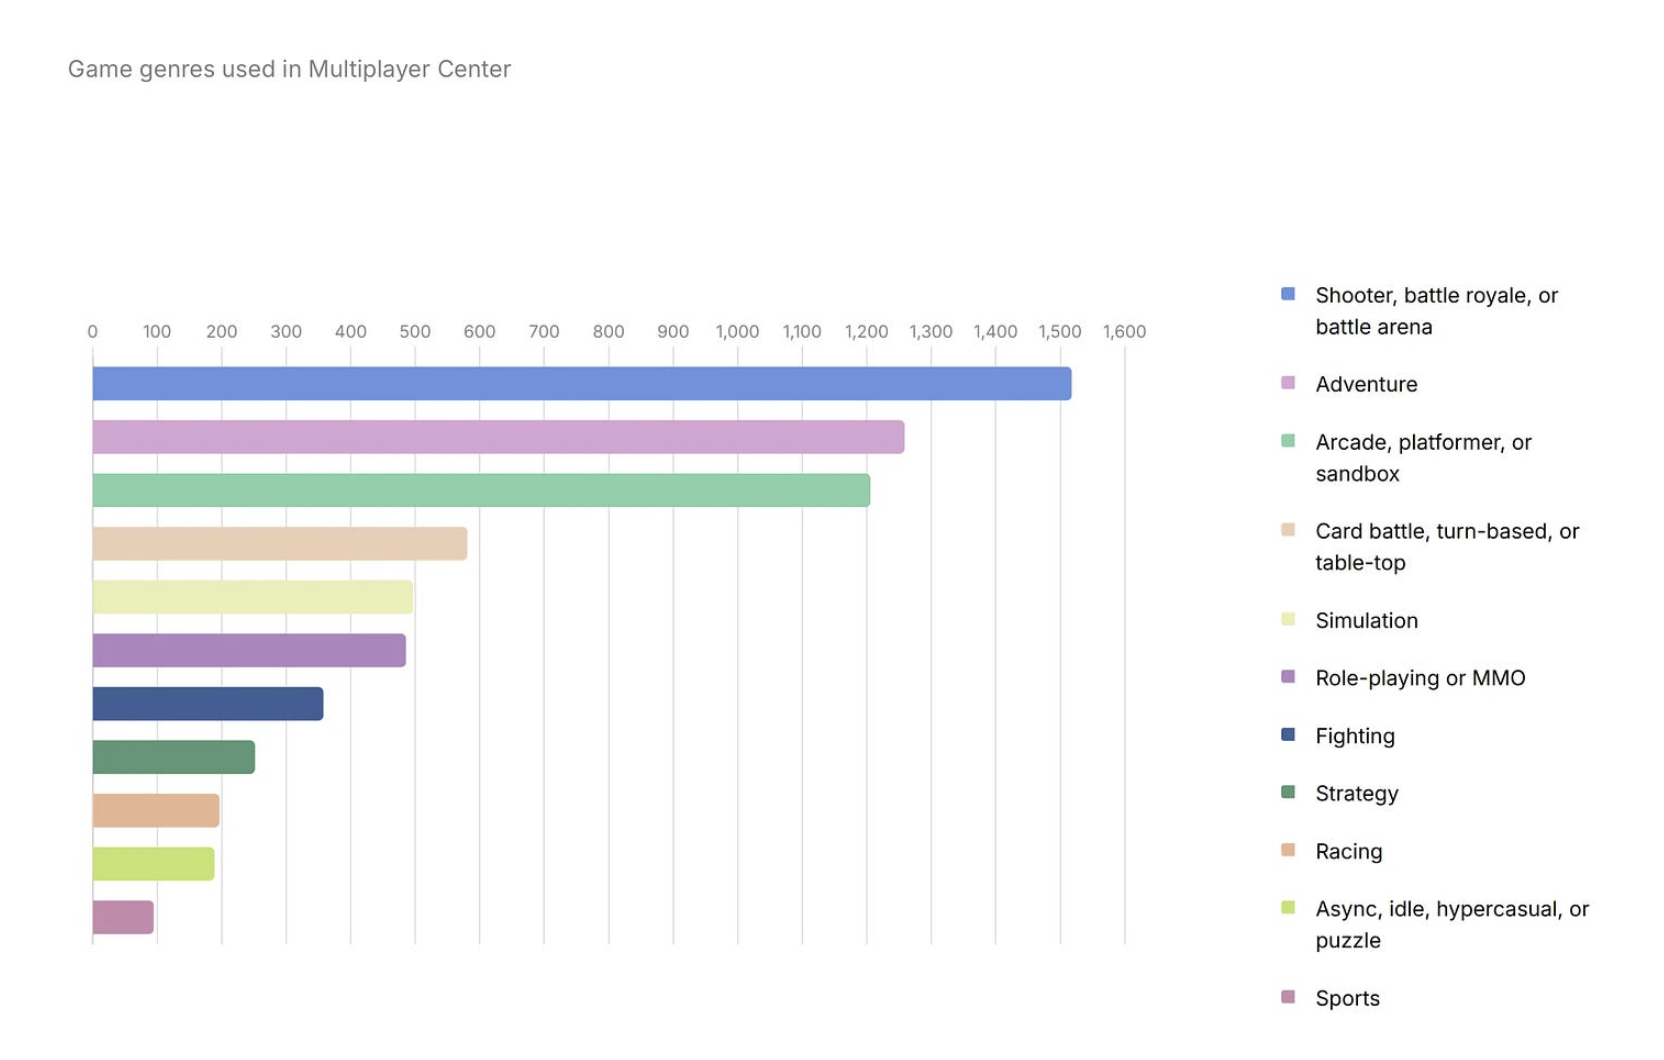
- Unity highlights the genre diversity of multiplayer projects. There are more multiplayer shooters or adventure games, but this is due to the overall number of games in these genres.
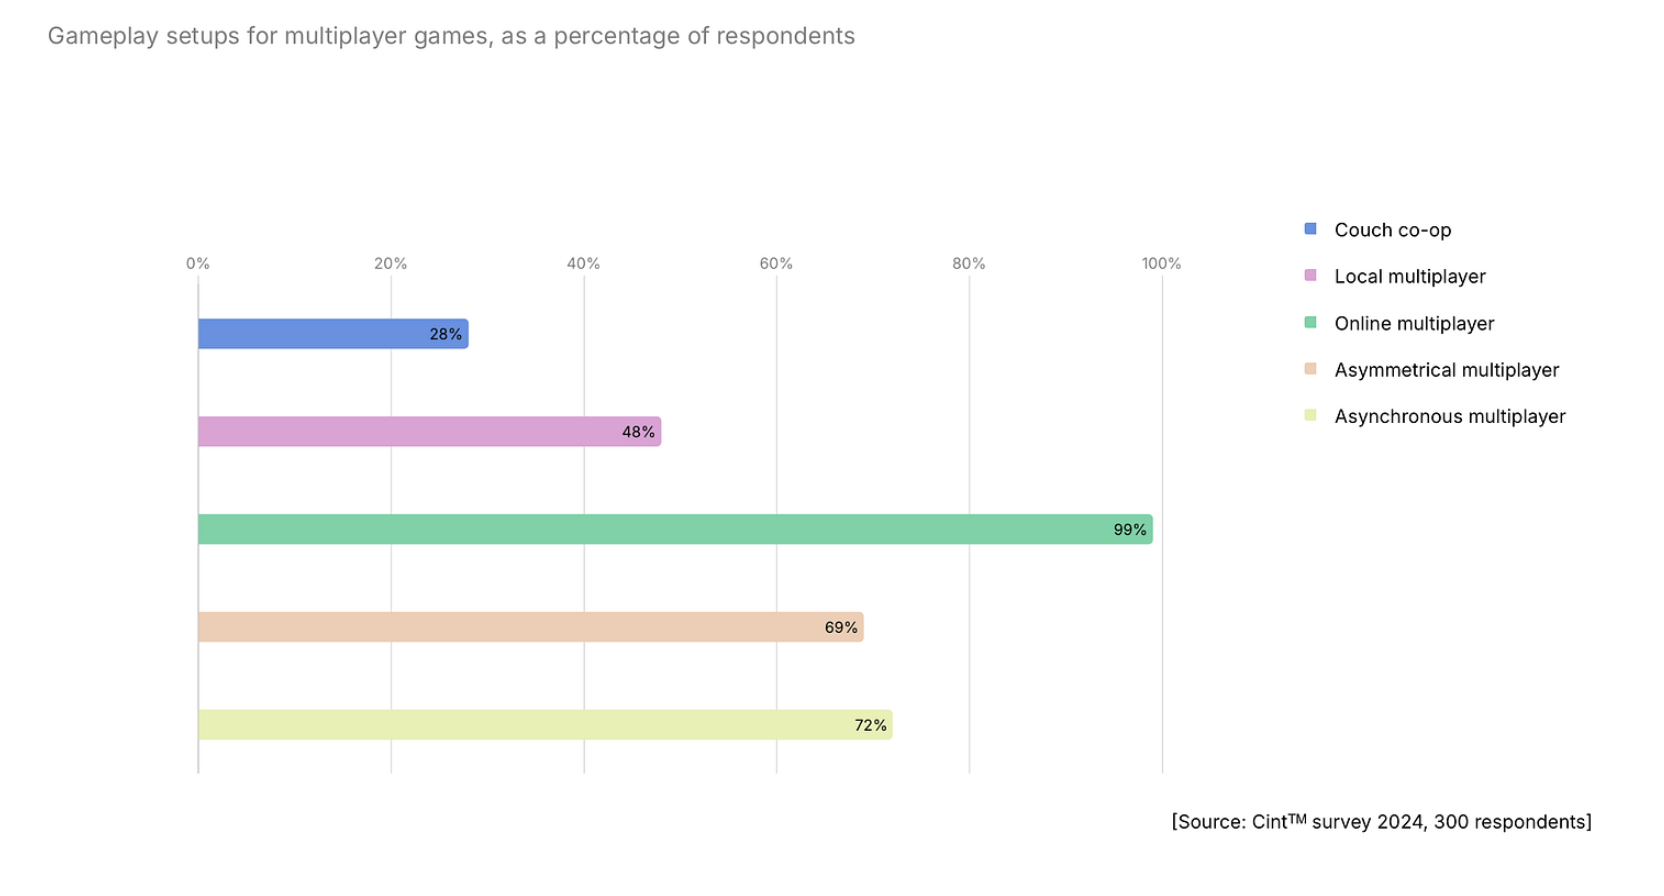
-
Studios are experimenting with multiplayer formats. 69% of teams offer asymmetric multiplayer in their projects.
- 47% of the multiplayer experiences created by developers are competitive. Multiplayer today is about both shared experiences and socialization.
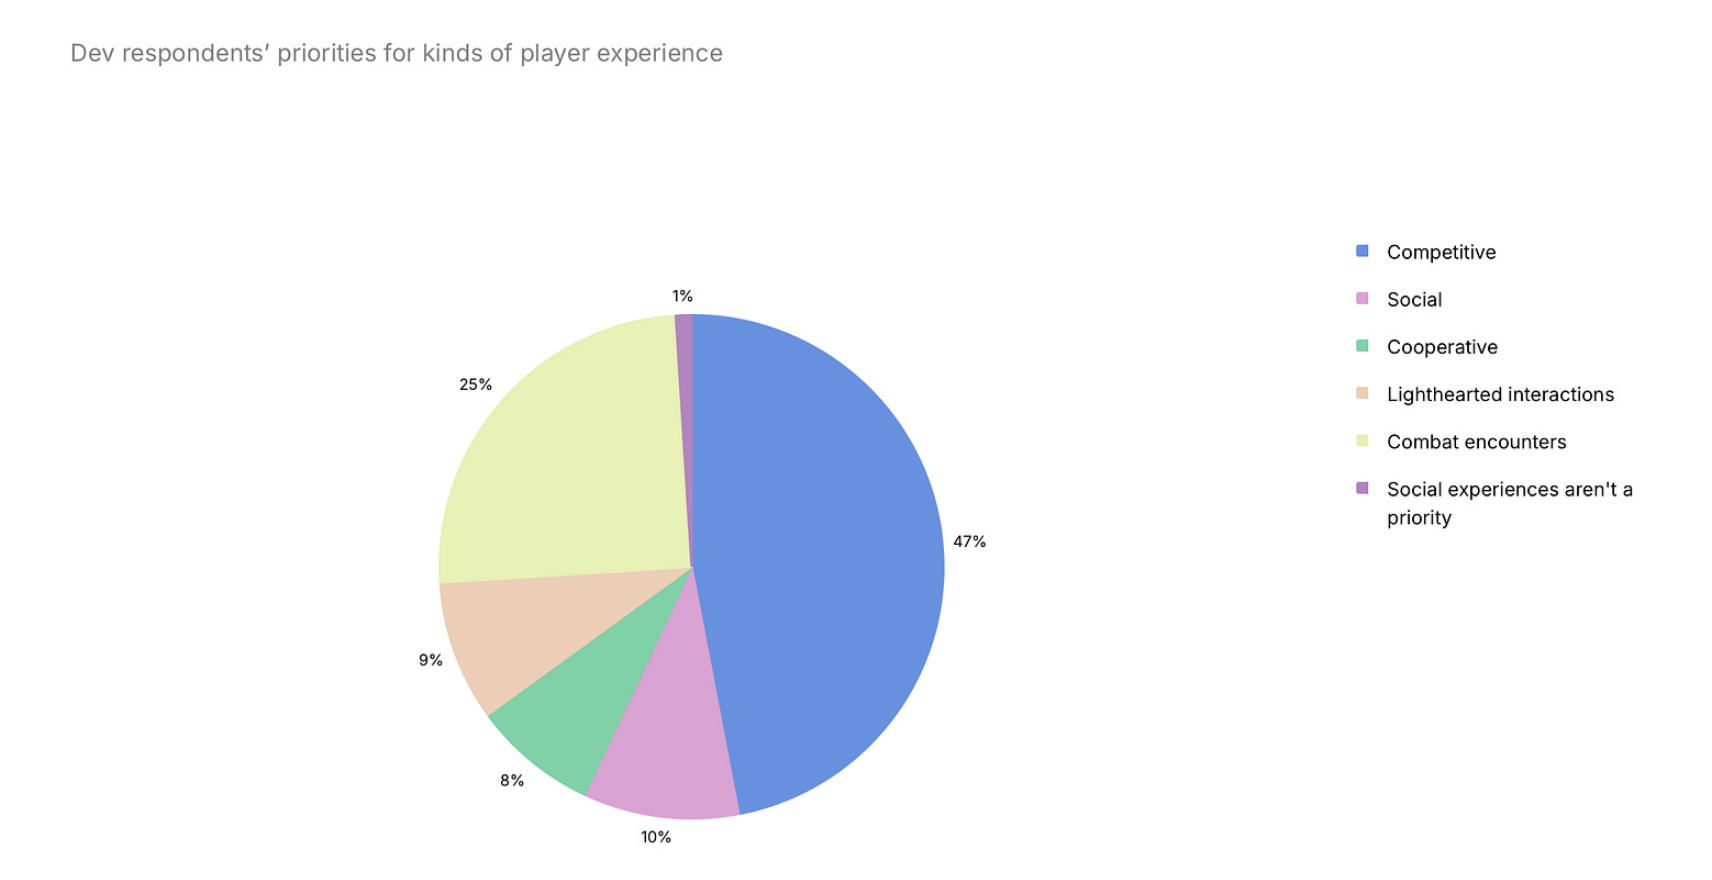
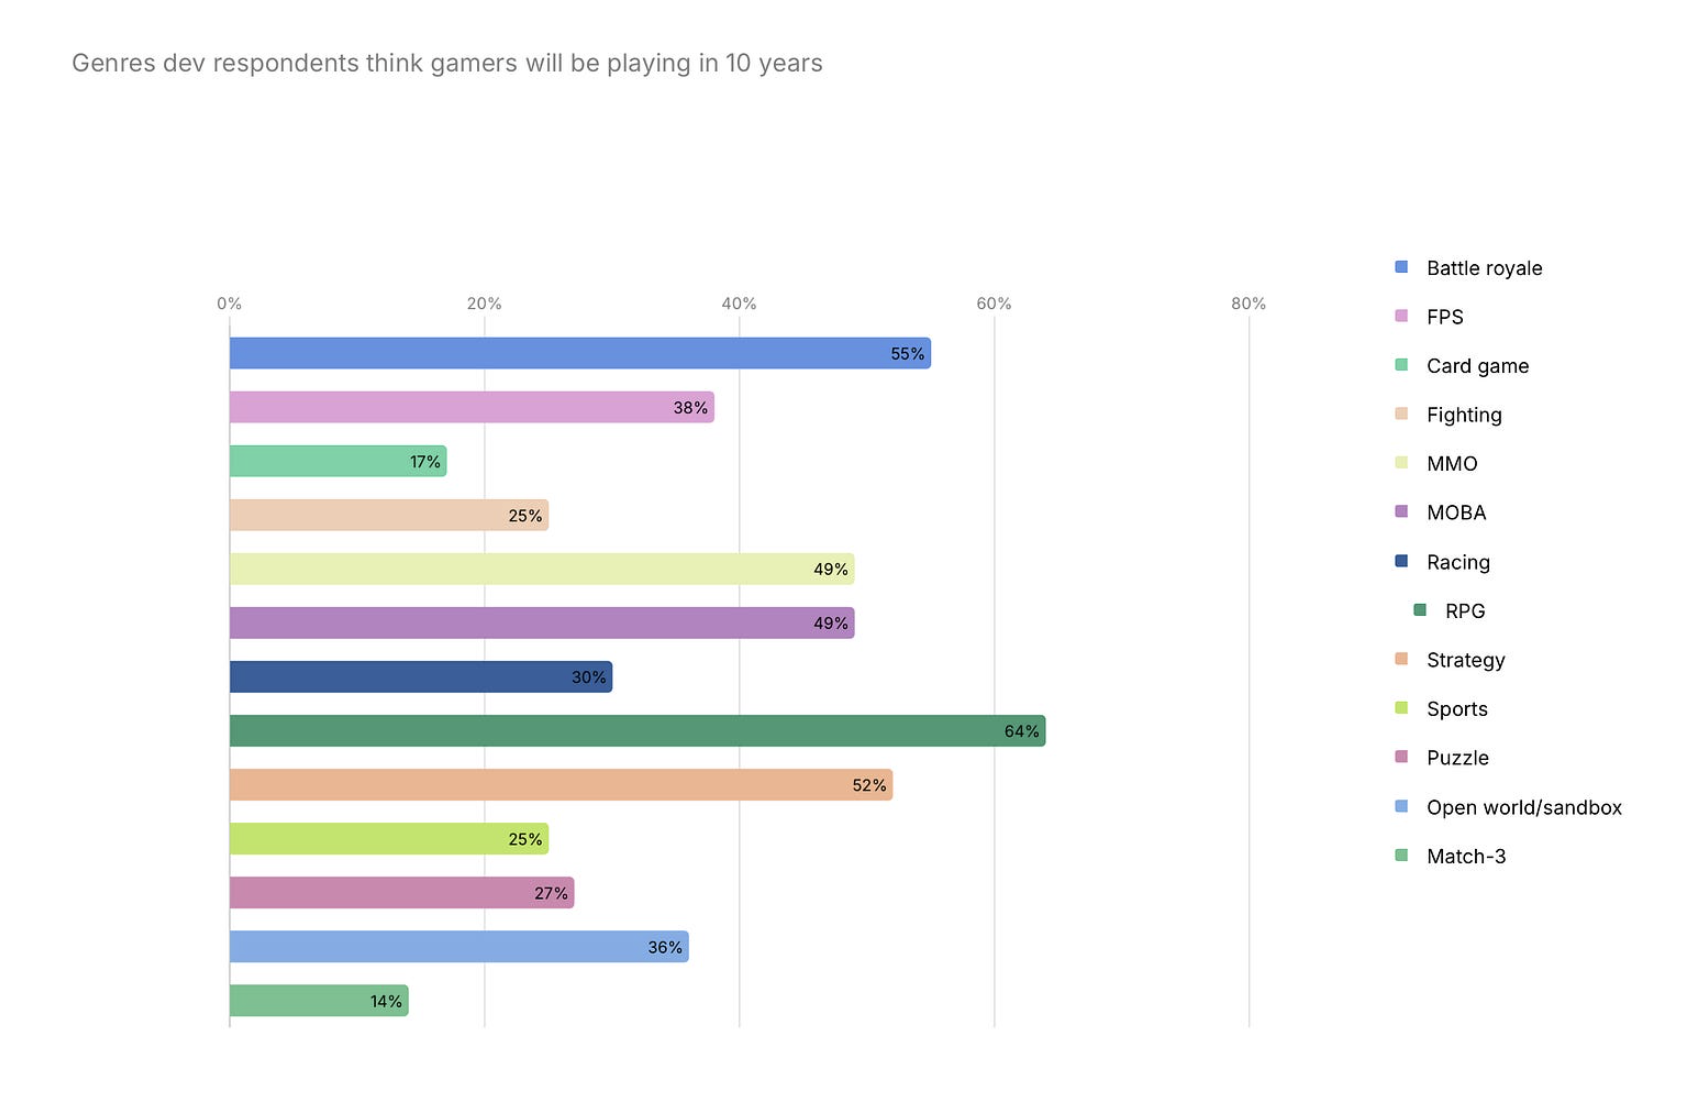
- Developers believe that in 10 years, users will be playing RPGs, strategies, MMOs, MOBAs, and shooters.
Trend 3: Studios continue to work with proven platforms
-
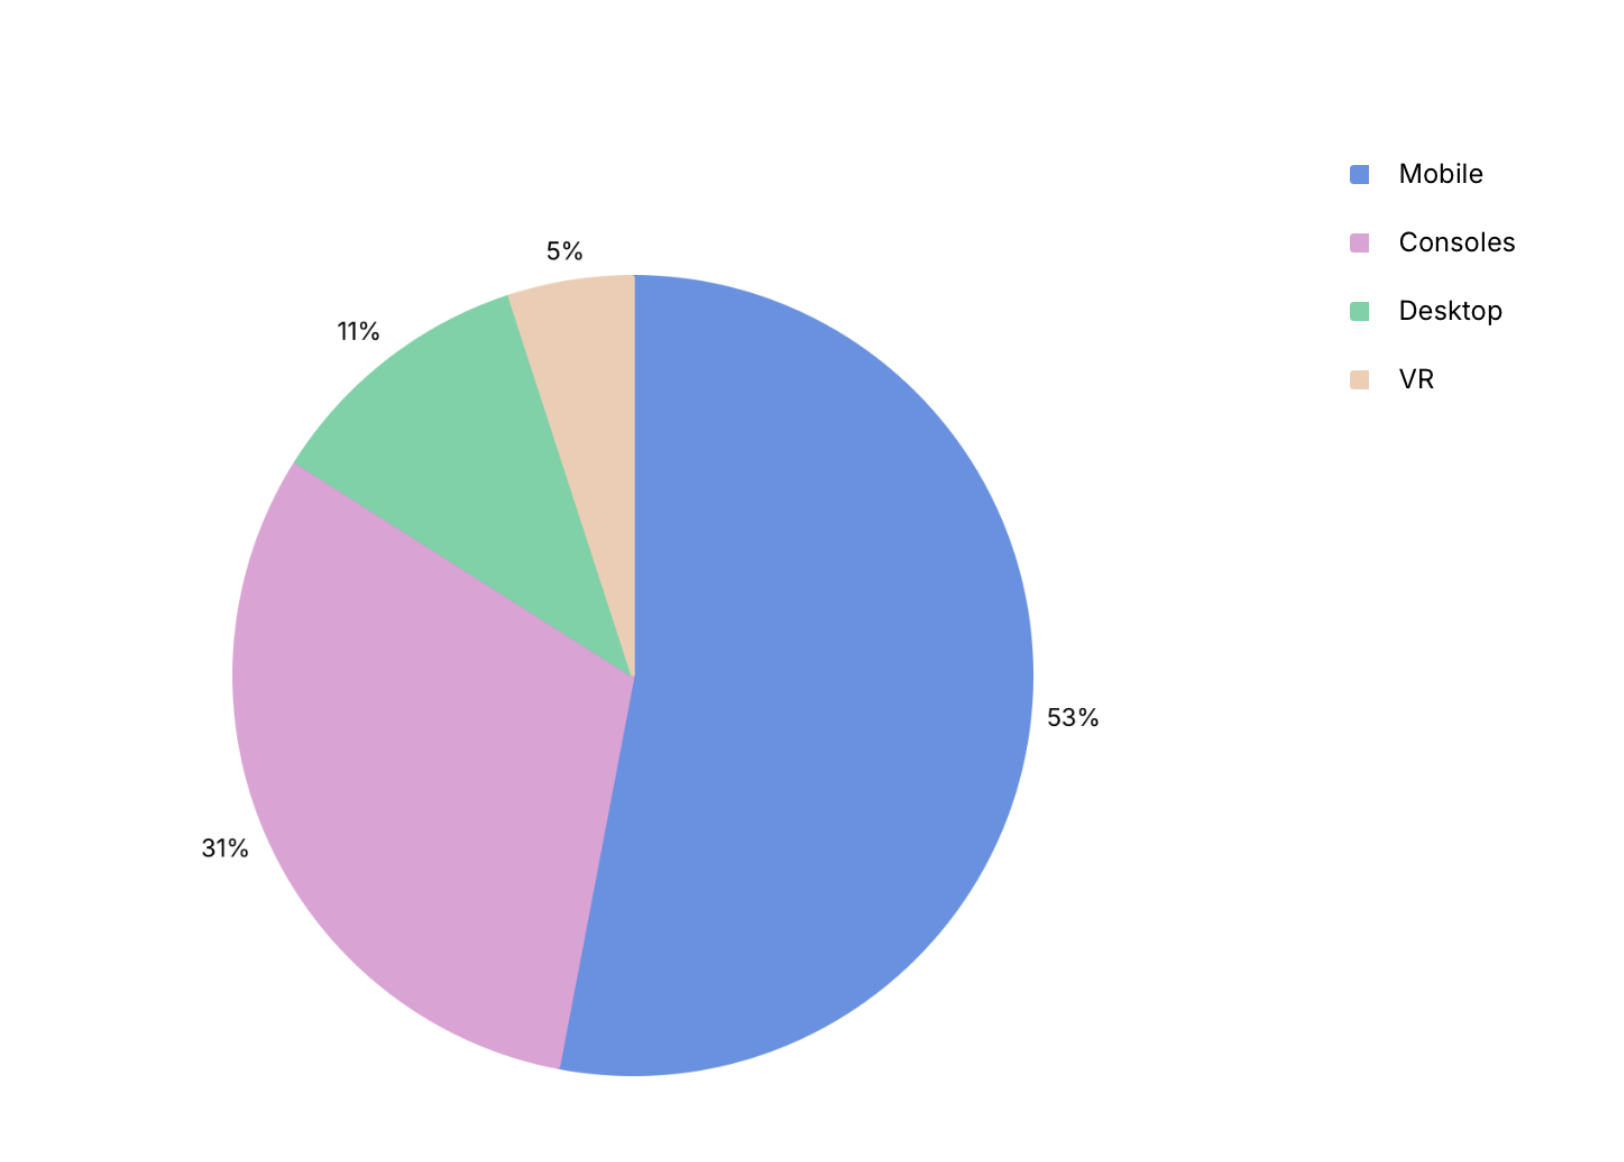
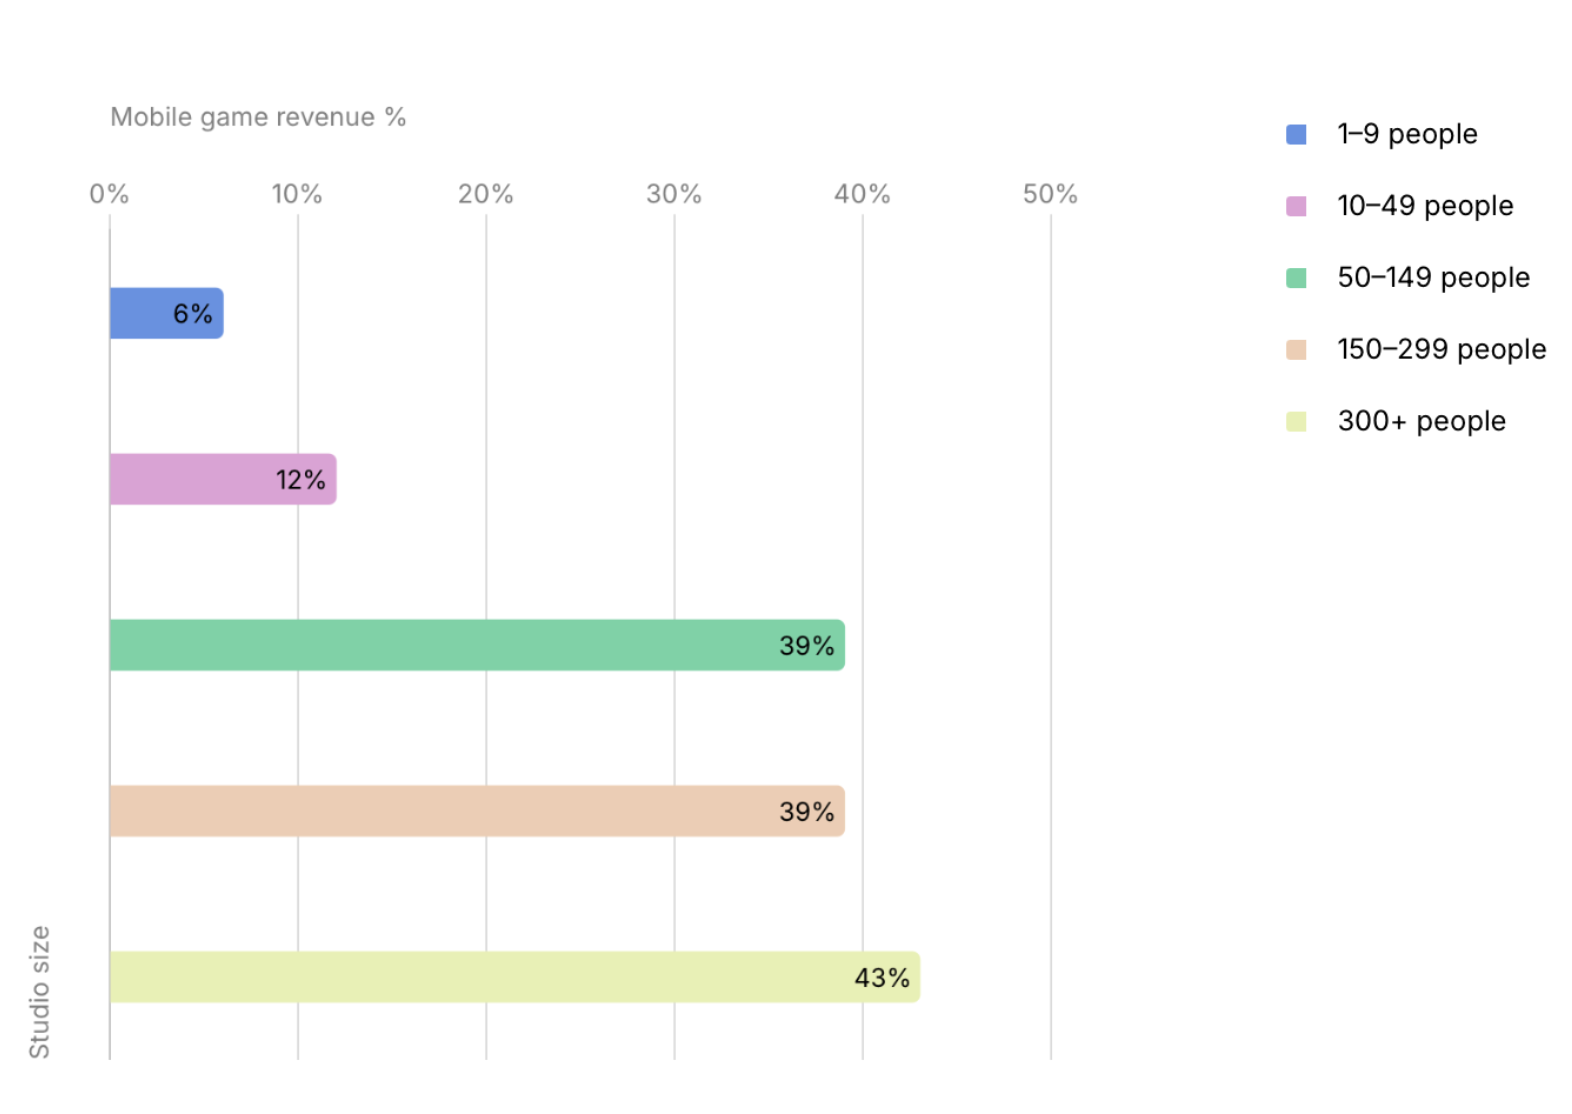
Mobile devices and PCs are the most popular platforms for developers regardless of studio size. Console releases, however, depend directly on the size of the studio. 84% of large companies release games on consoles, while only 19% of studios with fewer than 10 employees do.
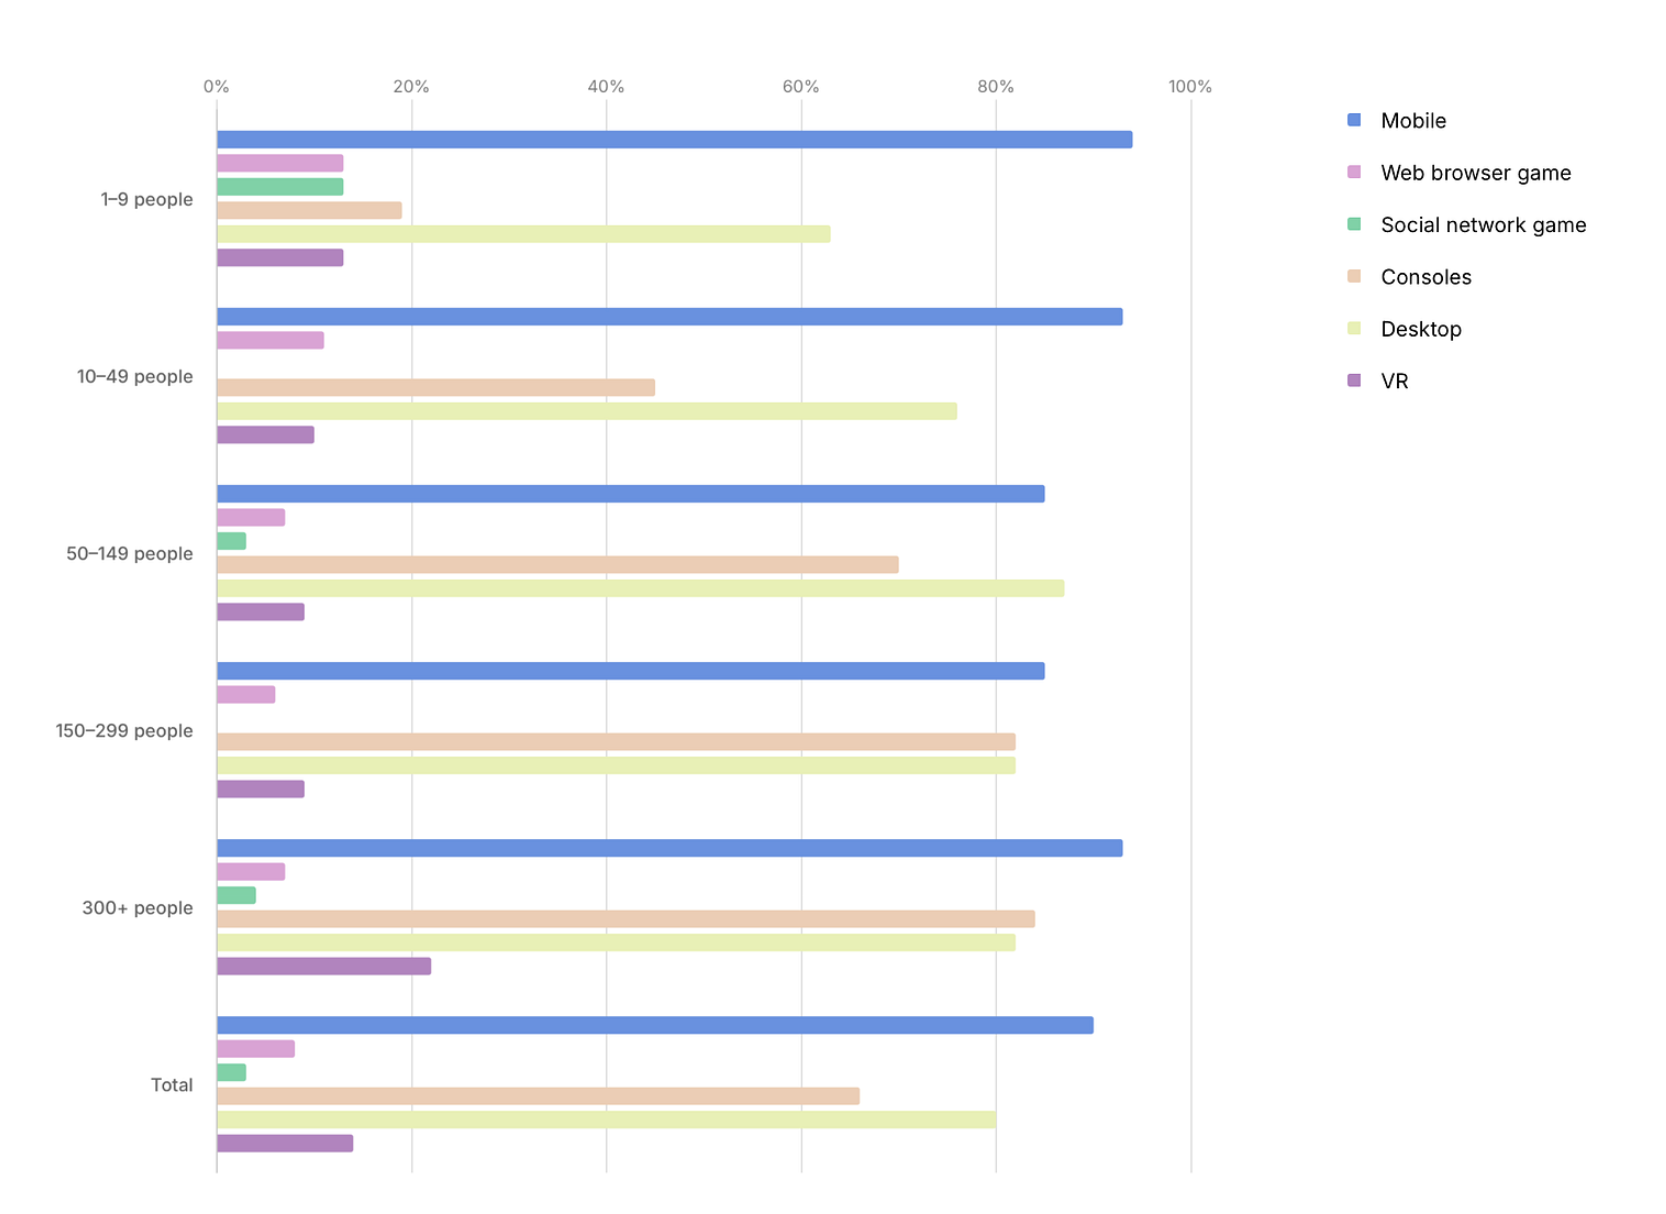
- Developers believe that most of the money (84%) is on mobile devices and consoles.
- Mobile revenue often accounts for the largest share among small studios.
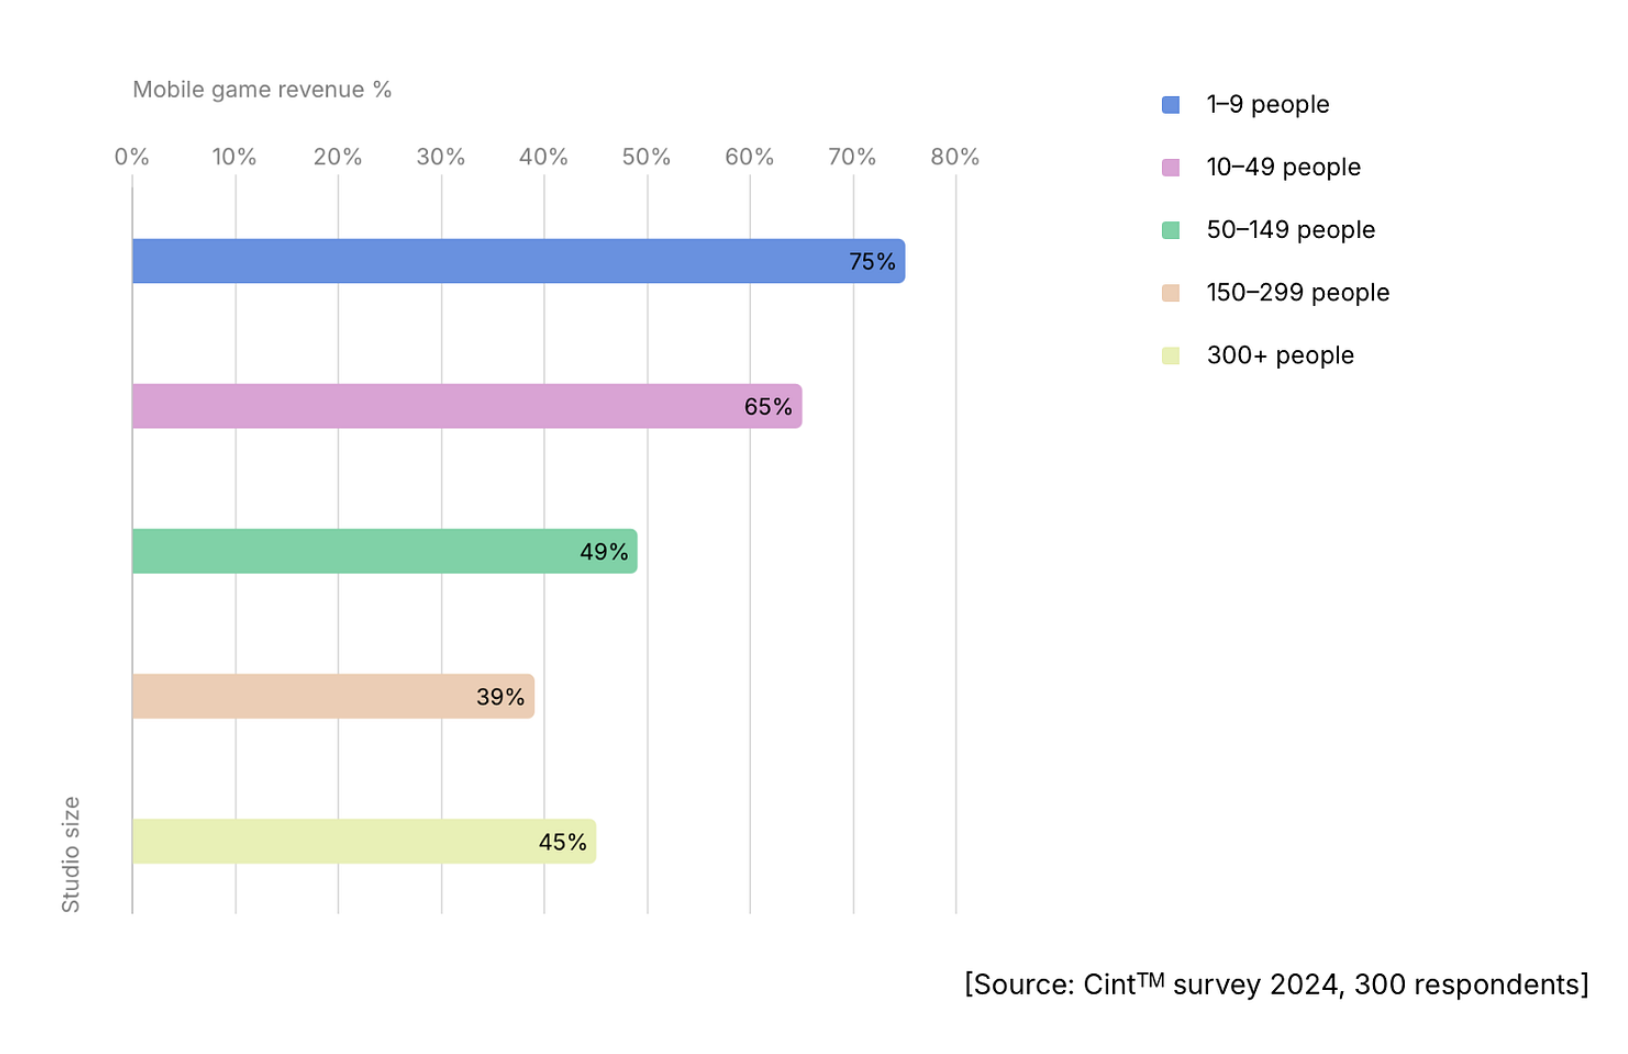
- The situation with console revenue is the opposite. The larger the studio, the more frequently console revenue has the largest share.
❗️Picture has a mistake - it is about console revenue.
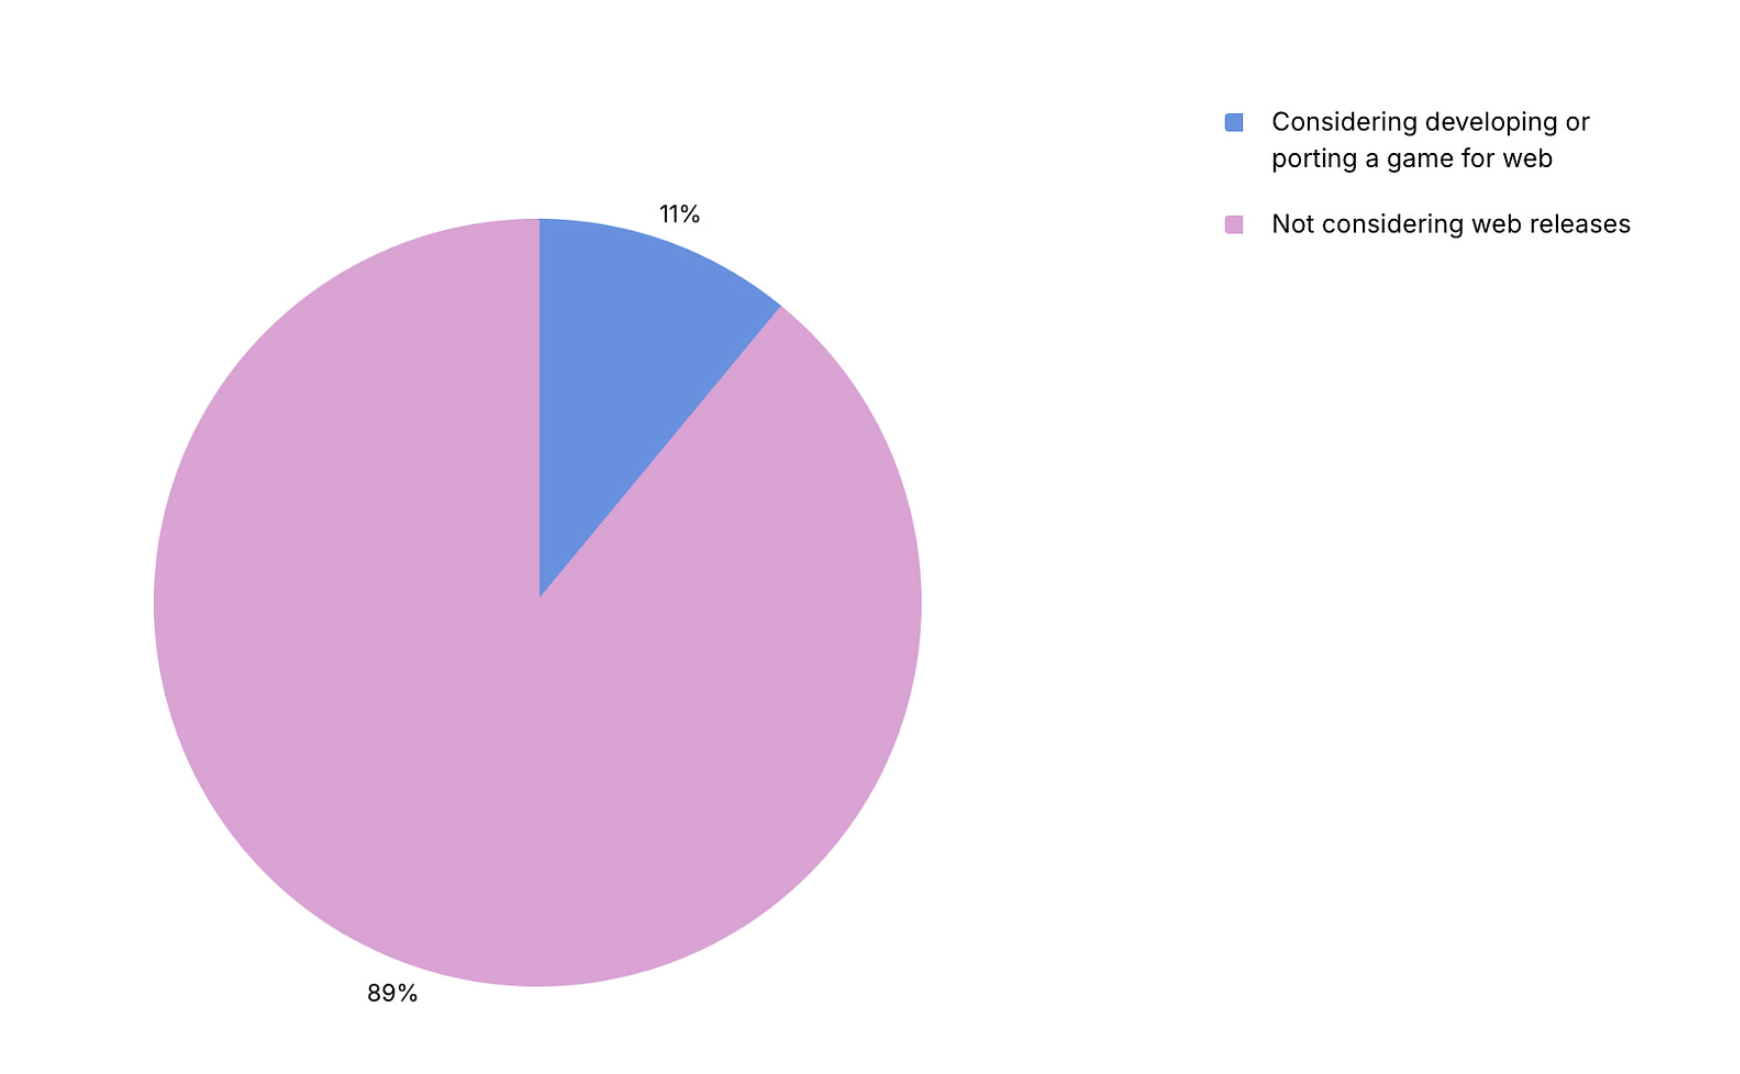
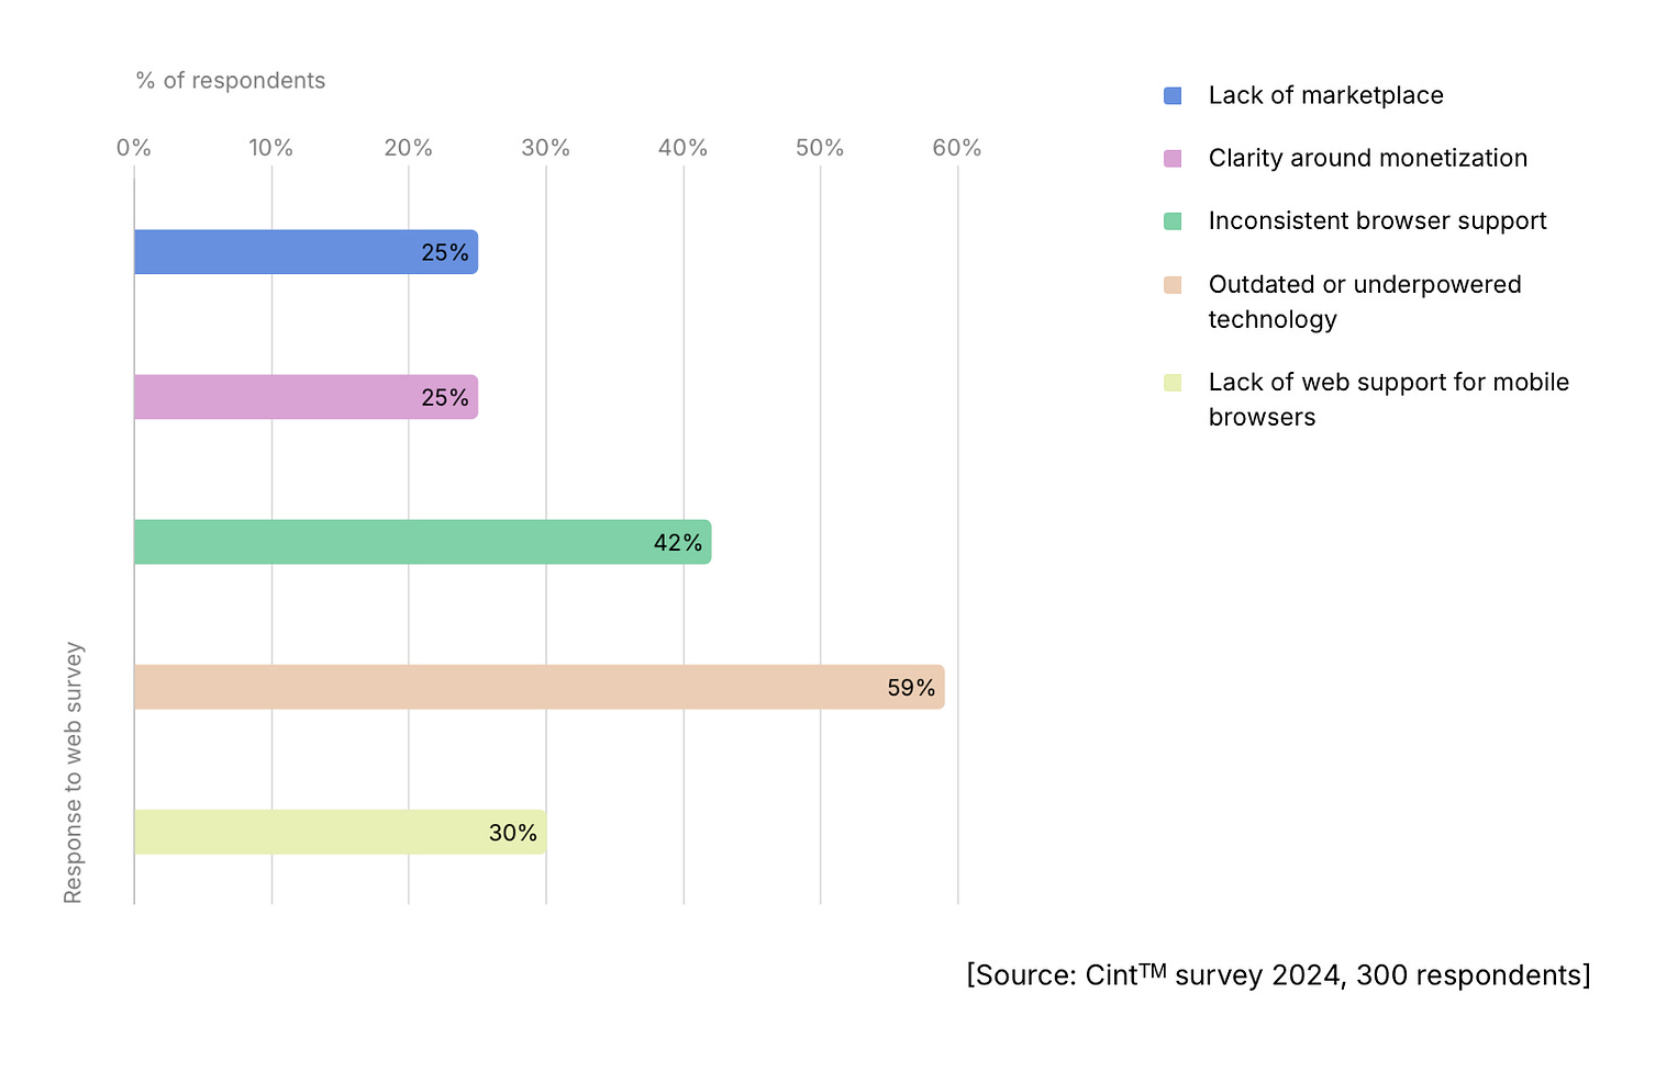
- Only 11% of developers plan to make games for web platforms, so despite overall positivity, web games are not yet mainstream.
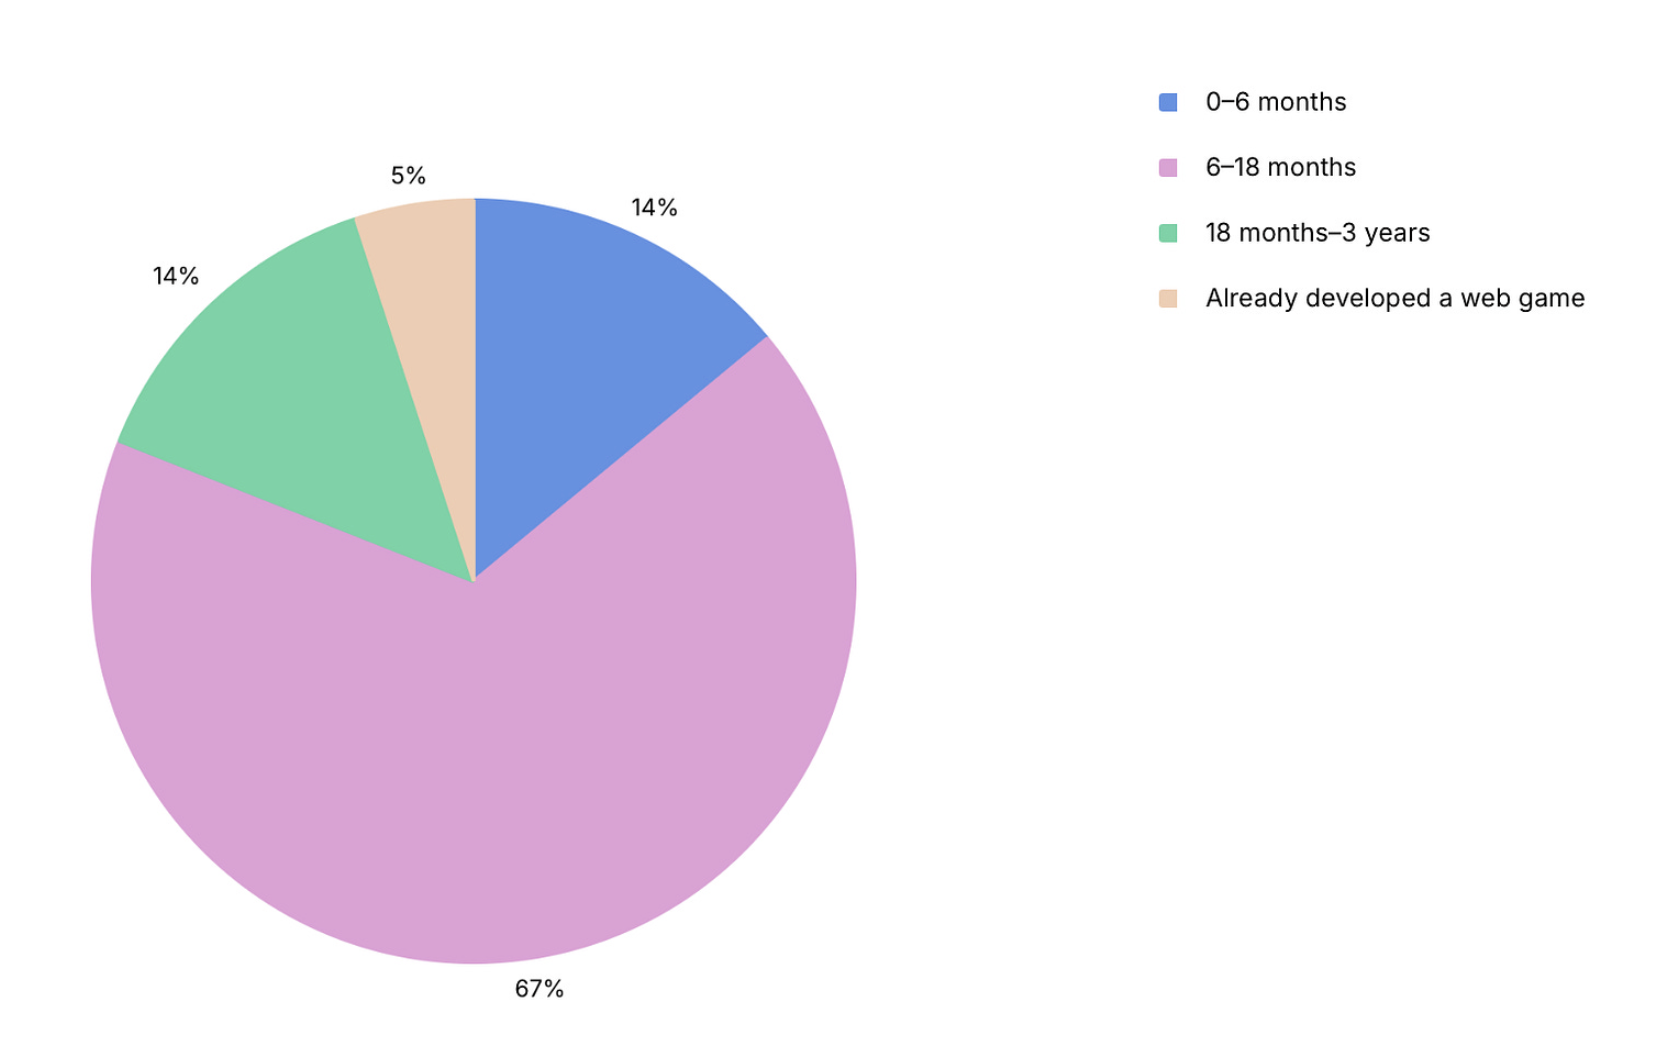
- Most of those making web games plan to release them within the next 18 months.
- Developers who do not plan to release projects for web platforms are concerned about technological limitations and limited browser support. There are also questions about mobile device support.
Trend 4: Games are getting larger
-
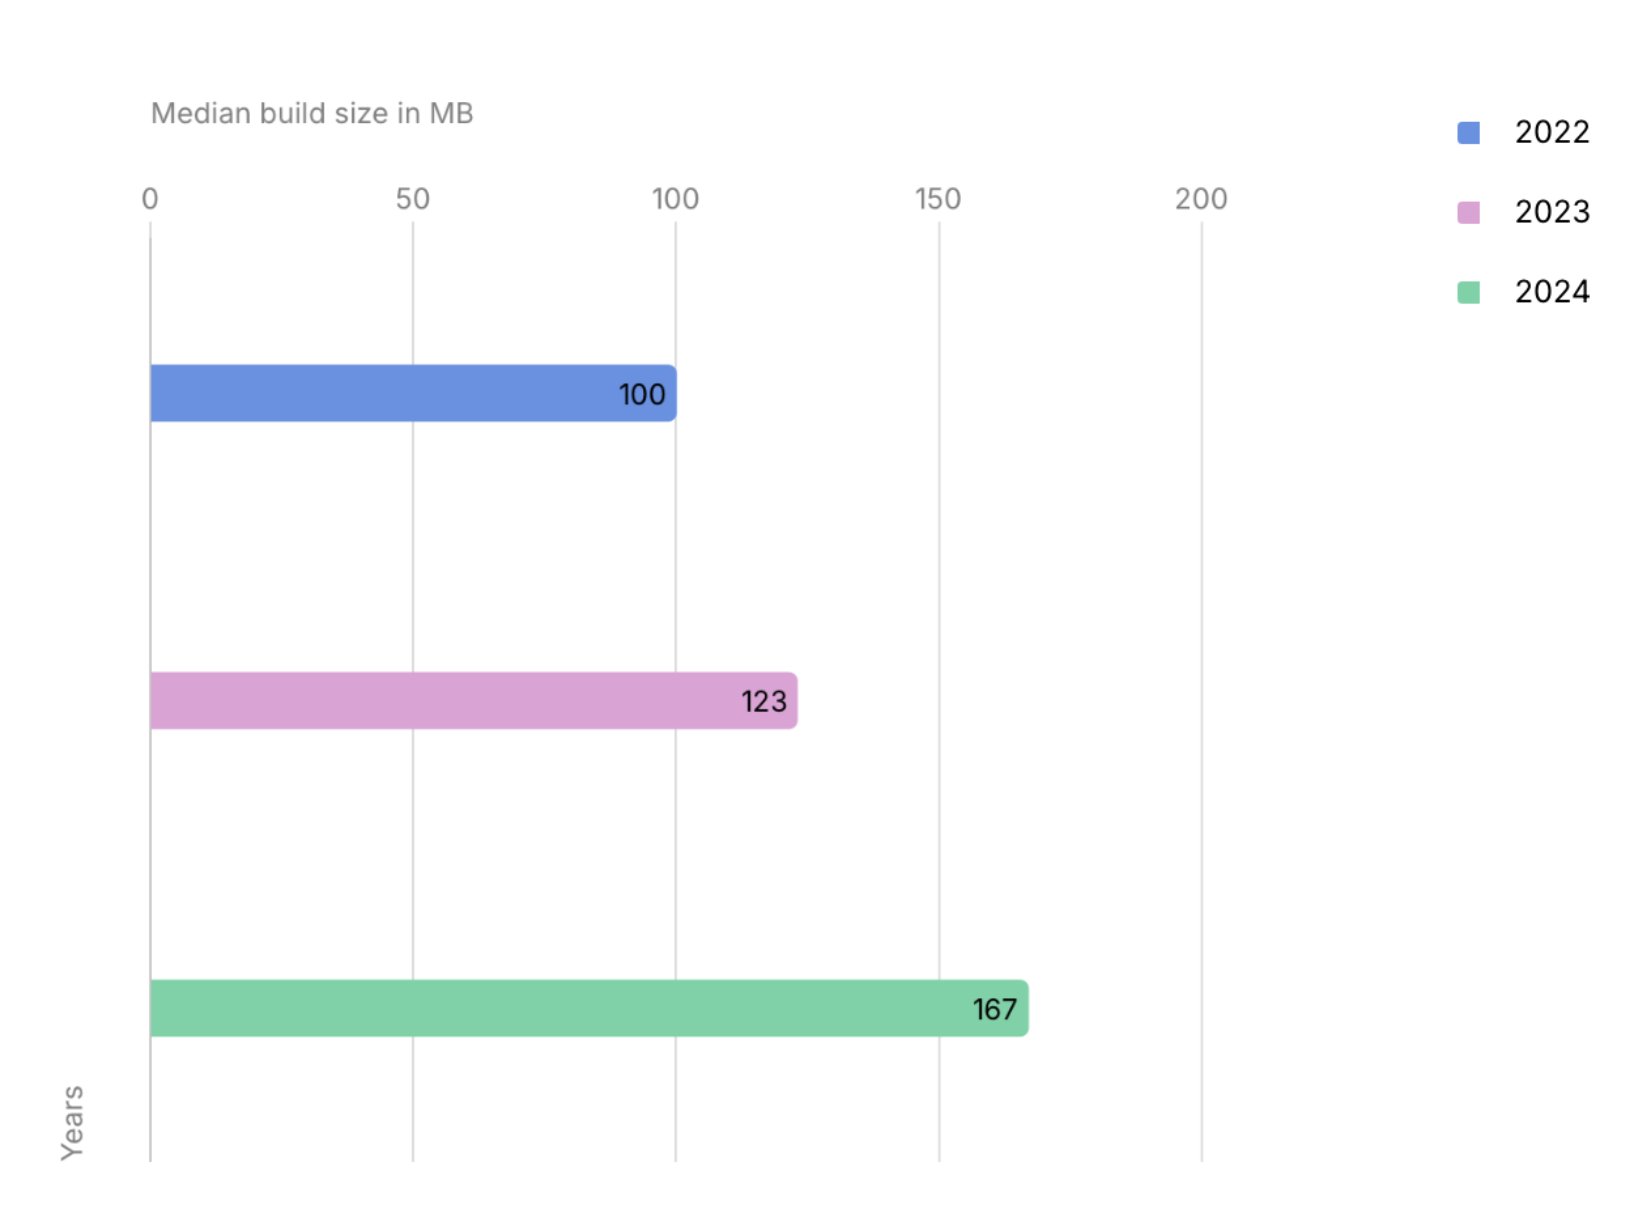
The median build size on Unity over the past three years has increased by 67% to 167MB.
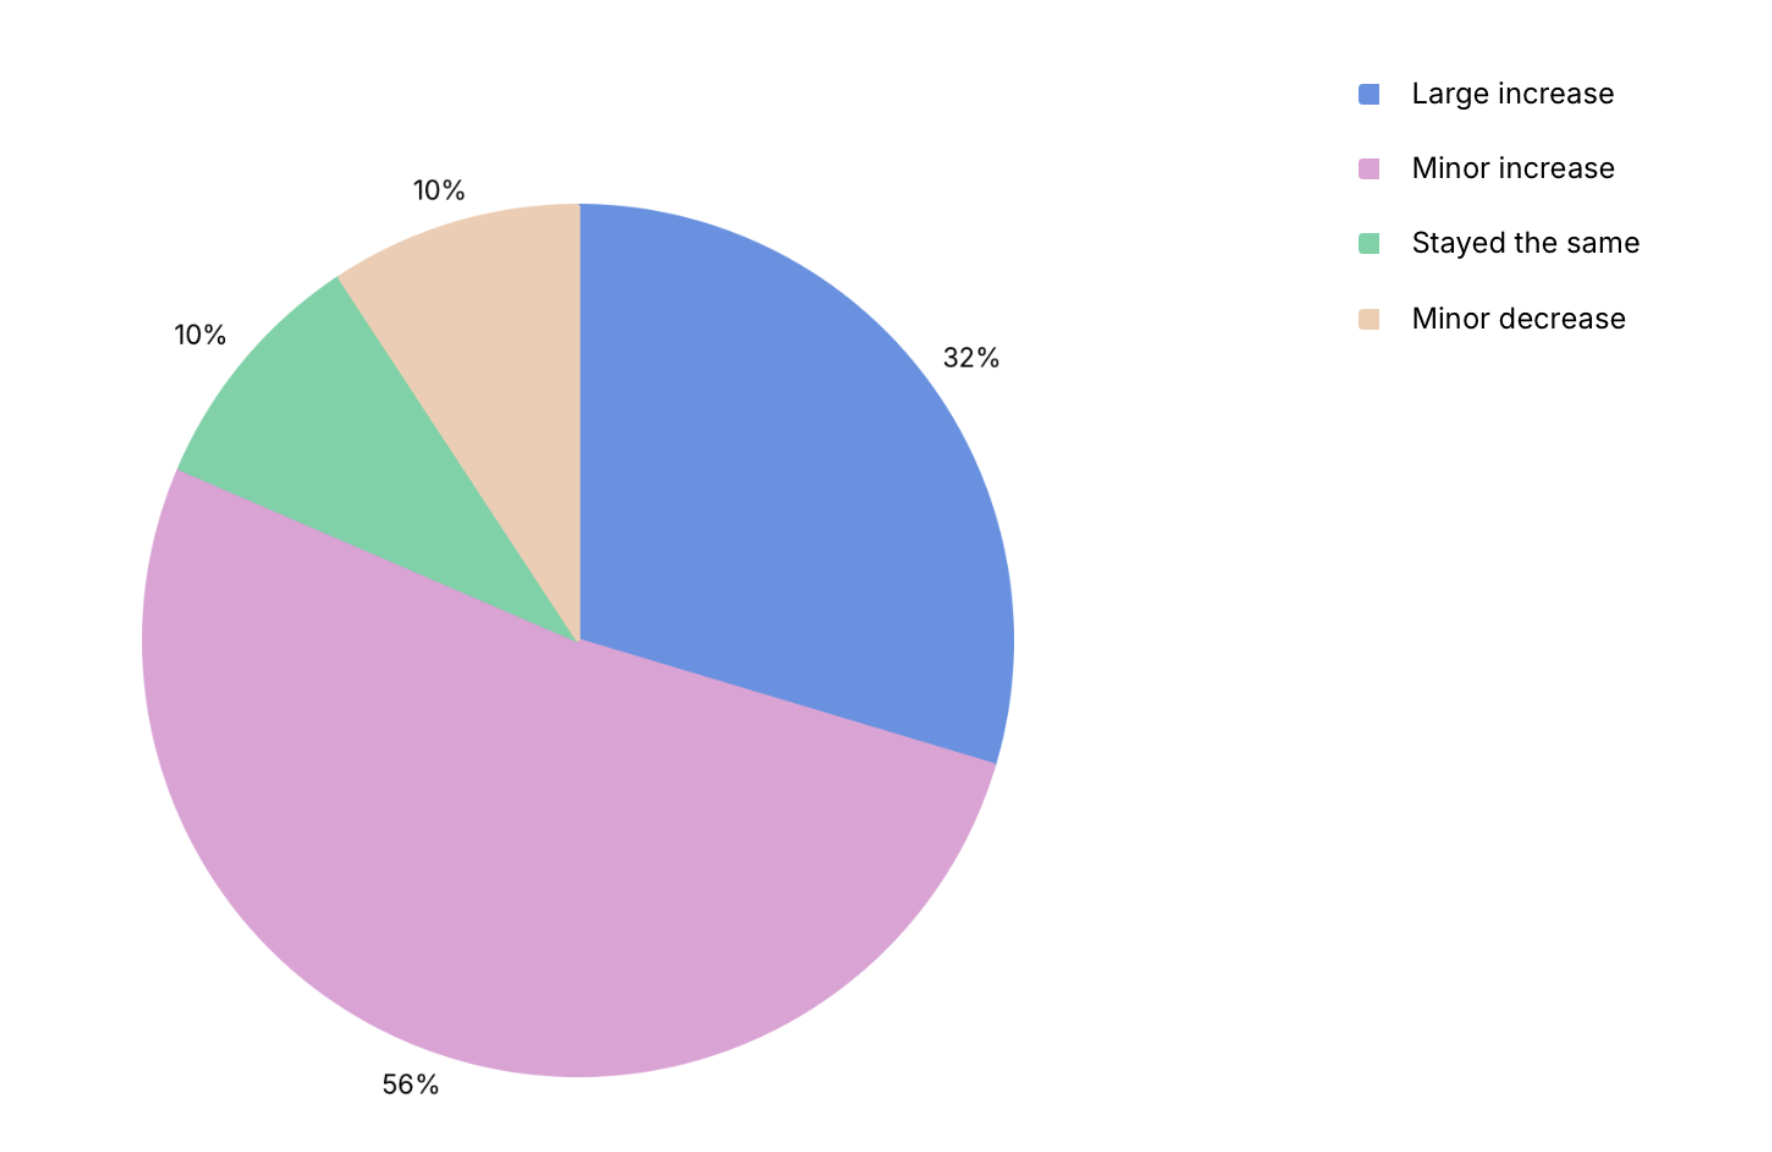
- 32% of developers noted that people are spending much more time playing games; 56% saw a small increase.
- Developers use different strategies to retain users, but the most effective (and complex) way is producing new content.
Trend 5: Developers are seeking for a new technological solutions
-
In addition to the challenges of finding a unique game idea, 21% of developers get stuck in R&D for a long time; 20% have problems releasing projects on time and with the right scope. Another 15% face issues with tool management.
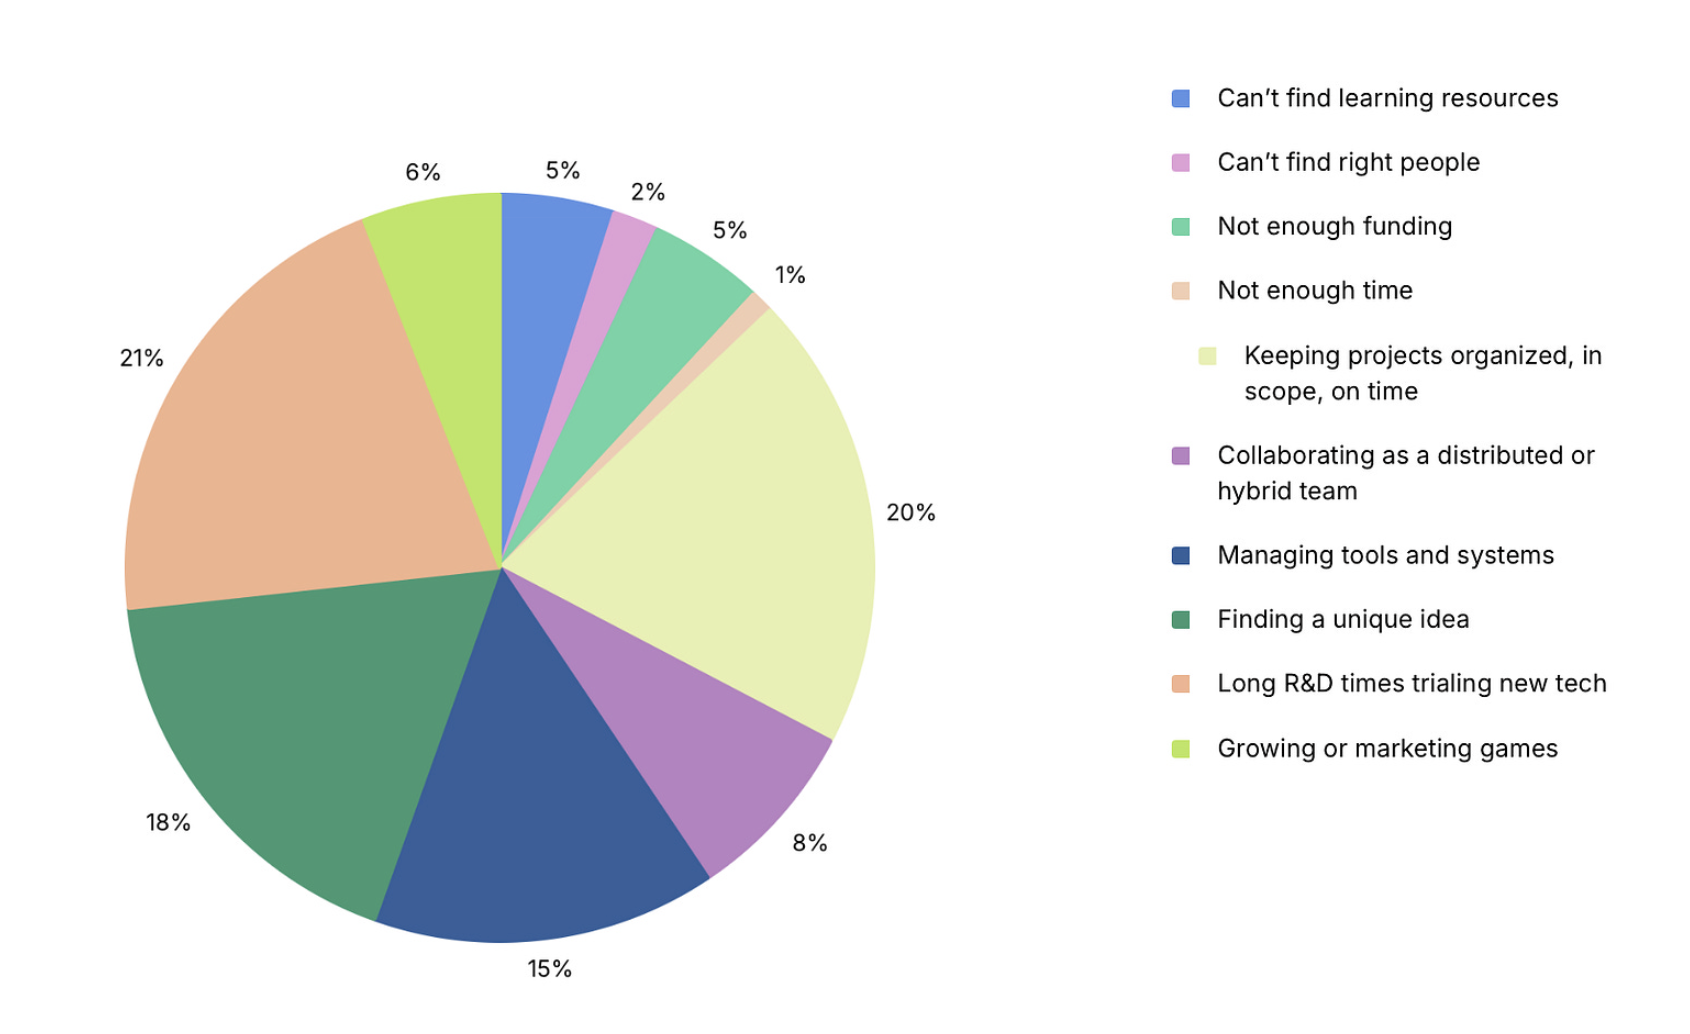
-
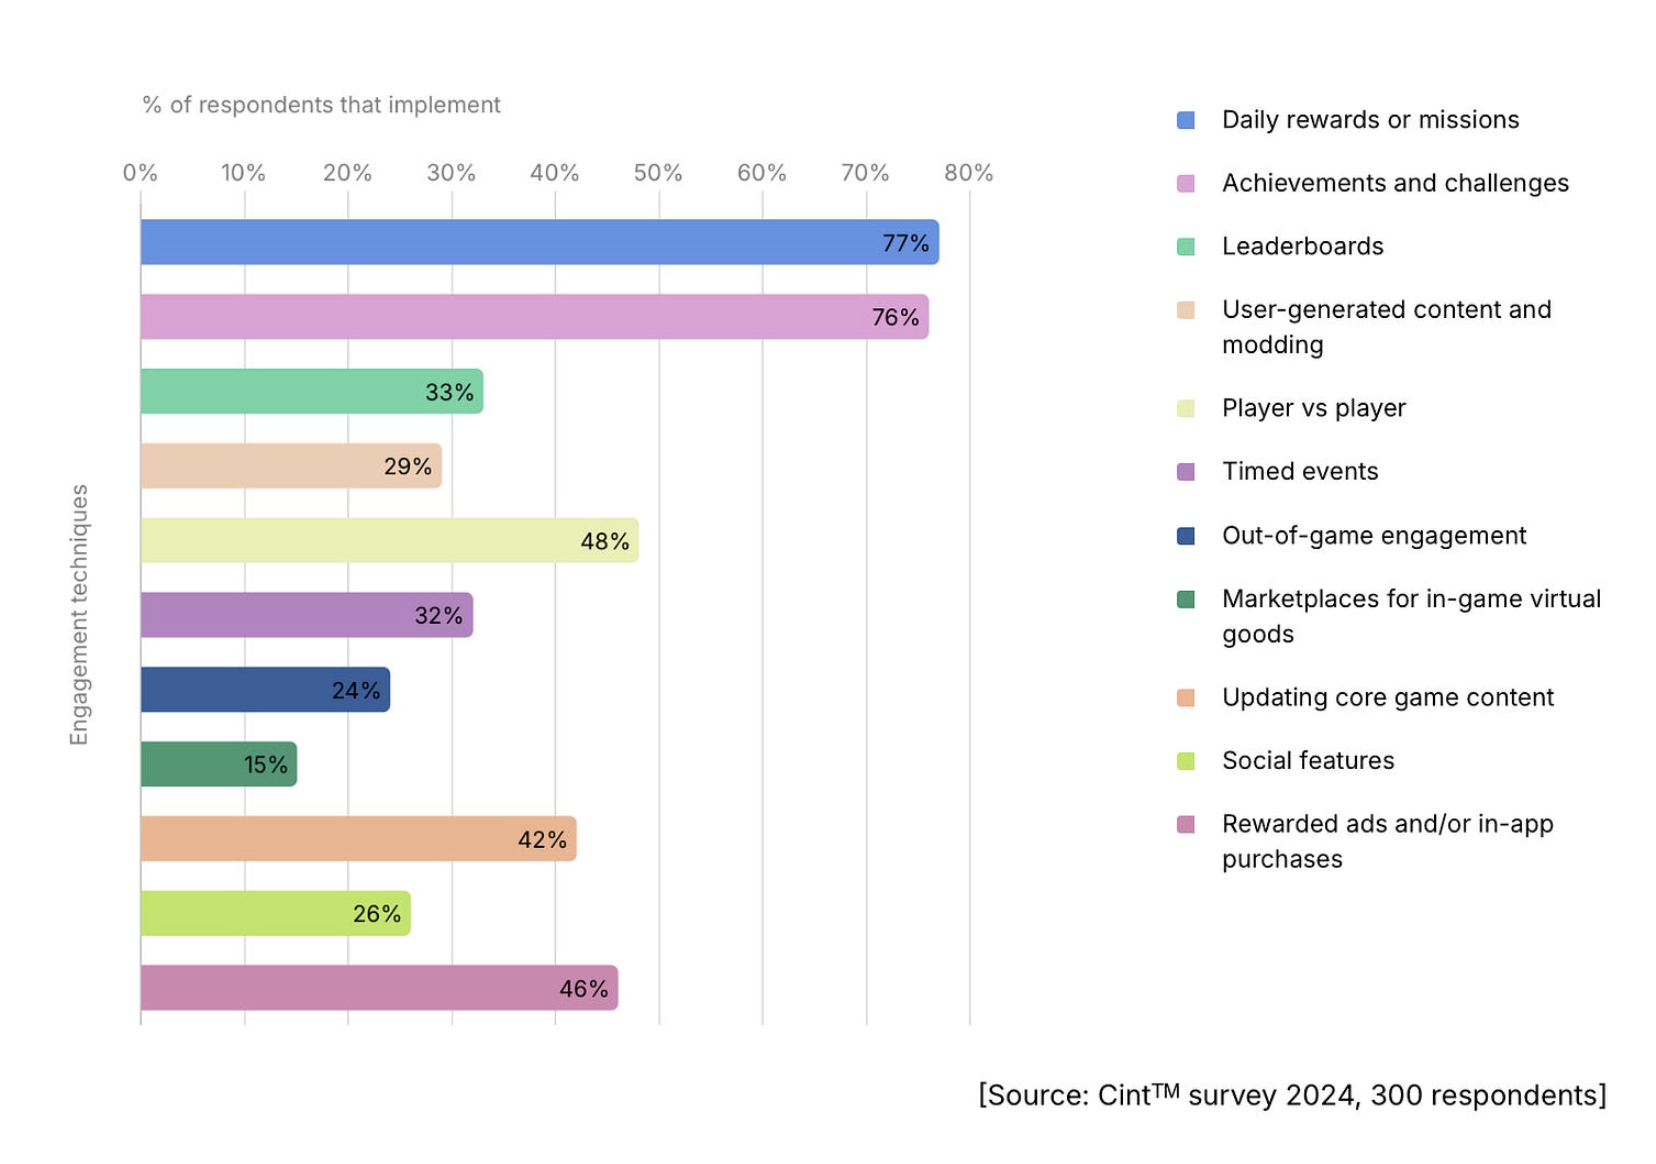
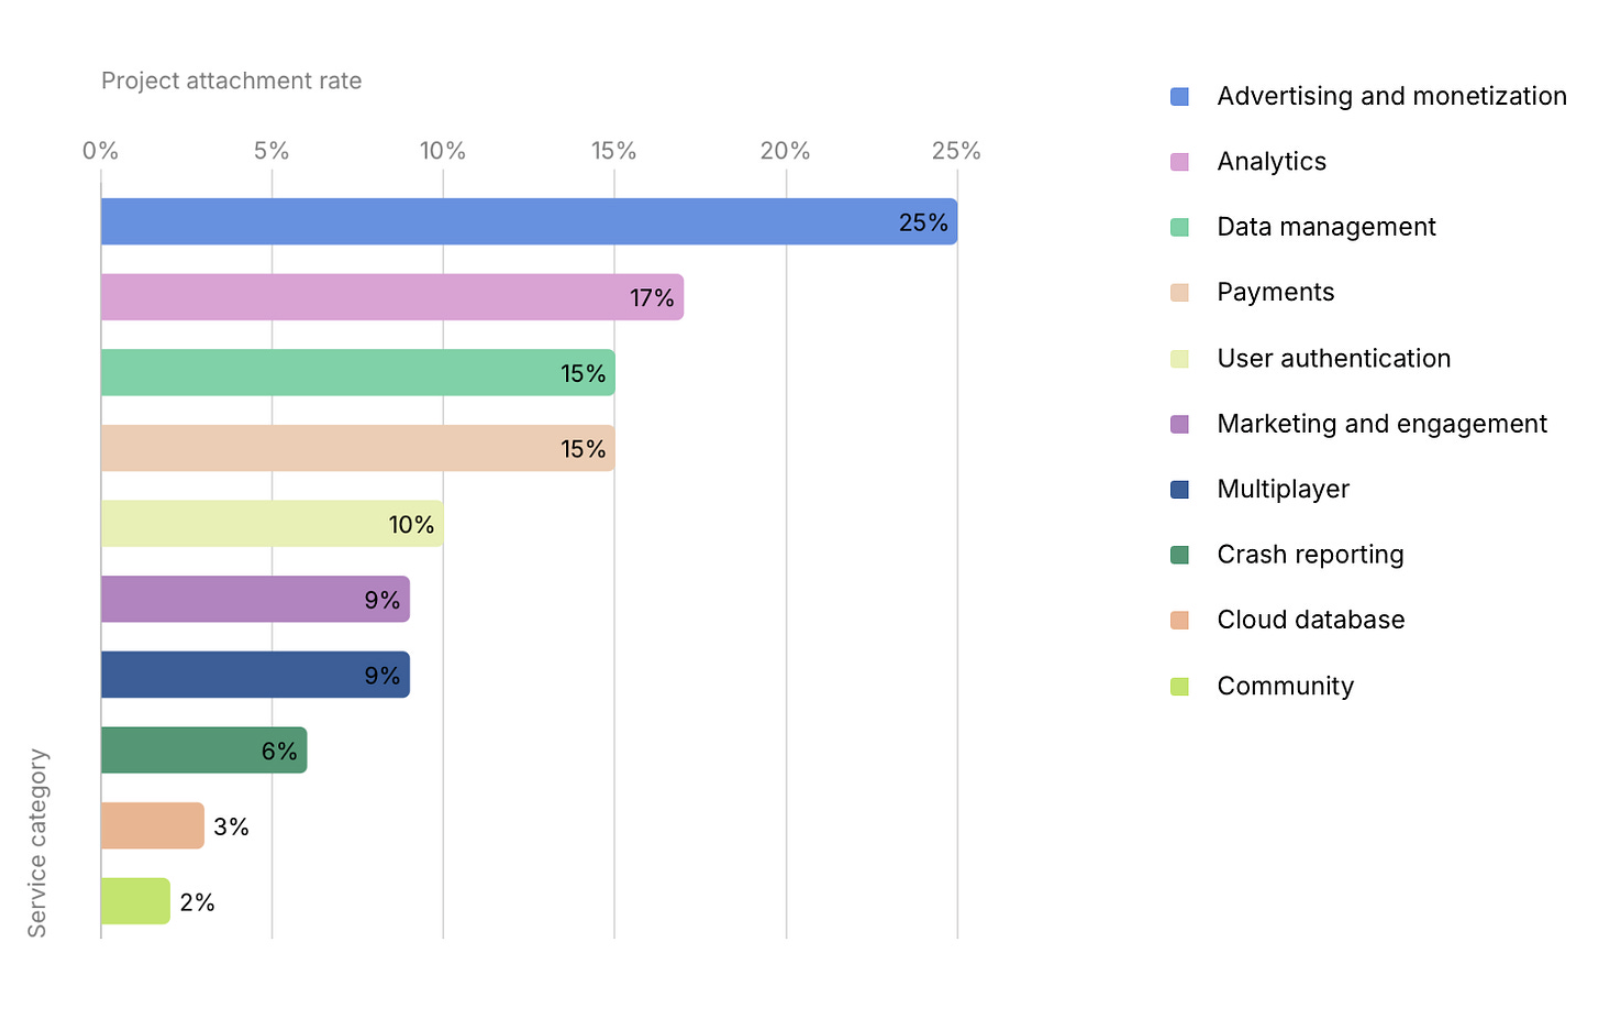
Developers actively use live ops tools. It's surprising that only 25% use Unity's advertising and monetization tools.
-
79% of surveyed developers have a positive attitude towards new AI tools.
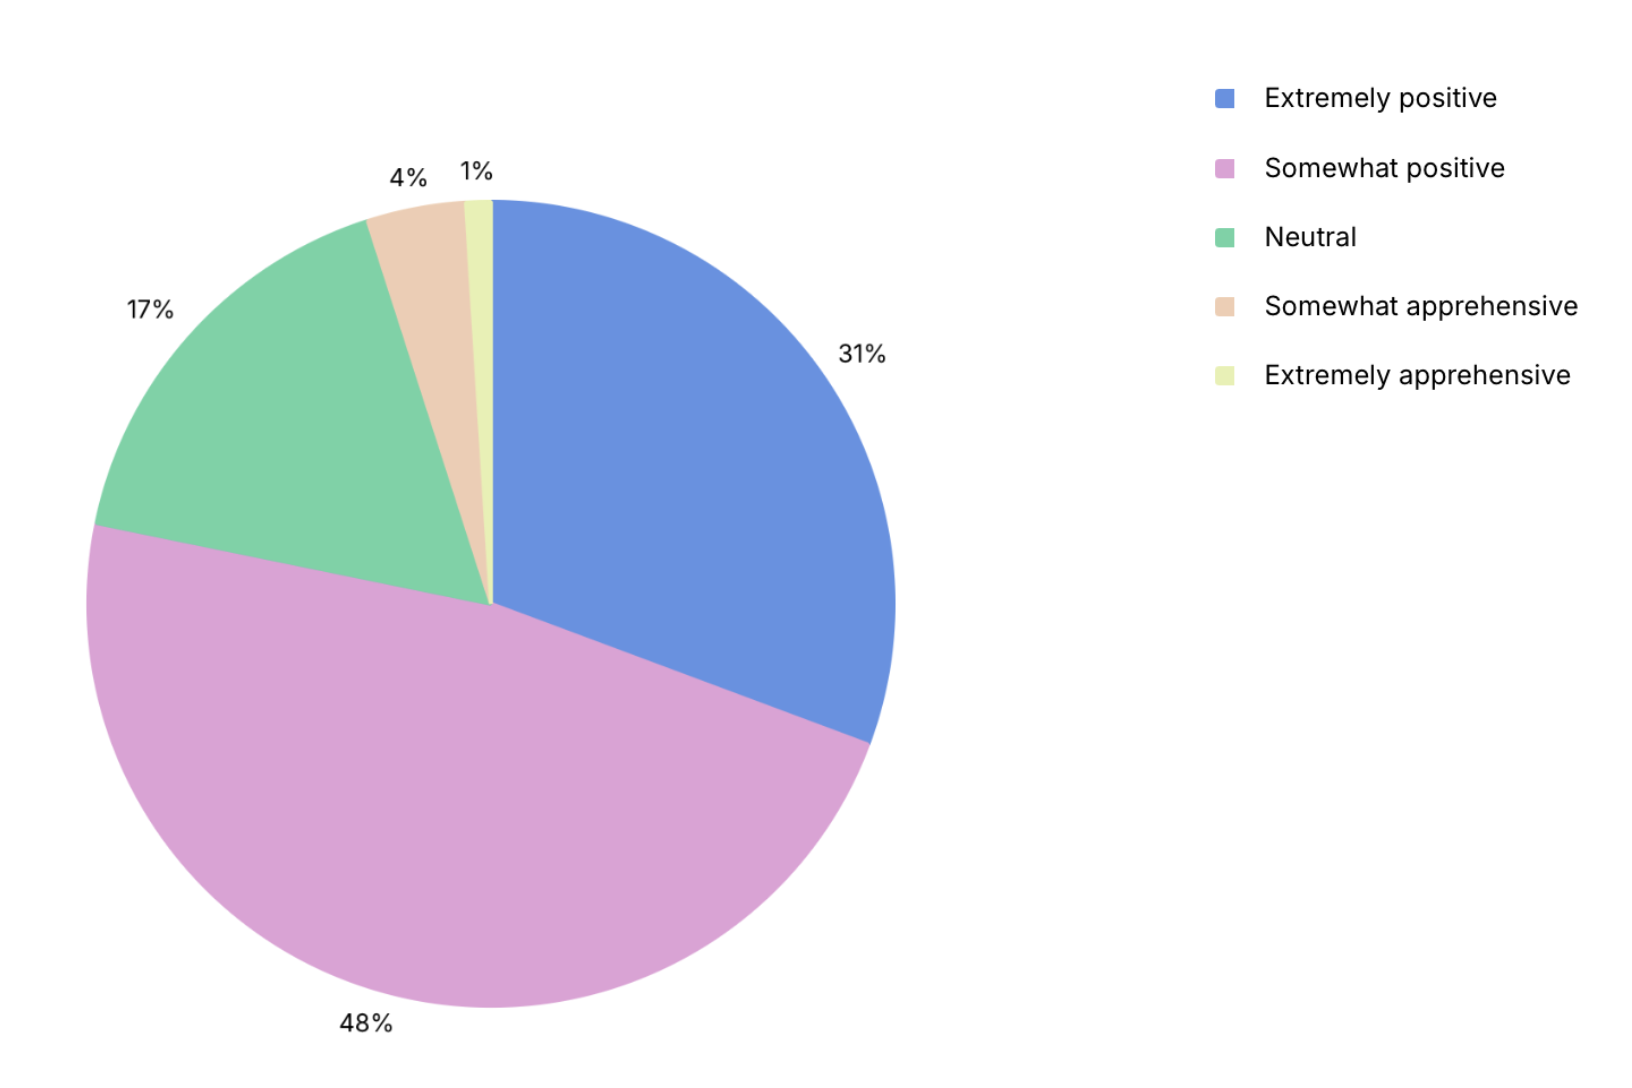
- Only 4% of those surveyed noted that they do not plan to use AI tools in 2025.
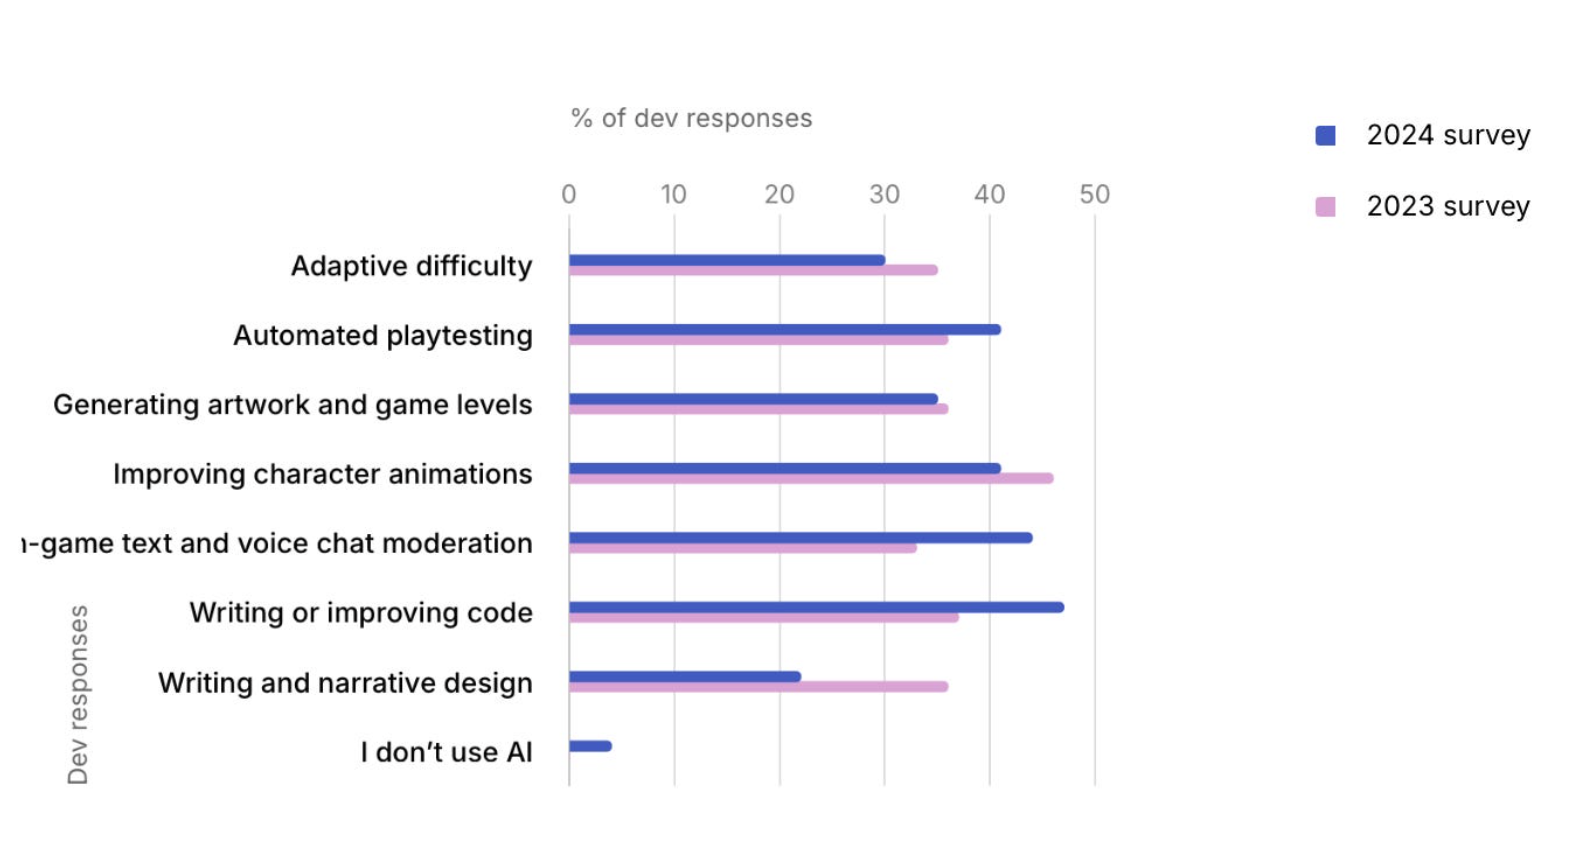
- Despite the growing popularity of AI tools, most developers continue to use old and proven tools.
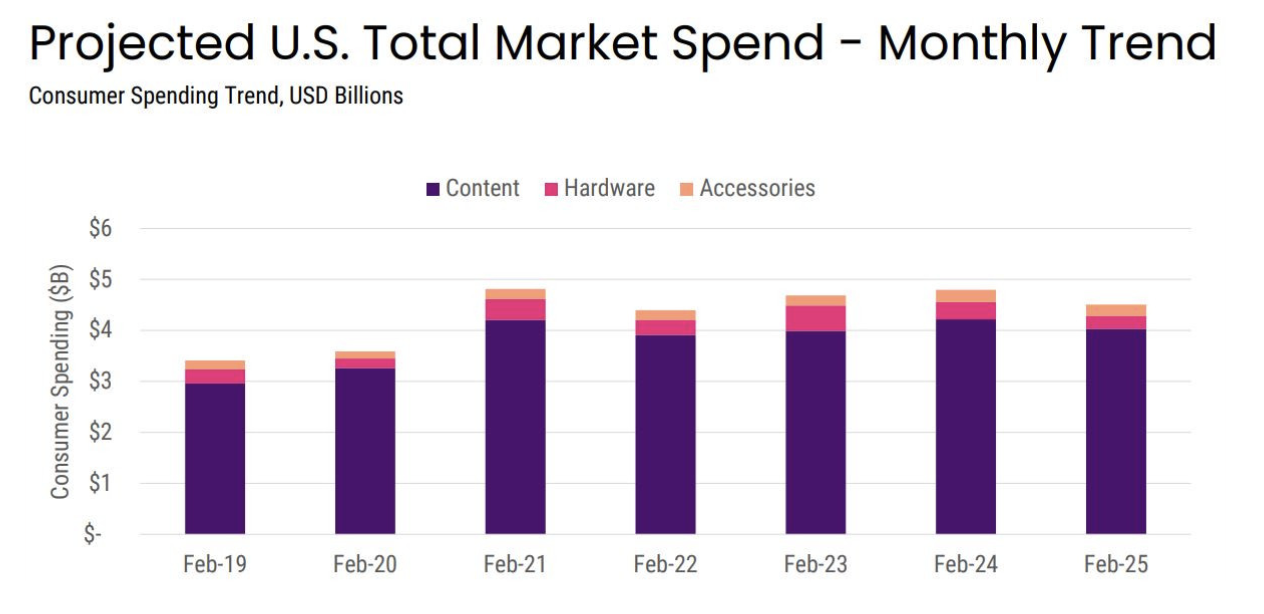
Circana: The US Gaming Market in February'25
Overall market condition
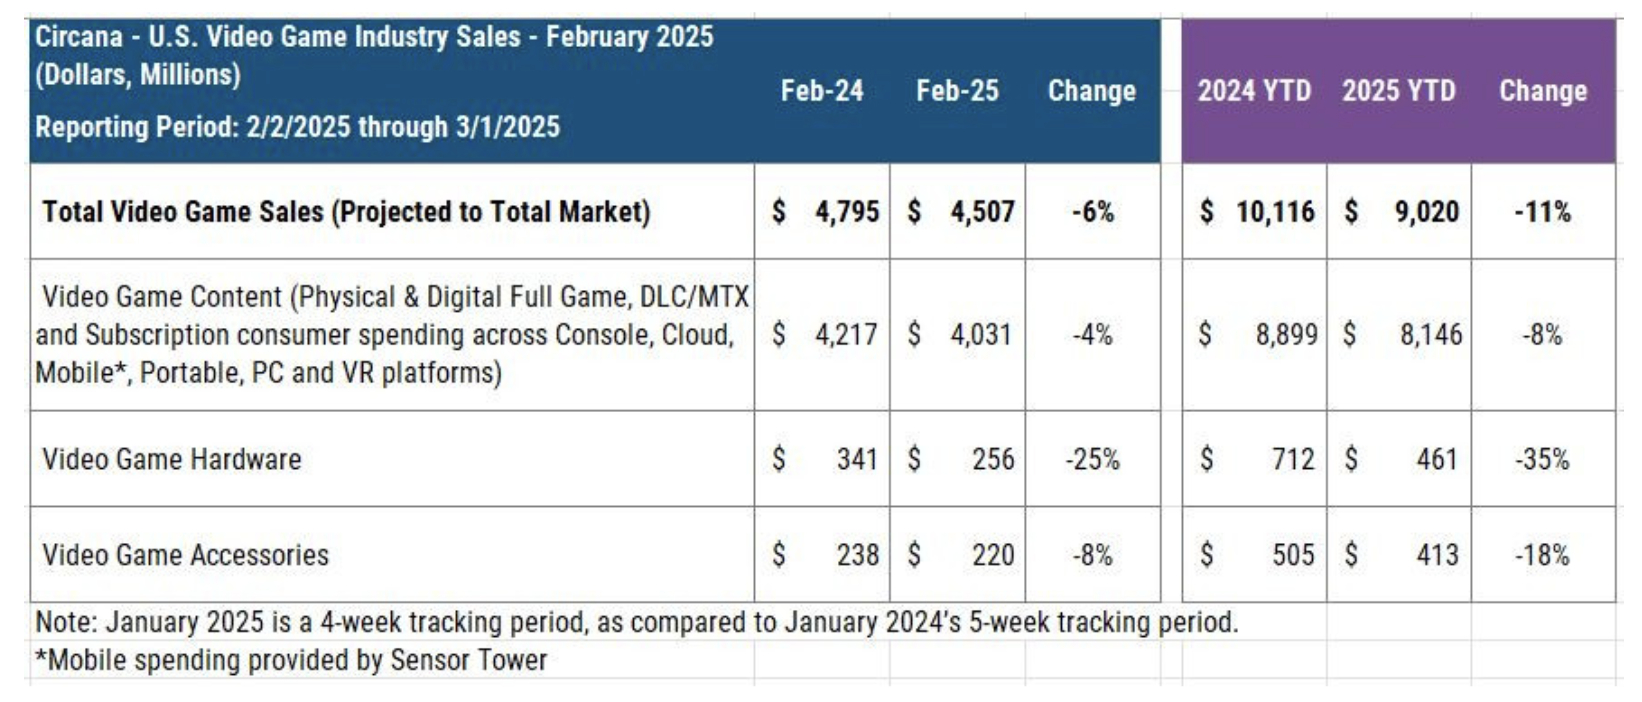
- The overall results for February 2025 were 6% worse compared to February 2024. Revenue decreased from $4.795B to $4.507B.
- Hardware sales fell the most, by 25% (from $341M in February 2024 to $256M in February 2025). This is the lowest figure since February 2020.
- PlayStation 5 was the best-selling console in February, followed by the Xbox Series S|X.
- After 52 weeks on the U.S. market, PlayStation 5 sales are 7% ahead of PlayStation 4 sales. Xbox Series sales trail Xbox One by 19%.
- Accessory sales dropped by 8% (from $238M to $220M).
- PlayStation Portal continues to lead the list of top accessories by revenue.
- Gaming content sales decreased by 4% (from $4.217B to $4.031B).
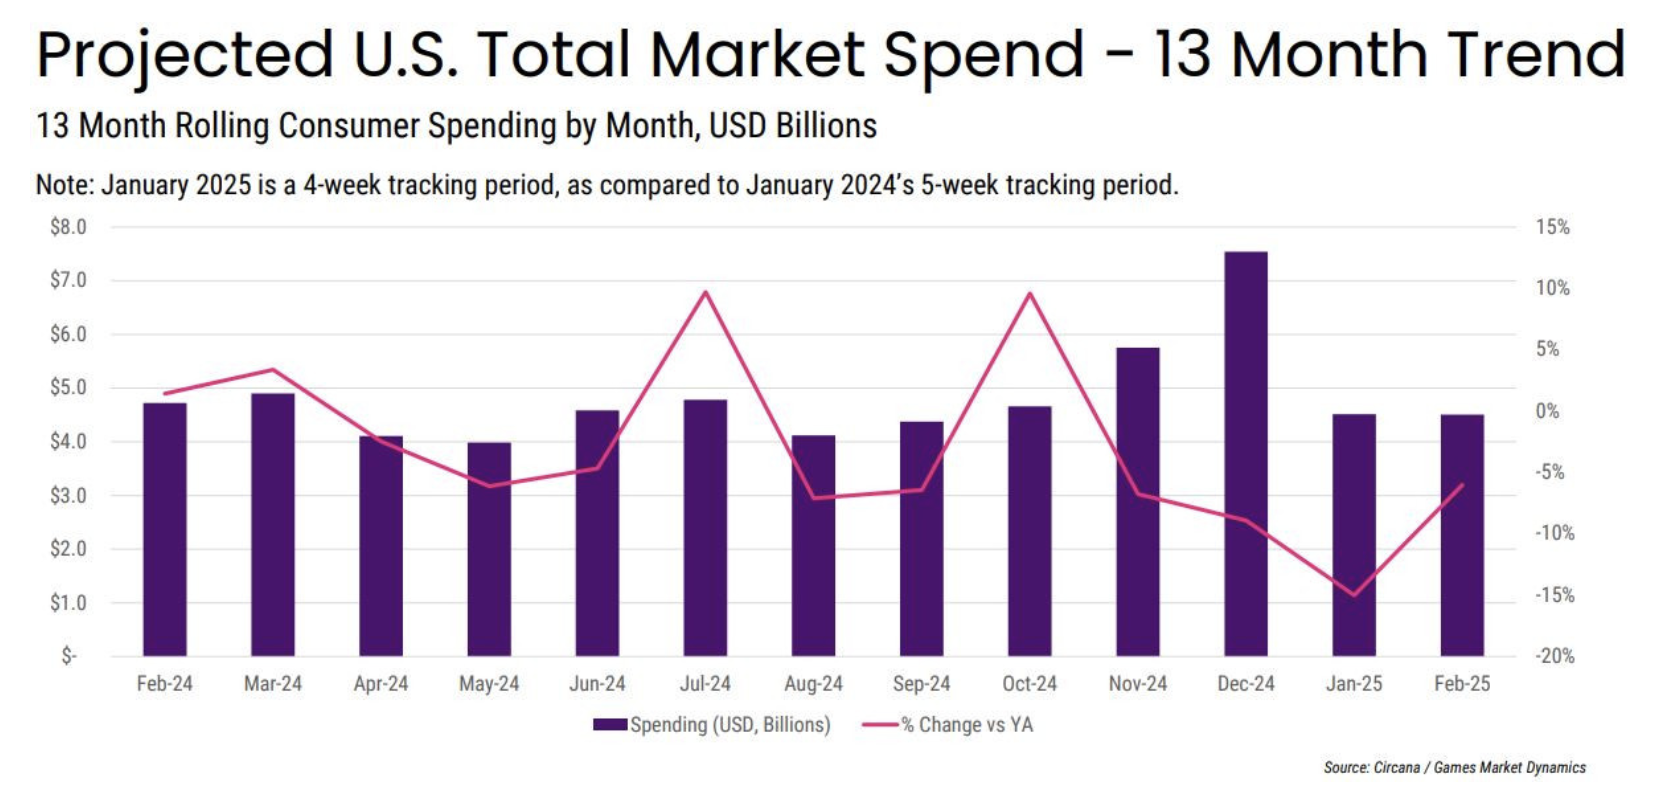
- The results for the first two months of 2025 show that gaming market revenue was 11% lower than in the same period in 2024 ($9.02 billion vs. $10.116 billion). Hardware and accessory sales fell the most.
Games sales
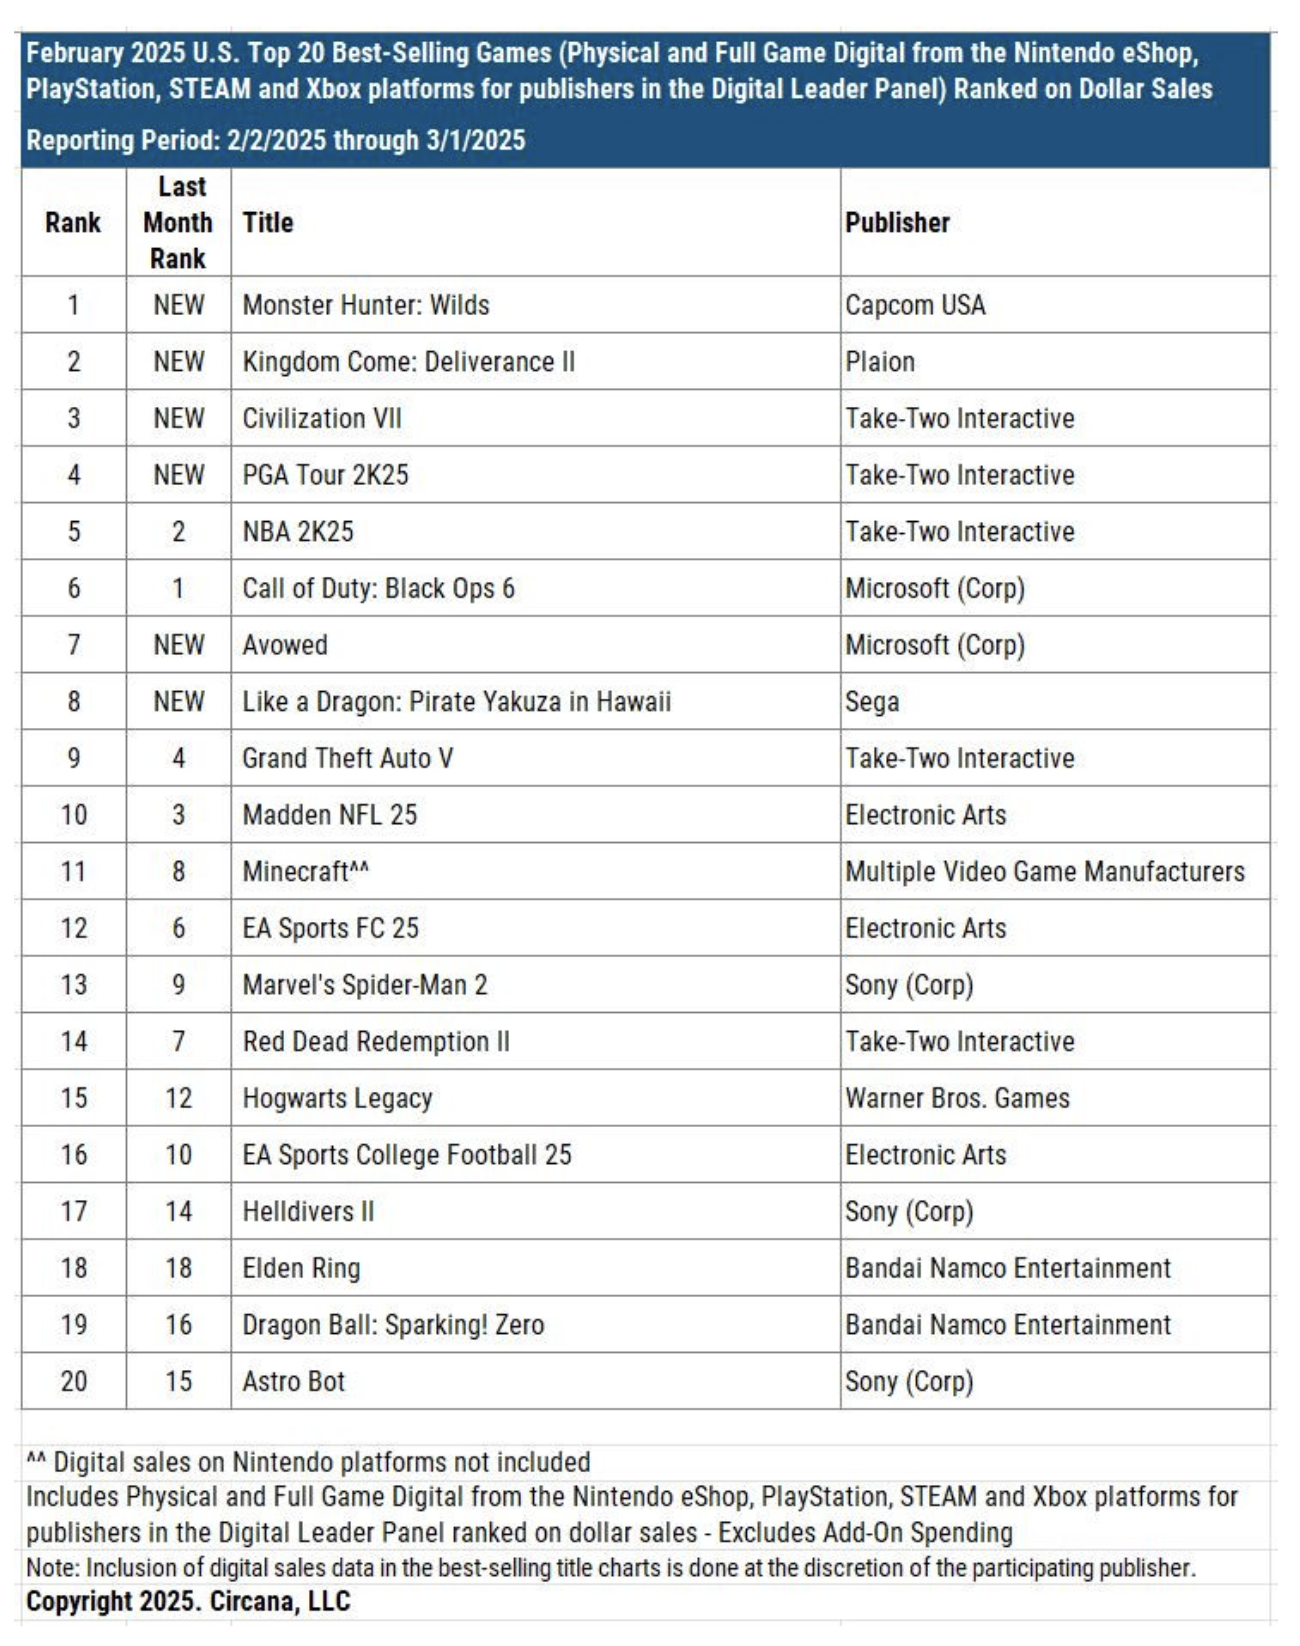
- February's top new releases include Monster Hunter: Wilds, Kingdom Come: Deliverance II, Civilization VII, PGA Tour 2K25, Avowed, and Like a Dragon: Pirate Yakuza in Hawaii.
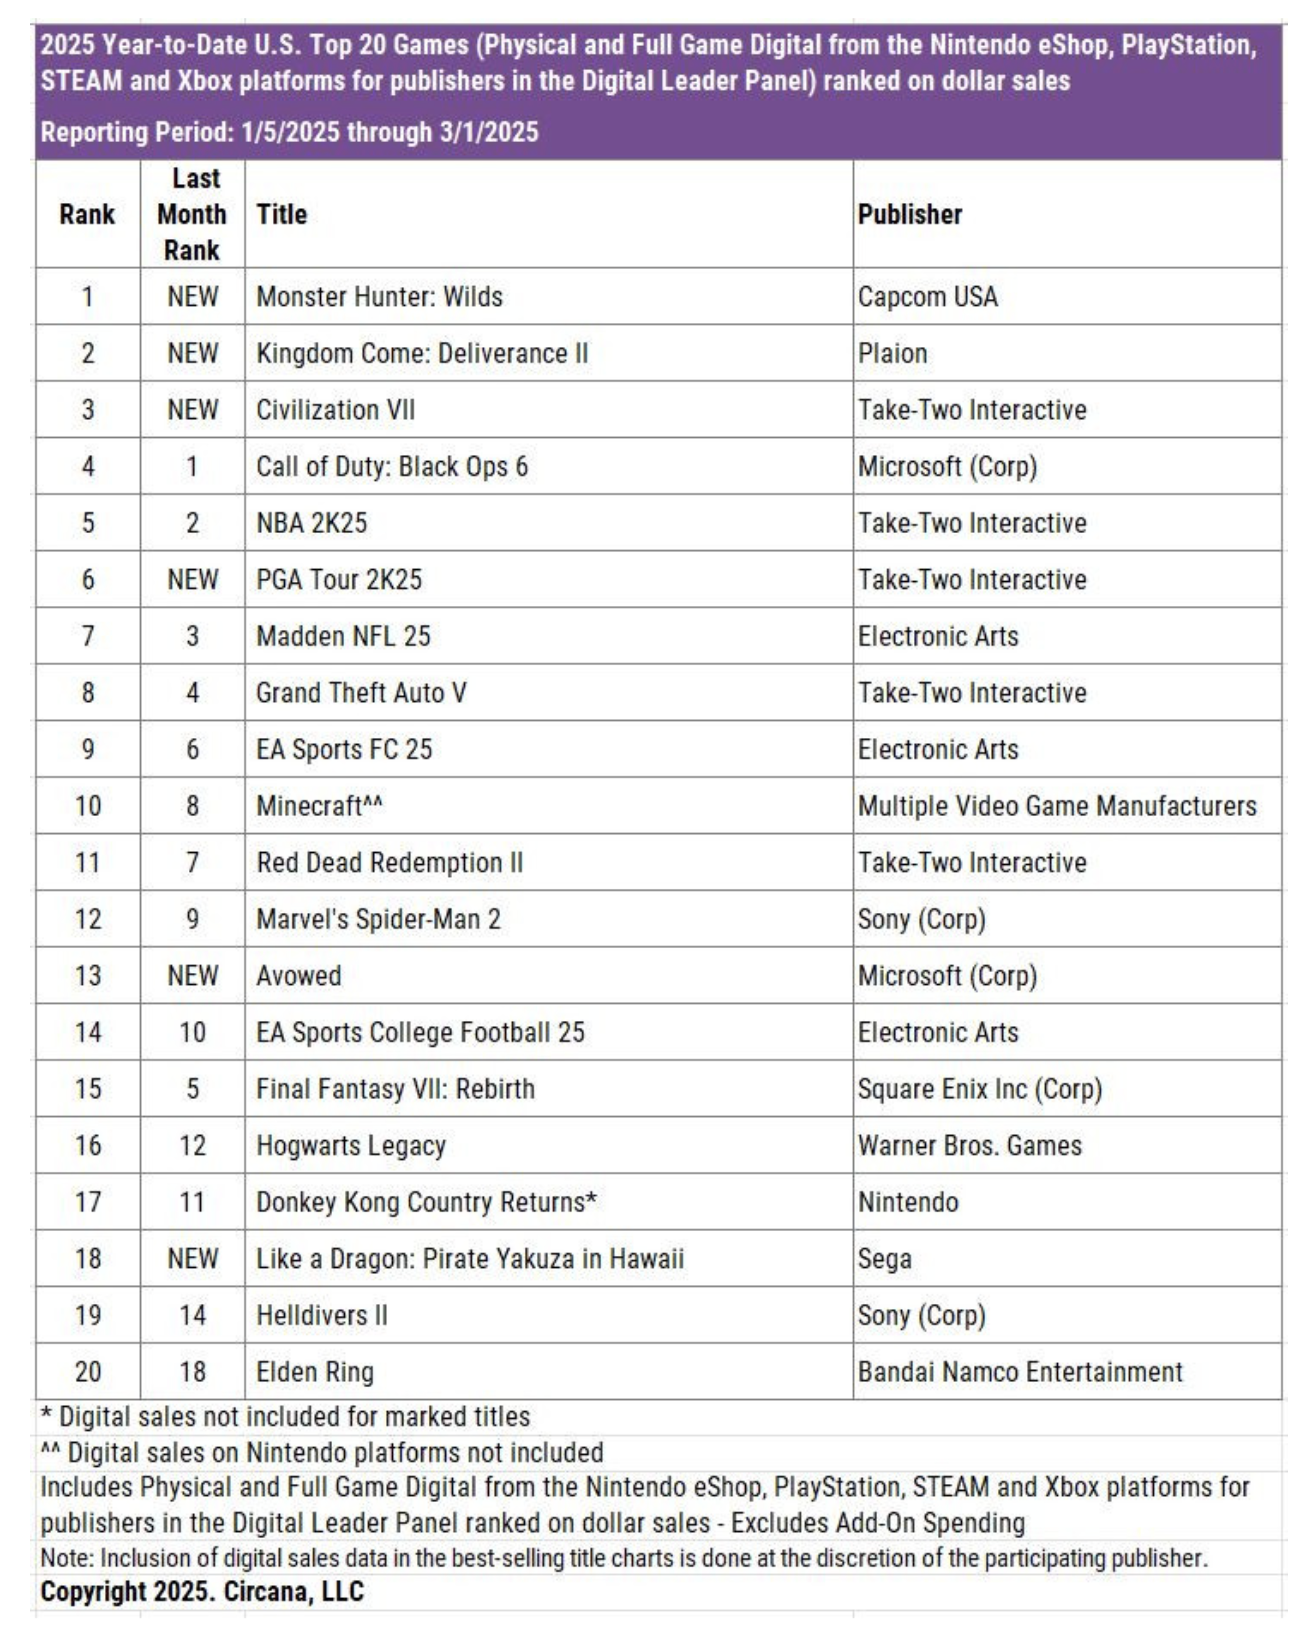
- For the first two months of 2025, the top three sellers are Monster Hunter: Wilds, Kingdom Come: Deliverance II, and Civilization VII.
- Monster Hunter: Wilds became the best-selling game in February and for the year on the U.S. market in just one day. This applies to all platforms - PlayStation, Xbox, and Steam. Over half of its sales in dollar terms were on Steam. The game earned more in one day than Monster Hunter: Rise did in all of March 2021.
- It's worth noting the success of Kingdom Come: Deliverance II - the game launched five times better by revenue than the original, which was released in February 2018.
- On mobile platforms, MONOPOLY GO!, Royal Match, and Last War: Survival are leading. Sensor Tower provided the data. Last War: Survival saw a 17% increase in IAP revenue in February.
- Additionally, February became the first month in history when two games from the same IP (Pokémon GO and Pokémon TCG Pocket) entered the top 10 mobile chart in the U.S. by revenue.
Platform rankings
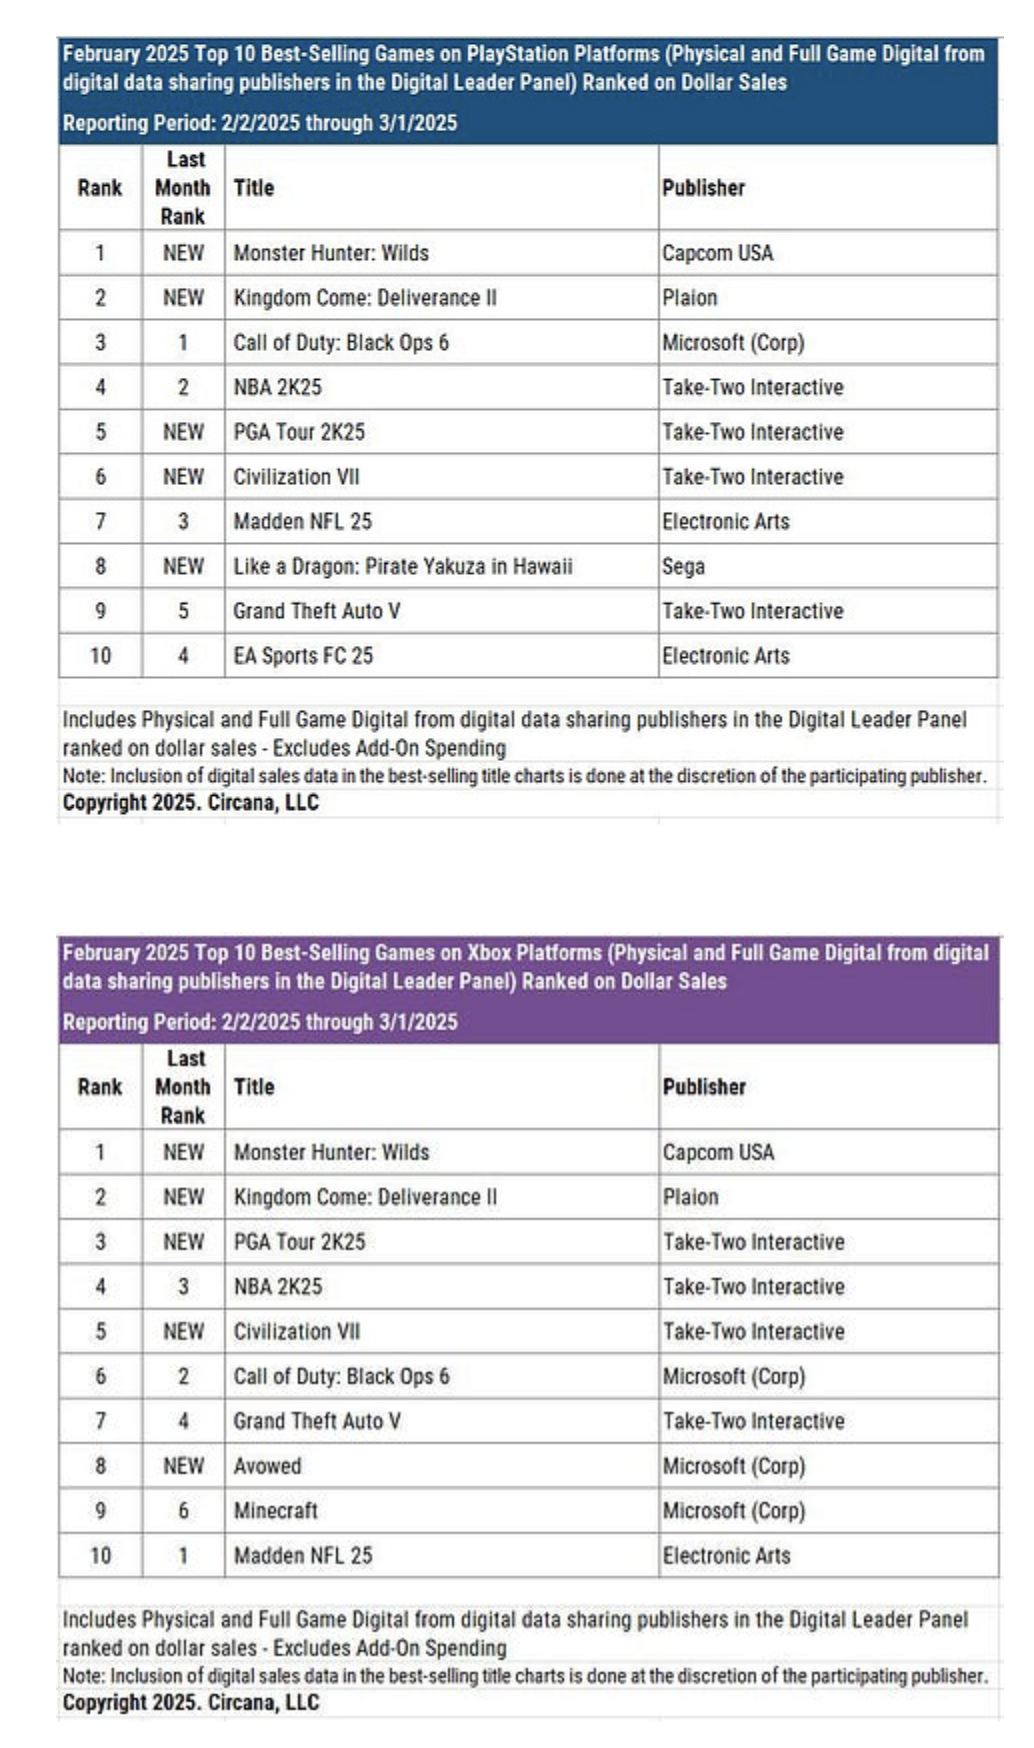
- The sales rankings on PlayStation and Xbox are quite similar. There are differences in positions (Call of Duty: Black Ops 6 sells better on PlayStation because it's not available by subscription). Also, Avowed made it into Xbox's top-10 list, while Like a Dragon: Pirate Yakuza in Hawaii made it onto PS.
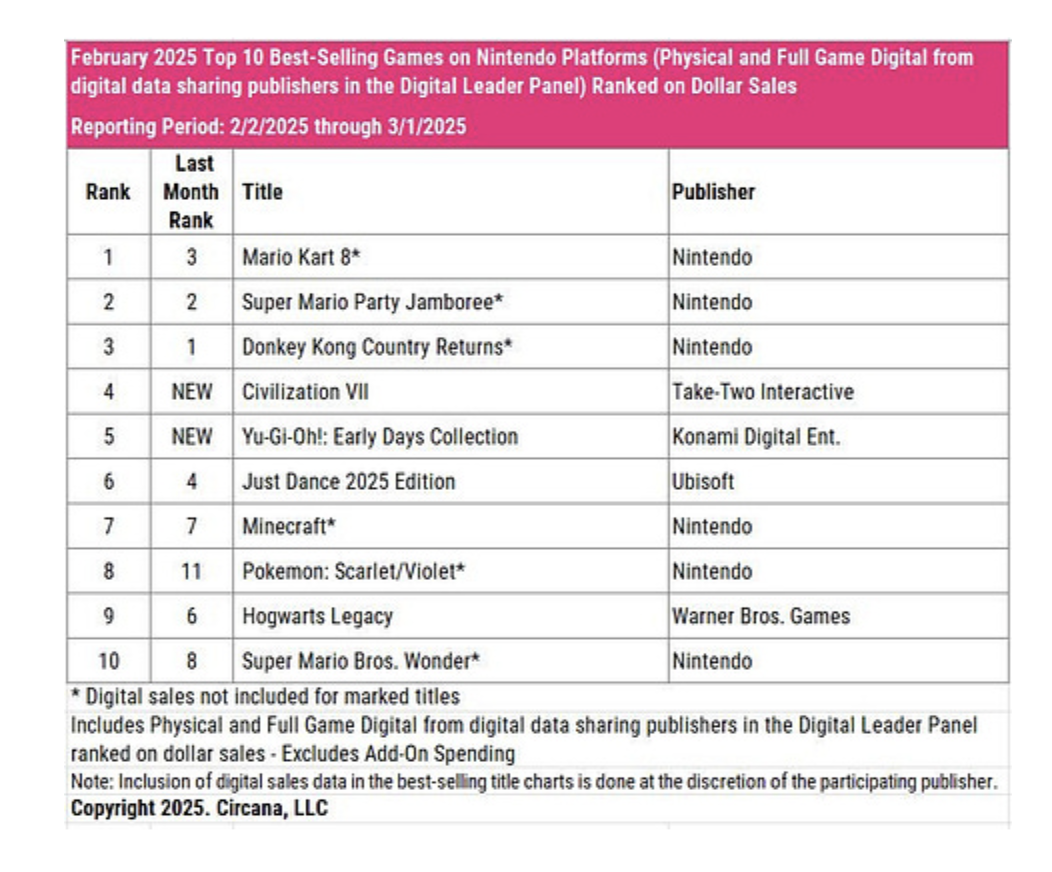
- The Nintendo Switch is different. It's worth noting the successful launch of Civilization VII and of Yu-Gi-Oh!: Early Days Collection.
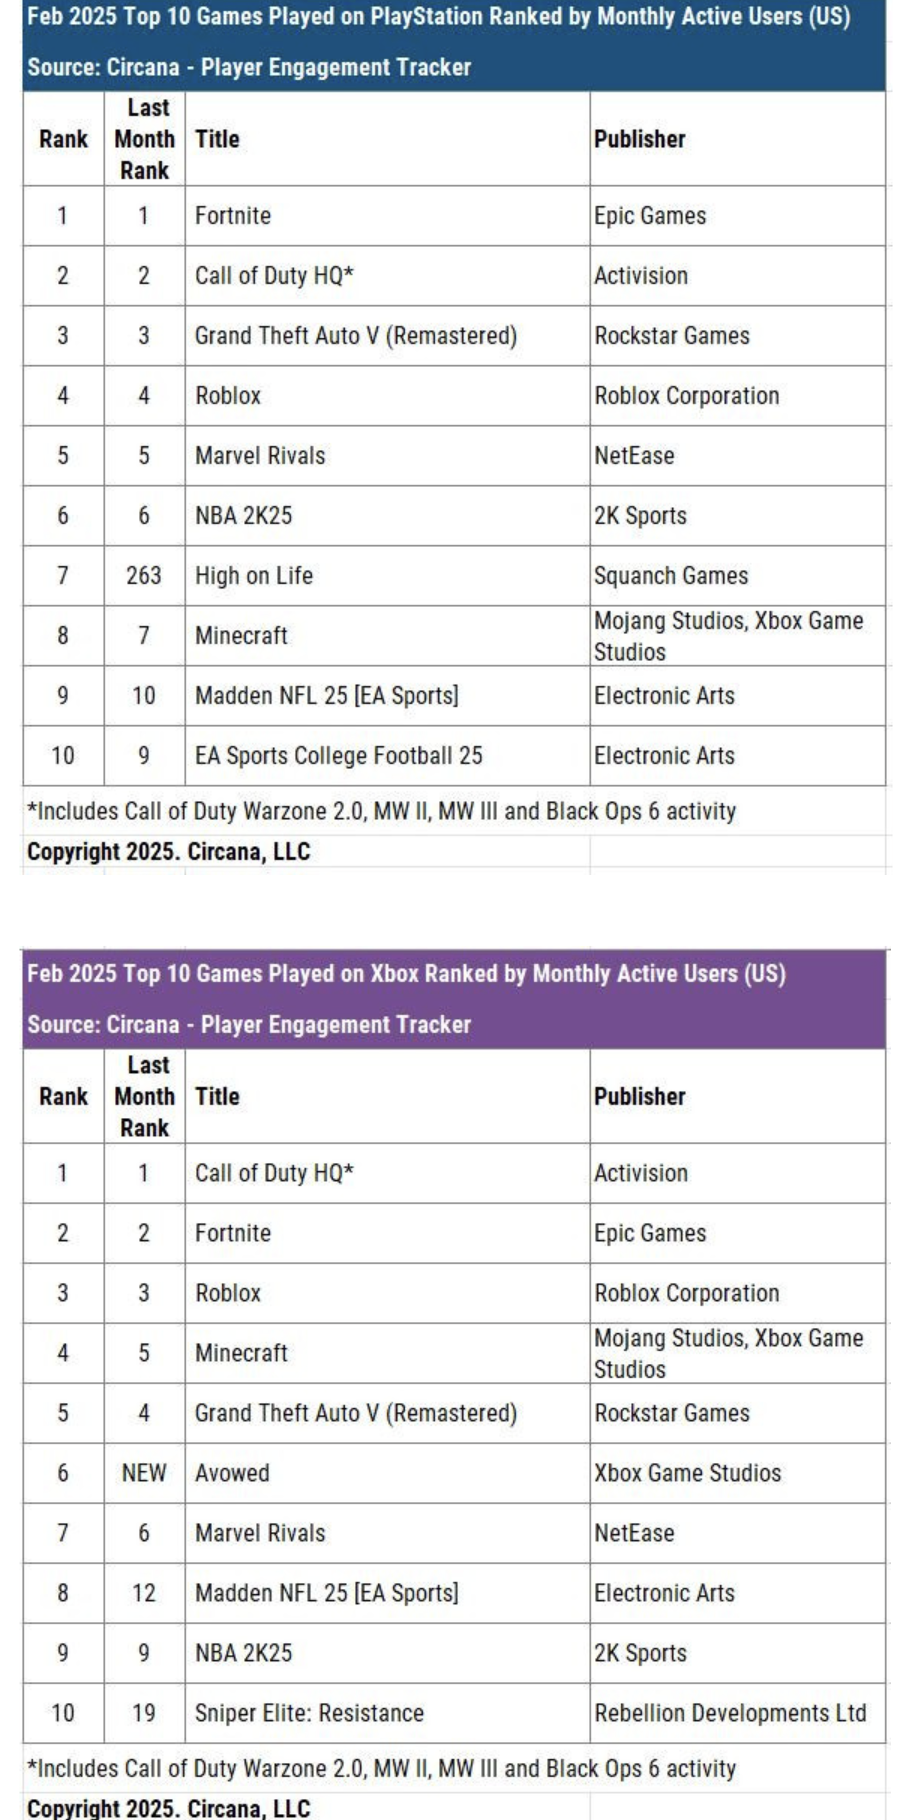
- The MAU charts on PlayStation and Xbox remains stable. Projects from subscriptions (High on Life on PS and Avowed on Xbox) made it into the top 10. Monster Hunter: Wilds will likely appear in March's rankings, as it simply didn't have enough time to establish itself in February.
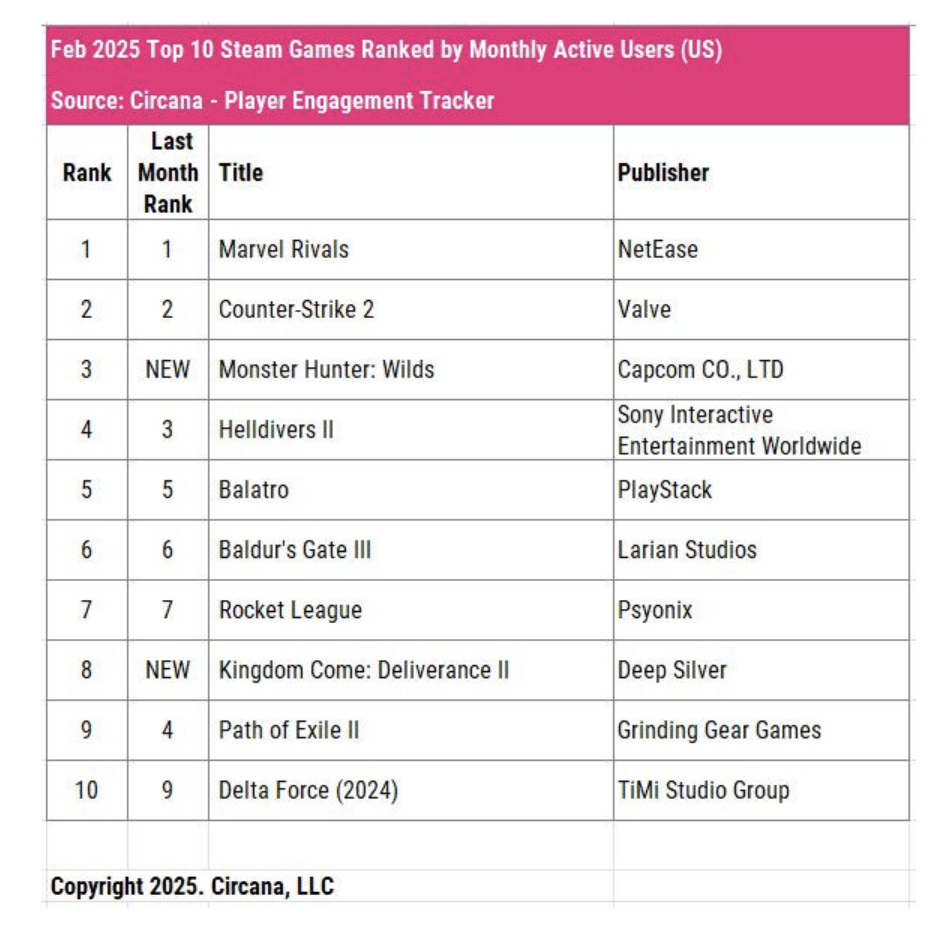
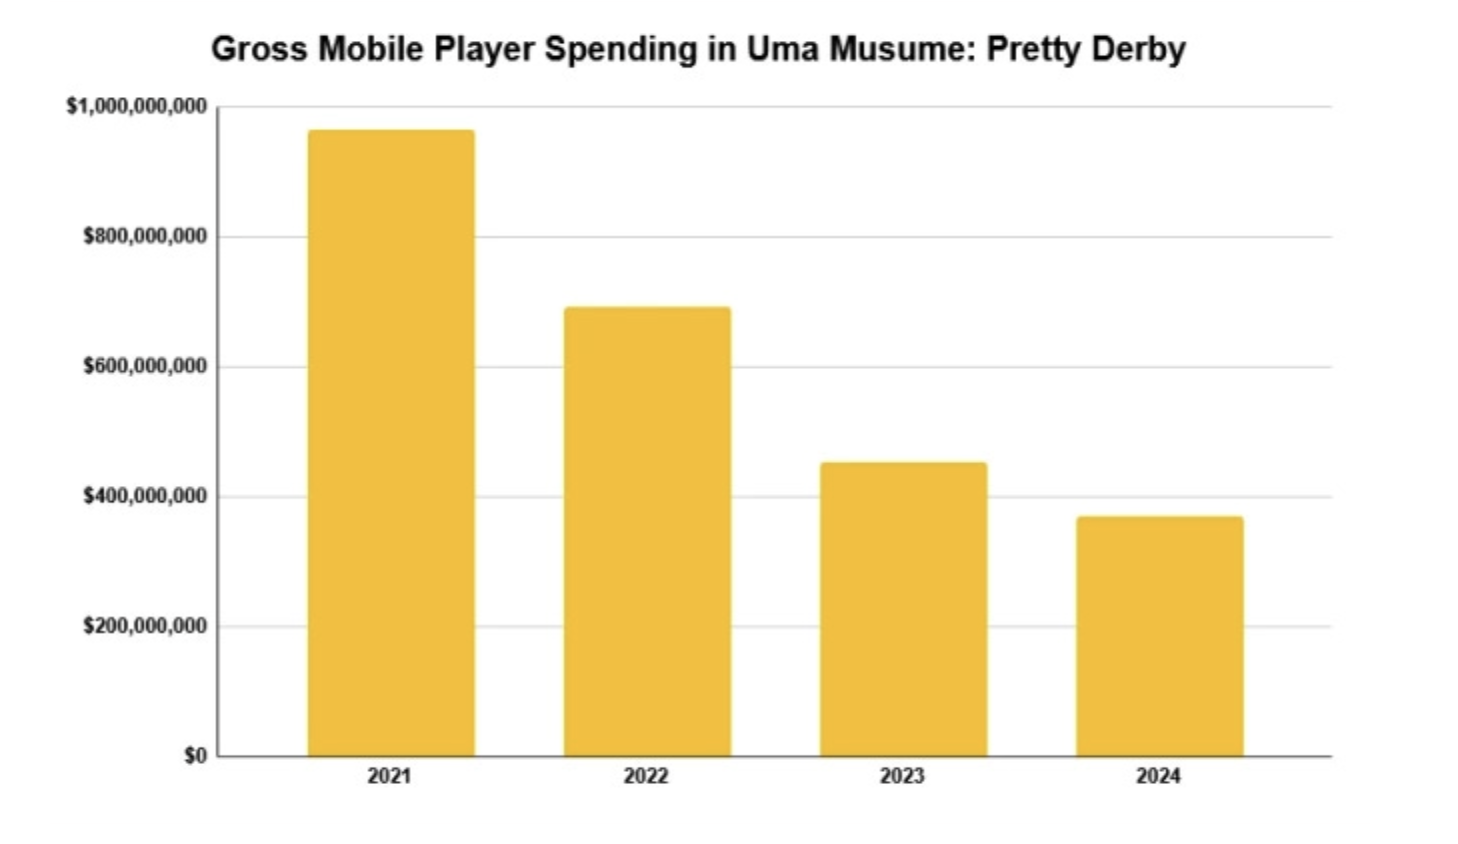
- On PC, the picture looks different. It's worth noting the long-term success of Marvel Rivals - it seems safe to say that the game has found its audience.
Games & Numbers (March 5 - March 25, 2025)

PC/Console Games
-
RuneScape has reached a revenue milestone of $2 billion. Over 300 million players worldwide have played the game. The first version of the project was released in 2001 as a browser game.
- The Ori series has been purchased over 15 million times.
- Monster Hunter Wilds was purchased 8 million times within three days of its release, setting a record for the series.
- The Final Fantasy Pixel Remaster series (re-releases of classic Final Fantasy games from the first to the sixth) has been purchased over 5 million times.
- Split Fiction sales exceeded 2 million copies in a week. The game is very popular in China (at least on Steam). It reached its first million copies in two days.
- The indie horror game R.E.P.O., according to VG Insights, was purchased 2.7 million times on Steam within a month of its release. Developers earned $20.3 million. The game is currently in early access.
- The audience for Cities: Skylines exceeds 45 million people. This amount has played the game since its release on March 10, 2015.
- Over 3 million people have played The Outlast Trials since its release.
- Over 2 million people have played Assassin's Creed Shadows. This includes not just sales, as the game is distributed for free as part of the Ubisoft+ Premium subscription.
- The audience for Predecessor has surpassed 2 million people.
Mobile Games
- Honkai: Star Rail, according to AppMagic, has surpassed $2 billion in revenue on mobile devices. It took less than two years to achieve this.
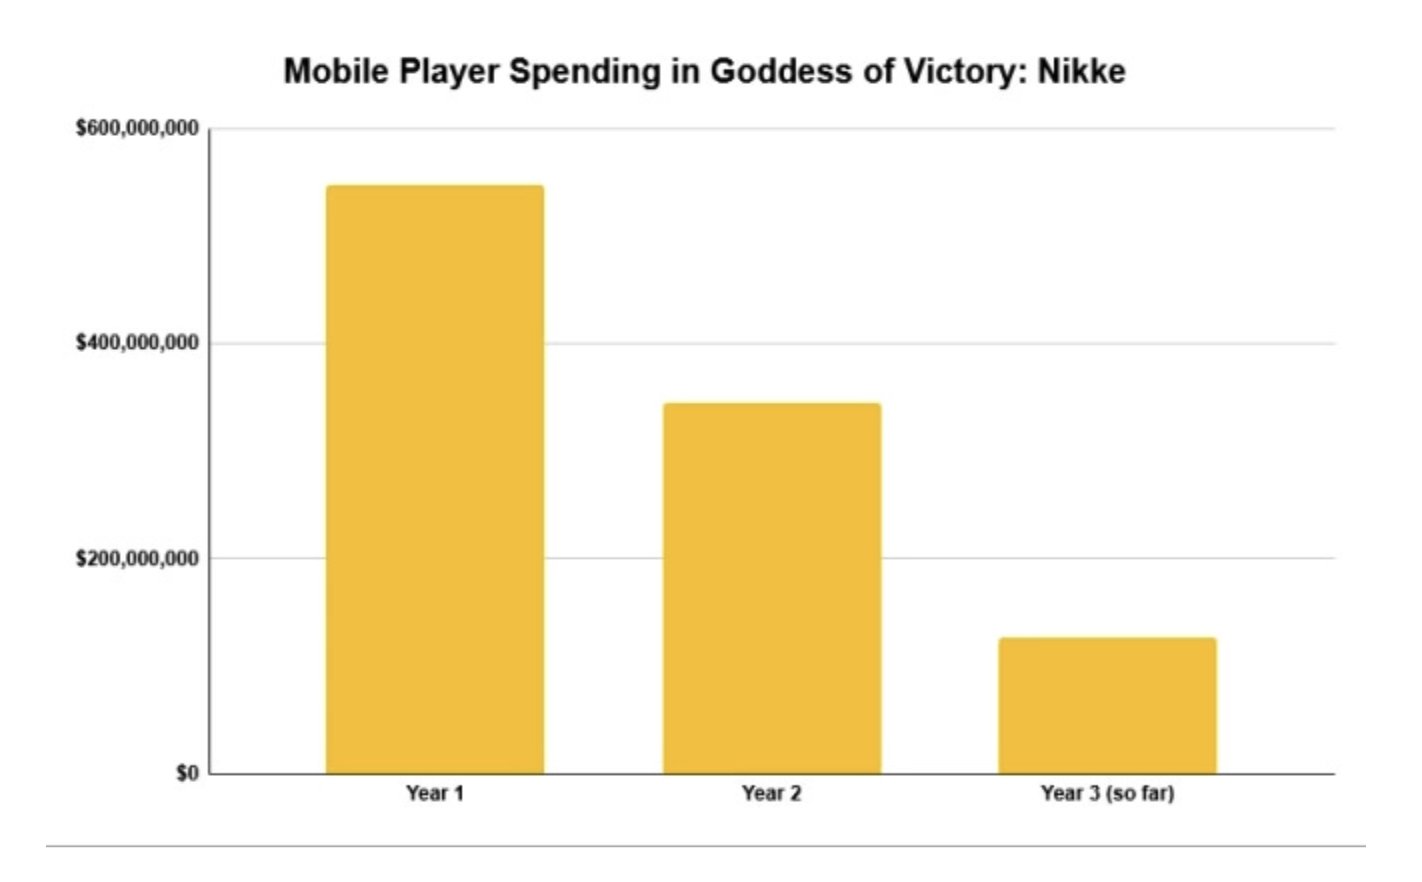
- Goddess of Victory: Nikke has earned over $1 billion in 2.5 years of operation.
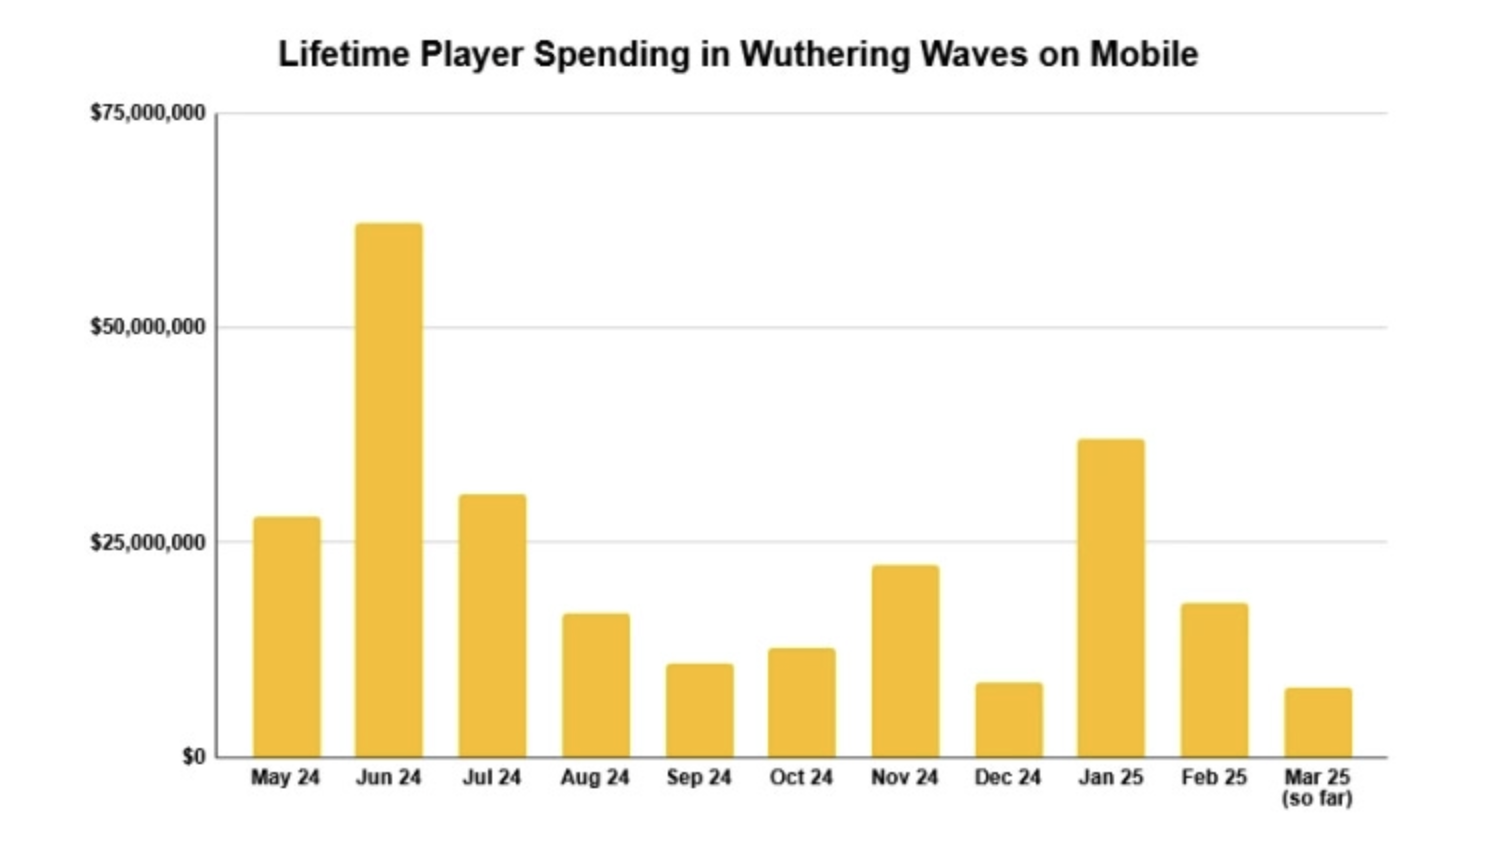
- Wuthering Waves has exceeded $250 million in gross revenue over nine months, according to AppMagic.
- Blood Strike from NetEase earned $22.9 million in its first year. The game has been downloaded over 60 million times. 30% of the project's revenue comes from the U.S., and it also performs well in emerging markets.
- Ludus: Merge Arena from Top App Games has surpassed 5 million players and $3 million in monthly revenue.
- In its first week after release, Mo.co earned $570,000 in gross revenue. The game was downloaded 2.5 million times. Data is from Sensor Tower.
- Games from Supersonic have been downloaded 6.2 billion times over five years. The studio shared this figure.
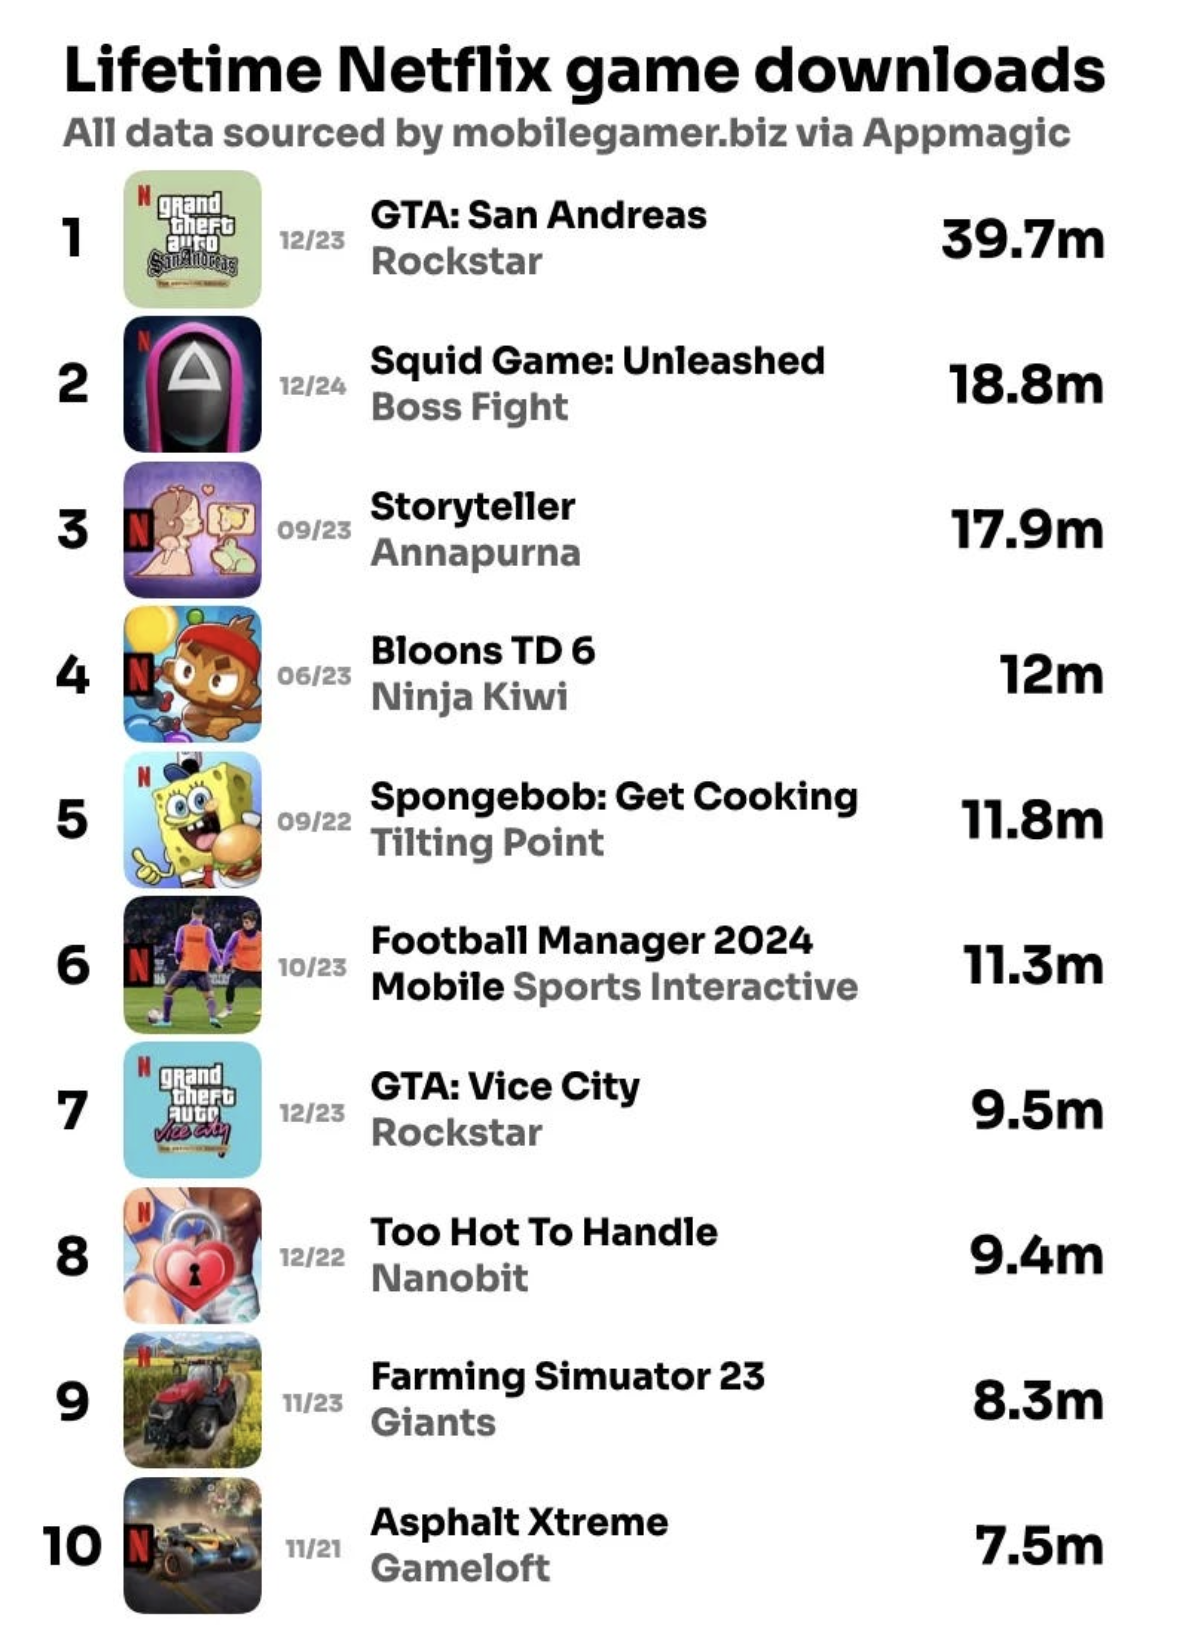
- Downloads of all Netflix games have reached 300 million installs. GTA: San Andreas has the most with nearly 40 million.
- Pokémon GO has over 20 million weekly active users nine years after its release. About half of the players log in every day. This data was shared in the context of a deal with Scopely.
StreamElements & Rainmaker.gg: The Streaming Market in February 2025
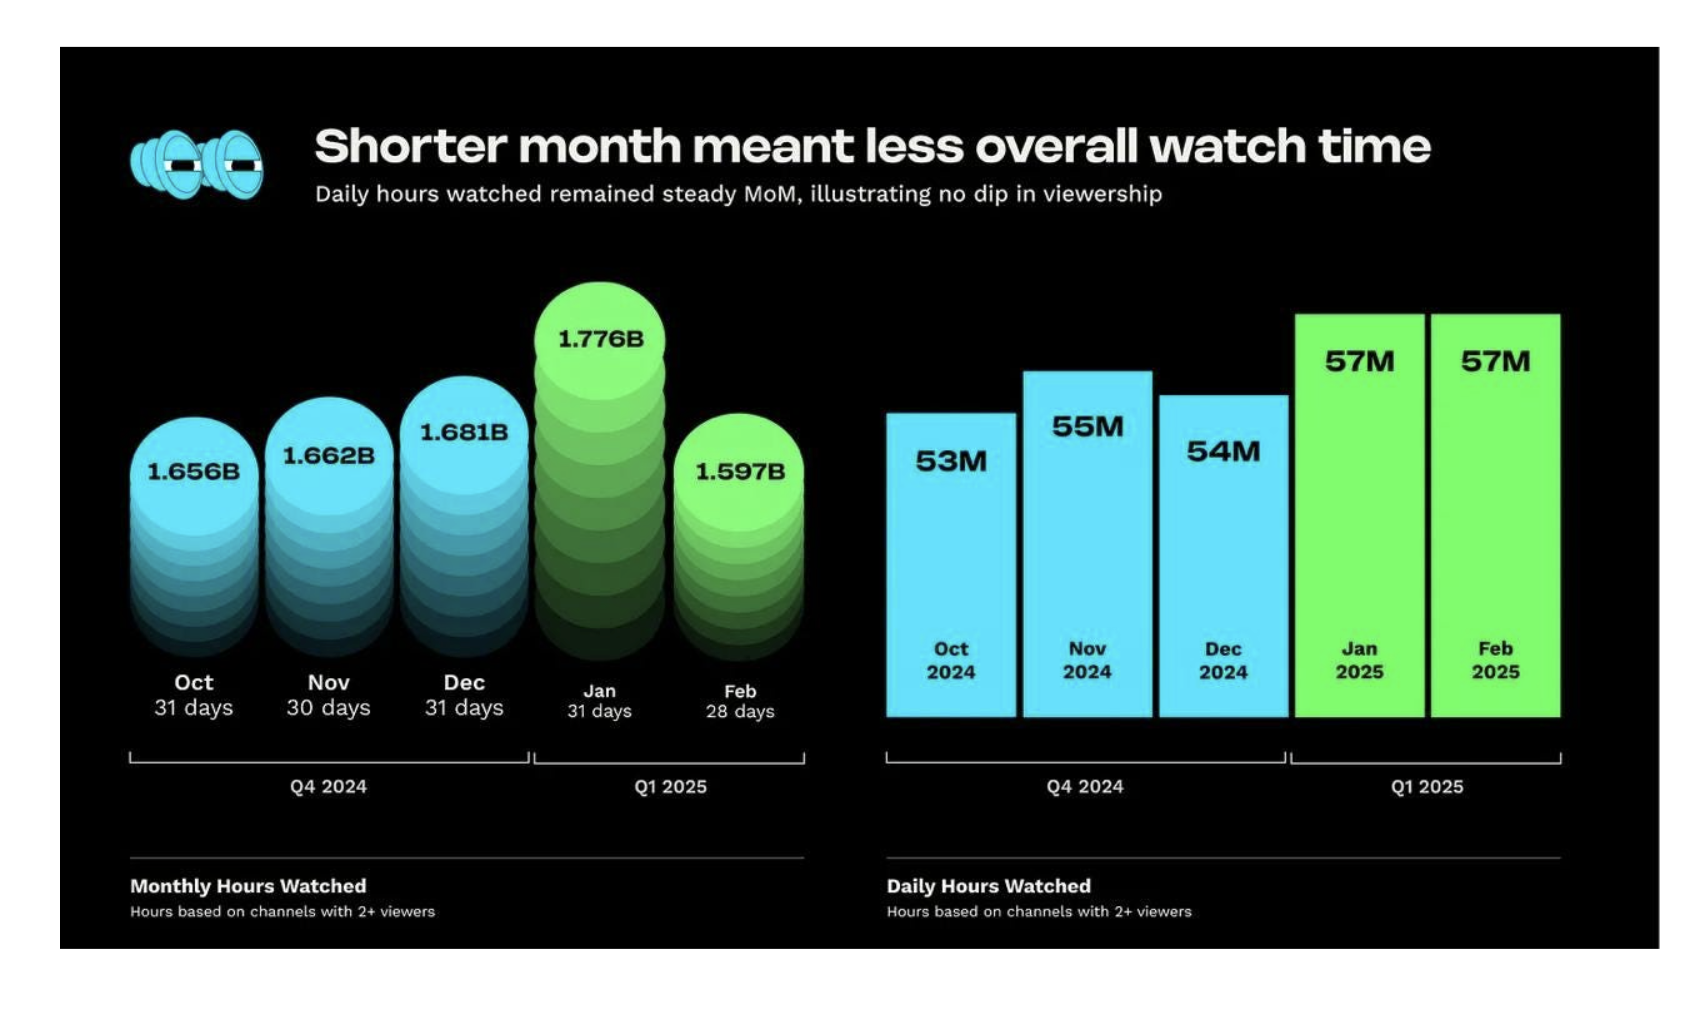
- In February 2025, daily content views on Twitch remained at January levels, with 57 million hours per day.
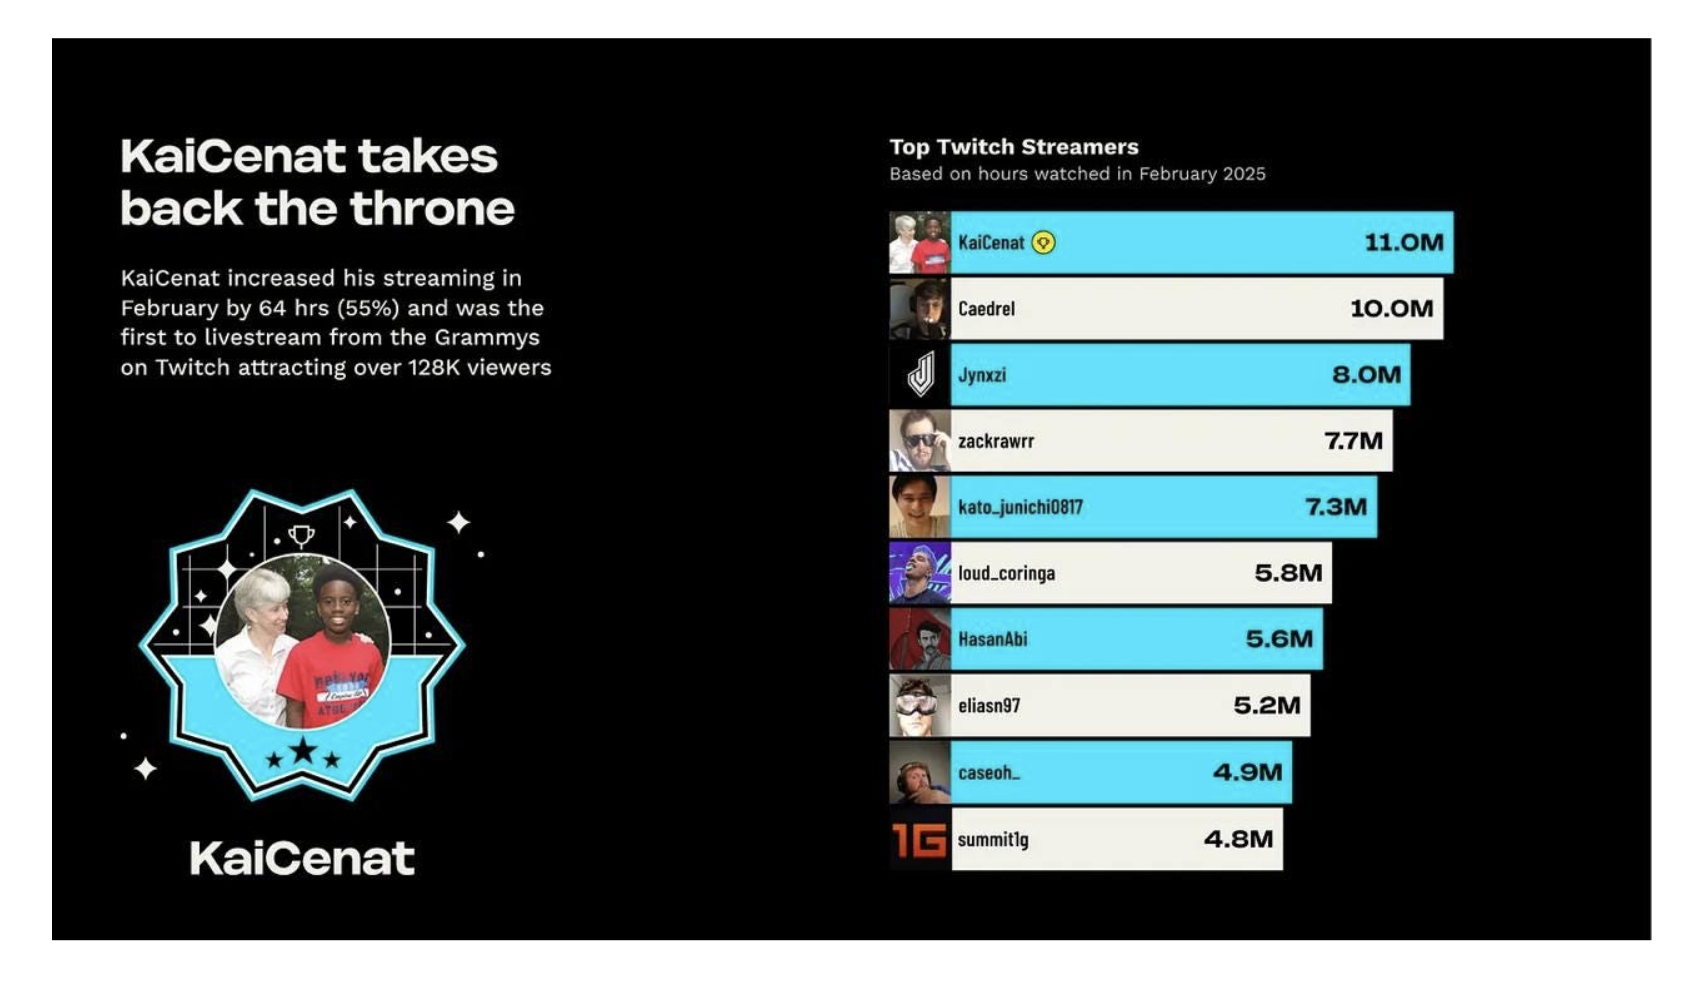
- Marvel Rivals maintained its position in the top 10 by viewership for the third consecutive month—a feat most recently launched projects have not achieved, typically lasting only two months. Although the project's viewing hours dropped by 51% compared to the previous month, this is a significant achievement.
- Grand Theft Auto V (89 million hours), League of Legends (89 million hours), and Counter-Strike 2 (68 million hours) were the most popular games on Twitch for the month.
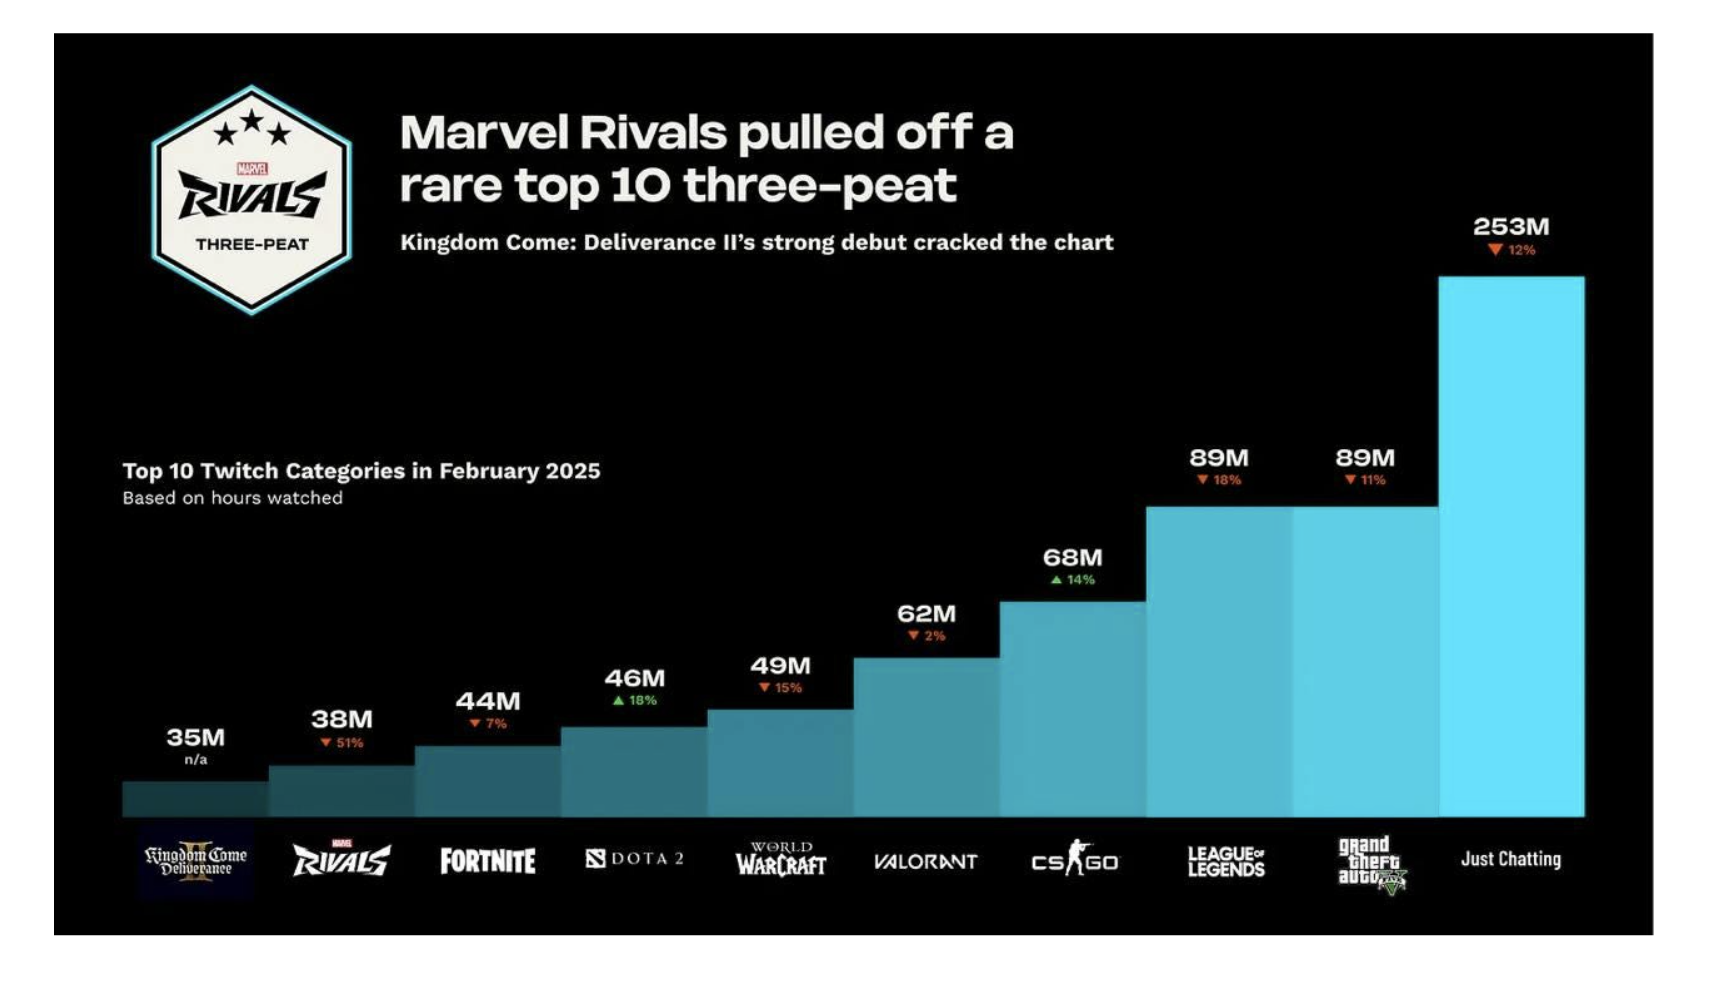
- Notably, Kingdom Come: Deliverance II also performed well, with 35 million hours of viewing and a spot in the top 10.
game: The German gaming market declined in 2024
- The total market volume was €9.405 billion at the end of 2024. This is 6% less than in 2023.
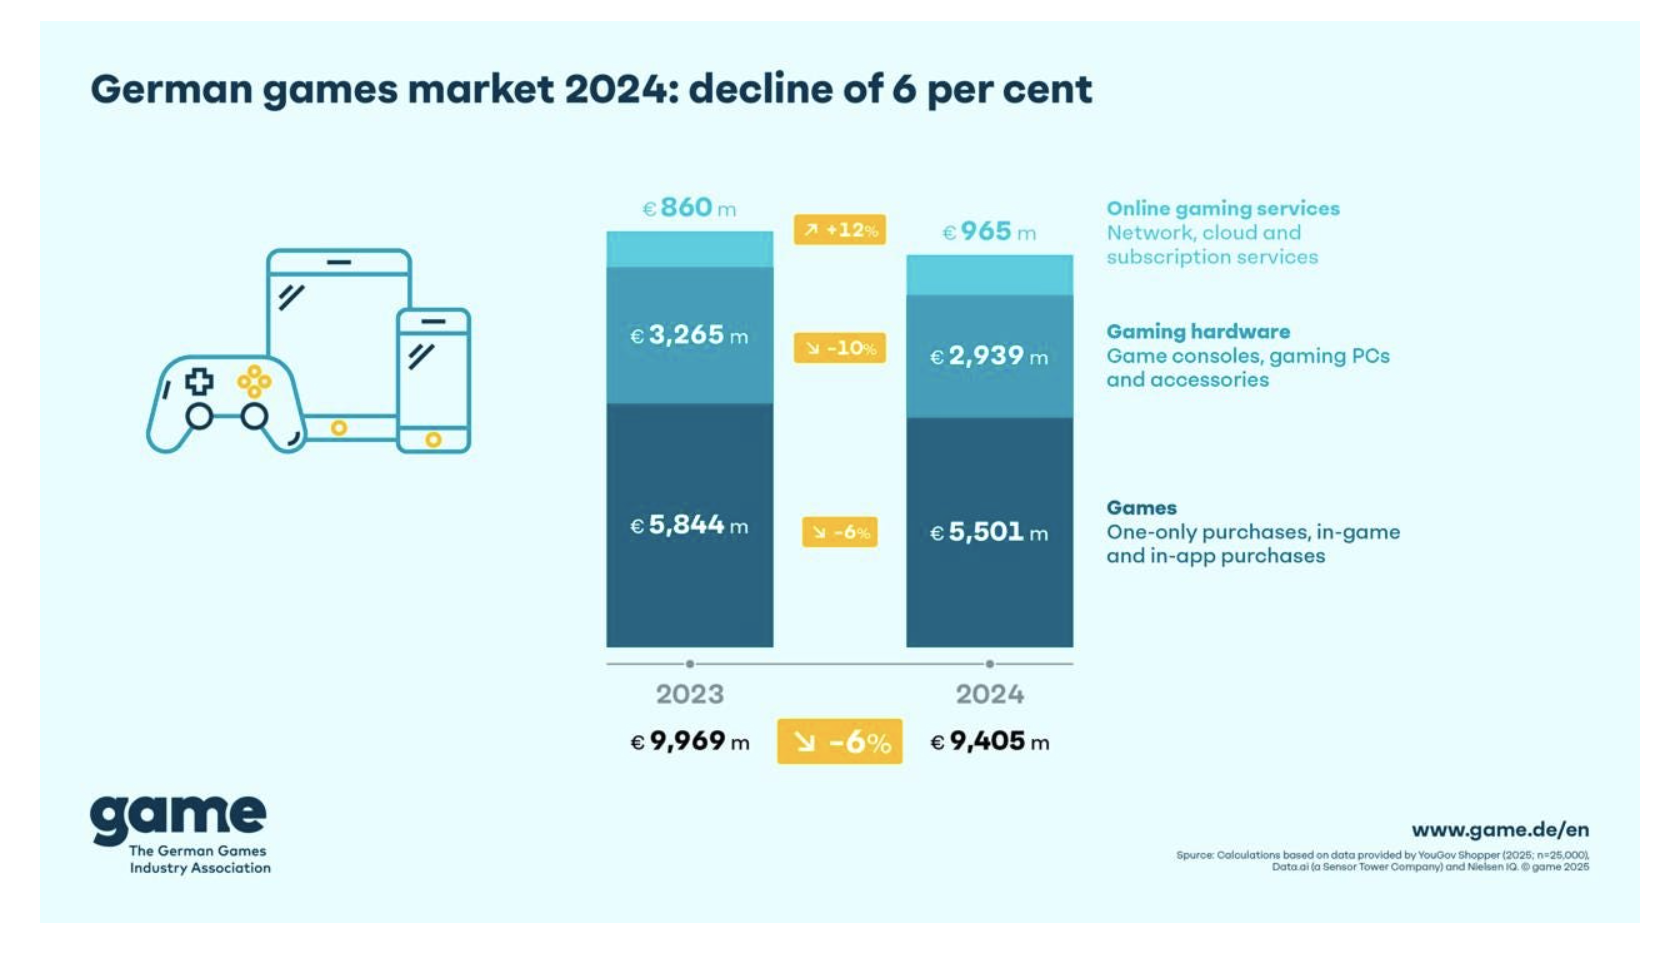
- Game sales fell by 6% to €5.501 billion (€5.844 billion in 2023).
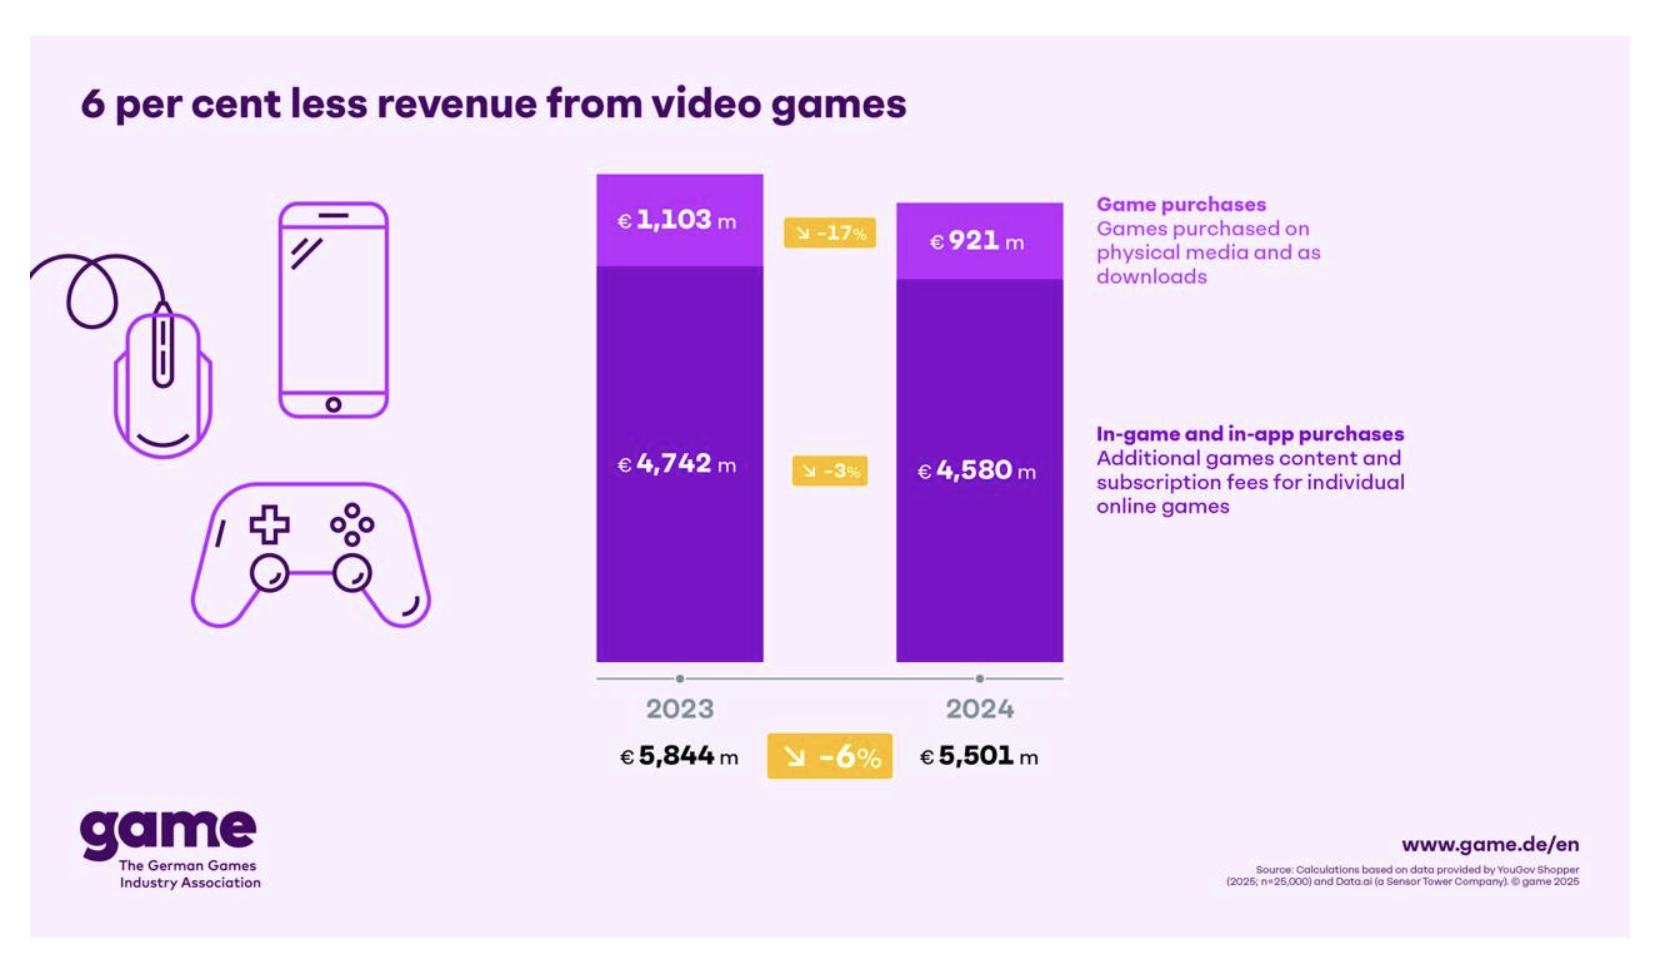
- Sales of games dropped the most, by 17% to €921 million. Revenue from microtransactions decreased less sharply, by 3% to €4.58 billion.
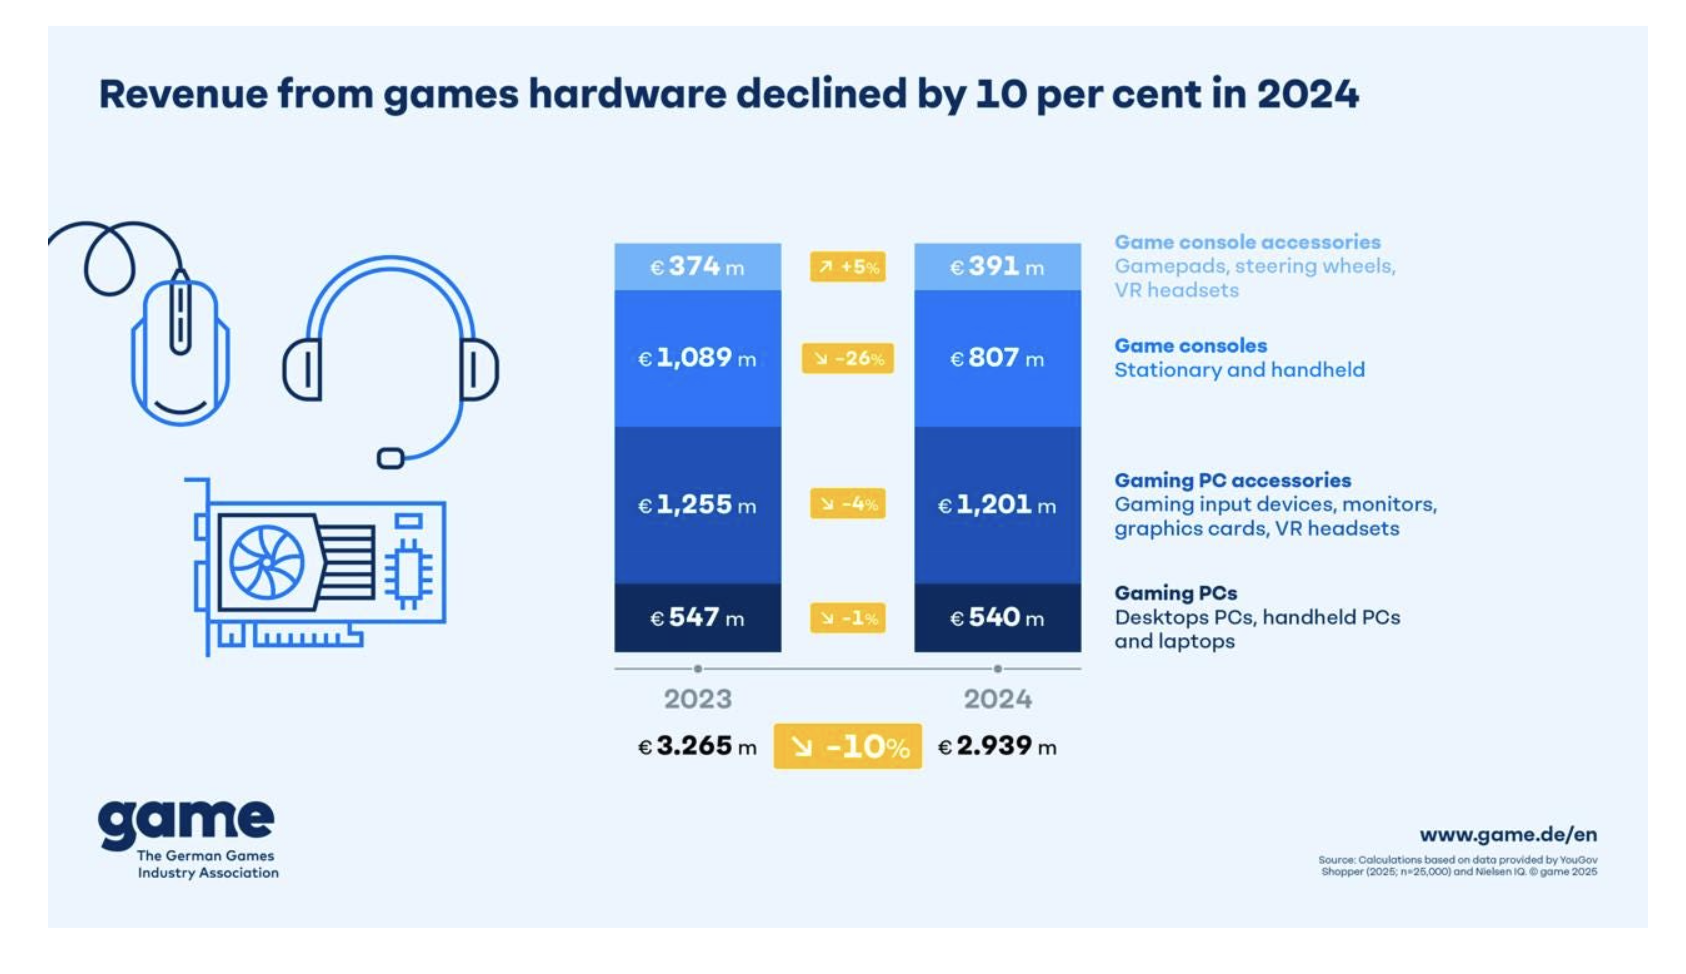
- Sales of gaming hardware decreased from €3.265 billion to €2.939 billion, a drop of 10%.
- The only segment that grew was the sales of console accessories, with a 5% increase to €391 million.
- Sales of gaming consoles fell by 26% (from €1.089 billion to €807 million). Sales of PC accessories decreased by 4% (from €1.255 billion to €1.201 billion). Sales of gaming computers dropped by 1% (from €547 million to €540 million).
- On the positive side, subscription service sales grew by 12% to €965 million.
Stay tuned for more updates next month!
Meanwhile, you can check out our free demo to see how devtodev can help your game project succeed.