
Retention is the percentage of users who return to your app or game on a specific day after installation. It's calculated for cohorts — groups of users who installed on the same day — and tracked at three key checkpoints: Day 1, Day 7, and Day 30.
Retention doesn't just measure loyalty. It determines audience size, LTV, and the efficiency of every dollar spent on acquisition. A product with strong retention can scale.
A product with weak retention can't be fixed by more UA. This glossary entry covers how retention is calculated, what benchmarks to use, and how to diagnose and improve it at each stage.
What Is Retention?
Retention answers one question: did users find enough value to come back?
It's expressed as a percentage of a cohort. If 1,000 users installed your app on January 1 and 300 of them opened it again on January 2, your Day 1 retention is 30%.
Retention is always cohort-based — you measure a specific group of users from a specific install date, not all users across all time. That's what makes it actionable: you can compare cohorts before and after a product change and see exactly what moved.
Learn more about retention rate in mobile apps →
How to Calculate Retention
Formula:
| Day N Retention = Users who launched the app on Day N / Users who installed N days ago × 100% |
|---|
Example: 1,000 users installed on January 1.
| Day from install | Users returned | Retention |
|---|---|---|
| Day 1 | 400 | 40% |
| Day 7 | 200 | 20% |
| Day 30 | 100 | 10% |
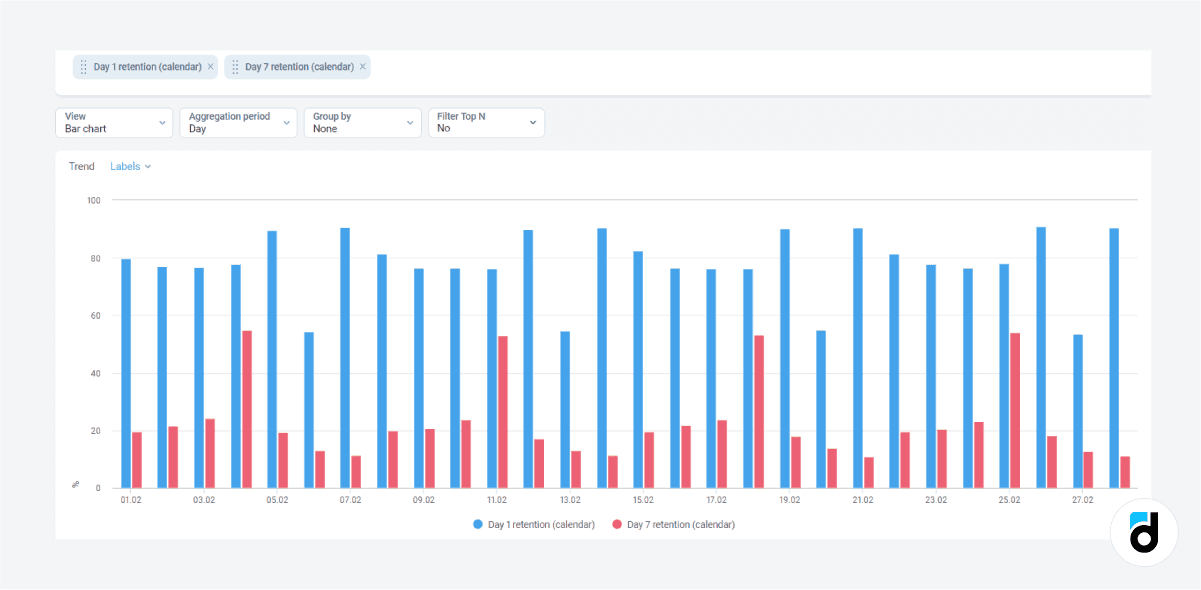
Screenshot: devtodev retention report showing Day 1 and Day 7 retention (calendar) as a bar chart by date — side-by-side comparison across cohorts.
Retention is calculated separately for each cohort and each day. A user who installed on January 1 and returned on January 8 contributes to that cohort's Day 7 retention — not to any other cohort.
Day 1, Day 7, and Day 30 Retention
These three checkpoints are the industry standard because they diagnose different problems.
Day 1 Retention measures first impression. Did users understand the product and find enough value to come back the next day? D1 is almost entirely determined by onboarding and FTUE. If D1 is low, fix the first session before doing anything else.
Day 7 Retention measures the engagement loop. Users who return on Day 7 have formed a habit — or at least found a reason to keep coming back. D7 is influenced by core gameplay mechanics, notification strategy, and the depth of the product experience.
Day 30 Retention measures long-term value. Users who are still active on Day 30 have integrated the product into their routine. D30 is where monetization health shows up — if paying users are churning before Day 30, your LTV is lower than it looks.
What Is a Good Retention Rate for Mobile Games and Apps?
For mobile games:
| Casual / Hyper-casual | Mid-core | Hard-core / RPG | |
|---|---|---|---|
| Day 1 | 25–35% | 35–45% | 40–50% |
| Day 7 | 8–15% | 15–25% | 20–30% |
| Day 30 | 2–6% | 6–12% | 10–18% |
For mobile apps:
| Utility / Productivity | Social | Subscription | |
|---|---|---|---|
| Day 1 | 25–35% | 30–40% | 40–55% |
| Day 7 | 10–20% | 15–25% | 25–40% |
| Day 30 | 5–10% | 8–15% | 20–35% |
These are industry averages based on aggregated market data. Your numbers will vary depending on genre, region, platform, and monetization model.
How to Measure Retention in devtodev
Retention in devtodev is calculated for daily, weekly, and monthly cohorts. You can compare cohorts side by side — for example, users who installed before vs. after a major update — to measure the real impact of product changes.
Two calculation methods are available:
Classic retention — counts users who returned on exactly Day N. Strict and precise.
Rolling retention — counts users who returned on Day N or any day after. Always higher than classic retention, and useful for products where users don't visit daily.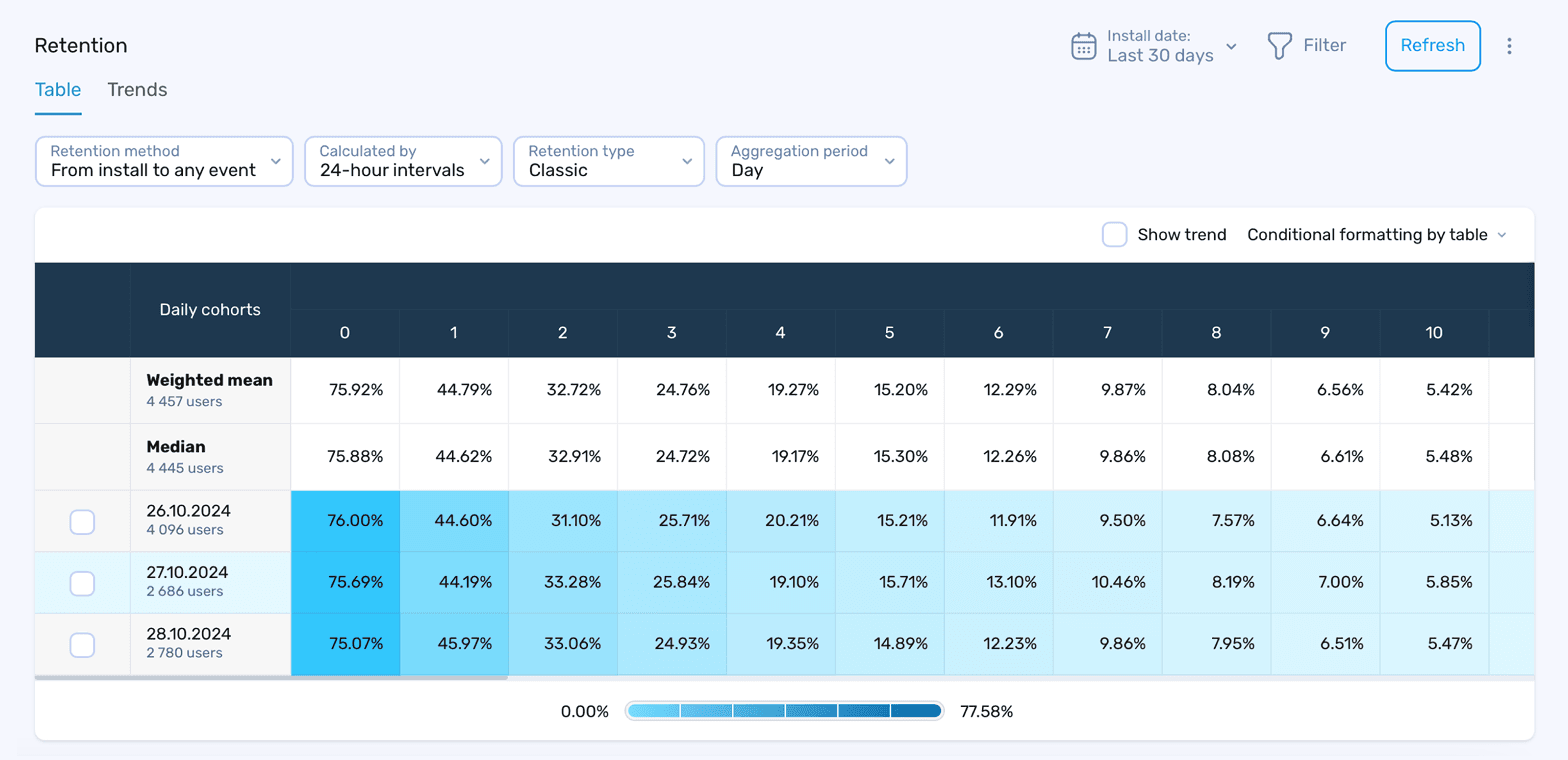
Screenshot: Retention report in devtodev — Classic retention by 24-hour intervals showing daily cohorts with Weighted mean and Median. Retention method, calculation type, and aggregation period are all configurable.
Learn more about the difference between classic and rolling retention →
What Affects Retention?
Retention is a downstream metric — it reflects the quality of every upstream decision.
Onboarding quality drives D1. If users don't reach the aha moment in the first session, they won't come back. Tutorial length, first-session depth, and time-to-value all feed into D1 retention directly.
Core loop strength drives D7. A strong core loop gives users a reason to return daily — a new level, a daily reward, a social interaction. Weak D7 almost always points to a thin or repetitive core loop.
Monetization balance affects D30. Aggressive monetization — too many ads, paywalls that block progress, or offers that feel exploitative — accelerates churn among long-term users. D30 retention drops when paying users feel pushed out.
Notification strategy supports all three. The right push at the right time brings users back. The wrong push at the wrong time trains them to ignore — or uninstall.
How to Improve Retention
D1 is low: audit your onboarding funnel step by step. Find the drop-off point and remove the friction. Delay sign-up, shorten the tutorial, and make the first action produce a visible result. A/B test changes before shipping.
D7 is low: strengthen the core loop. Add a daily incentive, deepen the social layer, or introduce a progression system that creates a reason to return tomorrow. Check push notification open rates — if they're below 5%, the messaging isn't relevant enough.
D30 is low: review monetization pressure for users past Day 14. Check ARPPU trends — if it's declining among 30-day users, they're spending less before leaving. Look at feature adoption: are long-term users actually using what you built for them?
For all stages: segment by acquisition channel. Users from different sources retain at very different rates. A channel that looks efficient on CPI might be sending low-retention users who inflate early metrics and disappear by Day 7.
Learn more about how to identify and re-engage churned users →
Takeaways
- Retention is the percentage of users from a cohort who return on a specific day after installation — calculated separately for D1, D7, and D30.
- Each checkpoint diagnoses a different problem: D1 = onboarding, D7 = engagement loop, D30 = monetization balance.
- Retention is always cohort-based. Compare cohorts before and after product changes to measure real impact.
- Benchmarks vary by genre and app type — casual games retain differently than subscription apps or RPGs.
- Segment retention by acquisition channel. Low-CPI channels often send low-retention users that hurt long-term metrics.
- Fix D1 before D7, fix D7 before D30 — each stage depends on the one before it.
See your retention cohorts and find where users drop off. Explore devtodev →