
Paying conversion measures how effectively your app turns new users into paying customers. It's calculated as the percentage of users from a cohort who made at least one purchase within a given period.
For product teams, it's the primary signal of monetization funnel health — where in the user journey are you losing potential payers?
For UA teams, it benchmarks channel quality — channels that bring users who never convert aren't delivering value regardless of CPI. This glossary entry covers how to calculate paying conversion, what affects it, and how to diagnose and improve it.
What Is Paying Conversion?
Paying conversion measures the percentage of users who make at least one in-app purchase. It's almost always calculated for cohorts — groups of users who installed during the same period — so you can track how conversion evolves over time from install date.
A user counts as converted the moment they make their first purchase — whether that's on Day 1 or Day 60. Paying conversion for a cohort grows over time as more users eventually pay, which is why comparing cohorts at the same point (e.g., Day 30 paying conversion) matters for fair comparison.
Formula:
| Paying Conversion = Paying Users / New Users × 100% |
|---|
Example: 100 users installed your app. 3 made a purchase within 30 days. Day 30 paying conversion = 3%.
Learn more about paying conversion →
What Is a Good Paying Conversion Rate?
Industry averages for F2P mobile games:
| Genre | Typical paying conversion |
|---|---|
| Hyper-casual | 0.5–1.5% |
| Casual (match-3, puzzle) | 1–3% |
| Mid-core | 2–5% |
| Hard-core / RPG | 3–8% |
| Subscription apps | 5–15% (trial-to-paid) |
These are industry averages based on aggregated market data. Your numbers will vary by region, platform, price point, and monetization model.
A 2% paying conversion in hyper-casual is strong. The same number in a mid-core RPG is below average. Context determines whether your number is a problem.
What Affects Paying Conversion?
Offer timing. The single biggest lever. Showing an offer too early — before users understand the product's value — kills conversion. Too late, and users have formed a habit of playing for free. The optimal moment varies by genre: typically after users experience a core loop 3–5 times, or at the first natural difficulty spike.
Price point. Lower price points convert more users but may reduce ARPPU. The right price isn't always the cheapest — it's the one that maximizes revenue per cohort. Test with A/B testing before committing.
Offer design. Value perception matters more than price. A $2.99 starter pack that clearly solves a problem the user just experienced converts better than a generic $0.99 offer. First-purchase offers that provide obvious immediate value are the highest-converting IAP format.
Onboarding quality. Users who complete the tutorial and reach the core loop convert at significantly higher rates than those who churn early. Paying conversion and D1 retention are closely linked — fix retention first.
Traffic quality. Users from different acquisition channels convert at very different rates. A channel with high install volume but 0.2% paying conversion is bringing users who never intended to spend. Segment paying conversion by channel before drawing conclusions from the aggregate.
How to Analyze Paying Conversion
Track first payment conversion vs. repeat payment conversion. First payment conversion shows how well your product convinces new users to spend. Repeat payment conversion shows whether paying users find ongoing value. Both matter — a product that converts well on first purchase but loses payers after one transaction has a different problem than one that struggles to get the first purchase.
Measure time to first payment. When do users make their first purchase? If 70% of first purchases happen within the first 3 days, your monetization is front-loaded — you're capturing impulse buyers. If first purchases are distributed across 30+ days, users need time to build value perception. Each pattern requires different offer timing strategy.
Compare paying conversion by cohort. Did paying conversion improve after you changed the paywall? Compare the Day 30 paying conversion of cohorts who installed before and after the change. That's the only reliable way to measure the impact of a monetization update.
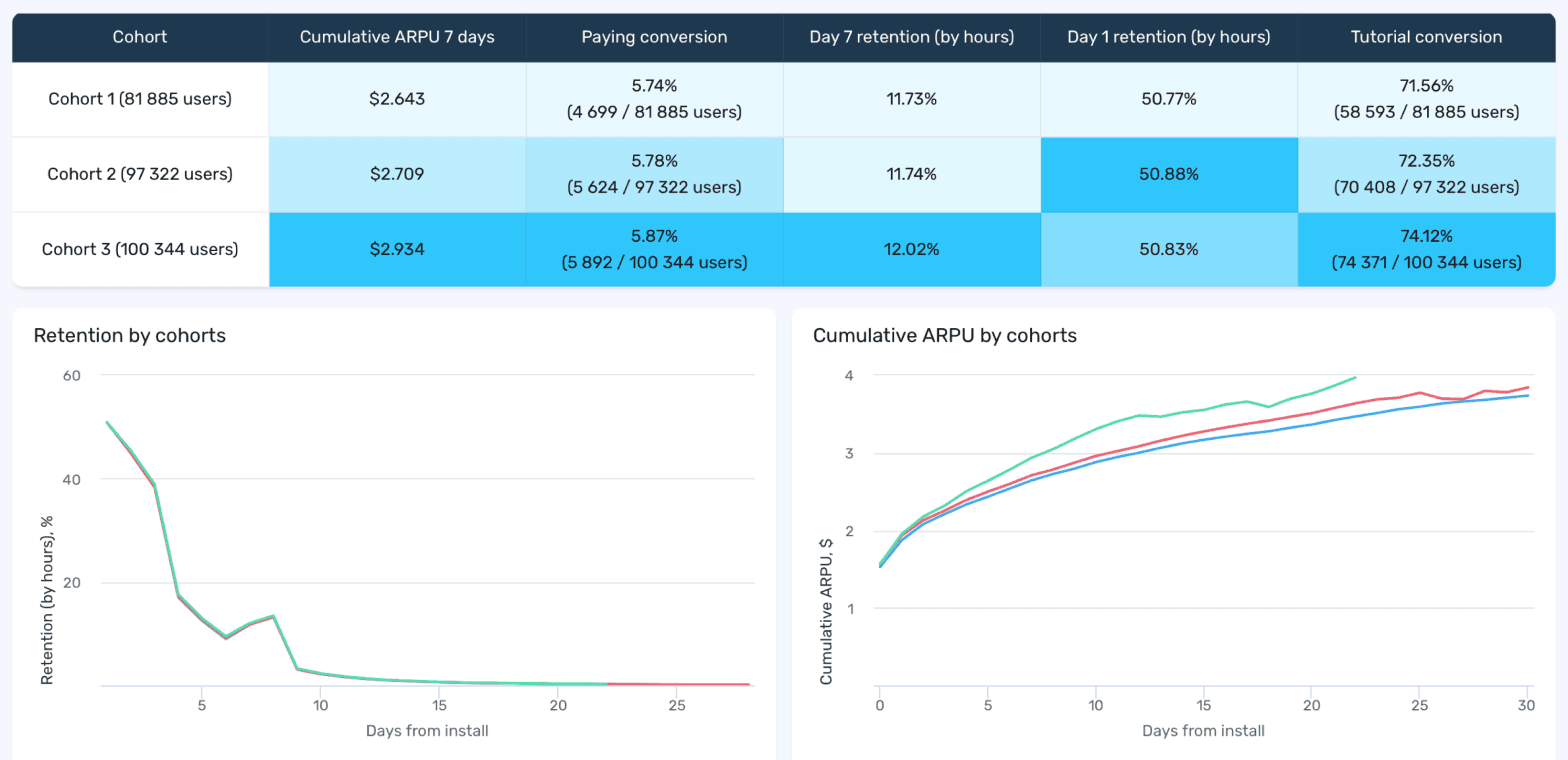
Screenshot: devtodev cohort report — paying conversion grows from 5.74% in Cohort 1 to 5.87% in Cohort 3, confirming that recent cohorts convert better. Cumulative ARPU follows the same trend.
Learn more about exploring game analysis with devtodev monetization →
Paying Conversion vs Paying Share
These two metrics are often confused:
| Paying Conversion | Paying Share | |
|---|---|---|
| Definition | % of a cohort who ever paid | % of current active users who paid |
| Time reference | From install date | Current period (day, week, month) |
| Best for | Monetization funnel analysis | Audience composition snapshot |
| Rises when | More new users convert | More active users are payers |
Use paying conversion to evaluate onboarding and first-purchase funnel. Use paying share to understand the composition of your current active audience.
Takeaways
- Paying conversion = paying users / new users × 100%. Always calculate for cohorts at a fixed point (e.g., Day 30).
- Industry average for F2P games: 1–5%. Context by genre matters more than the absolute number.
- The biggest lever is offer timing — show the right offer after users experience the product's core value.
- Track time to first payment: when users convert tells you as much as whether they convert.
- Segment by acquisition channel — channels with low paying conversion aren't cheap, they're expensive.
- Distinguish paying conversion (cohort funnel) from paying share (active audience snapshot) — they answer different questions.
See your paying conversion by cohort, channel, and first-purchase timing. Explore devtodev →