
Cost Per Install (CPI) is the average amount spent on advertising to generate one app install. It's calculated by dividing total ad spend by the number of installs that spend produced.
For UA teams, CPI is the primary efficiency metric for acquisition campaigns. For product teams, it sets the ceiling on how much retention and monetization need to deliver to make acquisition profitable.
This glossary entry covers how CPI is calculated, what affects it, and how to use it alongside LTV and ARPU to make real acquisition decisions.
What Is CPI?
CPI measures the cost of acquiring one new user through paid advertising. It's the standard metric for evaluating mobile UA campaign efficiency — and one of the most commonly misread numbers in mobile growth.
A CPI of $1.50 sounds efficient. But if users from that campaign churn on Day 1 and generate $0.10 before leaving, the campaign is losing money on every install. CPI only makes sense in context — specifically, in relation to the revenue those users generate.
Learn more about CPI in mobile games →
How to Calculate CPI
Formula:
| CPI = Total Ad Spend / Number of Installs |
|---|
Example: You spent $15,000 on a campaign and got 5,000 installs. CPI = $3.
Simple to calculate — but the number itself tells you nothing about whether those installs were worth $3. That requires comparing CPI to downstream metrics.
What Affects CPI?
CPI varies significantly across platforms, regions, genres, and ad formats. The same campaign can produce very different CPIs depending on where and how it runs.
Platform. iOS CPI is typically higher than Android, especially in Tier-1 markets, due to stronger purchasing intent and Apple's privacy framework reducing targeting precision.
Region. Tier-1 markets (US, UK, Japan, Australia) have the highest CPIs. Tier-2 and Tier-3 markets are significantly cheaper — but often with lower ARPU, so the economics may not improve.
Genre. Hyper-casual games have lower CPIs due to broad appeal. Mid-core and hardcore games target narrower audiences, driving CPIs higher — but those users often generate more revenue.
Ad format. Rewarded video and playable ads typically convert better than banner or interstitial formats, affecting both CPI and user quality.
Competition. CPI rises during peak seasons (holidays, major game releases) as advertisers compete for the same inventory.
These are directional patterns based on market dynamics. Actual CPIs vary by campaign, creative, and audience.
CPI vs ARPU vs LTV: The Only Ratio That Matters
CPI is a cost. ARPU and LTV are revenue. The relationship between them determines whether the acquisition is sustainable.
Basic rule: LTV should be at least 3× CPI for healthy unit economics.
| CPI vs LTV | Meaning |
|---|---|
| LTV < CPI | Losing money on every install |
| LTV = 1–2× CPI | Marginally profitable |
| LTV = 3× CPI | Healthy — standard target |
| LTV > 3× CPI | Room to scale UA spend |
But LTV takes months to realize. For faster decisions, compare CPI to ARPU at Day 7 or Day 30 — early revenue signals that predict whether a cohort will be profitable.
Payback period = CPI / daily ARPU. If CPI is $2.00 and daily ARPU is $0.05, the payback period is 40 days. Know your payback period before scaling any channel.
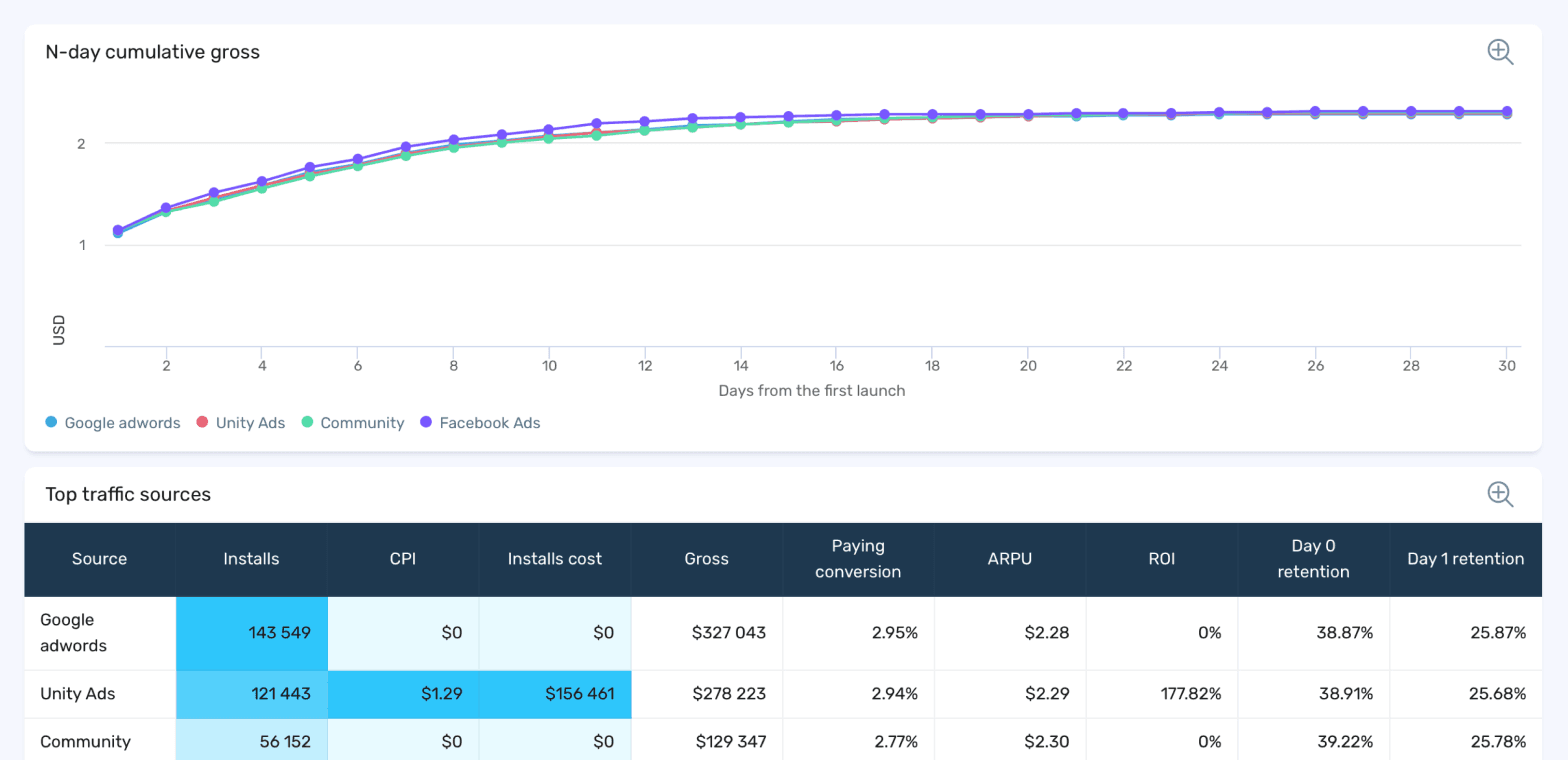
devtodev traffic sources report showing installs, CPI, gross revenue, ARPU, ROI, and Day 1 retention side by side for each acquisition channel.
How to Evaluate CPI by Channel
Not all installs are equal — and CPI alone won't tell you which channels are worth scaling.
Compare channels on a combination of metrics: CPI, D1 retention, D7 retention, paying conversion, and ARPU. A channel with CPI of $0.80 but 85% D1 churn is more expensive than a channel with CPI of $2.50 and 45% D1 churn — because the cheaper channel's users generate almost nothing before leaving.
In devtodev, the traffic sources report shows CPI, installs, gross revenue, ARPU, ROI, and Day 0/Day 1 retention side by side for each acquisition channel — so you can compare channel quality without building custom reports.
How to Reduce CPI Without Sacrificing Quality
Improve creatives. CTR is the fastest lever on CPI. Better creative — stronger hook, clearer value proposition, relevant format — reduces cost per click and cost per install simultaneously.
Test audiences. Broad targeting is expensive. Lookalike audiences based on your best-performing cohorts (high LTV, high retention) typically deliver better CPI and higher-quality users.
Diversify channels. Relying on one network drives CPIs up as you exhaust the best inventory. Spreading spend across networks keeps auction pressure down.
Improve store conversion. CPI includes the cost of users who clicked your ad but didn't install. A stronger app store page — better screenshots, clearer description, more reviews — converts more clicks into installs and reduces effective CPI.
Takeaways
- CPI = Total Ad Spend / Number of Installs. It measures acquisition cost, not acquisition value.
- A low CPI is only good if the users it brings generate revenue. Always evaluate CPI alongside LTV, ARPU, and retention.
- LTV should be at least 3× CPI for sustainable unit economics. Know your payback period before scaling.
- CPI varies by platform, region, genre, and ad format — compare within segments, not across them.
- Evaluate channels on CPI + D1 retention + paying conversion together. A cheap channel with high churn is an expensive channel.
- The fastest lever on CPI is creative quality — CTR improvement reduces cost across the entire funnel.
Find your CPI by channel alongside retention and revenue metrics — in one report. Explore devtodev →