
Devtodev is helping you keep in touch with what’s happening in the game market. Every month we publish an overview of reports on the most popular games worldwide, top-grossing games, successful releases, favorite video game types, trends, etc. This overview was prepared by Dmitriy Byshonkov, the author of the GameDev Reports by the devtodev Telegram channel. You can also read the October and November reports.
Contents
- AppMagic: Top Mobile Games by Revenue and Downloads in November 2024
- Chinese App Store created a $531B turnover in 2023
- Midia Research: Gamers watch games more than they play them
- AppsFlyer: Mobile game monetization in Q3'24 in North America and T1 Western countries
- Consumer Technology Association: Almost 29 million people in the US are hardcore gamers
- Famitsu: PlayStation 5 Pro sales in Japan in November are twice as high as regular PS5 versions
- Games & Numbers (November 27 - December 10; 2024)
- ChainPlay & Storible: 93% of GameFi Projects are Dead
- Raj Patel: There've been more layoffs in 2024 than in 2022 and 2023 combined
- China Audio-Video and Digital Publishing Association: Chinese gaming market reached record highs in 2024
- Omdia: Xbox Series S|X sales lag behind Xbox One increased in the system’s 5th year of life
- DataEye Research Institute: The mini-game market in China will reach $6.86 billion in 2024
- Circana: US Gaming Market in November 2024
- Newzoo: Top 20 PC/console games of November 2024 by Revenue and MAU
- StreamElements & Rainmaker.gg: Twitch in 2024
- Games & Numbers (December 11 - December 24; 2024)
- GSD & GfK: Game sales in the UK in November 2024 fell by 33%
- SuperJoost: 154 million people watched The Game Awards 2024
- DFC Intelligence: There won’t be room for three consoles in the gaming industry
- IGEA: Australian Gaming Industry in FY 2024
- Steam users spent only 15% of their time on games released in 2024
AppMagic: Top Mobile Games by Revenue and Downloads in November 2024

AppMagic provides revenue data after deducting store commissions and taxes.
Revenue
-
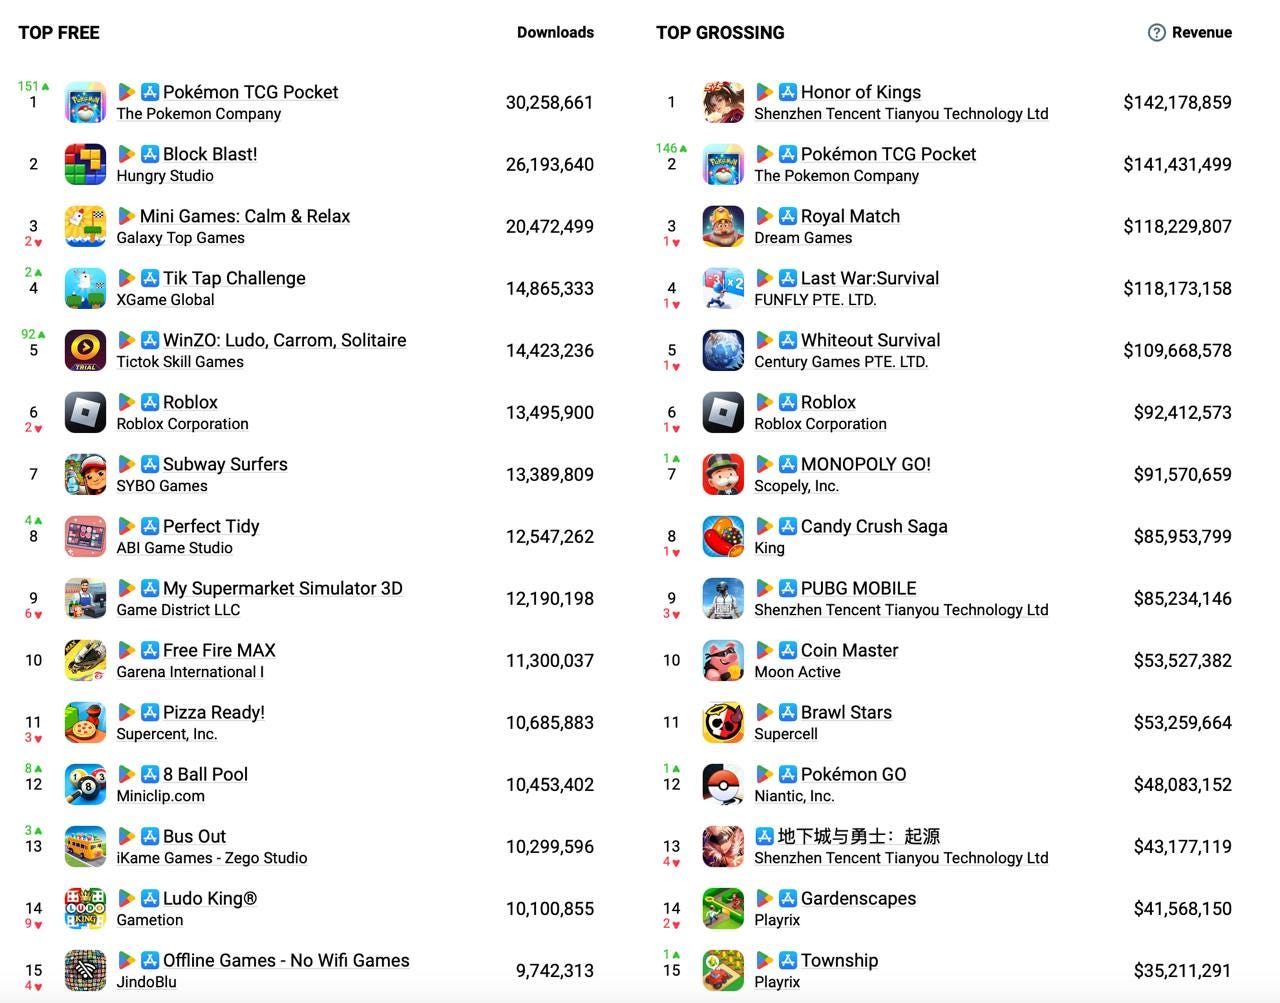
Honor of Kings is the revenue leader for November. The game earned $142.2 million, 97% coming from iOS in China.
- The main event in the revenue chart is the appearance of Pokemon TCG Pocket. The game earned $141.4 million in the first full month (just short of first place). 42% of the revenue comes from Japan; 27% from the USA. The RPD in Tier-1 Asian countries is $19.42; in Tier-1 Western countries, this figure is significantly lower at $3.79.
- Otherwise, the November revenue chart can hardly be called dynamic. There are no major changes.
Downloads
- Pokemon TCG Pocket became the leader in downloads in November - the game was downloaded more than 30 million times.
- Block Blast! is in second place (26.2 million installs); Mini Games: Calm & Relax is in third place (20.5 million).
- WinZO: Ludo, Carrom, Solitaire burst into 5th place - this is a set of various games from an RMG (Real Money Gaming) developer, but without the need to play for real money. It is positioned as an app where you can hone your skills for free. 99% of downloads are from India.
Chinese App Store created a $531B turnover in 2023

The research was shared by Ju Heng, an associate professor at the Shanghai University of Finance and Economics Business School. This includes all applications, not just games.
- The turnover of the iOS app ecosystem is $531 billion (3.76 trillion yuan). This includes not only sales of in-game content but also sales of goods, services, and advertising within apps - for which Apple does not charge a commission. Retail apps earned the most (about 67% of this amount).
❗️For conversion to dollars, I used the average exchange rate for 2023.
- 91% of this amount ($483.2 billion) are purchases of physical goods or services through apps (not subject to commission). 5% ($26.55 billion) is advertising, also not subject to commission. Finally, 4% ($21.24 billion) is revenue from digital goods purchases and subscriptions (what Apple charges a commission for).
- At the same time, the study notes that most apps pay a 15% commission under the Small Business Program. This means their revenue from digital goods is no more than $1 million per year.
- Ju Heng notes that the App Store ecosystem has grown 2.3 times in turnover since 2019.

- In 2023, more than 70% of Chinese developers worked for the global market.
- Apps from Chinese developers were downloaded more than 8 billion times in 2023. 26% of this number were international downloads. In 2018, the share of international downloads was 12%.
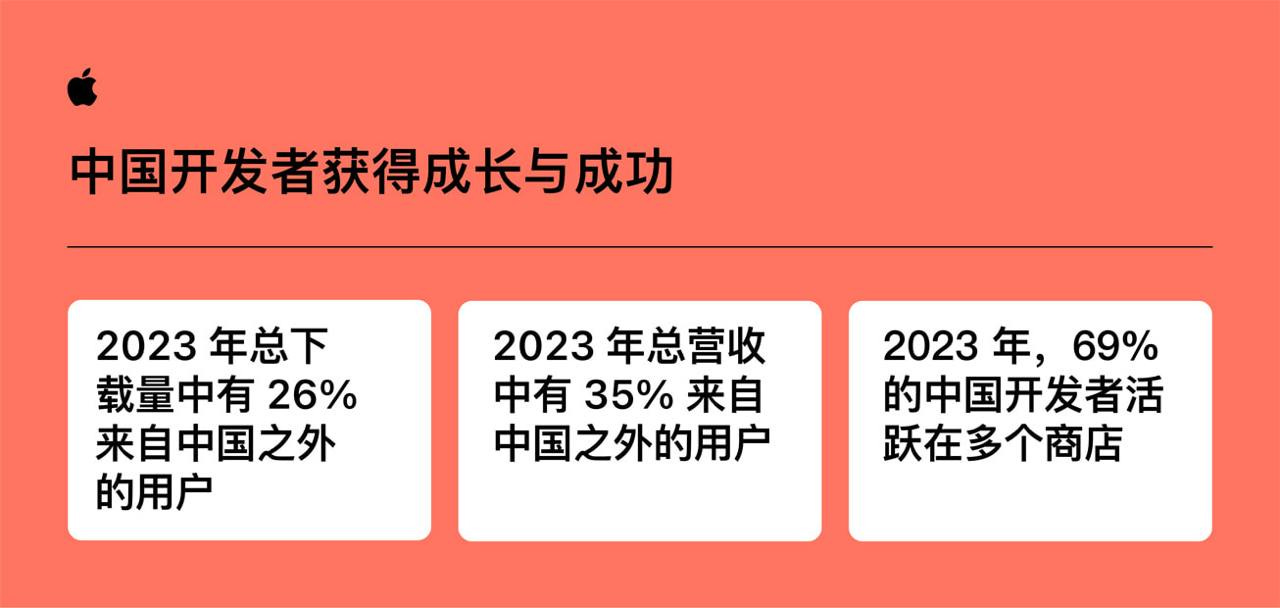
- 90% of all downloads and 95% of turnover in China came from apps by local developers in 2023.
Midia Research: Gamers watch games more than they play them

The survey included players from the USA, Canada, UK, Germany, France, Sweden, Brazil, South Korea, and Australia.
- Gamers spend about 7.4 hours per week playing games.
- However, they spend 8.5 hours per week watching game-related video content on YouTube and Twitch.
- At least once a month, 24% of PC/console gamers watch videos about games. Paying users watch more content about games - among them, 48% have watched gaming content at least once in the last month. This may be because they are generally more engaged.
AppsFlyer: Mobile game monetization in Q3'24 in North America and T1 Western countries

AF analyzed aggregated data based on $130 million IAP revenue; $40M subscription revenue, and $900M advertising revenue. All data is for Q3’24. North America and Tier-1 Western countries were considered.
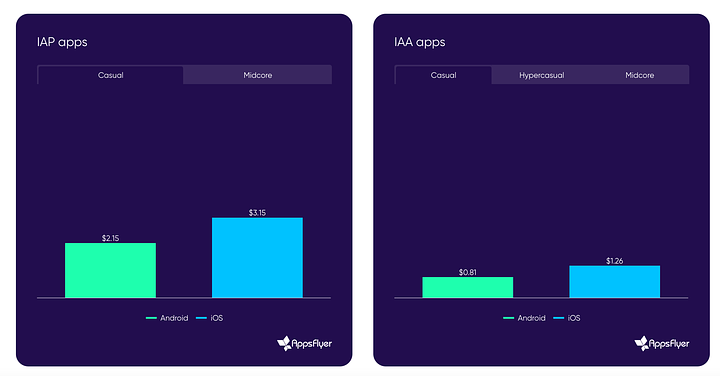
D90 ARPU by monetization models and genres
-
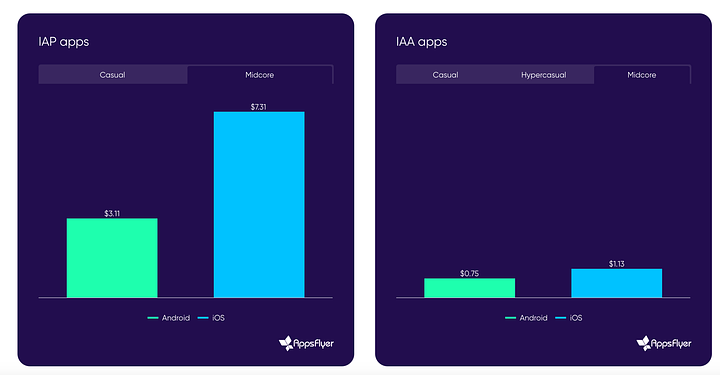
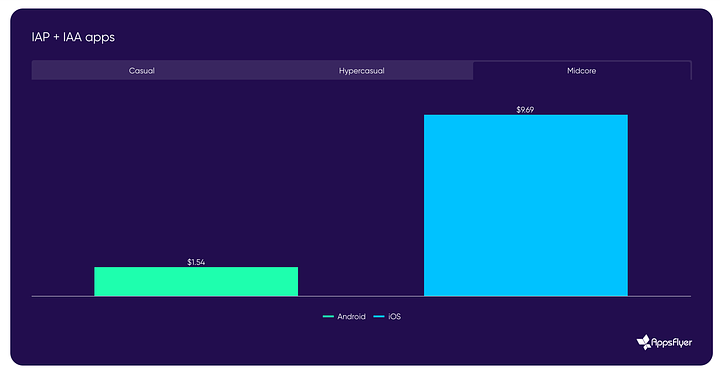
AF data for Tier-1 Western markets shows that projects with hybrid monetization demonstrate the best results in D90 ARPU on iOS. Their D90 ARPU is $9.69 (iOS) and $1.54 (Android) in mid-core projects. For comparison, mid-core projects with only IAP monetization have a D90 ARPU of $7.31 on iOS and $3.11 on Android.
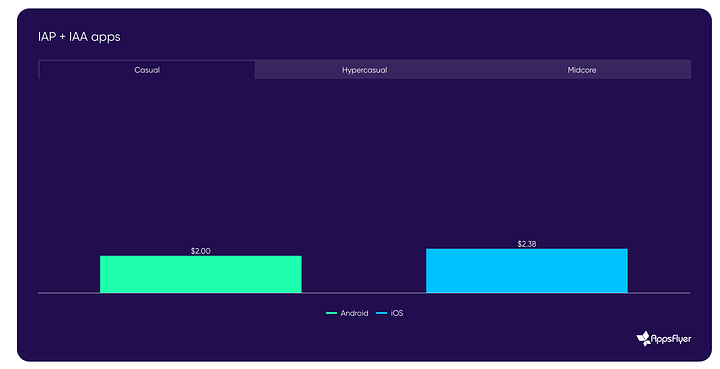
- IAP monetization currently performs best in casual games with the same set of parameters (Tier-1 Western countries; D90 ARPU). On iOS, D90 ARPU is $3.15; on Android - $2.15. In projects with hybrid monetization, the metric on iOS is $2.38; on Android - $2. Games with IAA monetization show the weakest results - $1.26 (iOS) and $0.81 (Android).
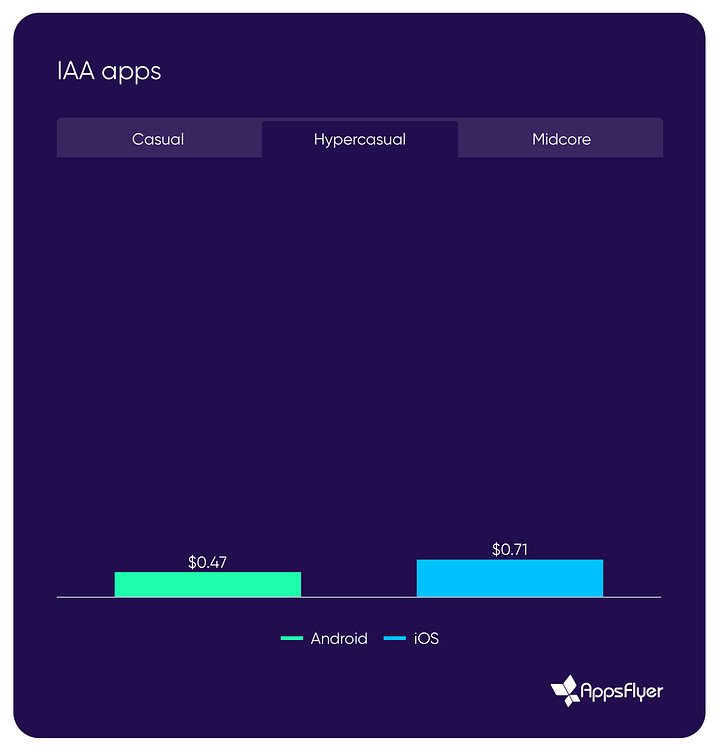
- Interestingly, in hyper-casual projects, it’s not clear that hybrid monetization works better. D90 ARPU in projects with hybrid monetization is $0.82 on iOS and $0.6 on Android. Meanwhile, in projects with only advertising monetization, the metric is $0.71 on iOS and $0.47 on Android.
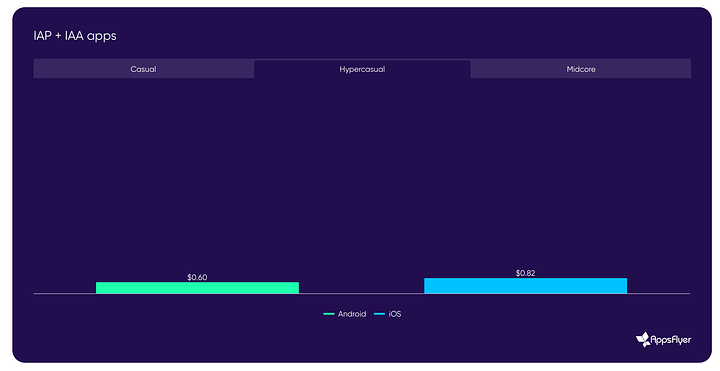
❗️ Most likely, this difference is related to taxonomy. Hybrid-casual games might be counted in the casual games category.
ROAS by genres and monetization types
-
AppsFlyer shows that casual projects with only IAP monetization achieve 215% D90 ROAS on iOS in T1 Western markets. Or they note that mid-core projects with hybrid monetization demonstrate 122% D30 ROAS on Android.
❗️This section raises more questions than answers. Such returns may occur in exceptional cases - in the best projects or the most successful campaigns. Based on the projects and metrics I’ve seen (hundreds of games in different genres), I’ve hardly seen such metrics from almost anyone. Therefore, I recommend treating the figures in this particular section skeptically.
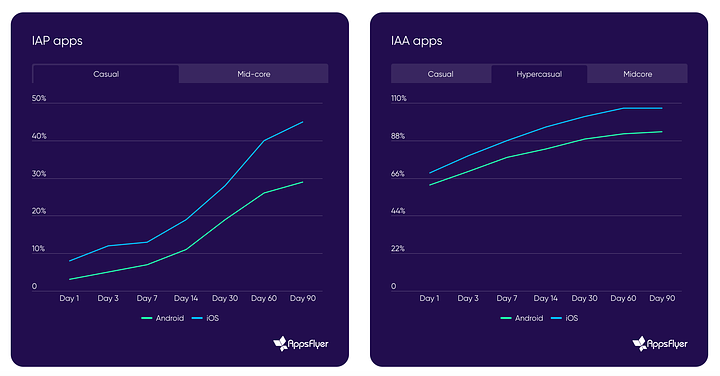
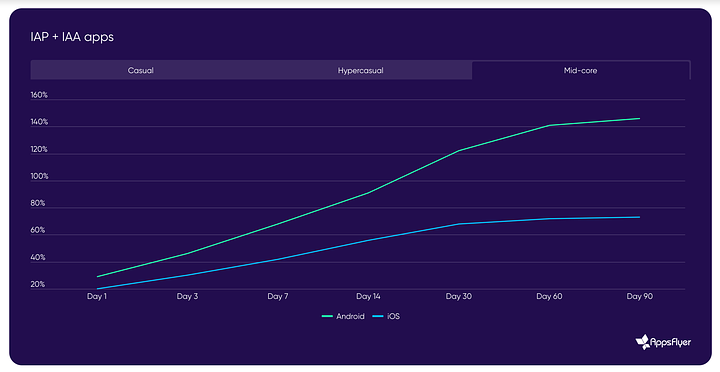
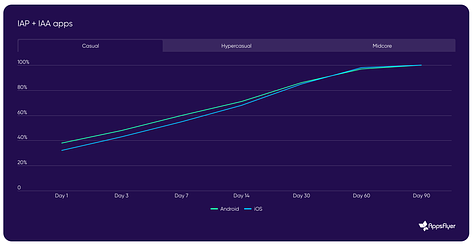
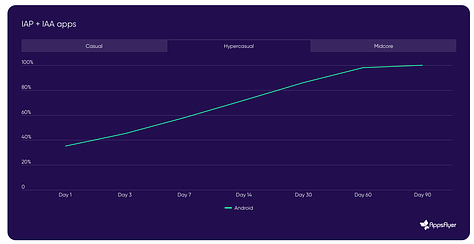
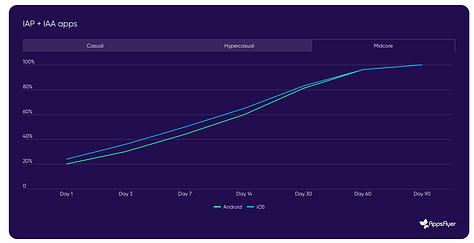
Revenue accumulation in the first 90 days by genres and monetization types
-
65-66% of all revenue in casual projects with IAP monetization comes in the first 30 days. In mid-core games, 84-85% of all revenue comes in the first 30 days.
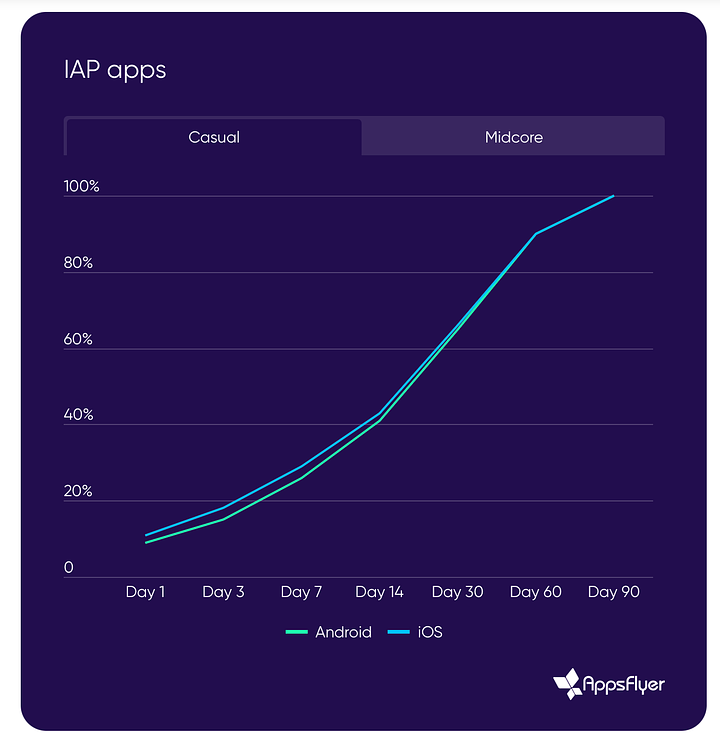
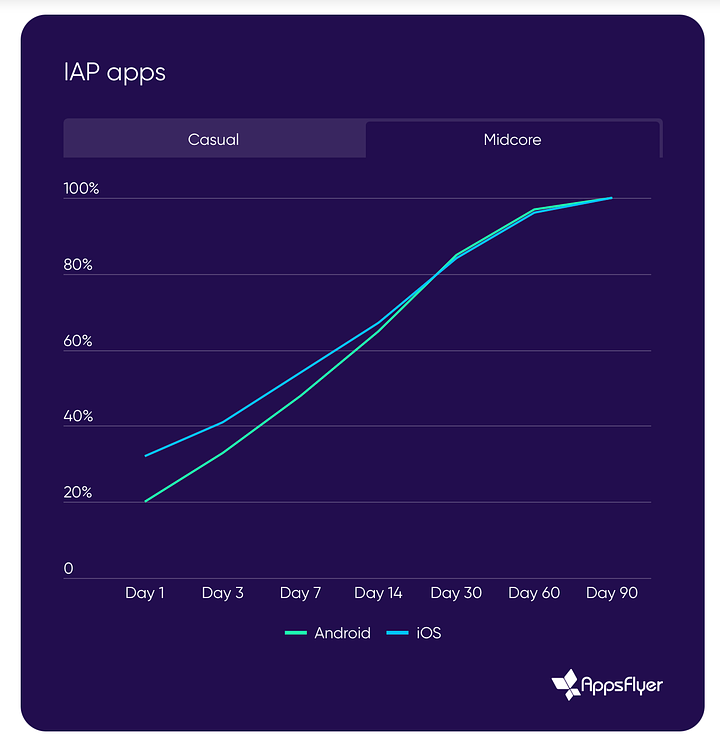
❗️The simple conclusion is that if your users don’t pay in the first weeks of the game, there’s a very high probability they won’t pay later.
- In projects with advertising monetization, regardless of genre, about 85-95% of all revenue for 90 days comes in the first 30 days.
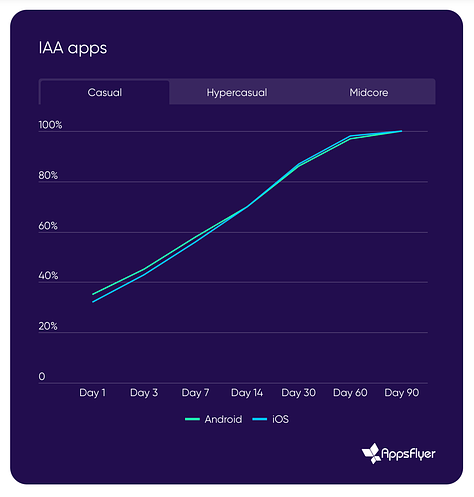
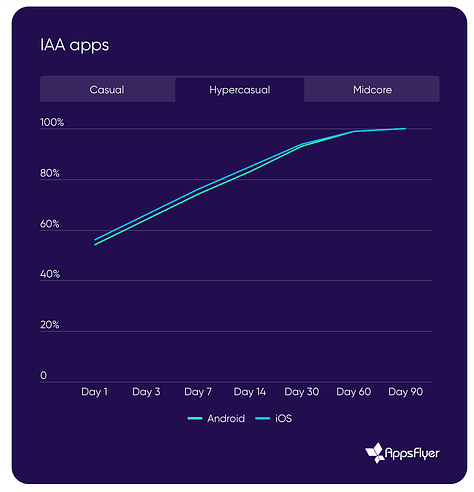
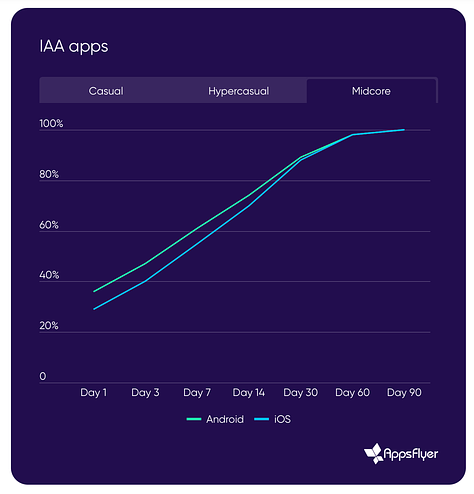
- Similarly in projects with hybrid monetization. Regardless of genre, 81-86% of all revenue for 90 days accumulates in the first 30 days.
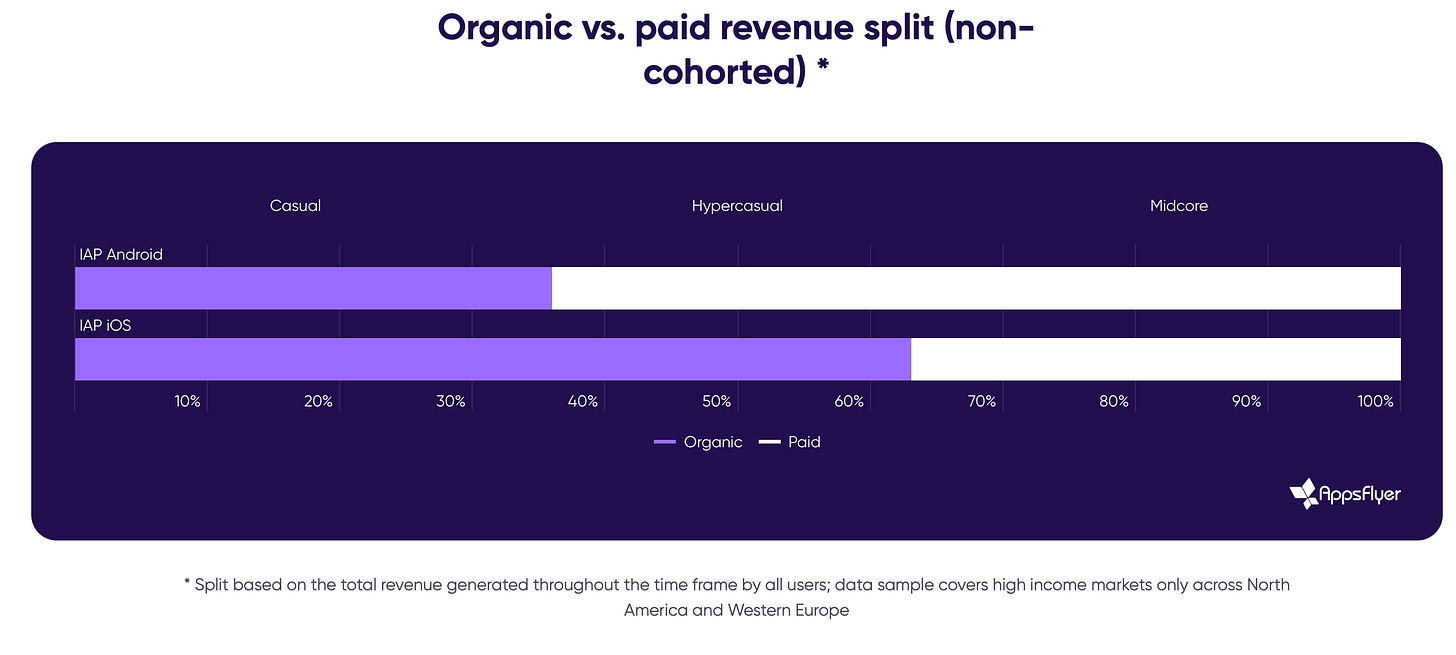
Revenue distribution between organic and paid traffic by genres
-
Purchased users bring 72-76% of all revenue for 90 days in hyper-casual and casual genres - regardless of the type of monetization.
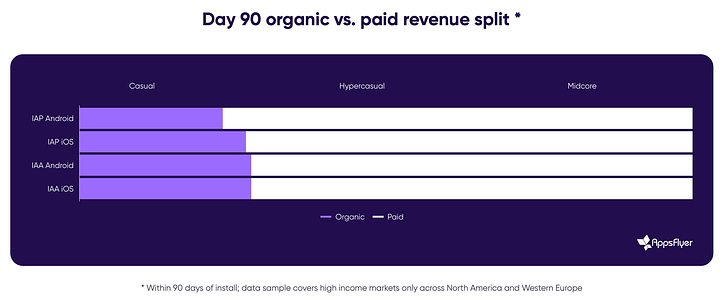
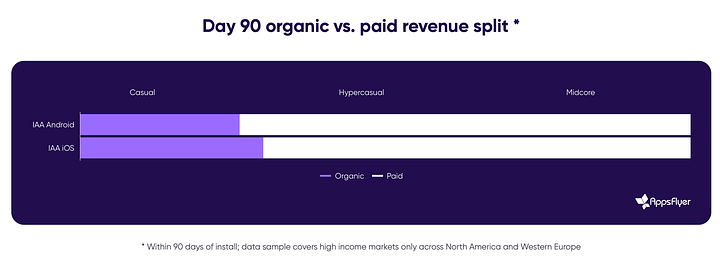
- In mid-core projects with IAP monetization, most of the cohort revenue for 90 days comes from organic users (56-61%). Where the focus is on IAA monetization, the share of organic in the revenue structure is from 28% to 37%.
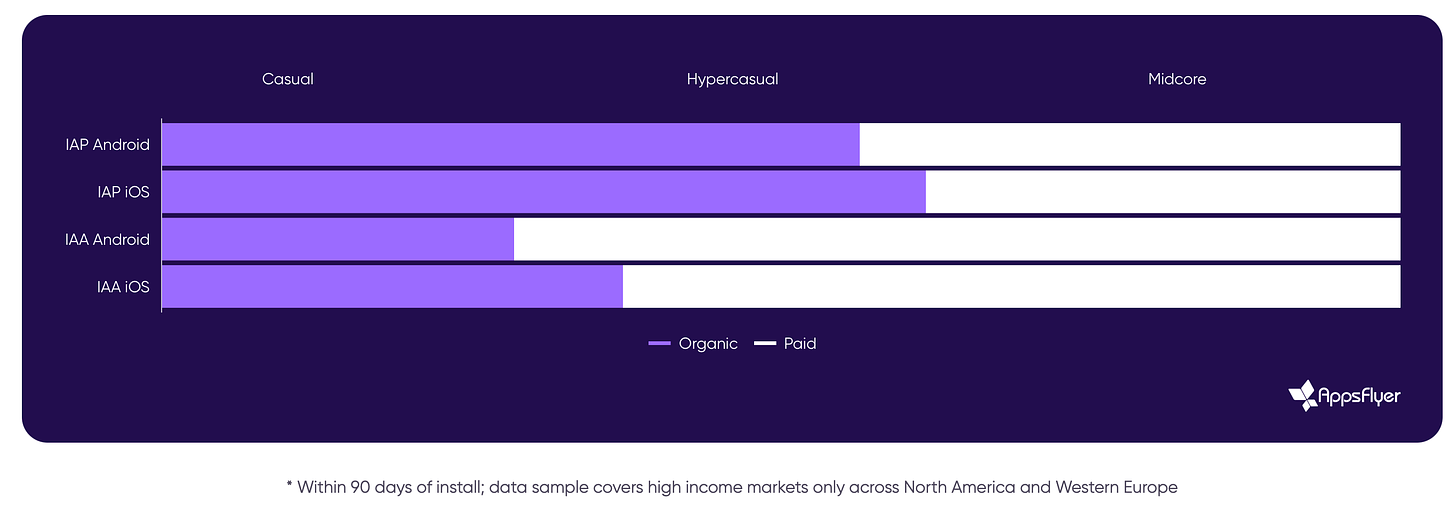
- If we consider all revenue for 90 days, without breaking it down by cohorts, the share of revenue from paid users grows in casual projects with IAP monetization. Conversely, it decreases in hyper-casual and casual games with advertising monetization.
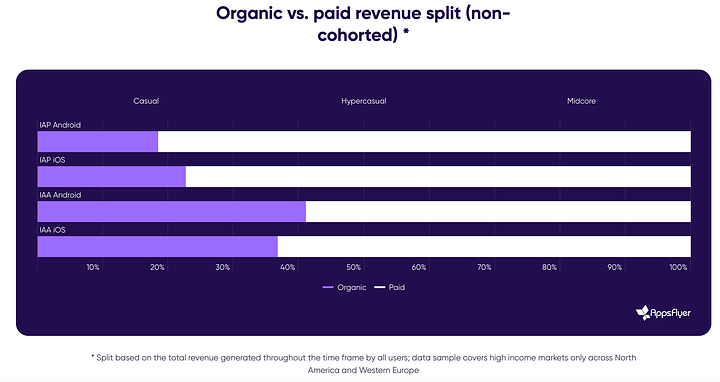
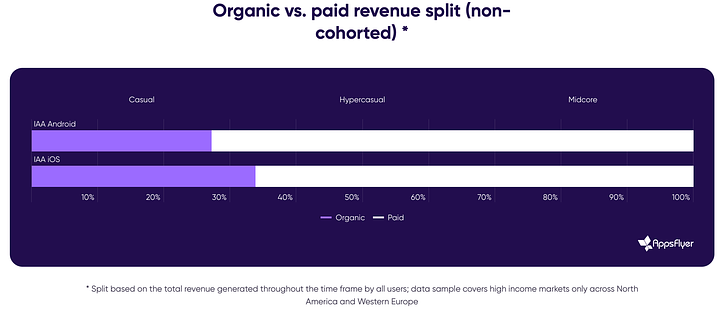
- But in mid-core games on Android, changes are visible. In terms of total revenue (not cohort), the share of purchased users in revenue grows to 64%. On iOS, the same 61% of organic users make the cash.
Consumer Technology Association: Almost 29 million people in the US are hardcore gamers

CTA surveyed 2,703 adults and teenagers in the US.
Games and Other Types of Entertainment
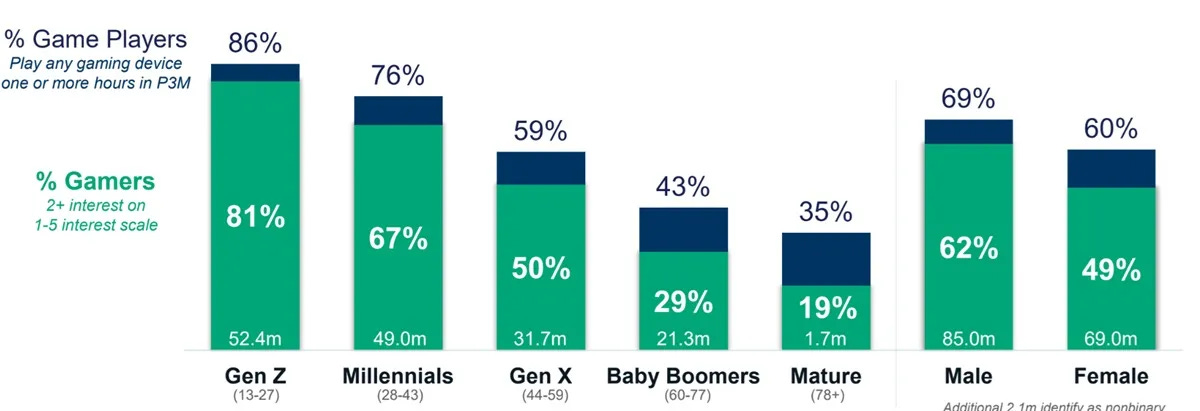
- 65% of people in the US over 13 years old play games. This is 182.7 million people. The study authors note that the popularity of games in the country is growing.
- Games are the second most popular entertainment in the US. It is second only to watching television, movies, and series. However, for younger generations (millennials and Generation Z), games are in first place.
- 40% of gamers indicated that they would prefer games over watching movies and series.
- 60% of players also interact with gaming content - streams, videos about games.
- 81% of Generation Z representatives can call themselves gamers; 67% of millennials; 50% of Generation X representatives; 29% of baby boomers and 19% of those over 78 years old. Males are more likely to call themselves gamers (62%) than females (49%).
Platforms
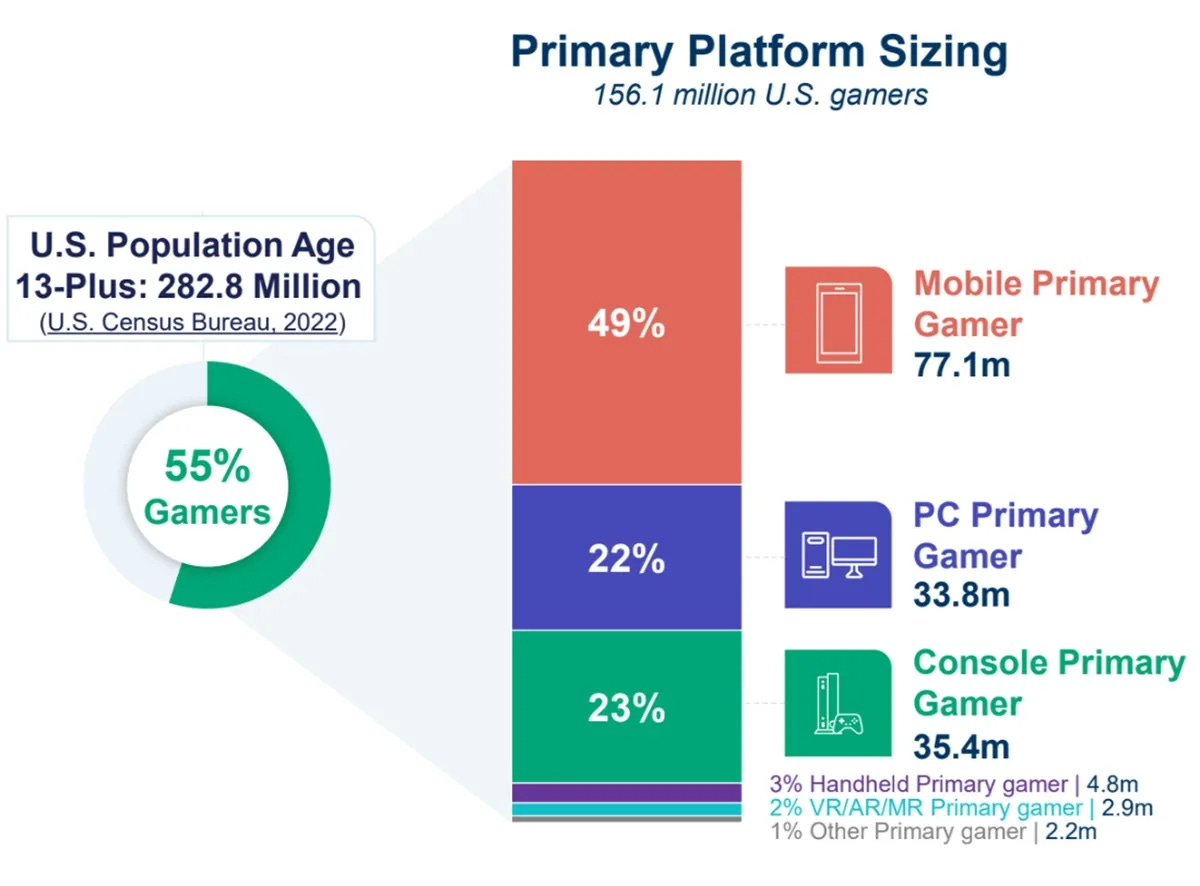
- 49% of the US gaming population named mobile devices as their main gaming platform. Most of this audience are casual older players and women. 23% play mainly on consoles, and 22% on PC. There has emerged a noticeable layer of those who mainly play on portable systems - 3% of such players.
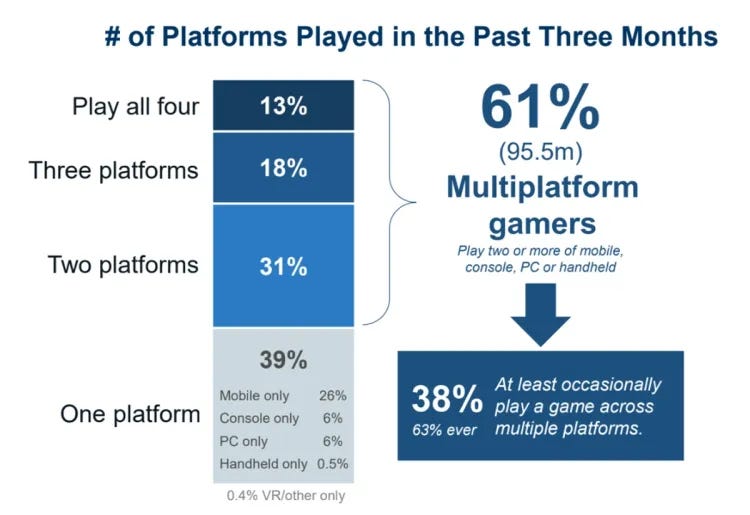
- However, only 26% of respondents play exclusively on mobile devices. 61% (95.5 million people) sometimes play on multiple platforms. And 38% have done so in the last 3 months.
US Gaming Audience
- Generation Z is currently the largest category of players in the US.
- 18% of gamers (28.6 million) are hardcore gamers, the most economically active. These are mostly men (73%), with an average age of 29 years. They play 42 hours a week, spend most of their time on paid games, and actively buy new games. 91% of hardcore gamers play on PC and consoles. They also use new gaming technologies (cloud gaming, VR, and others) more often than other groups. 71% are subscribed to gaming services; 51% are engaged in creating content related to games. Among the preferences of such users are multiplayer games, shooters, open-world games.
- 46% of gamers (72.1 million people) are "core" gamers. They are not as active as hardcore gamers, but they play games quite often. 36% (55 million people) are casual gamers.
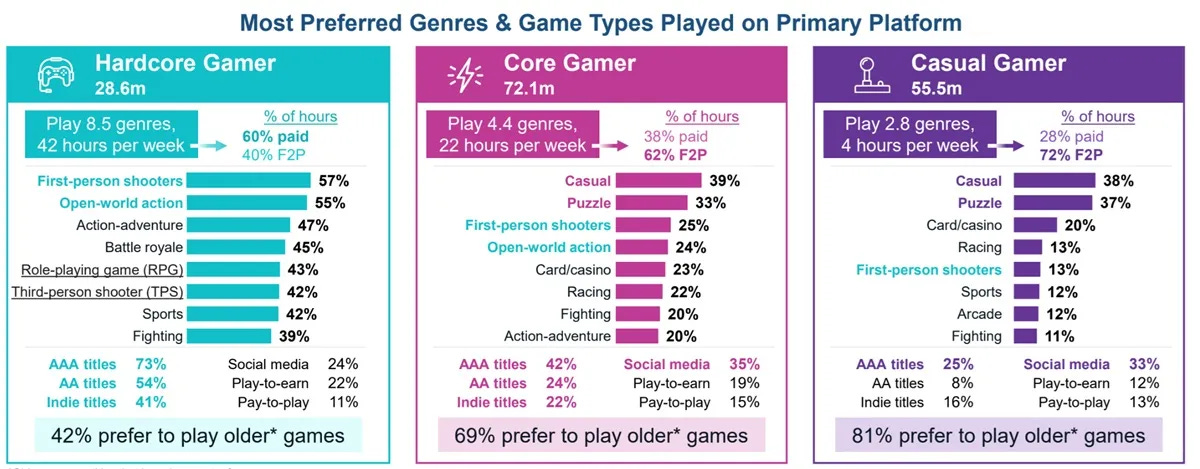
- Interestingly, 69% of "core" gamers and 81% of casual gamers prefer "old" games - those that have been on the market for more than 5 years. People get used to their favorite games and rarely leave them.
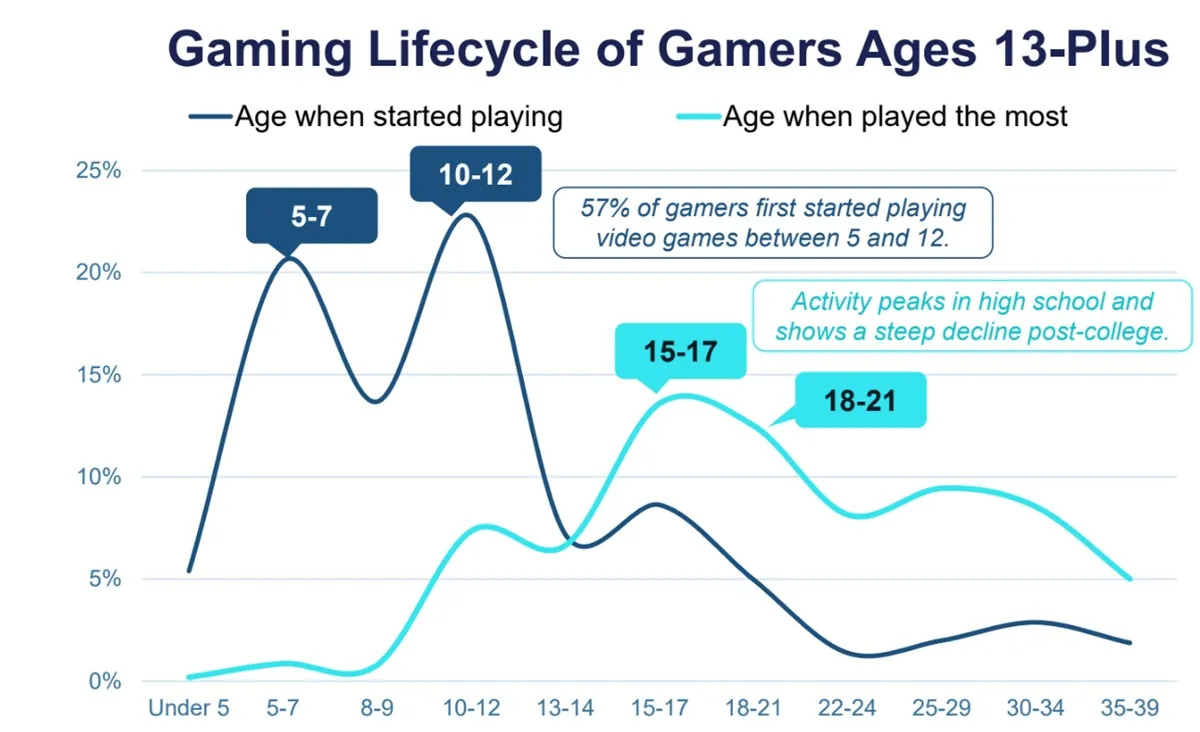
- Most players start their gaming journey between the ages of 5 and 12. The peak of activity occurs during school years and university, and then people start to churn.
- 68% of players play games with other people. The older the gamers, the more often they prefer to play single-player projects (81% of people over 60 prefer such games).
- Most American players (75%) expect games to become even more social. And 77% are confident that even more live-service games will appear in the next 5 years.
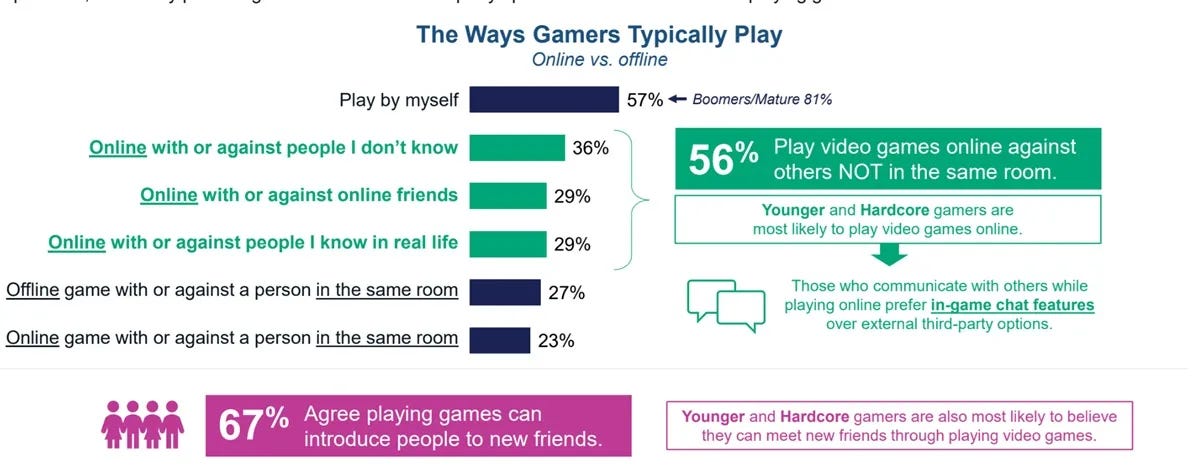
- 2/3 of respondents believe that games help them meet new friends.
Purchases
- 64% of gamers in the US plan to buy new gaming devices for themselves next year.
- 62% of gamers in the US want to buy new peripherals in the coming year. The most popular choices are headphones and microphones.
- 23% of respondents noted that they would like to upgrade their gaming device (the difference from the point above is that it was about buying a new device). In the next 12 months, 26% of respondents would like to buy themselves a gaming console.
- 20% of surveyed gamers in the US already have a portable console.
Digital Goods, Subscriptions, and IP sentiments
- 69% of gamers prefer to buy digital goods.
- 40% of players have an active subscription to games or services. 49% have purchased such a subscription in the last 6 months.
- 29% of respondents plan to buy a subscription next year. Mainly, millennials and Generation Z plan to do this.
- 68% of users (especially older ones) prefer free games.
- 44% of the American gaming audience would very much like to see games based on their favorite movies or series.
Regulations and Laws
- If the Trump government introduces new tariffs and duties on imports from China and other countries, console prices in the US could rise by 40%.
- 41% of users who don't play on consoles noted the high cost of console gaming. So this plays a big role.
Famitsu: PlayStation 5 Pro sales in Japan in November are twice as high as regular PS5 versions
Famitsu only accounts for physical copy sales.
Game sales
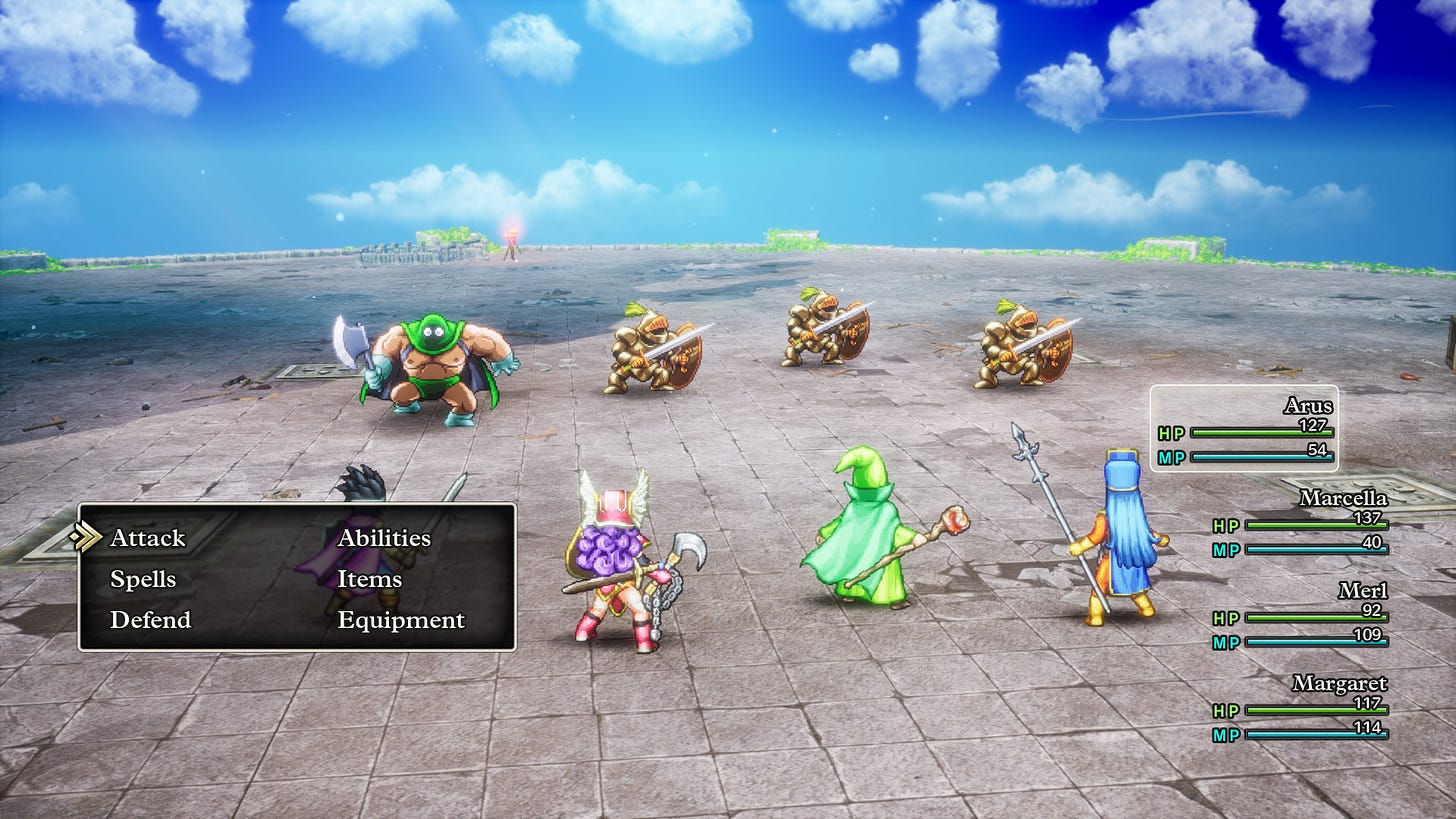
- Dragon Quest 3 HD-2D Remake - November’s hit in Japan. The game was released on November 14, and in less than a month, it was purchased 913k times - this is without digital versions. Just over 712k copies were bought by Nintendo Switch owners. The previous record among remakes in the series belonged to Dragon Quest 7: Journey of the Cursed King on Nintendo 3DS (it was purchased 733k times in a month).
- In third nominal and second actual place - Super Mario Party Jamboree. 168k physical copies of the project were purchased.
- In fourth (third) place - Mario and Luigi: Brothership with 88k copies.
- Square Enix - November’s leader in market share of physical game copies (54.1% - $43.2 million); Nintendo is in second place with 30.9% of the market.
- In November, more than 1.5 million physical copies of games for Nintendo Switch were sold in Japan alone.
Hardware sales
- Total PlayStation 5 sales in November amounted to 151k consoles. Of these, PS5 Pro accounted for just over 102k sales - a good start.
- However, Nintendo Switch is still the market leader. The console was purchased just over 255k times in a month.
Games & Numbers (November 27 - December 10; 2024)
PC/Console Games
- Users have donated over $750 million for the development of Star Citizen.
- Dave the Diver has been purchased more than 5 million times.
- Over 5 million people have played Warhammer 40,000: Space Marine II. Considering the game hasn't appeared in subscriptions, this number equals sales.
- Dragon Quest 3 HD-2D Remake has sold over 2 million copies since its release on November 14. More than half of the sales were in Japan.
- Phasmophobia sold 1 million copies on PlayStation 5 and Xbox Series S|X a month after release. Total sales of the project have exceeded 22 million.
- Path of Exile 2 has been purchased more than 1 million times in Early Access.
- Crime Scene Cleaner sold 500,000 copies in less than four months. The first 200,000 copies were sold in less than two weeks.
- Drug Dealer Simulator 2 has been purchased more than 200,000 times. The game was released just over 5 months ago.
- Dungeon Clawler was purchased 100,000 times in two weeks.
- Over 10 million people played Marvel Rivals in the first 3 days after release.
Mobile Games
- Dungeon & Fighter: Mobile earned over $1 billion in 6 months of operation in China on iOS.
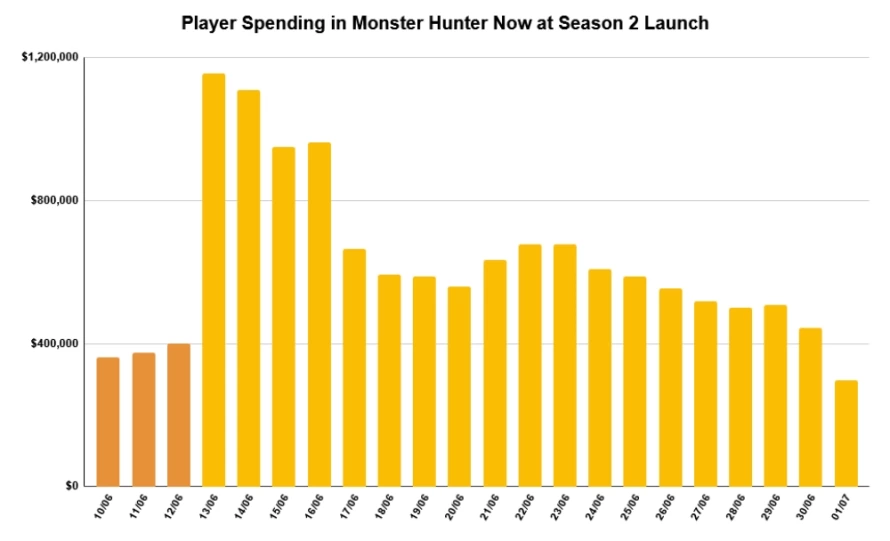
- Monster Hunter Now's revenue exceeded $250 million according to AppMagic estimates.
- Pokemon TCG Pocket's revenue in the first month was $208 million according to AppMagic.
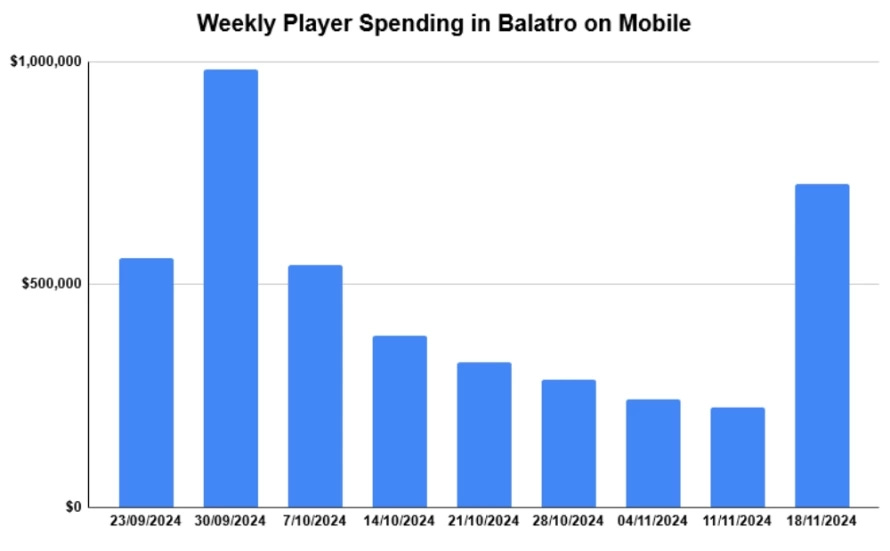
- Balatro's revenue on mobile devices reached $4.4 million in two months. The game is sold for $9.99 in the App Store and Google Play, and is also available on Apple Arcade.
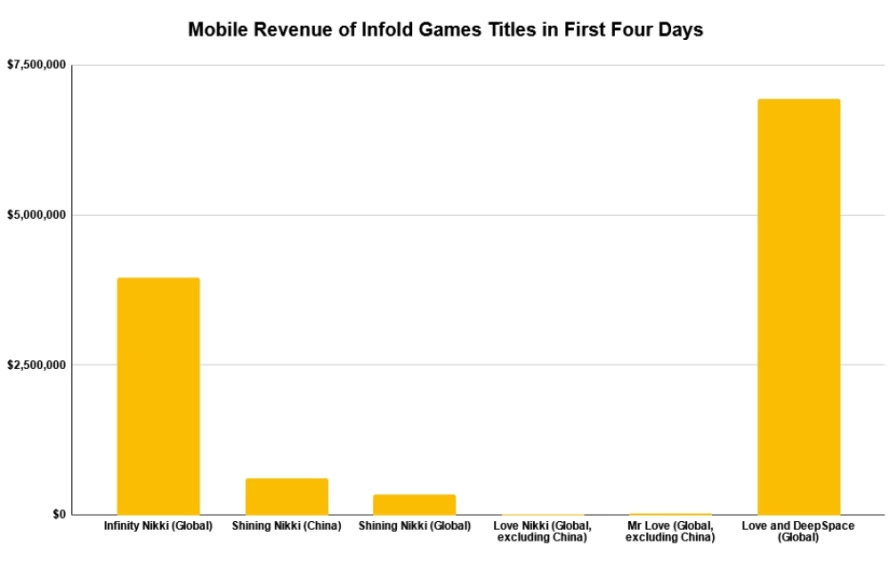
- Infinity Nikki earned $4 million on mobile platforms alone in 4 days. 77% of the project's revenue came from China. The game was downloaded more than 10 million times across all platforms.
- Royal Kingdom earned $2.4 million in 14 days after release. During the soft launch, the project earned $21.2 million. All this is Net Revenue according to AppMagic.
- CrazyLabs games have been downloaded more than 7 billion times.
- Matchingham Games Group also reported download figures for the group. The company's games have been downloaded more than 750 million times.
- Block Blast's DAU reached 40 million users.
Hardware
-
Global sales of PlayStation 2 have surpassed 160 million units. Sony announced this on its website dedicated to PlayStation's 30th anniversary.
ChainPlay & Storible: 93% of GameFi Projects are Dead
The companies analyzed 3,279 GameFi gaming projects. A project was considered “dead” if it had fewer than 100 DAU (data from DappRadar) or if the token value dropped by more than 90% from peak indicators (data from Dune Analytics). The review was conducted in November 2024.
Market State in 2024
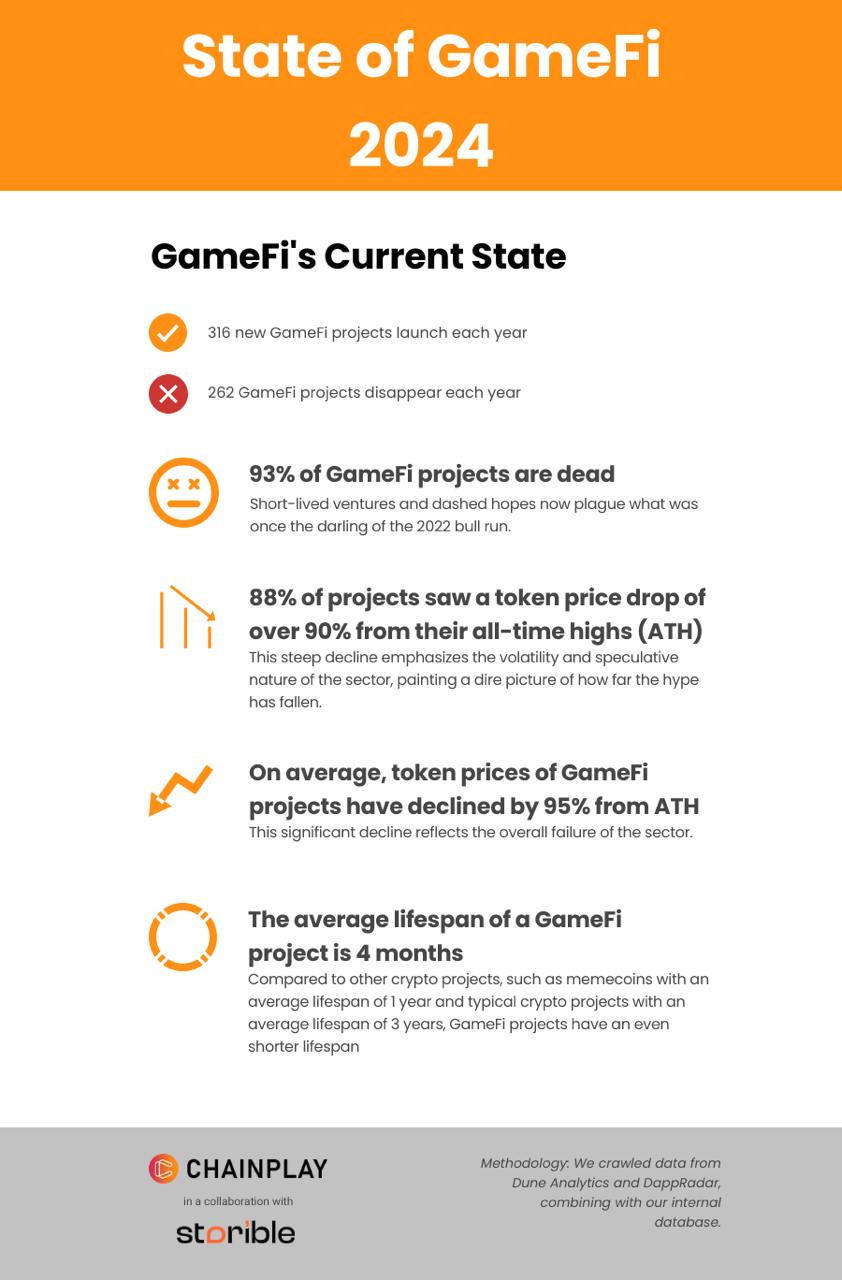
- 316 new GameFi projects are launched each year. 262 die.
- Currently, 93% of all GameFi projects are dead.
- 88% of all projects have seen their token value drop by more than 90% from their peak value.
- On average, the value of GameFi project tokens has fallen by 95% from their peak value.
- The average lifespan of a GameFi project is four months. For comparison, meme coins usually live for a year. And typical crypto projects - 3 years.
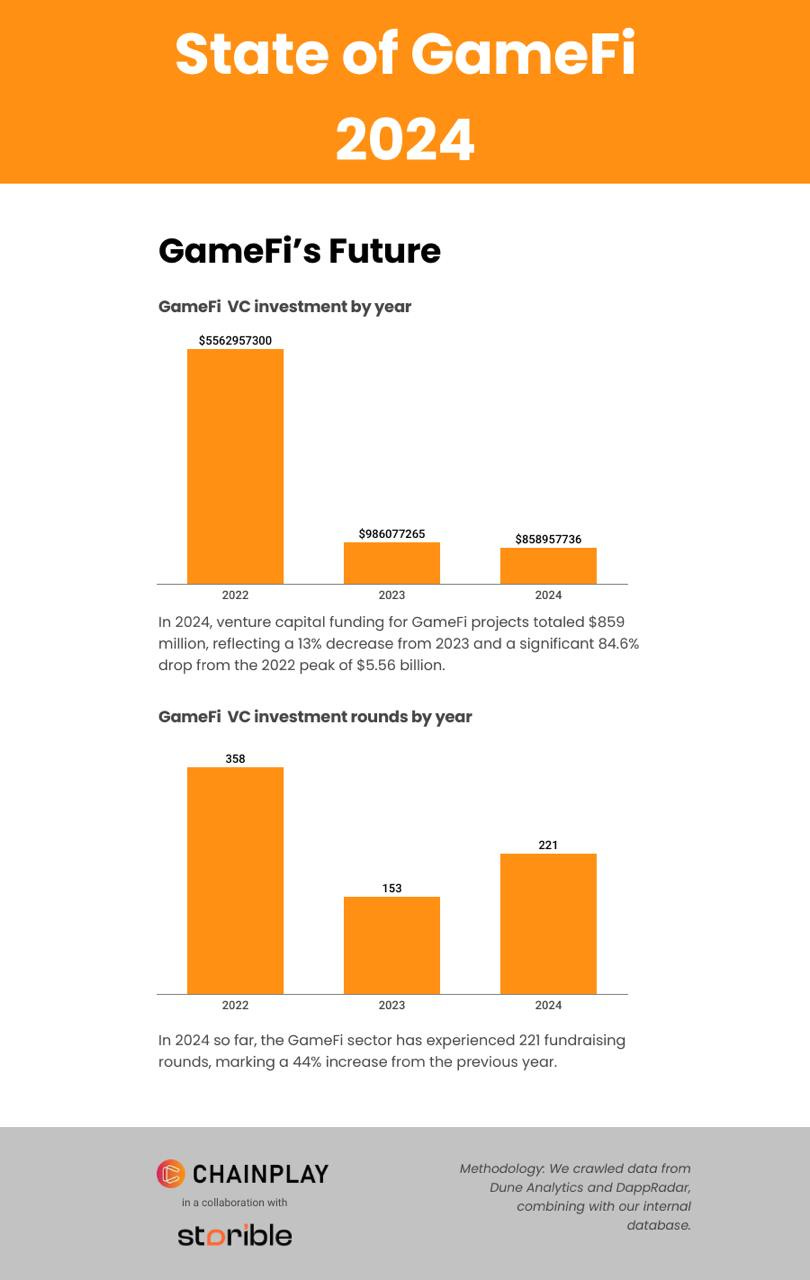
- In 2024, $859 million was invested in GameFi projects. This is 13% less than in 2023. And 84.6% less than the peak values of 2022 ($5.56 billion).
- In 2024, there were 221 public deals. This is 44% more than last year. But less than the 358 rounds in 2022.
The report’s authors believe that, despite the 2022 bubble bursting, strategic investors are still interested in various GameFi projects. However, a lot of changes are needed for significant and sustainable growth.
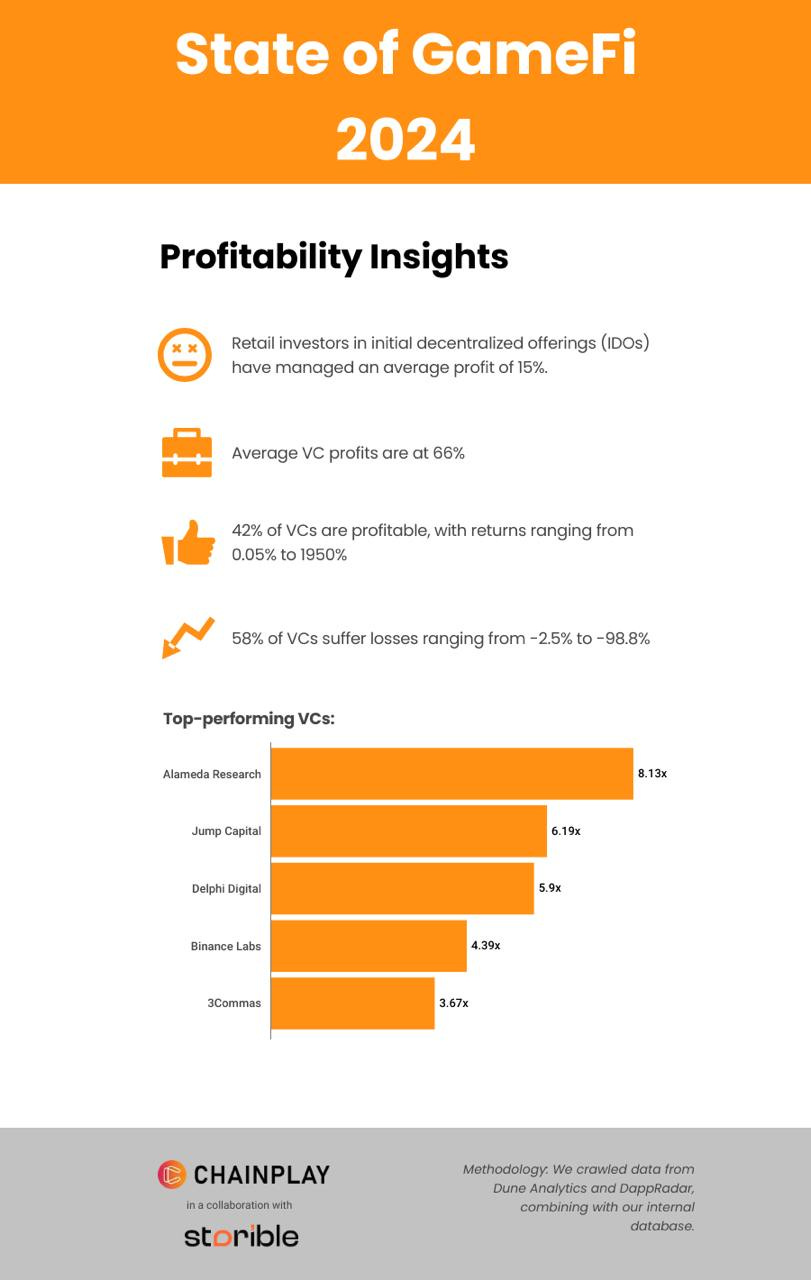
❗️I didn’t describe the part about investments because I don’t understand how “average profit” and ROI are calculated here. But I’ve attached the infographic.
Raj Patel: There've been more layoffs in 2024 than in 2022 and 2023 combined
The study only takes into account publicly announced layoffs. In 33% of all announcements, the number of people laid off was not specified.
The data is current as of December 4, 2024.
- 16,766 layoffs occurred in 2024. In 2023, 8,706 layoffs were announced; in 2022 - 7,949. This means that by the end of this year, more people have already been laid off than in the two previous years combined.
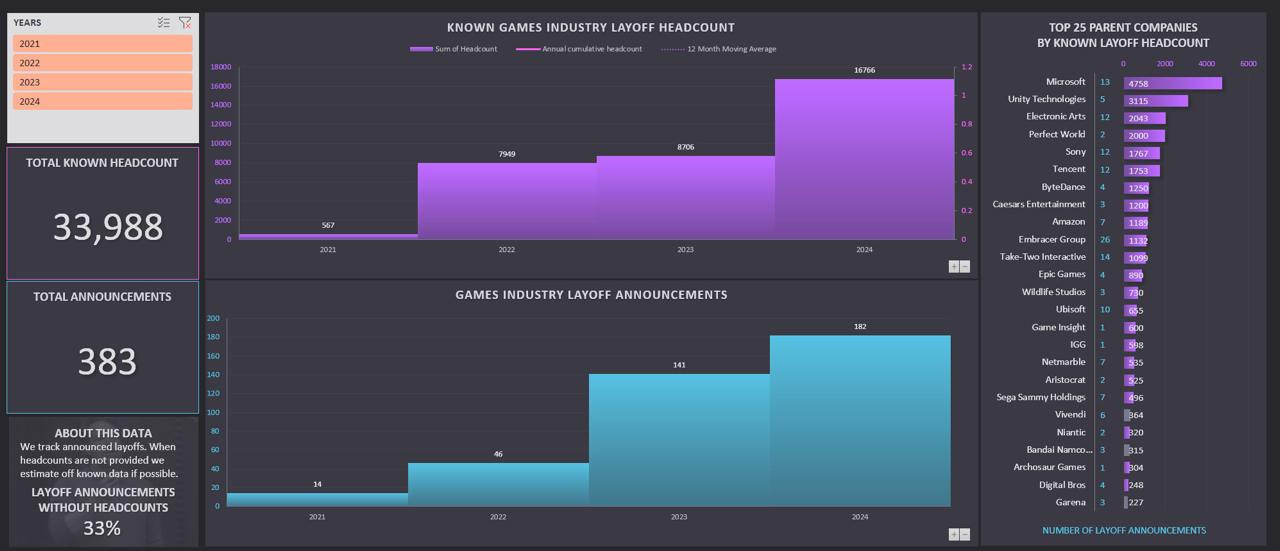
- The most cuts occurred in January 2024 (6,345 people lost their jobs), February 2024 (3,269 people were laid off), and June 2022 (2,692 layoffs).
- In total, 33,988 layoffs have been reported since the beginning of 2021.
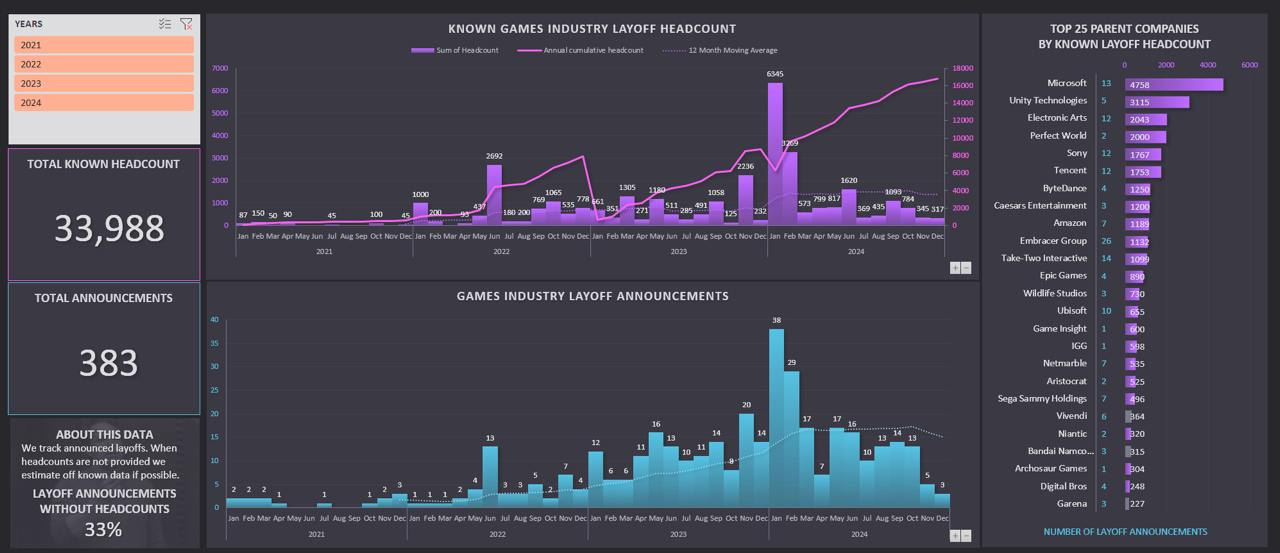
- The companies that laid off the most people were Microsoft (4,758 people), Unity (3,115 people), Electronic Arts (2,043 people), Perfect World (2,000 people), and Sony (1,767 people).
❗️The data differs from that collected by the Game Industry Layoffs portal.
China Audio-Video and Digital Publishing Association: Chinese gaming market reached record highs in 2024

Domestic Market
- The Chinese gaming market grew by 7.53% YoY, reaching a size of $44.8 billion (325.8 billion yuan).
- For comparison, in 2023 the market reached a size of $41.62 billion (303 billion yuan), showing a growth of 14%.
- Sales in the domestic market reached record volumes since 2003. However, the market growth rate no longer shows double-digit figures.
- The number of players in the country increased by 0.94% to 674 million people.
- The mobile segment accounts for 73% of all revenue, $32.7 billion (238.2 billion yuan). In 2024, it grew by 5%. The growth rate has significantly slowed compared to the previous year (which had 17.5% growth).
- The PC market accounted for 20.9% of all revenue ($9.36 billion). The segment grew by 20.9% this year.
Success in the Global Market
- Chinese gaming companies earned $18.6 billion in international markets in 2024. This is 13.4% more than last year. It’s important to note that the dynamics are positive for the first time in 3 years.
- 31.1% of foreign revenue came from the USA, 17.3% from Japan, 8.9% from South Korea. Interestingly, Saudi Arabia is in the top 10.
Omdia: Xbox Series S|X sales lag behind Xbox One increased in the system’s 5th year of life
- According to Omdia’s estimates, 33 million Xbox Series S|X systems were sold in its 5th year of life. During the same period, Xbox One sold 38 million units.
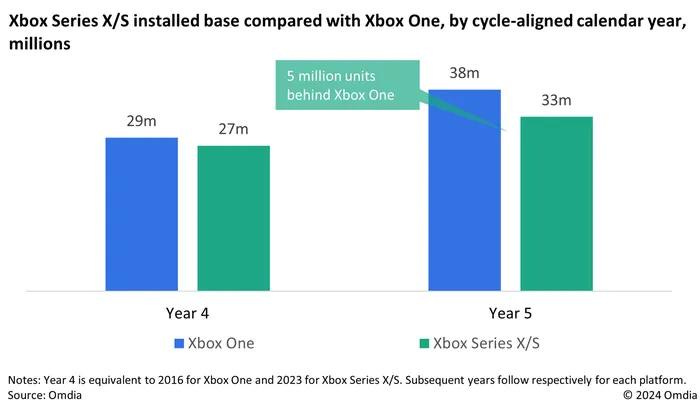
- After 4 years, the situation was better for Xbox Series S|X - 27 million units compared to 29 million for Xbox One.
DataEye Research Institute: The mini-game market in China will reach $6.86 billion in 2024

Liu Zun, head of DataEye Research Institute
- According to the company, in 2024, developers earned 50 billion yuan ($6.86 billion) through mini-games. The growth compared to the previous year was 64%.
- The number of mini-game users has grown to 1 billion people. More than half of Chinese gamers play games in WeChat Mini Games. The overlap with TikTok Mini Games is 15%.
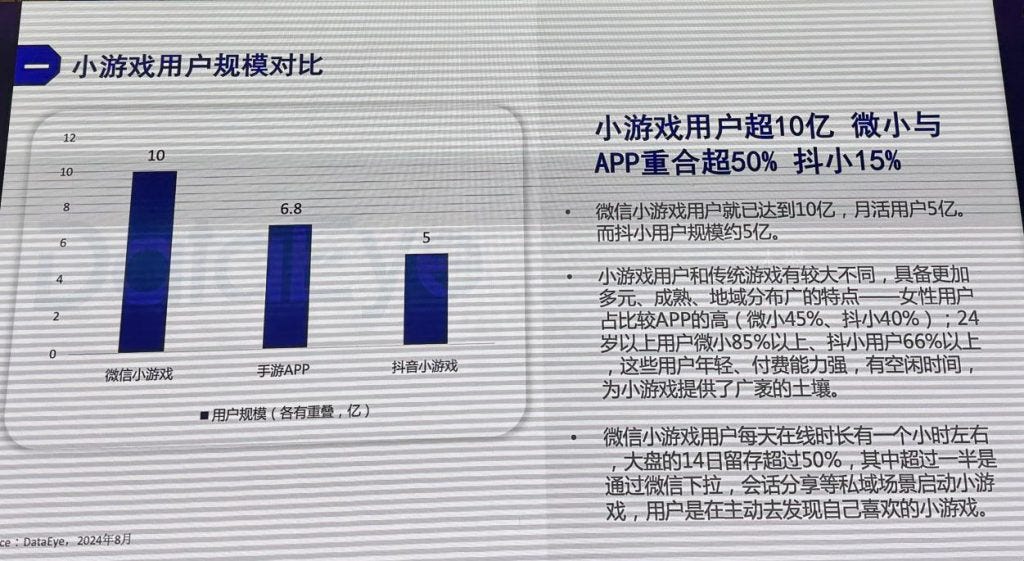
- The MAU of mini-games is over 500 million people. 85% of users are under 24 years old.
💭 Liu Dzun, head of DataEye Research Institute, considers the main growth factors to be, firstly, the appearance of major players like 37Games, Century Games, and 4399 in the mini-game segment. Secondly, a large number of interesting smaller projects (teams of 3-6 people) have appeared on the market with a focus on advertising monetization (IAA).
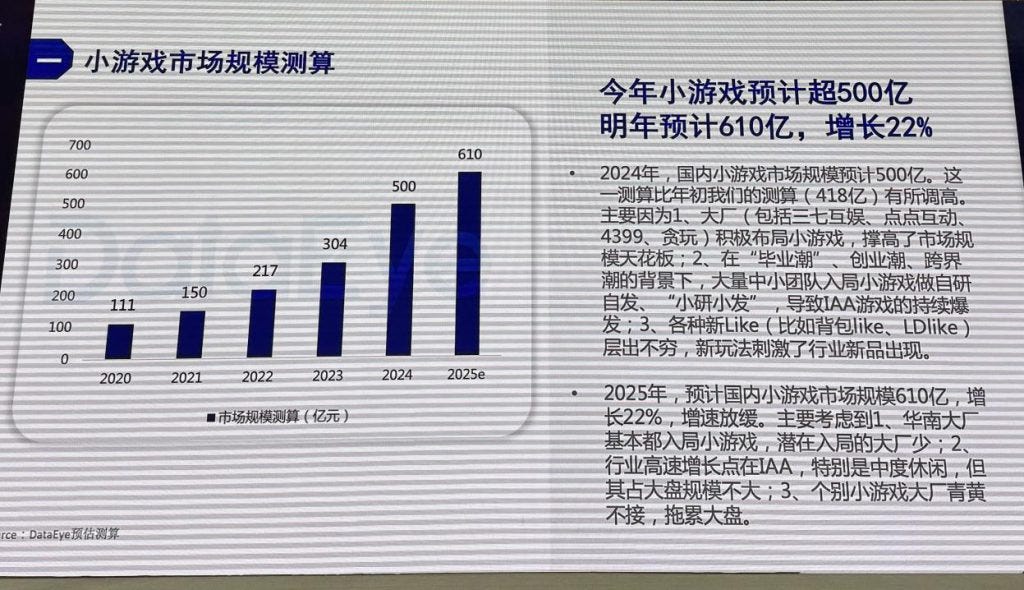
- In 2025, the market is expected to grow by 22% to 61 billion yuan ($8.37 billion). Growth rates are declining due to market saturation.
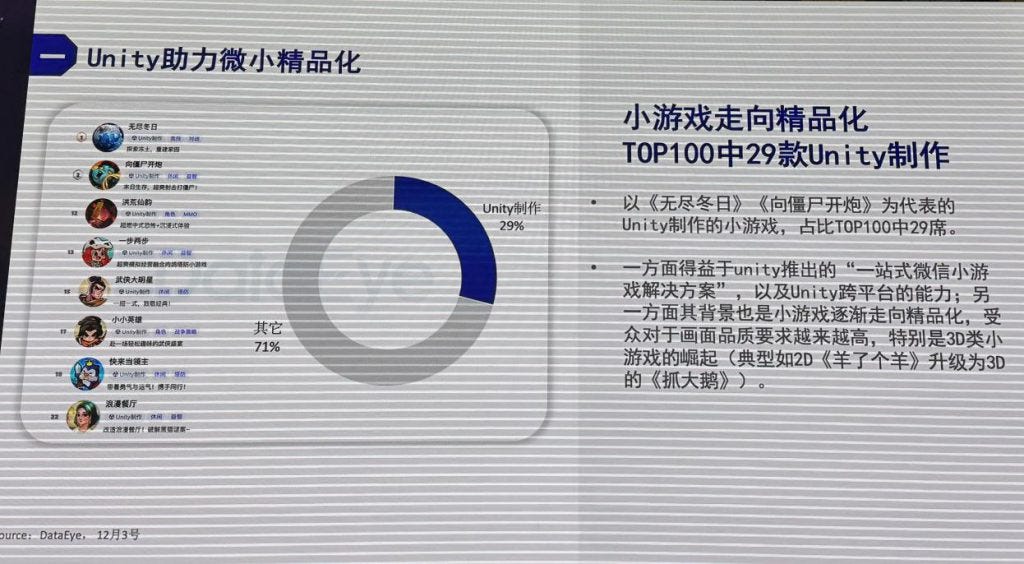
- 29% of projects in the top 100 by revenue are made with Unity.
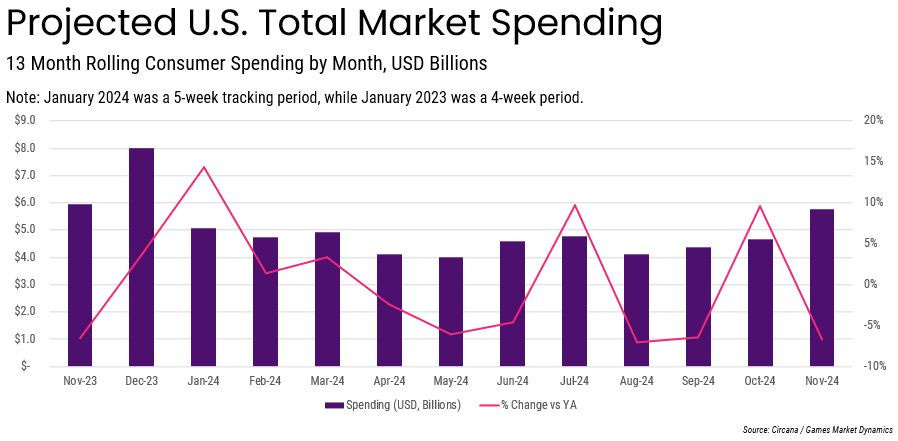
Circana: US Gaming Market in November 2024

Overall market condition
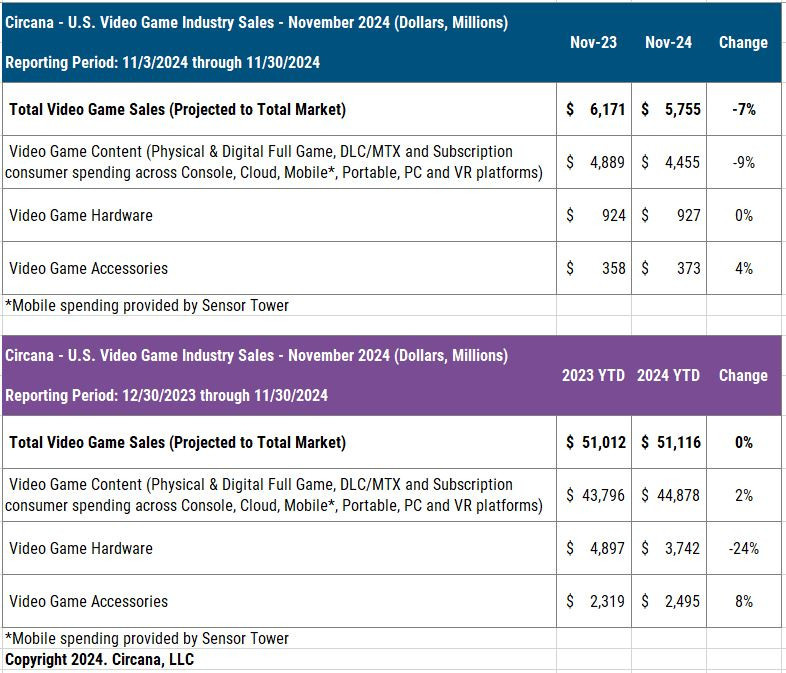
- $5.755B was the revenue of the American gaming market in November 2024. A year ago it was $6.171 billion - 7% more.
- Game content sales fell by 9% compared to last year. This is largely because Modern Warfare III was released in November’23, while Black Ops 6 was released in October’24. Growth in mobile and subscription PC/console segments was offset by a 29% drop in console revenue.
- User spending on PC/console subscriptions in November increased by 8%. The main growth driver is Game Pass, and the appearance of Call of Duty: Black Ops 6 in the subscription.
- Sales of gaming systems remained at the same level, even slightly increased. PlayStation 5 spending increased by 15% (this is the month’s leader); Nintendo Switch sold 3% worse than last year’s numbers; Xbox Series S|X - 29% worse than a year earlier.
- The PlayStation 5 Pro accounted for 19% of all PlayStation devices sold in November and 28% of the money. Sony earned 50% more in dollar terms at the start, compared to the launch of PS4 Pro in November 2016, selling 12% fewer consoles.
- ❗️Nintendo Switch sales reached 46.6 million and surpassed PlayStation 2 sales in the US. Now the console is second only to the Nintendo DS.
- Accessory sales increased to $373 million, up 4%. Growth was driven by an 8% increase in the gamepad segment.
- Based on the results of 11 months of 2024, the market is still slightly ahead of 2023. But the difference is minimal - everything will be decided in December.
- During this period, 9.4 million gaming systems were sold - significantly less than 11.8 million for 11 months of 2023.
Game sales
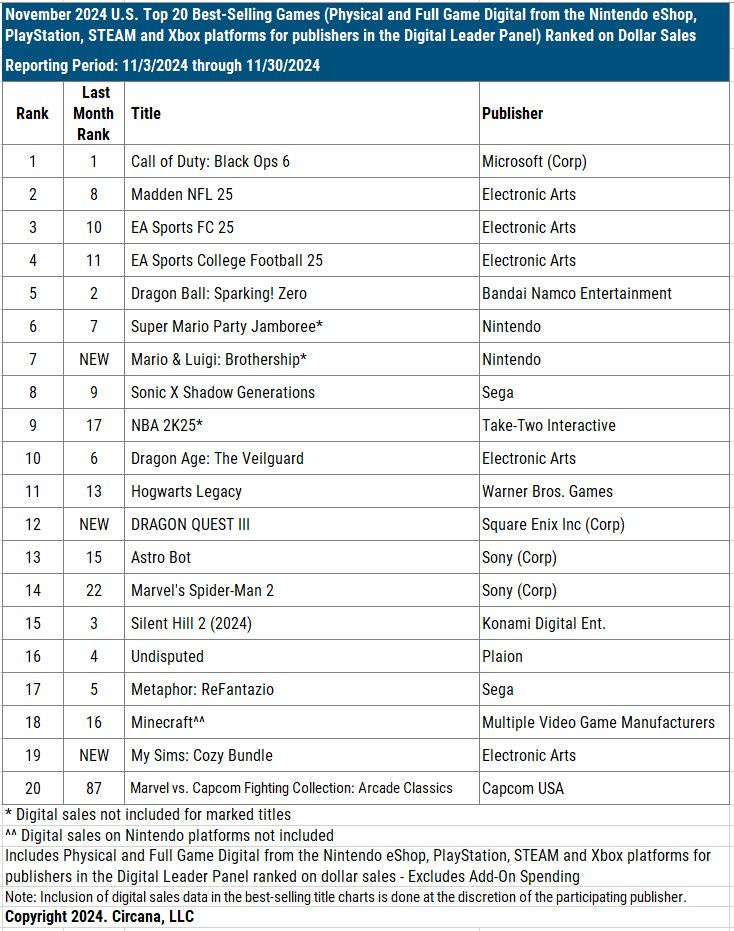
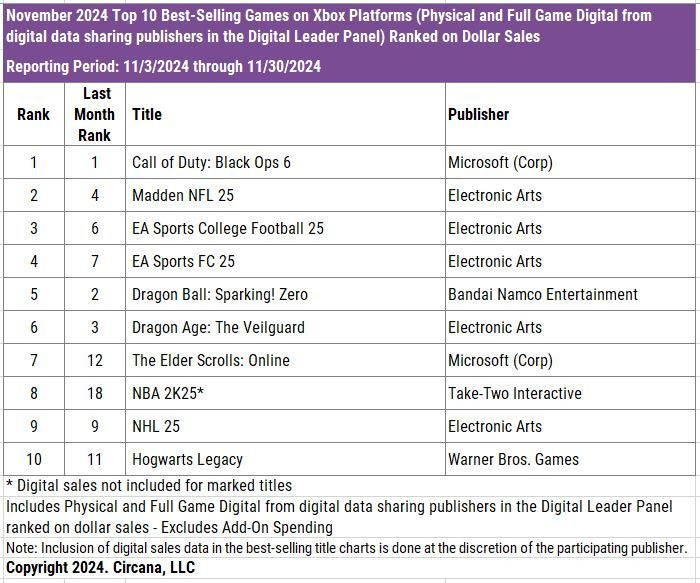
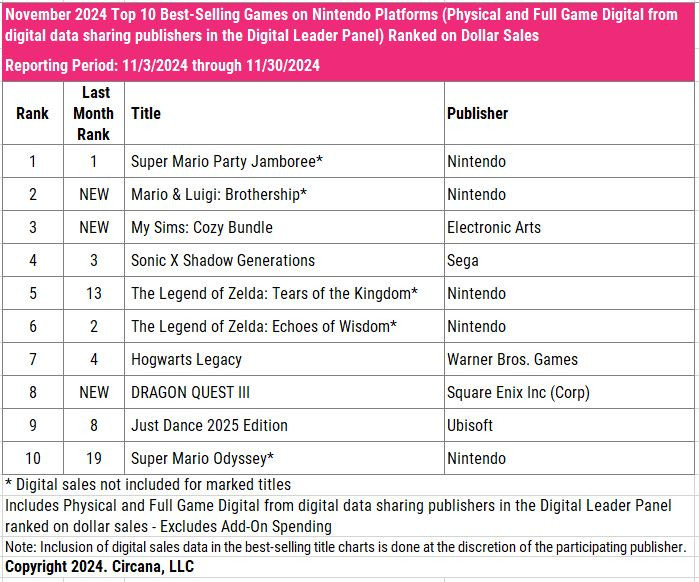
- Call of Duty: Black Ops 6, Madden NFL 25 and EA Sports FC 25 are the most successful games of the month in dollar terms on PC and consoles. New releases - Mario & Luigi: Brothership (7th place - excluding digital copies); Dragon Quest III HD-2D Remake (12th place) and My Sims: Cozy Bundle (19th place).
- EA Sports College Football 25 is the best-selling game of the year so far in 2024 in the US. ❗️Moreover, it is the most successful sports game in the country’s history in dollar terms. The project also made it into the list of the 50 most successful games in history of the US market.
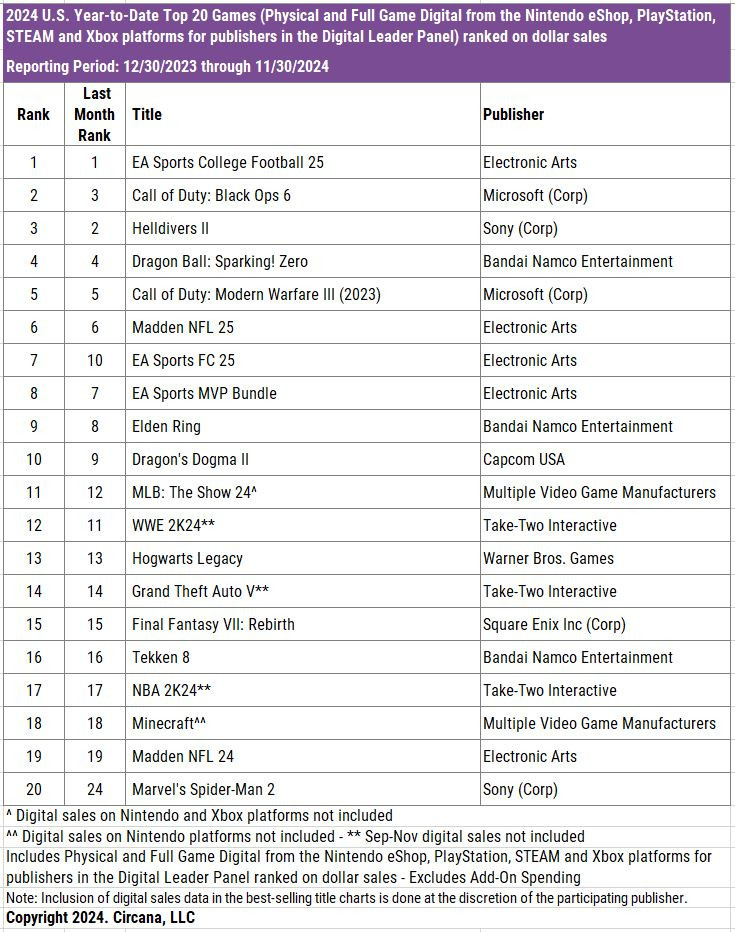
- Call of Duty: Black Ops 6 climbed to 2nd place in the 2024 chart; Helldivers II is in third place.
- Leaders of the mobile segment in terms of revenue in November 2024 - Monopoly GO!; Royal Match and Roblox. Pokemon TCG Pocket immediately entered the top 10 (6th place).
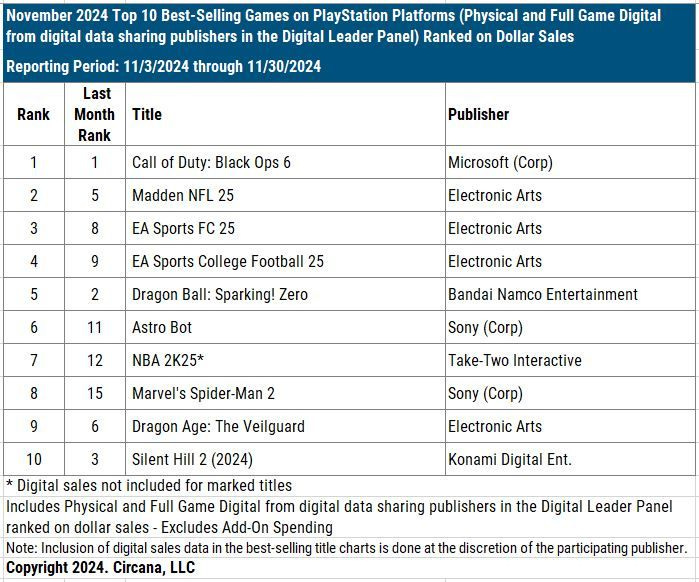
Rankings by platform
-
In the November charts for sales on PlayStation and Xbox, everything is stable - Call of Duty: Black Ops 6, Madden NFL 25, EA Sports FC 25, EA Sports College Football 25 and Dragon Ball: Sparking! Zero are in the first places.
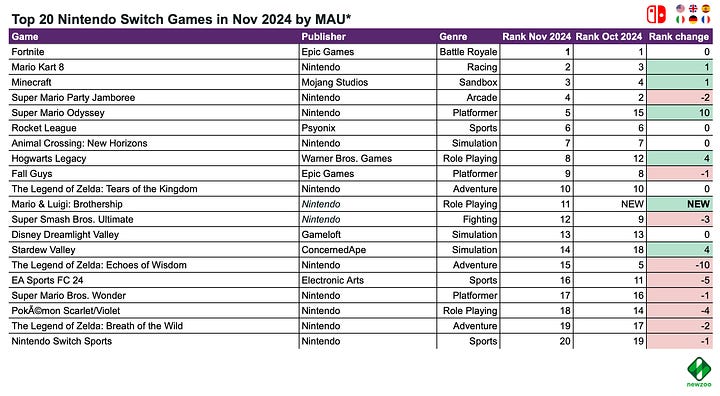
- On Nintendo Switch, there are three new releases in the chart at once - Mario & Luigi: Brothership (2nd place - excluding digital sales), My Sims: Cozy Bundle (3rd place) and Dragon Quest III HD-2D Remake (8th place).
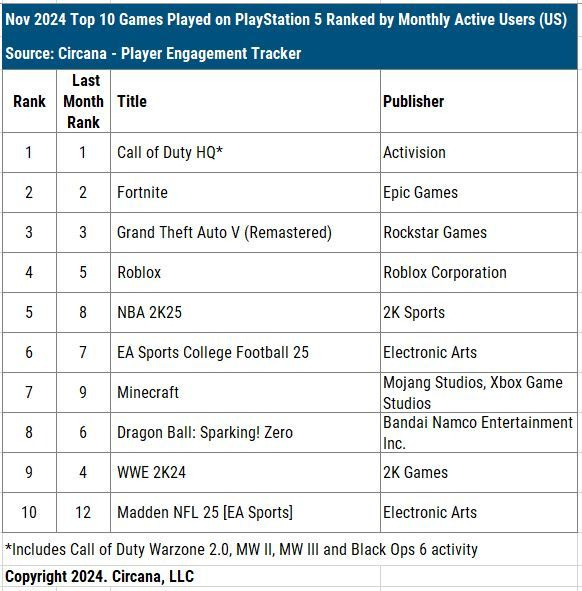
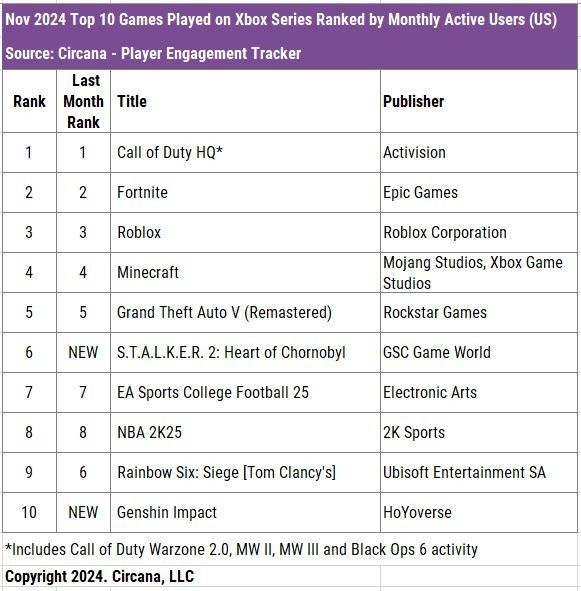
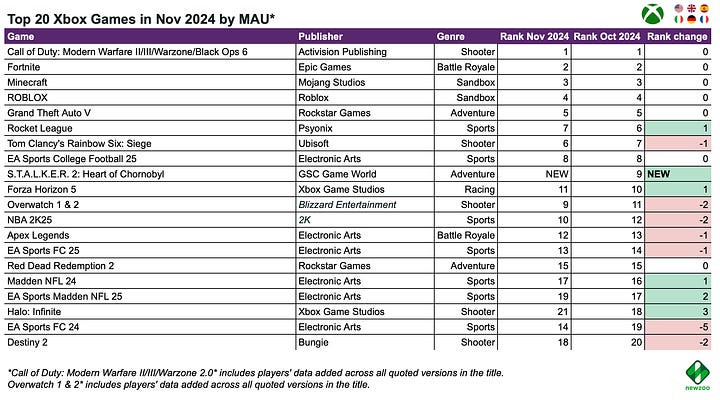
- On PlayStation, the MAU charts are stable, but on Xbox, S.T.A.L.K.E.R. 2: Heart of Chornobyl made it to 6th place. The game was released on Game Pass from day one. Genshin Impact was also released on Microsoft’s console - and entered the 10th place in MAU.
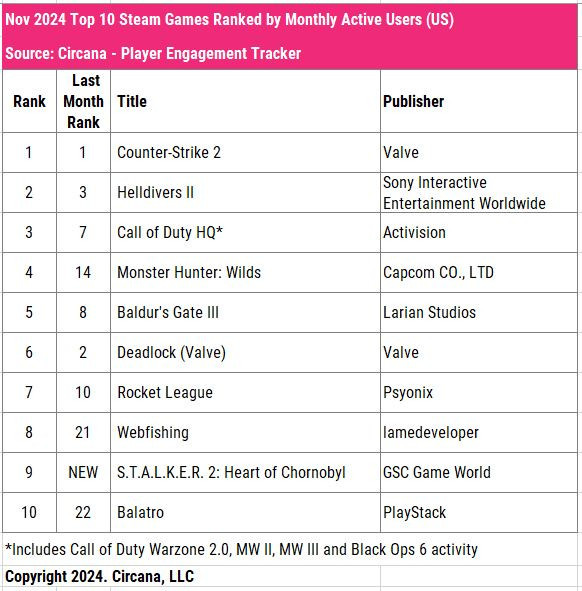
- Counter-Strike 2, Helldivers II and Call of Duty are the leaders in MAU on Steam. Interestingly - Monster Hunter: Wilds is in 4th place; Webfishing is in 8th place and S.T.A.L.K.E.R. 2: Heart of Chornobyl is in 9th place. The game is not available by subscription here, so we can conclude that the project sold well.
Newzoo: Top 20 PC/console games of November 2024 by Revenue and MAU

Newzoo takes into account the markets of the USA, UK, Spain, Germany, Italy, and France.
Revenue - all platforms
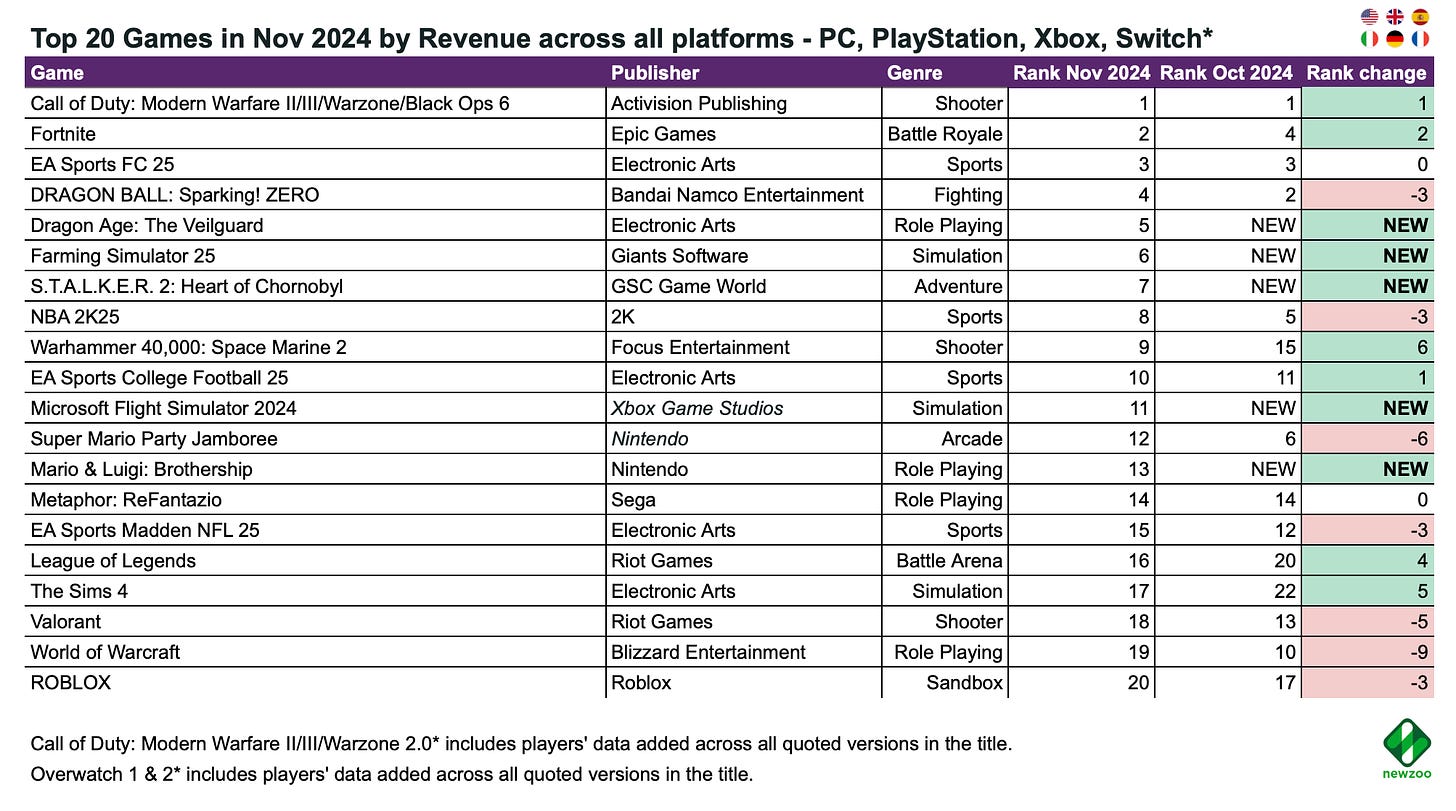
- The November ranking by total revenue includes 5 new releases - Dragon Age: The Veilguard (5th place); Farming Simulator 25 (6th place), S.T.A.L.K.E.R. 2: Heart of Chornobyl (7th position), Microsoft Flight Simulator 2024 (11th place) and Mario & Luigi: Brothership (13th place).
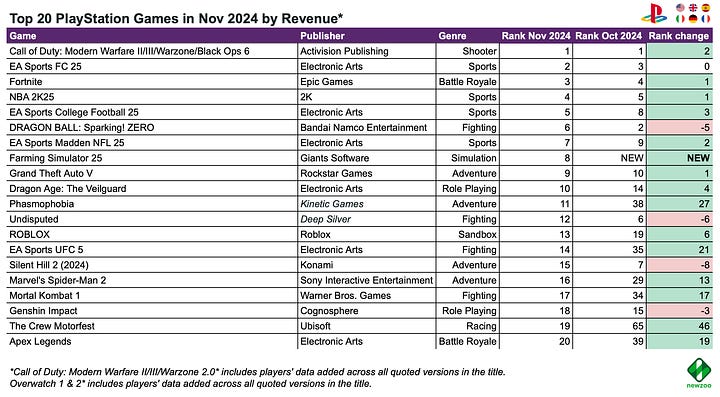
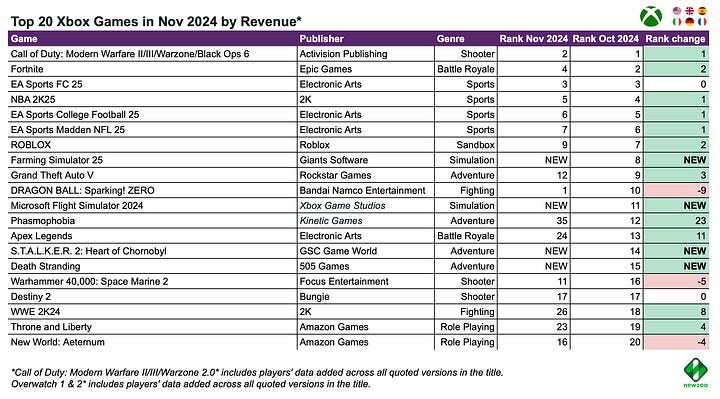
Revenue - individual platforms
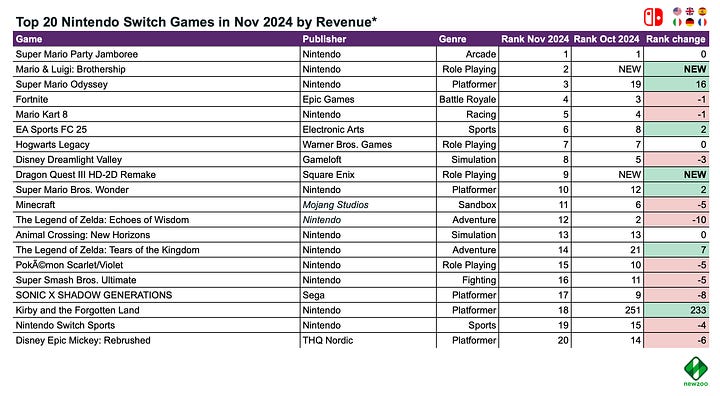
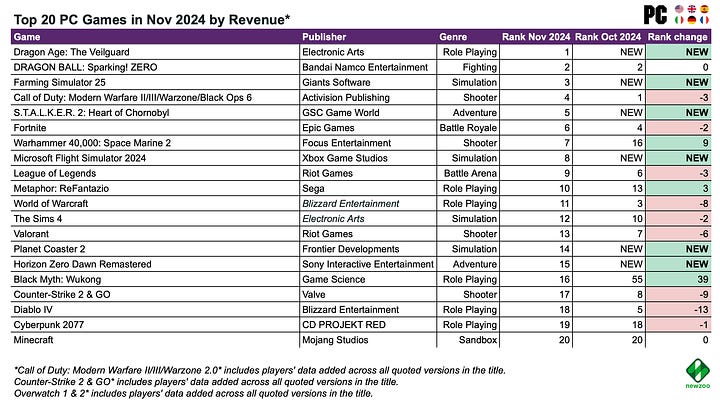
- On PC, Planet Coaster 2 (14th place) and Horizon Zero Dawn Remastered (15th place) also made it into the ranking. Sony’s strategy is showing good results once again - their former exclusives are selling well on PC.
- On PlayStation, only Farming Simulator 25 (8th place) made it to the top.
- Among the new releases on Xbox - Death Stranding (15th place). The game was released on Xbox 5 years after its original release.
- On Nintendo Switch, a couple of new projects are in the chart - Mario & Luigi: Brothership (2nd place) and Dragon Quest III HD-2D Remake (9th position). Also, Kirby and the Forgotten Land (18th place) jumped up 233 positions.
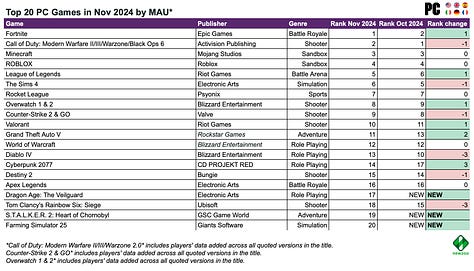
MAU - all platforms
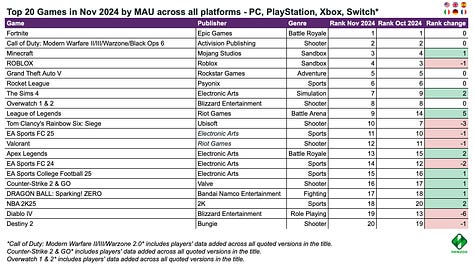
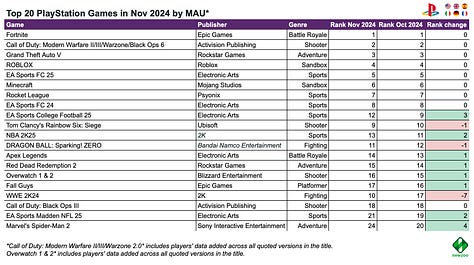
- In the MAU rankings (in the top ten), there are almost no changes. Fortnite, Call of Duty, Minecraft, ROBLOX, GTA V are still in the top positions.
- There are updates in the Steam charts - Dragon Age: The Veilguard (17th place), S.T.A.L.K.E.R. 2: Heart of Chornobyl (19th place) and Farming Simulator 25 (20th place).
- On Xbox, S.T.A.L.K.E.R. 2: Heart of Chornobyl made it to the 9th place by MAU.
StreamElements & Rainmaker.gg: Twitch in 2024

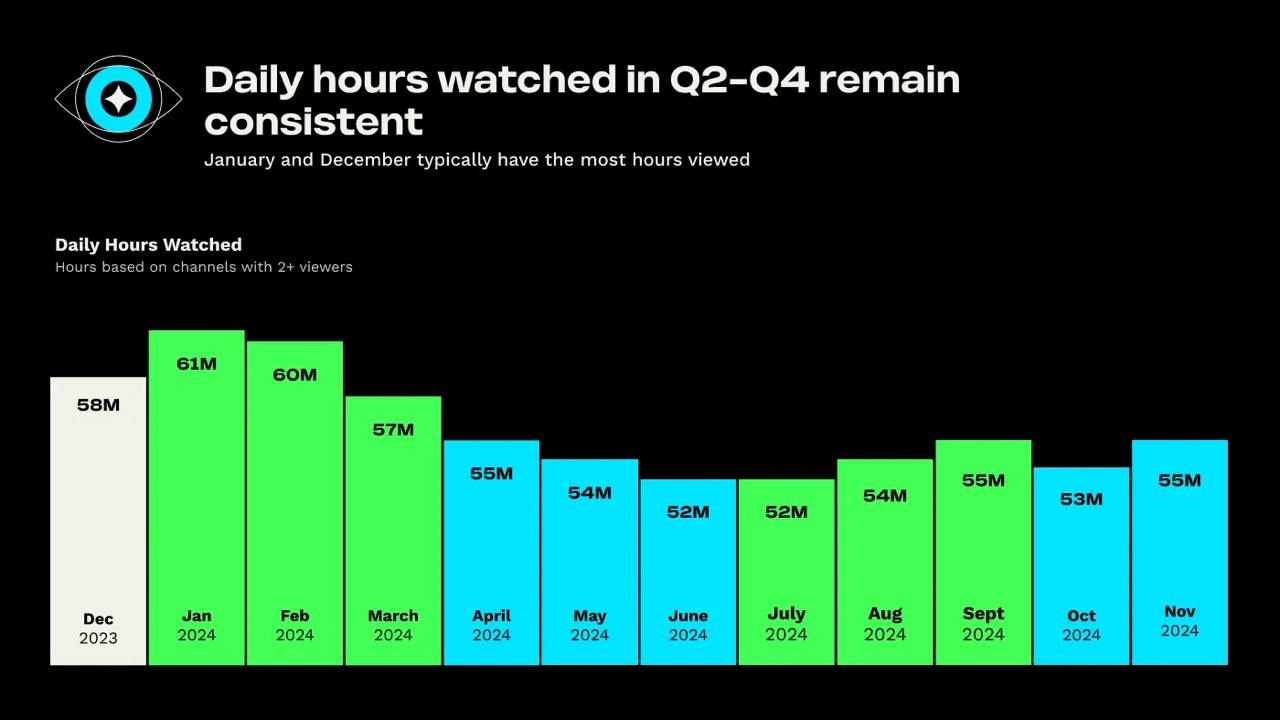
- During the first 11 months of 2024, users spent 18.5 billion hours watching content on Twitch. Last year, for the same period, it was 18.9 billion hours. The lack of growth is explained by competition from other platforms.
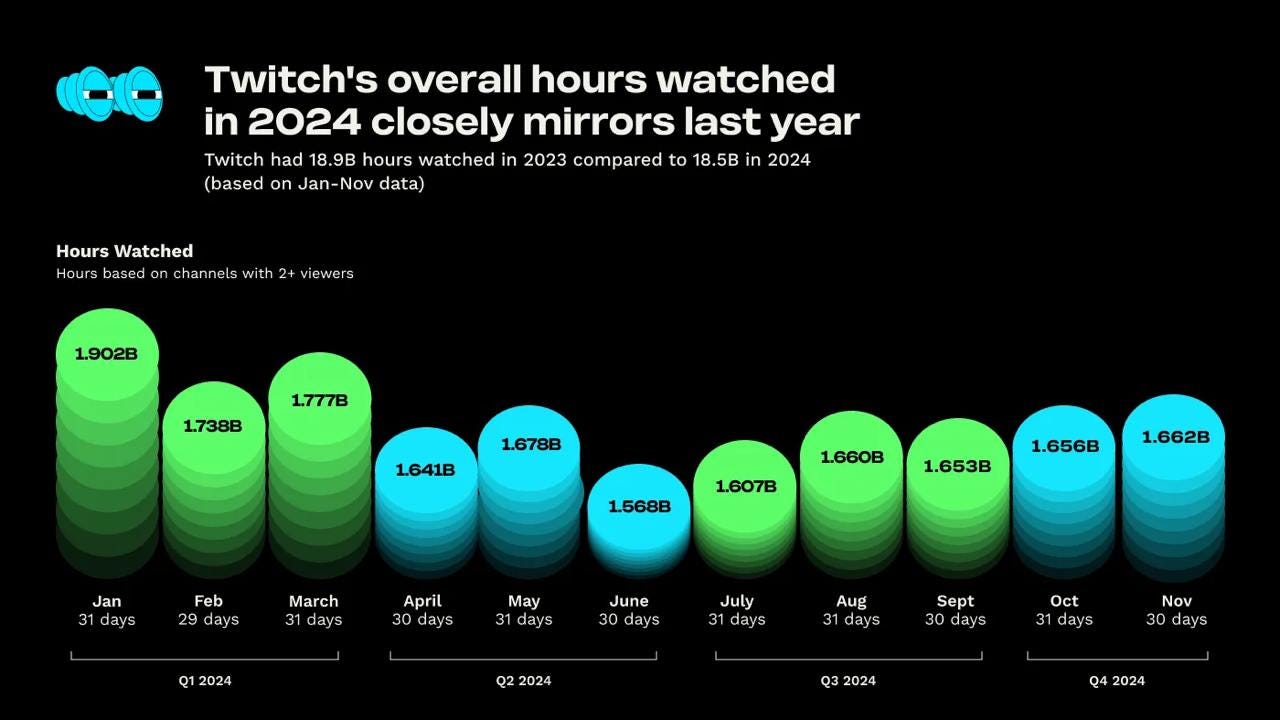
- The average daily number of viewing hours was record-breaking in Q1’24 (January- February was the best month for this indicator); then, it decreased.
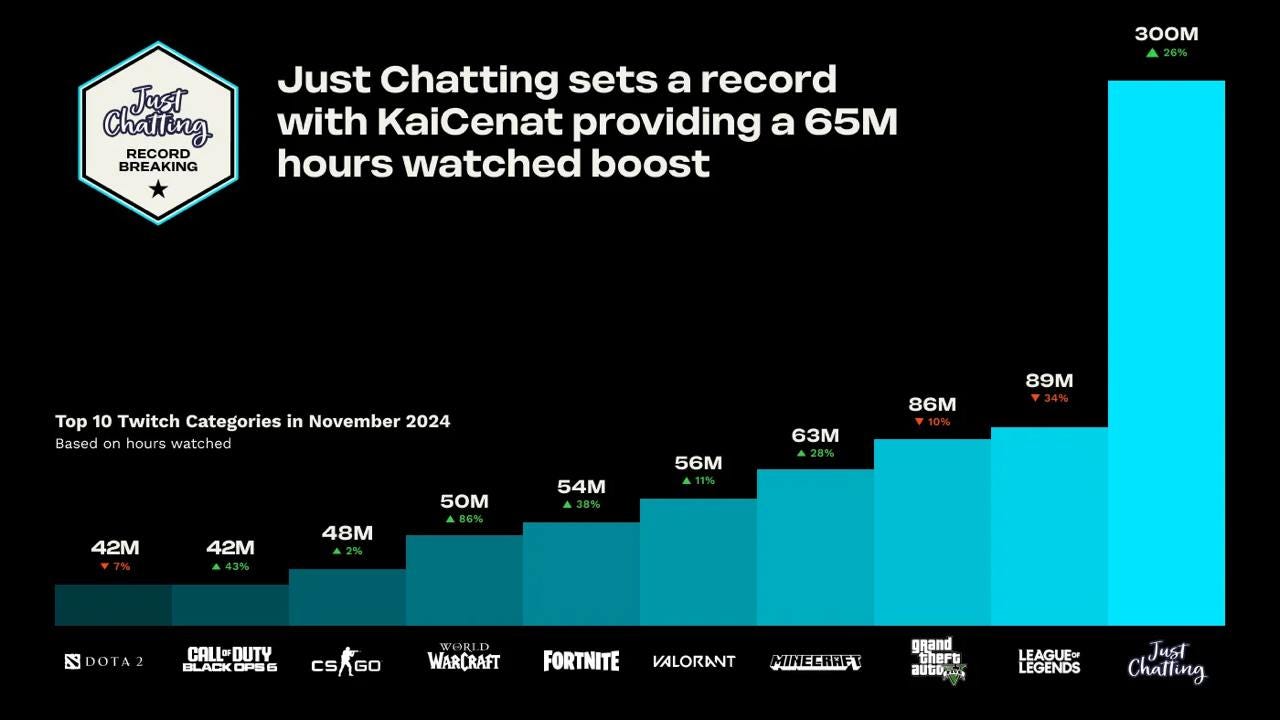
- The top 10 most-viewed categories on Twitch have remained unchanged for 5 years. 9 games have been in this list since 2020. And the most popular category is Just Chatting.
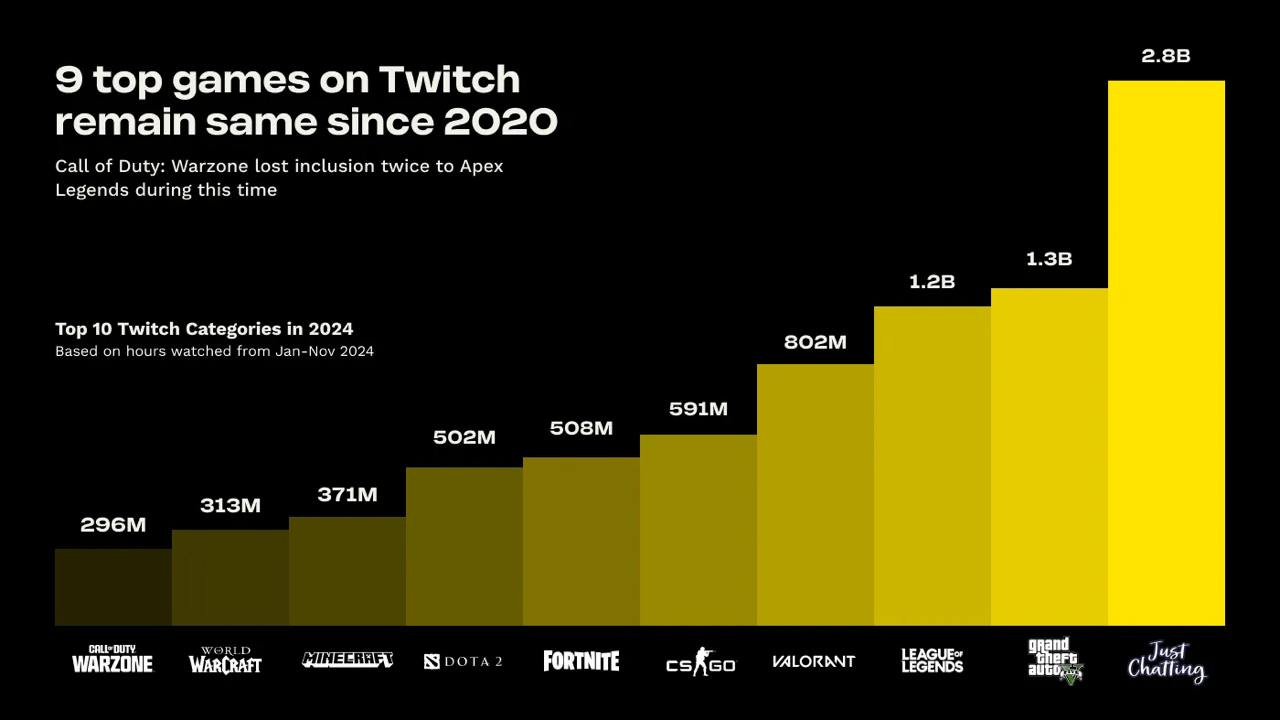
- Grand Theft Auto V is the leader in the number of viewing hours for the first 11 months of 2024.
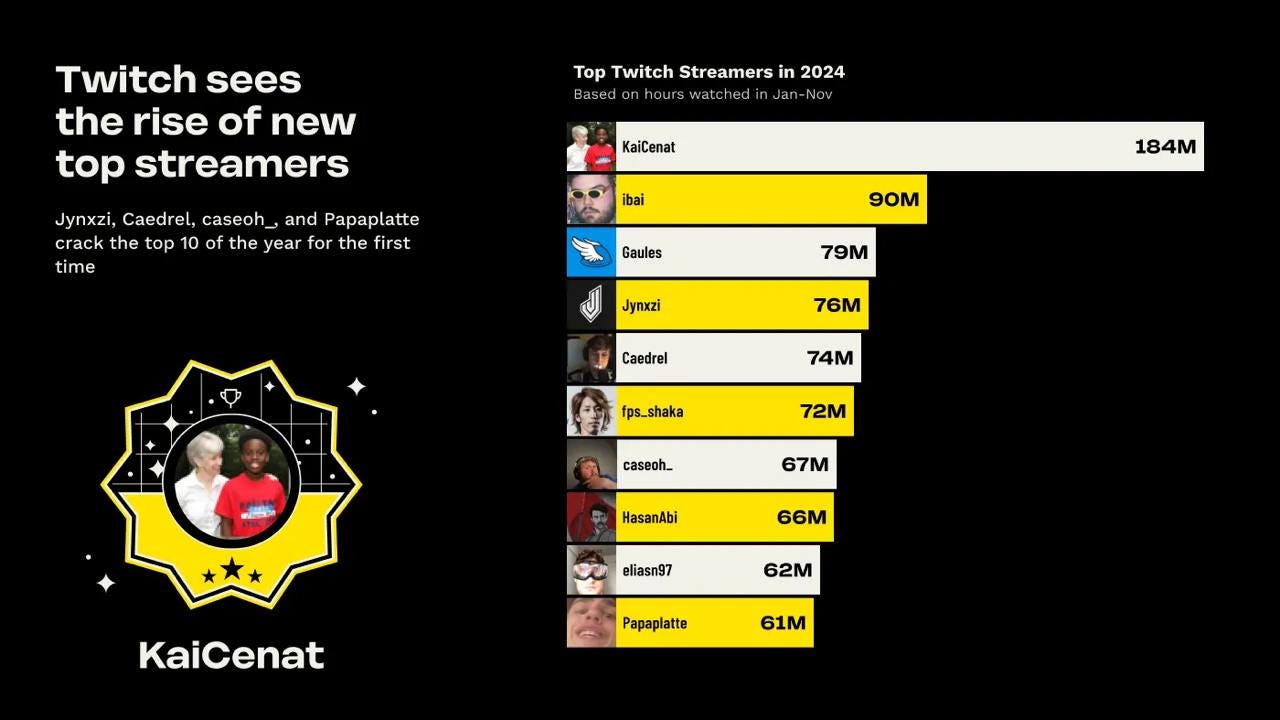
- KaiCenat is the most popular streamer of 2024. From January to November, he was watched for 184 million hours. The closest follower, ibai, has 90 million hours.
Games & Numbers (December 11 - December 24; 2024)
PC/Console Games
- The creation and subsequent operation of Second Life cost more than $1.3 billion (the game was released in 2003). The game’s annual revenue is around $650 million. Second Life became profitable two years after its release. In 2024, the project creators will pay $1.1 billion to content creators. The company retains only 10% of sales, and the chances of earning $10,000 are 100 times higher than in Roblox. The project is expected to be released on mobile devices soon.
- Despite Balatro winning Game of the Year, Buckshot Roulette was bought more times - 4 million. Developers shared this with the Steam Community.
- Balatro sales have surpassed 3.5 million copies. The game recently launched successfully on mobile devices.
- Sales of Tales of Berseria across all platforms reached 2.5 million copies. The game was released in 2017 on PlayStation and PC. Total sales of the series have exceeded 30 million copies.
- Marvel Rivals’ audience has reached 20 million people. It took less than 2 weeks for the game to achieve this.
Mobile Games
- In 4 years since its release, Rush Royale has earned more than $370 million. Overall downloads exceeded 90 million times.
- In the first month after release, Royal Kingdom earned $5.49 million after deducting commissions and taxes (according to AppMagic). The game was downloaded 4.12 million times. Back then, Royal Match earned $1.73 million and had 995,900 downloads over the same period.
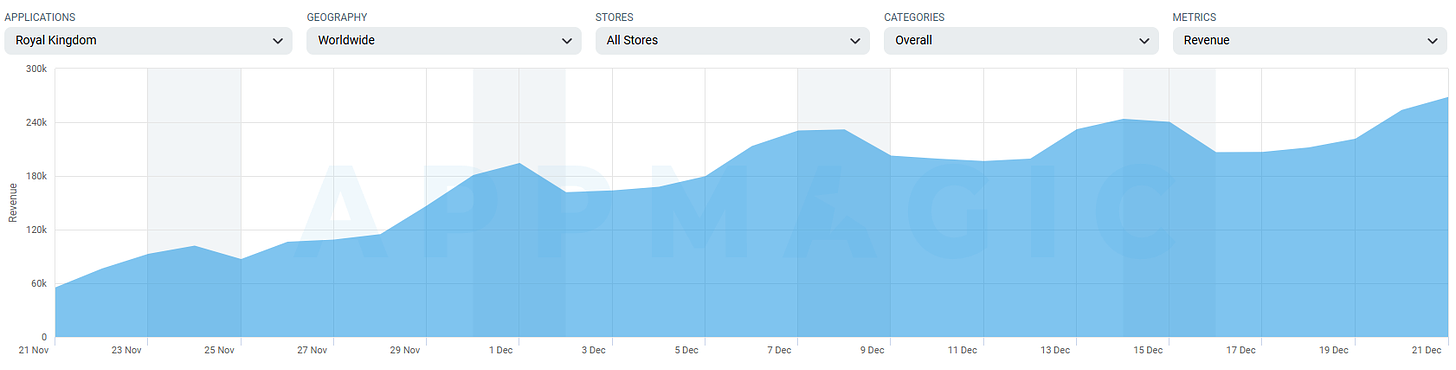
- Animal Crossing: Pocket Camp Complete (formerly a F2P game that Nintendo decided to rework into a Premium project) earned $3.1 million before taxes and commissions in its debut month. One of the days (December 8 - $505k) turned out to be the best in the project’s history. People were motivated by the ability to save their progress.
- Hill Climb Racing series has been downloaded more than 2.5 billion times. 50 million new players come to the game monthly.
- Pokemon TCG Pocket has been downloaded more than 60 million times. The release took place on October 30, 2024. The game’s revenue has already exceeded $200 million.
- Delta Force is actively gaining an audience in China. Daniel Ahmad from Niko Partners noted that the number of players in the Chinese version of the project has exceeded 40 million people. The “beta” started there on September 26 this year.
- Infinity Nikki has been downloaded more than 20 million times. The game was released on December 5 on mobile devices, PC, and PlayStation.
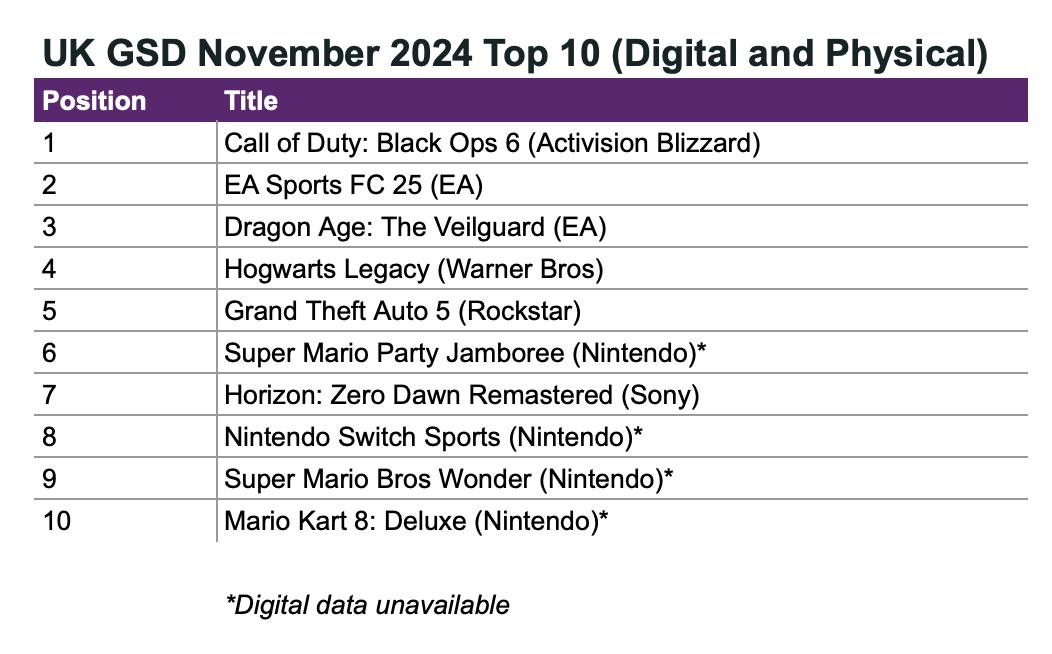
GSD & GfK: Game sales in the UK in November 2024 fell by 33%

Analytical platforms report only actual sales figures obtained directly from partners. The mobile segment is also not taken into account.
Game sales
-
Over 3 million games were sold in the UK in November this year. This figure is 33% lower than last year’s indicators. This is due to two factors: the release of CoD: Black Ops 6 in October 2024; and the absence of Black Friday (analysts will attribute the sale to December).
❗️Therefore, all November results may not reflect the real YoY picture.
- Call of Duty: Black Ops 6 is the sales leader; EA Sports FC 25 is in second place (sales fell by 22% YoY, but remember the factor above. However, the results of the football simulator during sales this year are also 20% worse than in the previous one); Dragon Age: The Veilguard is in third place.
- Another new release of the month was Mario & Luigi: Brothership. The game is selling 16% worse in the first 3 weeks compared to Paper Mario: The Thousand-Year Door and 19% worse than Super Mario RPG.
Hardware sales
- About 270 thousand gaming consoles were sold in November 2024. This is 85% more than in October 2024 but 45% less than in November 2023. Again, I remind you about the difference in calculations, so the comparisons are inaccurate.
- PS5 Pro accounted for 26% of all PS5 systems sold in November. At the same time, more PS5s were sold this Black Friday than last year.
- 1.05 million accessories were sold in the UK in November. An increase of 58% compared to last month, but a decrease of 18% compared to last year. DualSense remains the most popular accessory.
SuperJoost: 154 million people watched The Game Awards 2024

- The number of views increased by 31% compared to last year.
- Joost van Dreunen notes in his blog that this is the largest entertainment event by this metric in 2024. Even the Super Bowl (123.4 million viewers) - the undisputed leader in viewer interest - had fewer viewers.
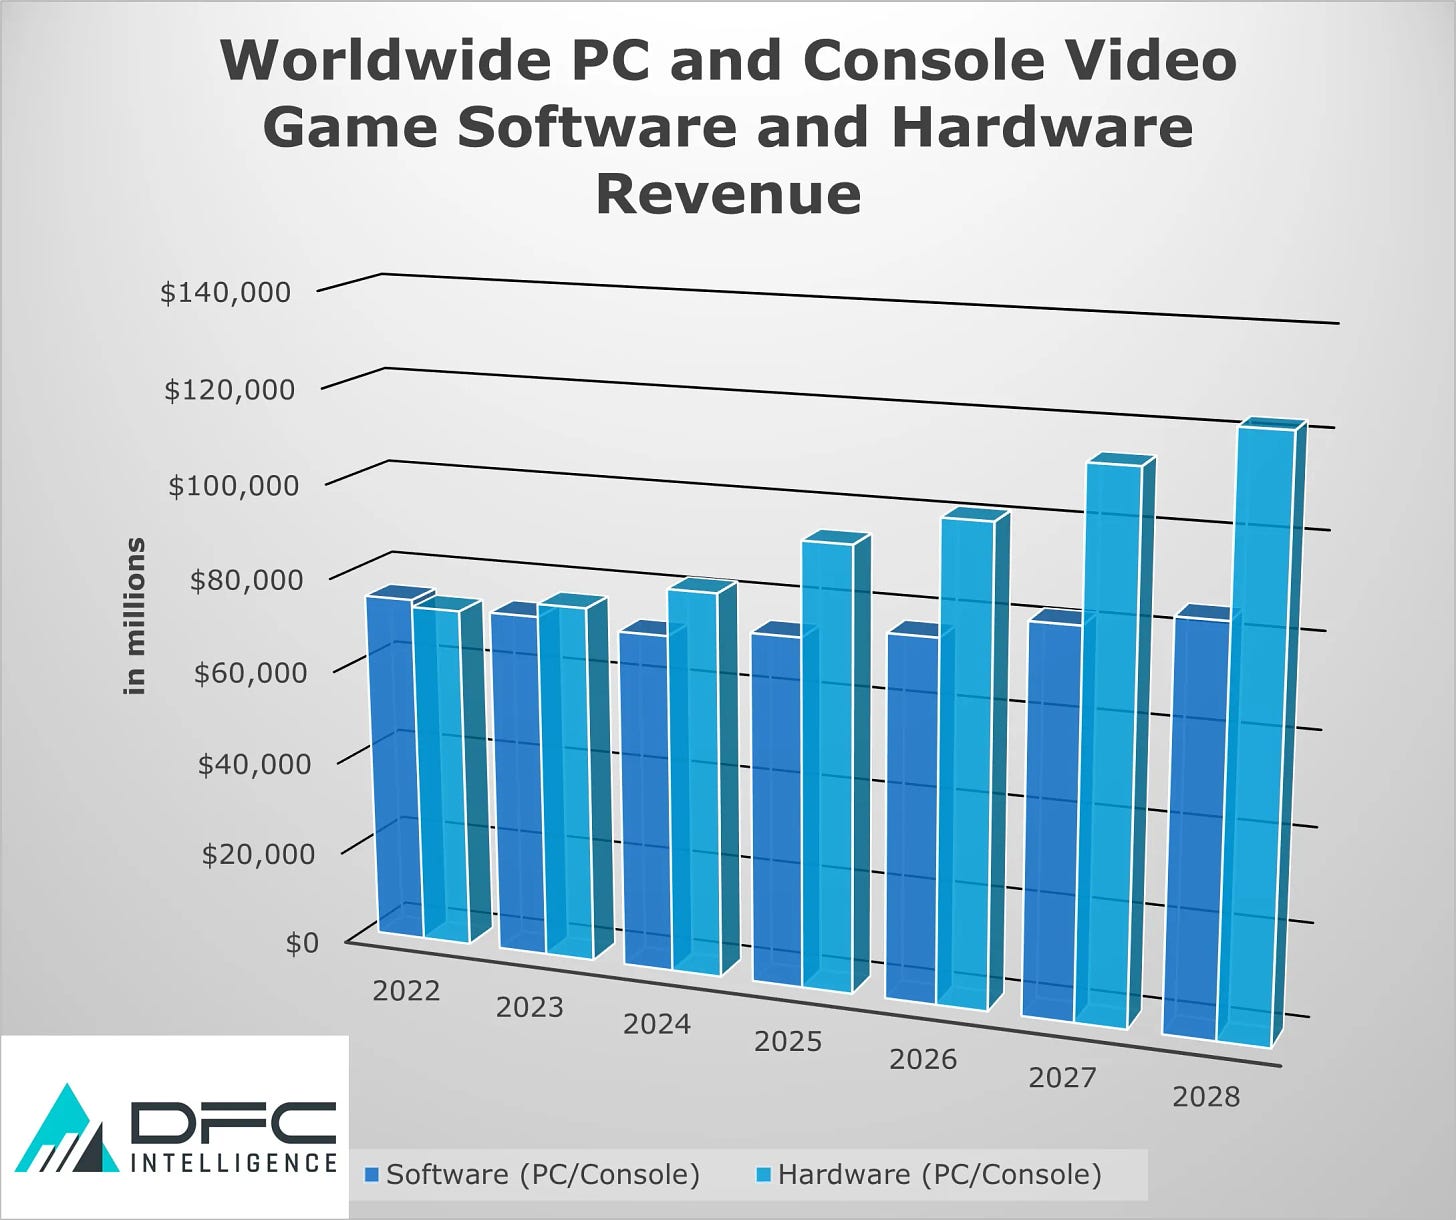
DFC Intelligence: There won’t be room for three consoles in the gaming industry
- The company predicts growth in the gaming industry, but not for everyone. According to DFC Intelligence, one of the three gaming consoles will face significant challenges.
- Analysts believe that user spending on PC/console games will increase from $72 billion in 2024 to $83 billion in 2028. Meanwhile, spending on gaming hardware will grow from $82 billion in 2024 to just over $120 billion in 2028. As a result, the total PC and console market will reach $203 billion in 2028.
❗️DFC Intelligence’s estimate of the overall games software market generally correlates with data from Newzoo and Aldora. However, their estimate of gaming hardware sales differs from Aldora’s data by more than double (DFC Intelligence’s figures are higher).
- A bright future is predicted for the Nintendo Switch 2, with initial sales expected to surpass its predecessor. However, PlayStation and Xbox will face serious competition for their place in the market.
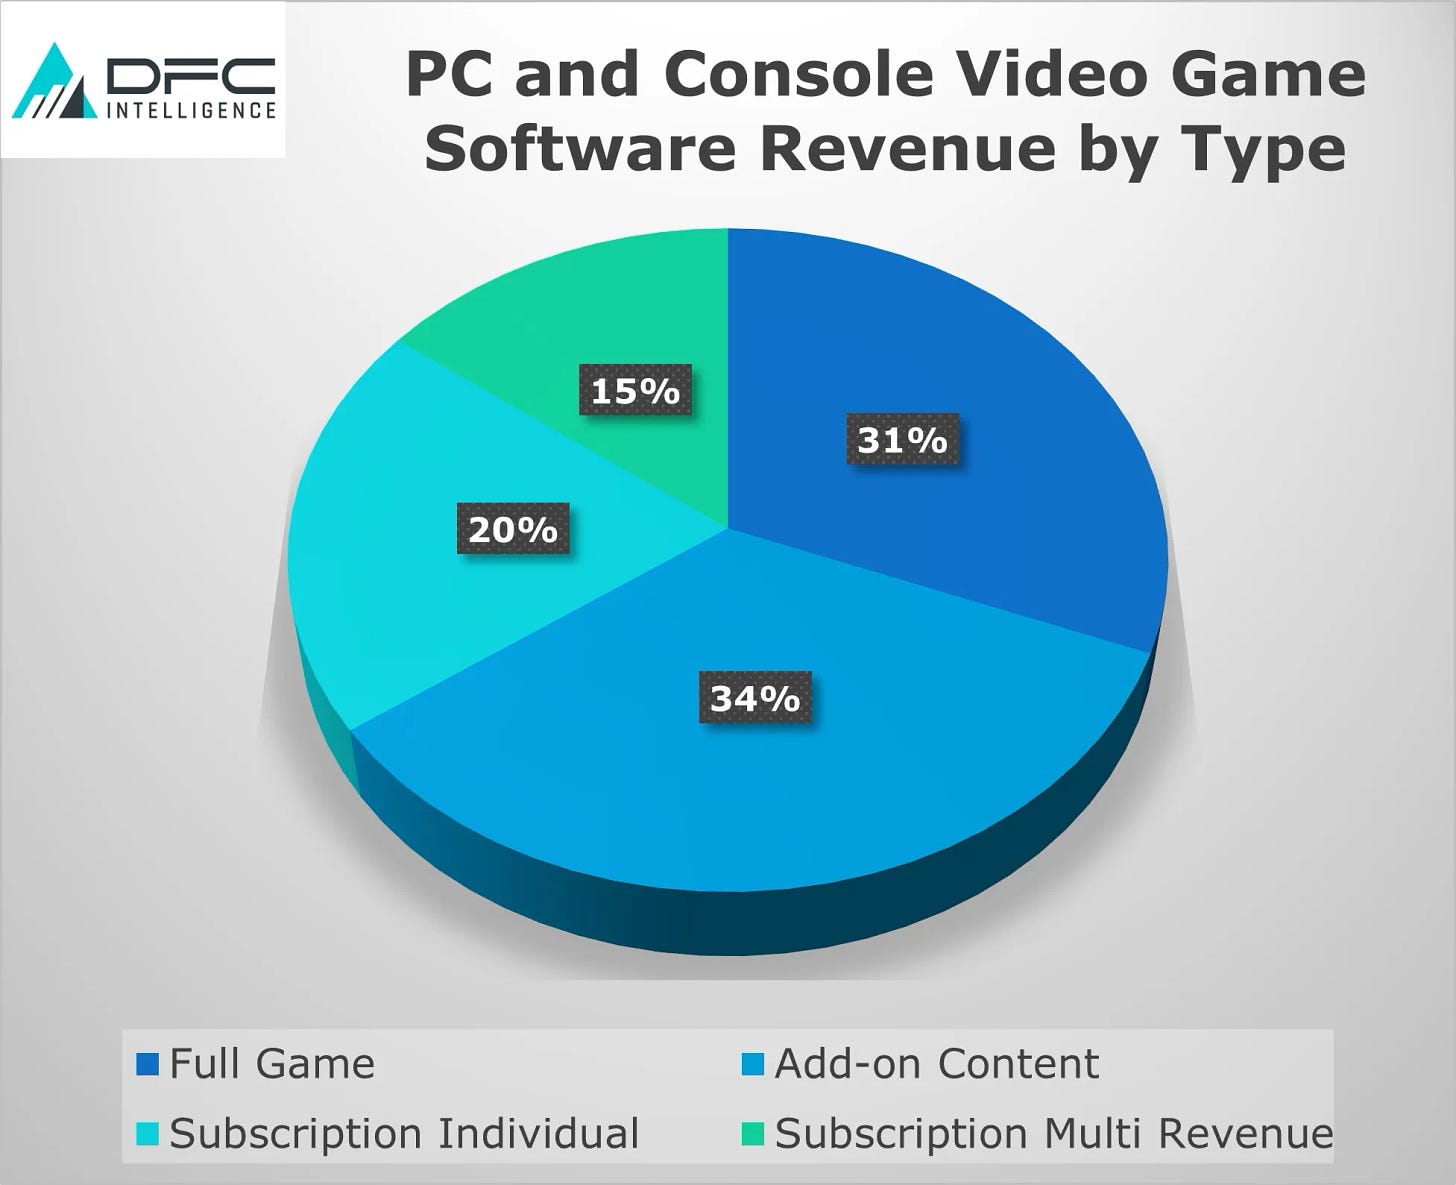
- When considering the structure of payments in PC and console games, DFC Intelligence believes that people will buy more in-game items and subscriptions. Regarding the latter, individual subscriptions (like in WoW) are expected to grow faster than subscription services like Game Pass.
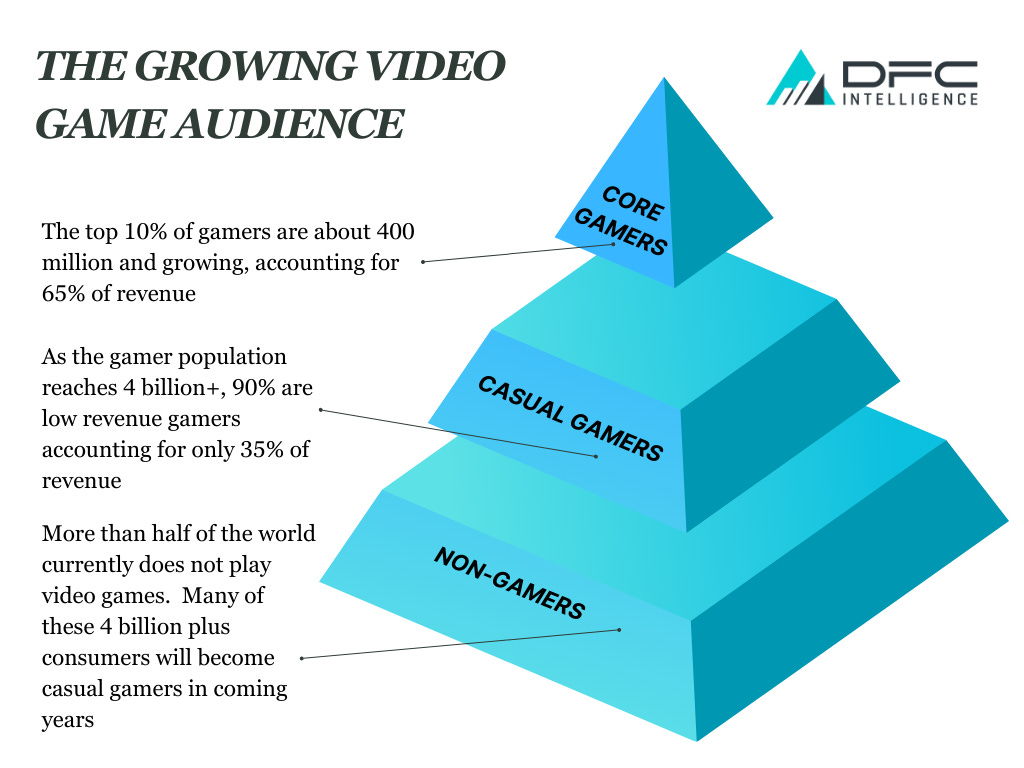
- The number of gamers worldwide will exceed 4 billion by 2027. Most of them will spend little on games. The top 10% of the most valuable players will generate 65% of all revenue.
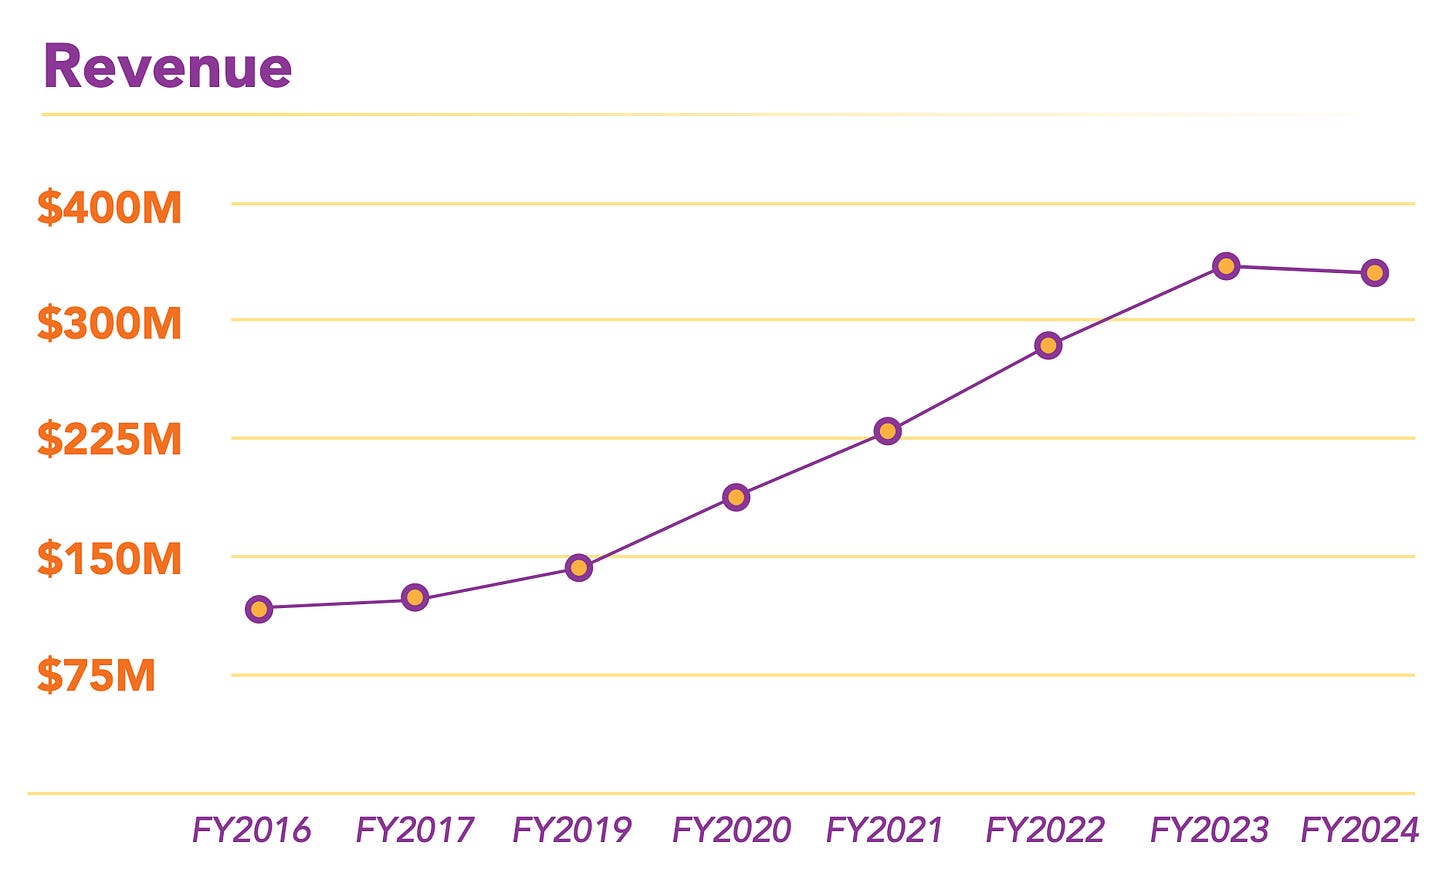
IGEA: Australian Gaming Industry in FY 2024
Results are reported for the 2024 financial year, not the calendar year. The 2024 financial year in Australia runs from July 1, 2023, to June 30, 2024. Throughout the text, I’ll name the FY as a “year” for simplicity.
Financial Results
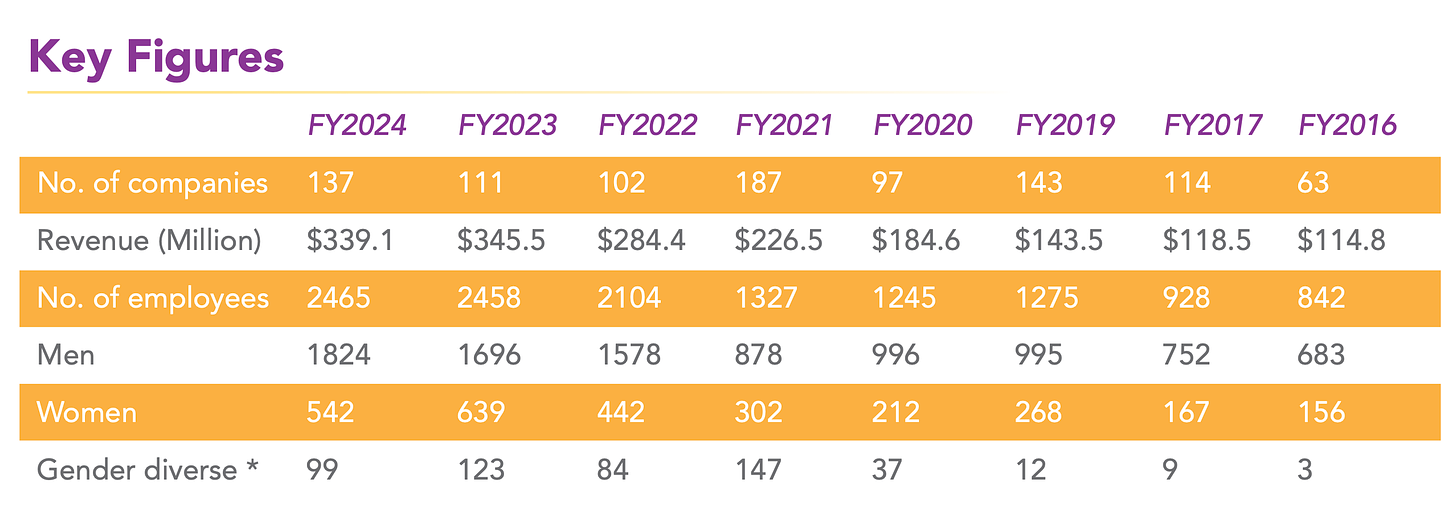
- Australian gaming companies earned $339.1 million in 2024. 93% of this amount came from overseas markets. However, this sum is 1.9% less than last year.
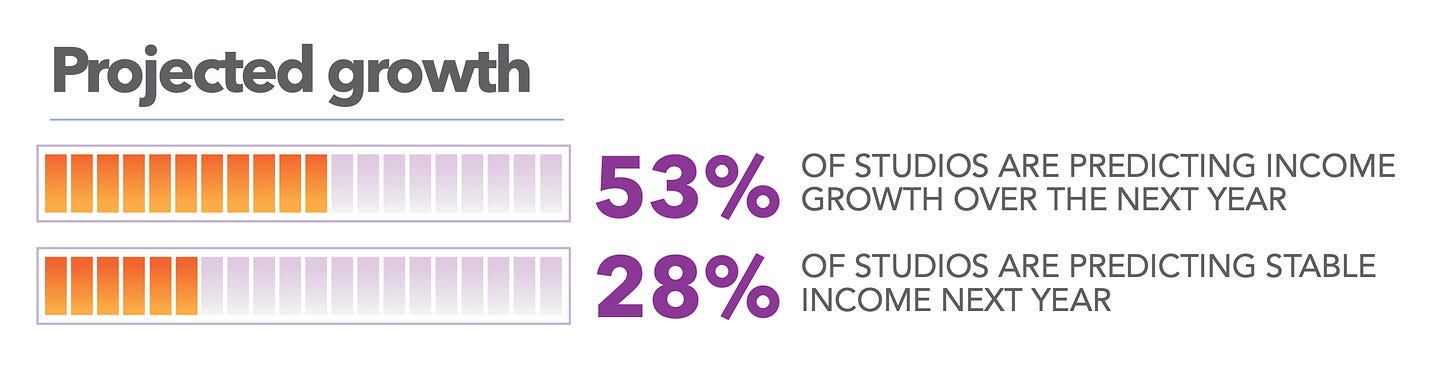
- Regarding revenue, studios are rather optimistic. 53% believe they can increase their income in 2025; 28% plan to stay at least at the same level.
Australian Gaming Companies
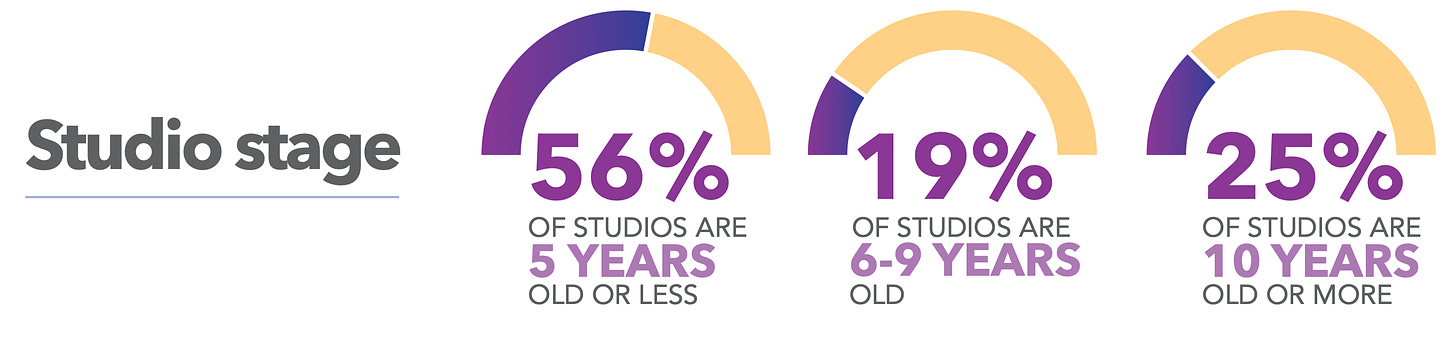
- 25% of studios in the country are over 10 years old. 19% are between 6 and 9 years old. 56% have been in the market for up to 5 years.
- 85% of Australian studios work on their own IP.
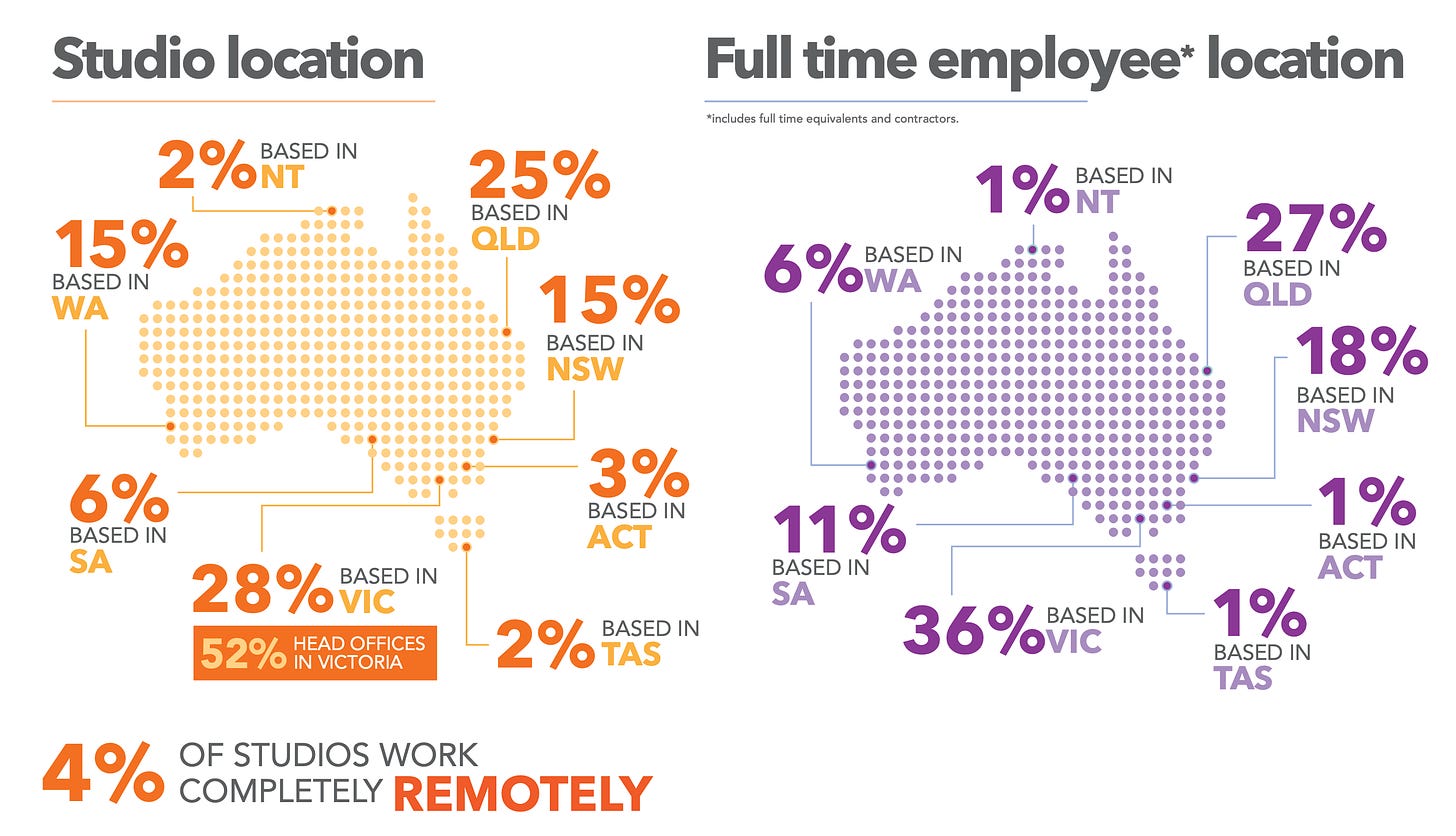
- Only 4% of Australian studios work entirely remotely.
- Local companies cite difficulties in attracting publishing deals (both with international and local publishers) as their main challenges. There’s also a problem with attracting investments in the early stages.
Employment
-
2,465 people are employed in Australian gaming companies. Despite all the industry problems, this is 0.3% more than last year.
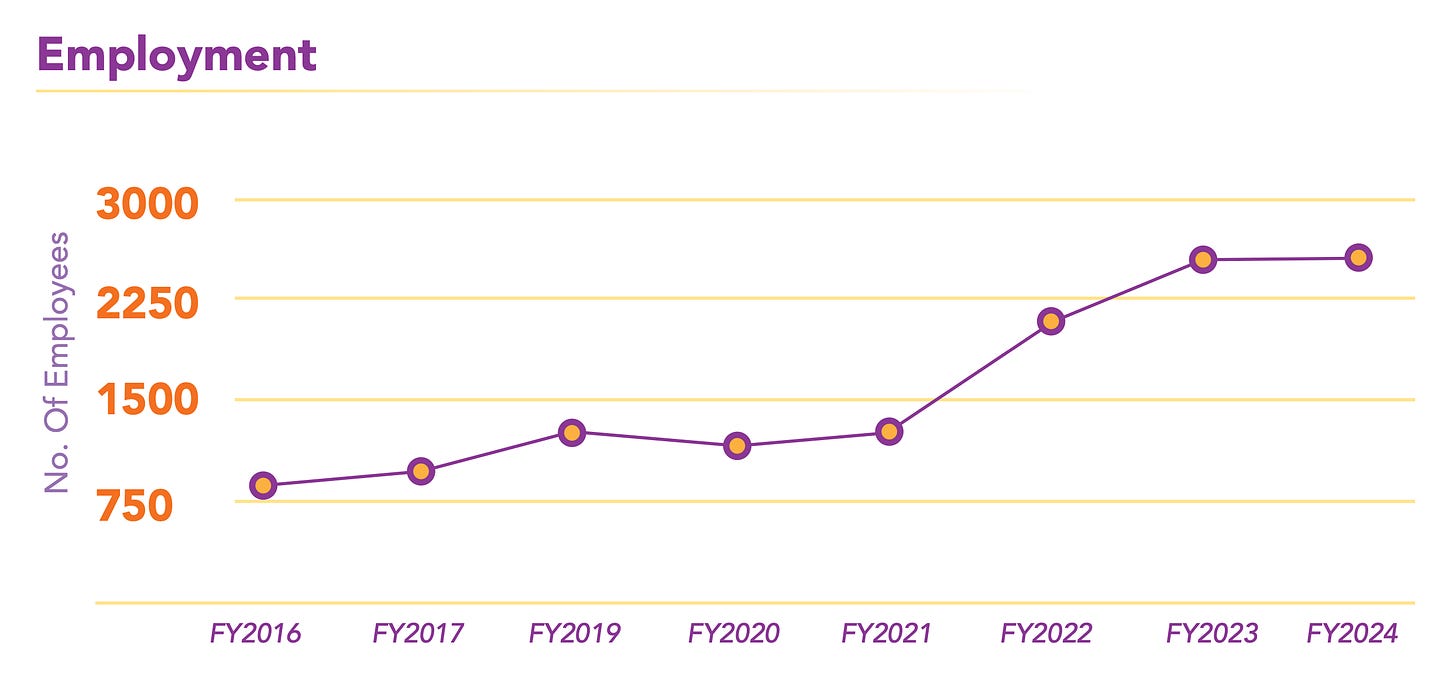
- In 2025, 61% of studios plan to grow their staff.
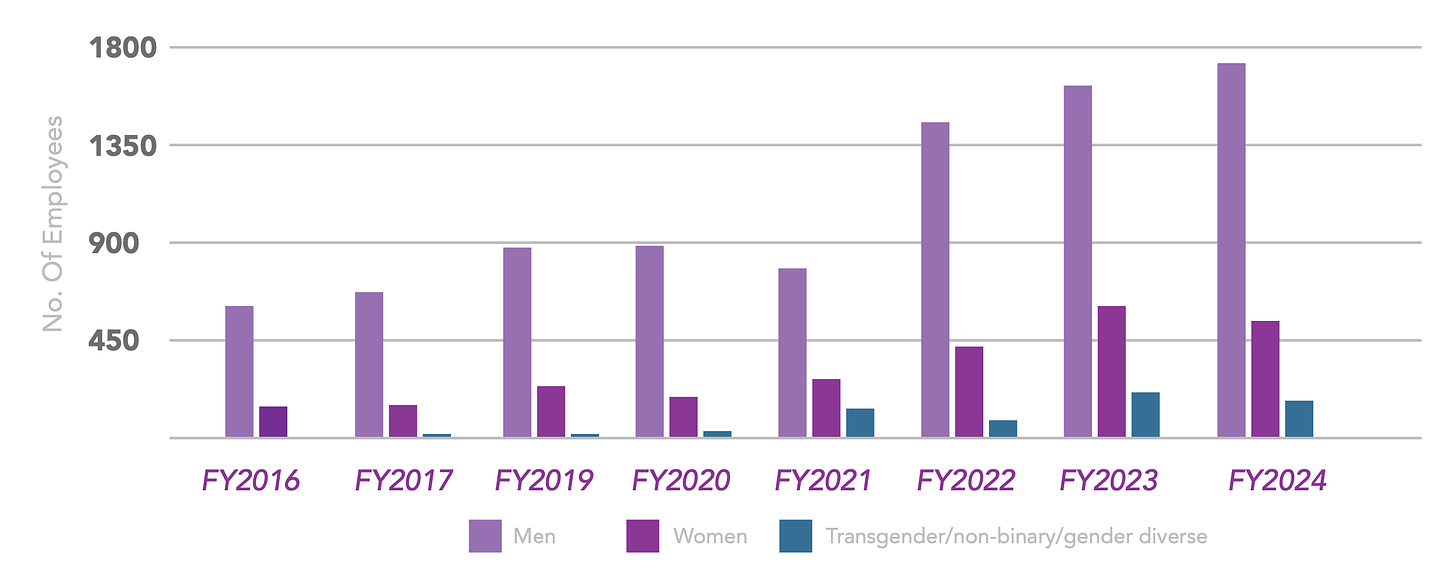
- In 2024, the percentage of gender diversity in the Australian gaming industry decreased.
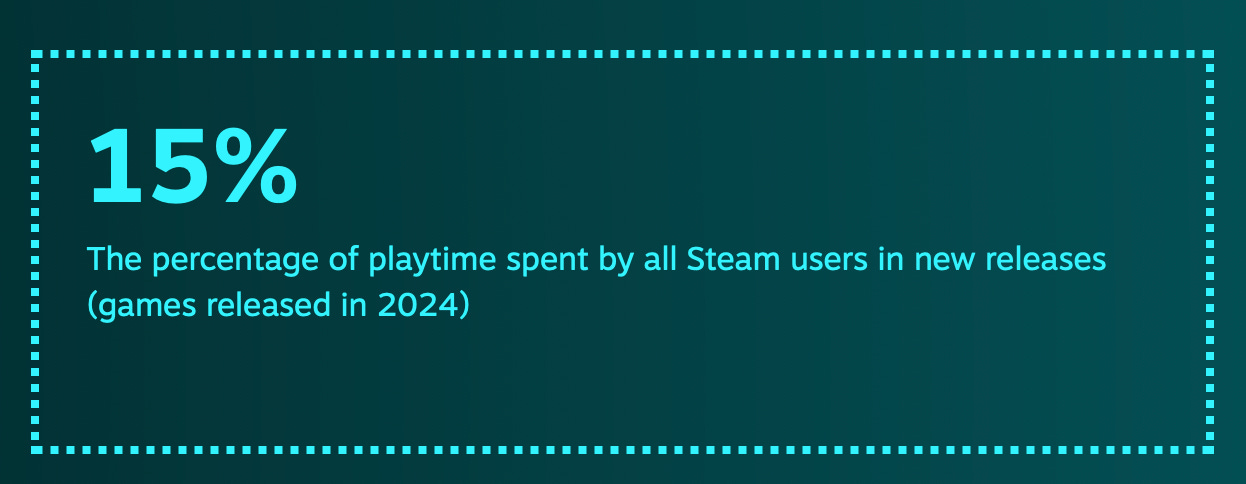
Steam users spent only 15% of their time on games released in 2024

This information comes directly from Valve, comparing user metrics with the platform average as part of Steam Replay 2024 (which showcases the year’s results).
- Games released this year accounted for only 15% of total playtime on Steam.
- Users spent 47% of their total playtime on games released between 2017 and 2023.
- Games released before 2017 occupied 37% of users’ total gaming time.
- In 2023, time spent on new games amounted to 9% of the total (so there’s significant progress here, largely thanks to Palworld, Helldivers II, Black Myth: Wukong). In 2022, Steam users played new games 17% of the time.
- It’s important to note that 2024 is a record-breaking year for the number of new games on Steam (18,597 projects). This is 29.9% more than last year. All of this indicates that competition on the platform is intensifying.
Stay tuned for more updates next month!
Meanwhile, you can check out our free demo to see how devtodev can help your game project succeed.