
In-app purchases (IAP) are transactions made by users within your app or game to acquire virtual goods, premium features, subscriptions, or additional content. They're the main revenue source for free-to-play products — and the metric where product decisions and business outcomes meet most directly.
For product teams, IAP data answers: which offers convert, when do users buy, and what drives repeat purchases? For UA teams, it connects acquisition spend to actual revenue — not just installs.
This glossary entry covers how to analyze IAP performance, what metrics to track, and how to identify what's driving or blocking revenue.
What Are In-App Purchases?
In-app purchases let users buy content directly within your app. In mobile games, that means virtual currencies, cosmetic items, power-ups, battle passes, or level skips. In apps, it means premium features, storage upgrades, or subscription access.
IAP comes in three types — and each requires a different analytical approach:
Consumables — items used once and gone (energy refills, coins, extra lives). Tracked by purchase frequency and repeat rate. High repeat purchase rate signals genuine value perception.
Non-consumables — permanent unlocks (ad removal, character skins, features). Tracked by conversion rate and timing relative to session depth. Low conversion often points to pricing or timing issues.
Subscriptions — recurring revenue. Tracked by trial-to-paid conversion, monthly churn, and renewal rate. The health metric here isn't first purchase — it's whether users renew.
Learn more about analyzing ads, in-app purchases, and subscriptions →
Key IAP Metrics to Track
Paying conversion — percentage of users who make at least one purchase. Industry average for F2P mobile games is 1–5%. Low-paying conversion points indicate timing, pricing, or value perception issues.
ARPPU (Average Revenue Per Paying User) — how much paying users spend on average. Tracks the depth of monetization among your paying base. A declining ARPPU among long-term users is a warning sign.
Time to first purchase — how many days after install a user makes their first purchase. Knowing this distribution helps you time offers more precisely — if 60% of first purchases happen on Day 1–3, that's when your most impactful offer should appear.
Repeat purchase rate — percentage of paying users who make more than one purchase. One-time buyers have lower LTV than repeat payers. A high one-time buyer rate suggests the first purchase experience isn't creating a habit.
Revenue by item type — which items generate the most revenue. Often, 20% of SKUs generate 80% of IAP revenue. Knowing which items drive revenue helps prioritize what to develop and promote.
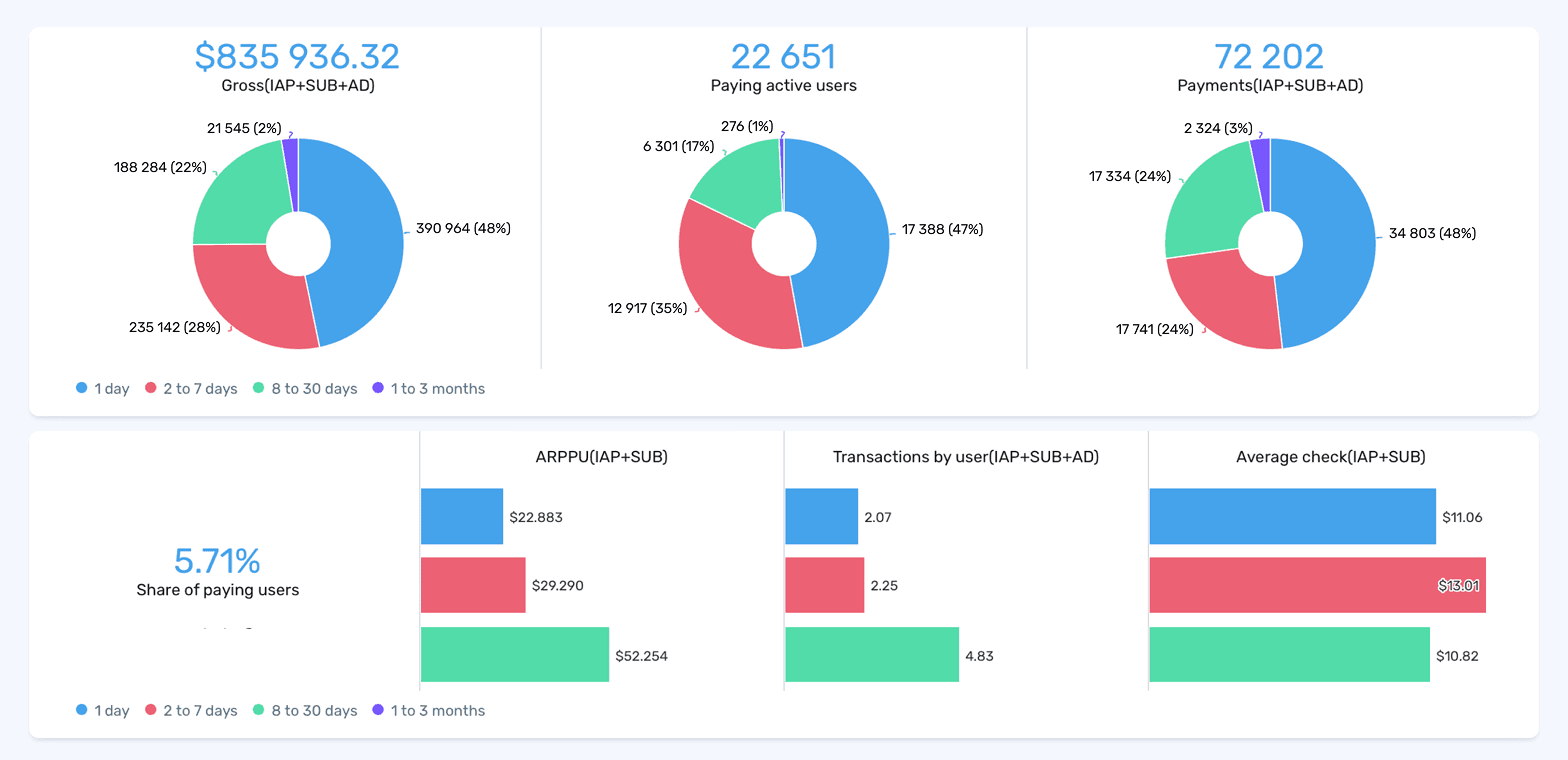
devtodev monetization dashboard — Gross $835k, 22,651 paying active users, 5.71% paying share. ARPPU and average check are highest among users who installed 8–30 days ago ($52 ARPPU vs $22 for Day 1 users), showing that monetization deepens over time.
How to Analyze IAP Performance
Start with the purchase funnel. Map the path from install to first purchase: install → first session → store visit → item view → purchase. Each step has a conversion rate. The step with the highest drop-off is the bottleneck — fix that before changing prices or adding new items.
Segment by user type. Paying users aren't one group. Whales (top 1–2% of spenders) generate 50–60% of IAP revenue. Dolphins contribute steadily. Minnows convert once and rarely return. Each segment responds to different offers — a bundle that converts dolphins won't move whales.
Track IAP by cohort. Compare IAP metrics for users who installed before vs. after a monetization change. Did paying conversion improve? Did ARPPU hold or drop? Cohort comparison is how you measure the actual revenue impact of product decisions.
Screenshot: [IAP cohort analysis from devtodev]
Watch for monetization pressure signals. Rising IAP revenue with falling D30 retention is a warning sign — you may be extracting short-term revenue at the cost of long-term engagement. Monitor both together.
Learn more about in-app purchase structure →
Common IAP Problems and How to Fix Them
Low paying conversion. Users aren't buying. Diagnose before changing prices: check the store visit rate (are users even seeing offers?), the item view rate (are they engaging with what's available?), and the purchase drop-off rate (are they abandoning at checkout?). Each has a different fix.
High one-time buyer rate. Users buy once and never again. Usually, a sign that the first purchase didn't deliver perceived value, or that follow-up offers aren't timed well. Review what happens after the first purchase — is there a natural next offer, or does the monetization experience go quiet?
Declining ARPPU among long-term users. Your most engaged users are spending less over time. Check whether aggressive early monetization is front-loading revenue and burning out payers. Also check whether long-term content — the items that matter to Day 30+ users — is priced and positioned well.
IAP revenue concentrated in too few SKUs. If 2–3 items generate 80%+ of revenue, you're exposed. A change to those items — a price adjustment, a content update — can significantly swing revenue. Diversify the offer mix over time.
Takeaways
- IAP comes in three types: consumables, non-consumables, and subscriptions — each with different health metrics.
- Core IAP metrics: paying conversion (1–5% is typical for F2P), ARPPU, time to first purchase, and repeat purchase rate.
- Start analysis with the purchase funnel — find where users drop off before buying, not just whether they buy.
- Segment paying users: whales, dolphins, and minnows respond to different offers and need different retention strategies.
- Compare IAP metrics by cohort to measure the real revenue impact of monetization changes.
- Watch for the warning sign: rising IAP revenue + falling D30 retention = short-term extraction, long-term damage.
See your IAP revenue by item, cohort, and user segment — and find what's driving or blocking purchases. Explore devtodev →