
Cumulative ARPU (CARPU) tracks the total revenue generated per user within a cohort from their install date forward. Unlike daily ARPU — which gives a snapshot — CARPU shows revenue accumulation over time, making it the primary metric for evaluating cohort profitability and UA payback.
For UA teams, CARPU answers: when does this cohort pay back its acquisition cost?
For product teams, it answers: which product changes actually improved long-term revenue per user? This glossary entry covers how CARPU is calculated, how to use it for payback analysis, and how to compare cohorts.
What Is CARPU?
CARPU measures the average cumulative revenue per user within a cohort — starting from Day 0 and growing with each additional day users remain active and spend.
It's a curve, not a single number. Day 7 CARPU tells you revenue per user after one week. Day 30 CARPU tells you revenue per user after one month. The shape of the curve tells you when revenue is being generated — early, steadily, or late.
A steep early curve with a flat tail means most revenue comes from impulse buyers in the first few days. A steadily rising curve means users are spending consistently over time — a healthier monetization pattern for most products.
Learn more about cumulative ARPU →
How to Calculate CARPU
Formula:
| CARPU for N days = Total Revenue from Cohort for N days / Number of Users in the Cohort |
|---|
Example:
- Cohort of 1,000 users installs on January 1
- Day 1: cohort generates $800 → Day 1 CARPU = $0.80
- Day 2: cohort generates additional $500 → Day 2 CARPU = ($800 + $500) / 1,000 = $1.30
- Day 7: total cohort revenue = $2,643 → Day 7 CARPU = $2.643
CARPU always increases or stays flat — it never decreases, because cumulative revenue can only grow. What you watch is the rate of growth: is the curve steepening or flattening?
How to Use CARPU for Payback Analysis
The most important use of CARPU is comparing it to CPI to find the payback point — the day when cumulative revenue per user exceeds acquisition cost.
Example: CPI = $2.50. If Day 30 CARPU = $1.80, the cohort hasn't paid back yet. If Day 60 CARPU = $2.70, payback happened somewhere between Day 30 and Day 60.
Knowing your payback period determines how aggressively you can scale UA:
- Payback < 30 days — strong economics, scale confidently
- Payback 30–90 days — healthy, standard for mid-core games
- Payback > 90 days — requires either lower CPI or higher CARPU to be sustainable
Learn more about LTV and how to predict it →
How to Compare Cohorts with CARPU
CARPU is the cleanest way to measure the revenue impact of product changes — because it controls for cohort size and isolates the effect on per-user revenue over time.
Before vs after a product update: Compare the CARPU curve of users who installed before the update to users who installed after. If the new cohort's curve sits higher at every point, the update improved monetization. If it's lower — even if Day 1 CARPU looks similar — the update may be hurting long-term revenue.
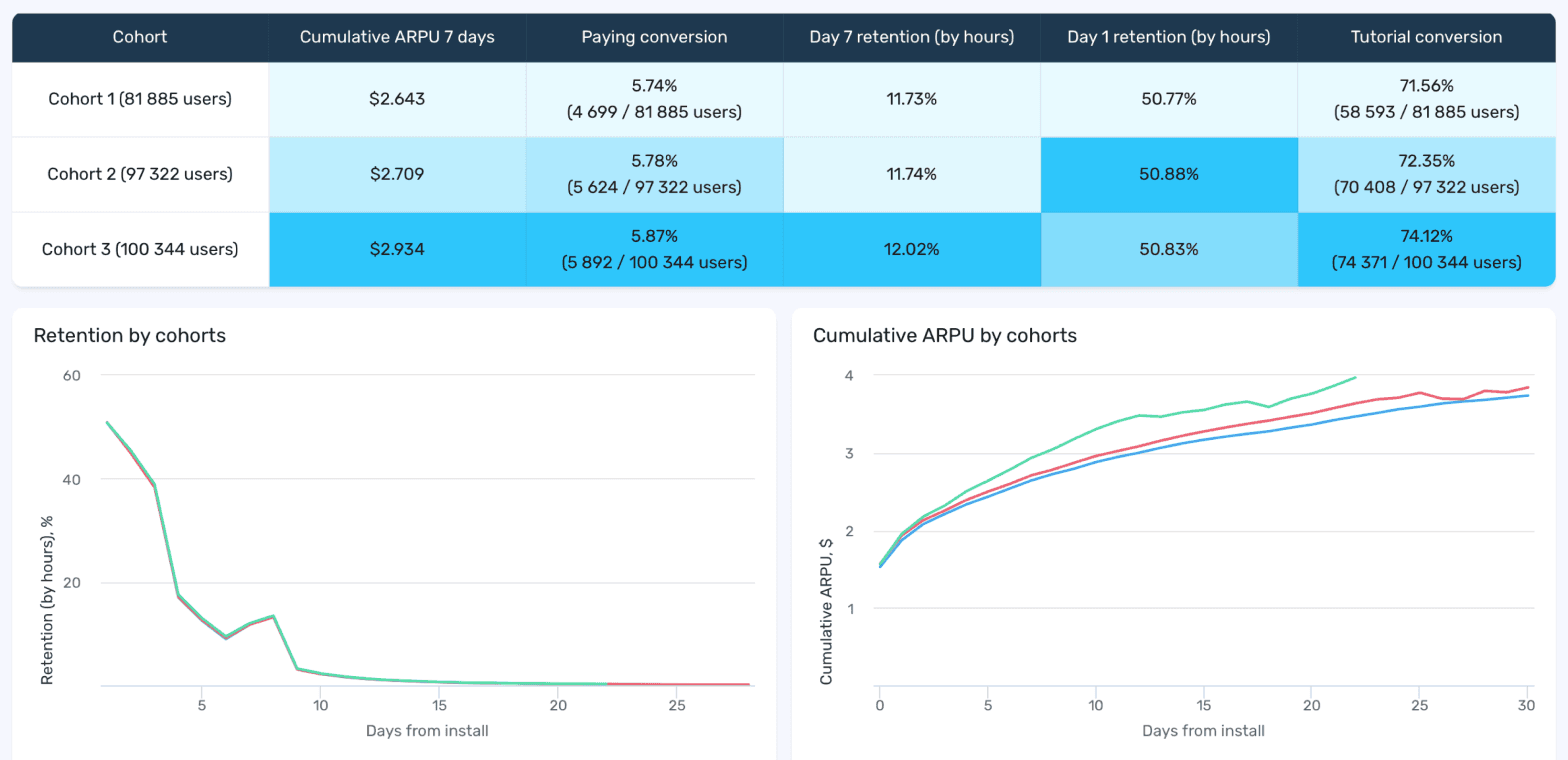
Screenshot: devtodev cohort report — three cohorts compared on Cumulative ARPU, paying conversion, retention, and tutorial conversion, with ARPU curves growing steadily to ~$3.80 by Day 30. Cohort 3 outperforms on every metric.
Across acquisition channels: Different channels produce users with different CARPU profiles. A channel with high Day 1 CARPU but a flat curve after Day 7 is bringing impulse buyers. A channel with lower Day 1 CARPU but a steadily rising curve may deliver better LTV. CARPU comparison over 30–60 days reveals the difference.
CARPU vs LTV
CARPU and LTV are closely related but serve different purposes.
| CARPU | LTV | |
|---|---|---|
| What it measures | Cumulative revenue per user up to Day N | Total revenue per user over entire lifetime |
| Time horizon | Fixed — Day 7, Day 30, Day 90 | Open — until churn |
| Best for | Payback analysis, cohort comparison | Acquisition budgeting, long-term forecasting |
| Known at | Any point in time | Only after users churn (or via prediction) |
Use CARPU for operational decisions — is this cohort on track? Use LTV for strategic decisions — how much can we spend to acquire a user?
Takeaways
- CARPU = cumulative revenue per cohort user from install to Day N. It's a curve, not a single number.
- CARPU never decreases — watch the rate of growth, not the direction.
- Compare CARPU to CPI to find your payback period — the day cumulative revenue exceeds acquisition cost.
- Payback under 30 days = strong economics. Over 90 days = requires lower CPI or higher revenue per user.
- Use CARPU to measure the revenue impact of product changes — compare cohorts before and after the update.
- CARPU is for operational decisions. LTV is for strategic ones.
See CARPU by cohort, channel, and update — and find your payback point. Explore devtodev →