
ARPU (Average Revenue Per User) measures the average revenue generated per active user over a specific time period. It combines the size of your paying base with how much they spend — making it a key indicator of overall monetization efficiency.
For product teams, ARPU tracks whether monetization changes are actually improving revenue per user. For UA teams, it's the benchmark against which CPI is measured — if ARPU exceeds CPI, acquisition is profitable.
This glossary entry covers how to calculate ARPU, how it differs from ARPPU, and how to use it to diagnose monetization performance.
What Is ARPU?
ARPU measures average revenue across all active users — paying and non-paying alike. That's what makes it different from ARPPU (Average Revenue Per Paying User), which only counts users who made at least one purchase.
If your game has 10,000 DAU and 500 of them are paying, ARPU reflects the revenue spread across all 10,000. ARPPU reflects only the 500 payers. Both matter — but they answer different questions.
ARPU answers: how efficiently is the entire active audience monetizing? ARPPU answers: how much are paying users actually spending?
A high ARPPU with a low paying share can produce a low ARPU. A moderate ARPPU with a high paying share can produce a healthy ARPU. Understanding both together gives you the full picture.
Learn more about ARPU and ARPPU — what's the difference →
How to Calculate ARPU
Formula:
| ARPU = Total Revenue / Number of Active Users |
|---|
Example: Your game generates $3,000 in a day from 5,000 DAU. ARPU = $0.60.
ARPU can be calculated for different time windows, and each has a name:
| Metric | Formula | Use case |
|---|---|---|
| ARPDAU | Daily revenue / DAU | Daily monetization health |
| ARPWAU | Weekly revenue / WAU | Weekly campaign performance |
| ARPMAU | Monthly revenue / MAU | Monthly reporting, investor metrics |
Choose the timeframe based on what you're measuring. ARPDAU is most sensitive to daily changes — useful for catching monetization regressions quickly. ARPMAU smooths out daily fluctuations — better for trend analysis.
What Affects ARPU?
ARPU is the product of two things: how many users pay (Paying Share) and how much they pay (ARPPU). To increase ARPU, you need to move at least one of them.
Paying Share — the percentage of active users who made at least one purchase. Typical range for F2P mobile games: 1–5%. Increases when offer timing, onboarding quality, and paywall design improve.
ARPPU — average spend among paying users. Increases when pricing strategy, bundle design, and high-value content improve. If ARPU is low but ARPPU is healthy, the problem is converting non-payers — not extracting more from existing payers.
User mix — ARPU changes when the composition of your active audience changes, even if individual behavior stays the same. A UA campaign that brings in lower-value users will pull ARPU down. Segment ARPU by acquisition channel to see this clearly.
Learn more about average revenue per user →
How to Use ARPU
Compare ARPU to CPI. The simplest profitability check: is ARPU (over a reasonable time window) higher than CPI? If ARPDAU × 30 < CPI, your 30-day cohorts aren't paying back acquisition cost. That's the baseline before any other analysis.
Track ARPU by cohort. Aggregate ARPU hides cohort-level shifts. Compare ARPDAU for users who installed last month vs. three months ago. If newer cohorts have lower ARPU, either acquisition quality has declined or recent product changes are reducing monetization.
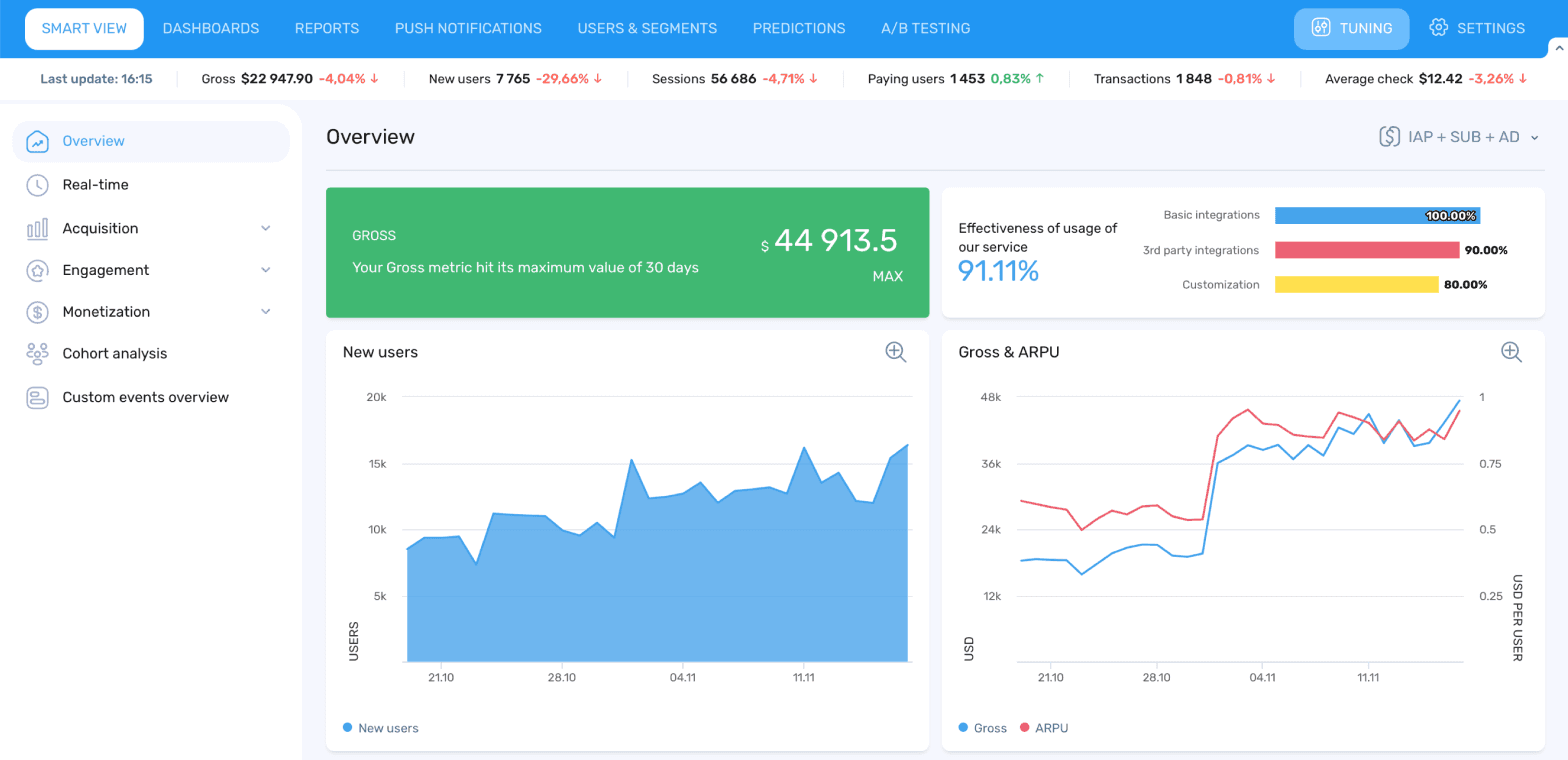
Screenshot: devtodev Overview dashboard showing Gross and ARPU trends side by side — when New users spike in early November, ARPU dips slightly before recovering, showing how user mix shifts affect the metric.
Use ARPU to evaluate product changes. Shipped a new paywall? Changed offer timing? Compare ARPDAU before and after, controlling for user mix. A rising DAU with stable ARPDAU means the change didn't hurt monetization. A falling ARPDAU means it did — even if gross revenue looks flat.
Segment ARPU by country. ARPU varies significantly by market. A game with strong DAU in a Tier-3 market may show lower aggregate ARPU than one with smaller but higher-spending Tier-1 audience. Segment before drawing conclusions.
ARPU vs ARPPU: When to Use Each
| ARPU | ARPPU | |
|---|---|---|
| Includes | All active users | Paying users only |
| Best for | Overall monetization efficiency | Payer behavior and spend depth |
| Falls when | DAU grows faster than revenue | High-value payers churn |
| Rises when | More users pay or payers spend more | Existing payers spend more |
Use ARPU to track the health of monetization at the product level. Use ARPPU to track the behavior of your paying segment. Watch both — they tell different parts of the same story.
Learn more about average revenue per paying user →
Learn more about cumulative ARPU →
Takeaways
- ARPU = Total Revenue / Active Users. It measures monetization efficiency across the entire active audience, not just payers.
- ARPU = Paying Share × ARPPU. To increase ARPU, improve one or both.
- Use ARPDAU for daily monitoring, ARPMAU for trend analysis and reporting.
- Always compare ARPU to CPI — that ratio determines whether acquisition is profitable.
- Segment ARPU by cohort and acquisition channel before drawing conclusions from the aggregate number.
- ARPU and ARPPU answer different questions — track both together for the full monetization picture.
See your ARPU segmented by cohort, channel, and country — alongside paying share and ARPPU. Explore devtodev →