
ARPPU (Average Revenue Per Paying User) measures the average revenue generated by users who made at least one purchase in a given period. Unlike ARPU, it excludes non-paying users — making it a precise measure of spending depth among your monetizing audience.
For product teams, ARPPU tracks whether your paying users are spending more or less over time — and flags when high-value payers are churning.
For UA teams, it helps evaluate whether acquired users who do convert are spending at a healthy level. This glossary entry covers how to calculate ARPPU, how it relates to ARPU, and how to use it to diagnose and improve monetization.
What Is ARPPU?
ARPPU measures the average spend of users who paid at least once during a selected period. It answers the question: among users who are willing to pay, how much are they actually spending?
Because it excludes non-payers, ARPPU is always higher than ARPU. The gap between them reflects your paying share: the smaller the paying base, the bigger the gap.
Example: 10,000 DAU, 200 paying users, $2,000 daily revenue.
- ARPU = $2,000 / 10,000 = $0.20
- ARPPU = $2,000 / 200 = $10.00
Same revenue, very different pictures. ARPU tells you monetization is thin across the audience. ARPPU tells you that payers are spending $10 each, which may be healthy or low depending on your genre and price points.
How to Calculate ARPPU
Formula:
| ARPPU = Total Revenue / Number of Paying Users |
|---|
Paying users are counted as unique users who made at least one purchase in the selected period. A user who made five purchases counts as one paying user — their total spend contributes to revenue, but they're counted once in the denominator.
Choose the right time window: daily ARPPU for monitoring, monthly ARPPU for reporting. Comparing daily and monthly ARPPU can reveal whether payers are making one-time purchases or returning to spend repeatedly.
What Affects ARPPU?
Price points. The average price of your items sets the ceiling on ARPPU. A catalog dominated by $0.99 items will produce lower ARPPU than one with a mix including $9.99 and $19.99 offers.
Bundle design. Well-designed bundles increase average transaction size. A user who would spend $2 on a single item may spend $7 on a bundle — lifting ARPPU without changing the paying base.
Repeat purchases. ARPPU rises when payers buy more than once. A high one-time buyer rate keeps ARPPU artificially low — the denominator grows but spend per user stays flat.
Whale concentration. If top spenders account for a large share of revenue, ARPPU is sensitive to their behavior. When whales churn, ARPPU drops sharply even if the rest of the paying base is stable.
Install recency. Users who installed 8–30 days ago often show higher ARPPU than Day 1 users — they've had time to experience the product and develop spending habits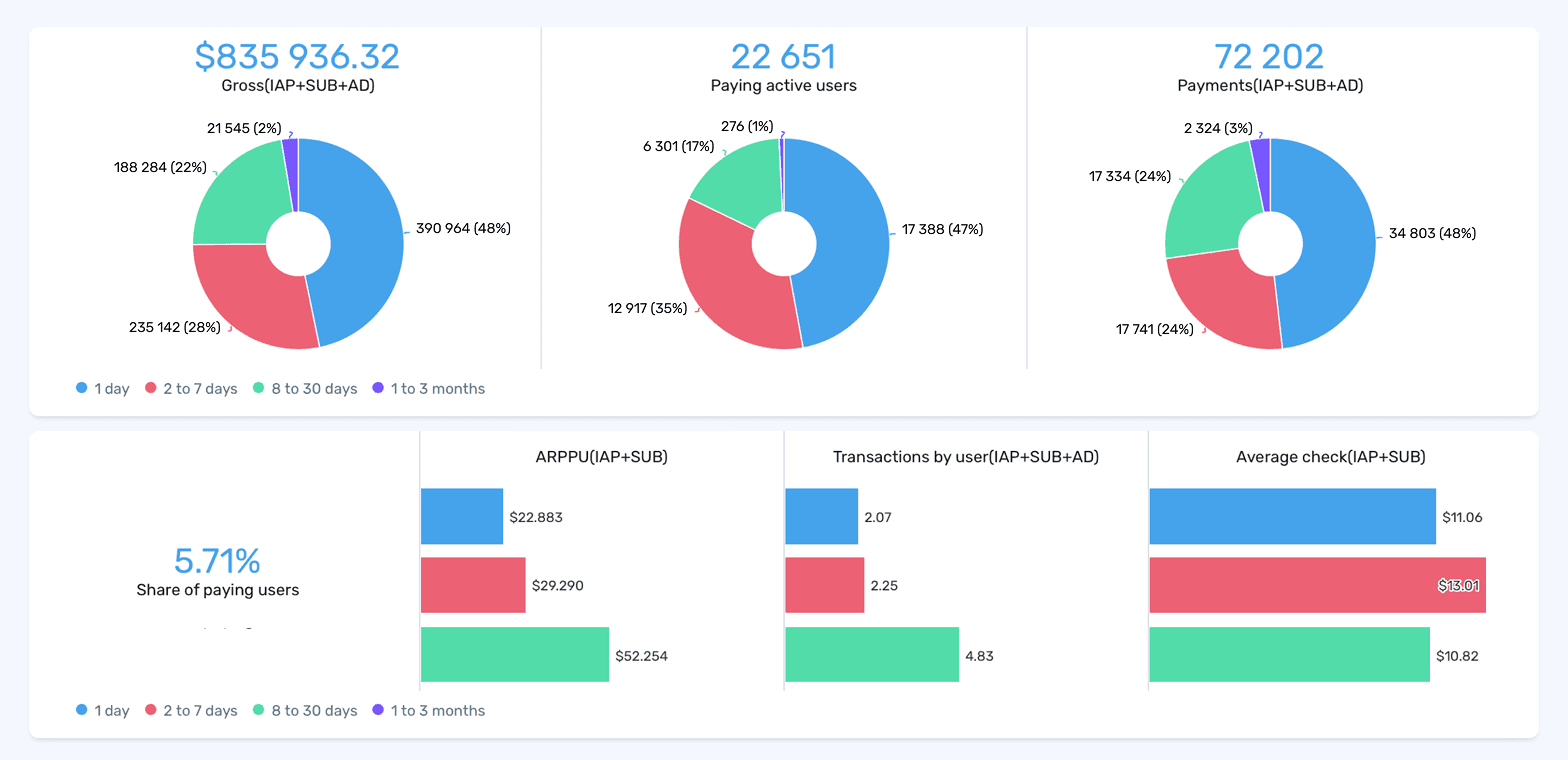
Screenshot: devtodev Monetization report — Paying share (blue) stays stable while ARPPU (red) fluctuates week to week. A dip in ARPPU without a drop in paying share means existing payers are spending less — not that fewer users are paying.
How to Use ARPPU
Monitor ARPPU trends over time. A declining ARPPU among long-term users is a warning sign — your most engaged payers are spending less before leaving. Check whether aggressive monetization is front-loading revenue and burning out payers.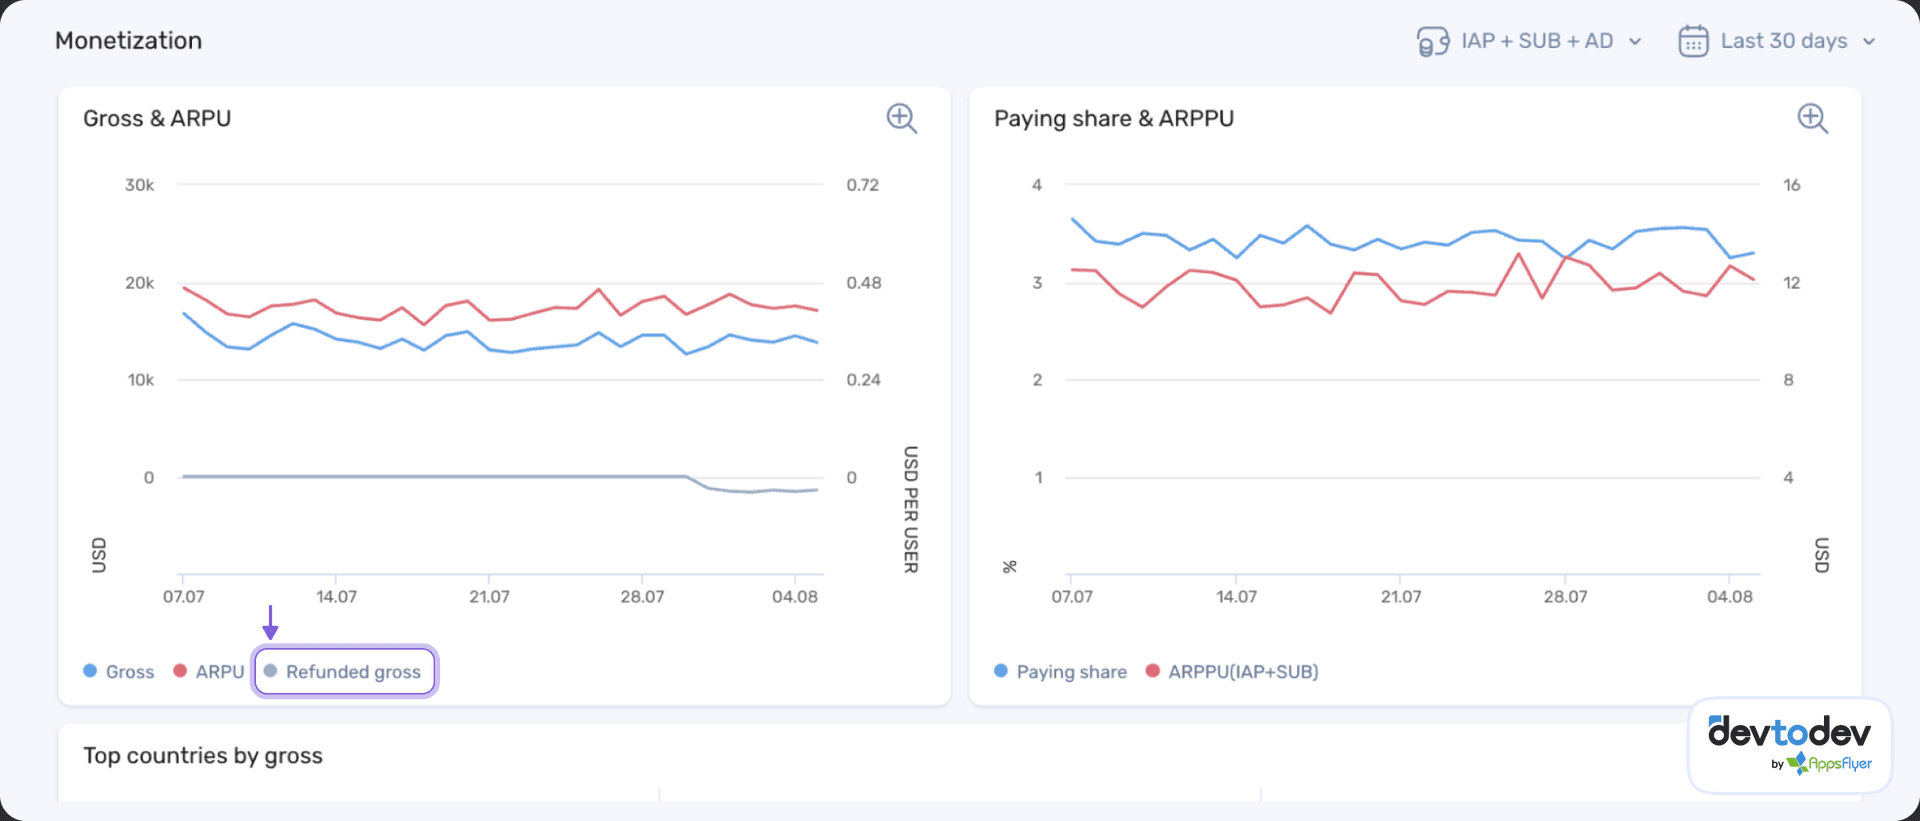
Screenshot: devtodev monetization dashboard — ARPPU grows from $22 on Day 1 to $52 among users installed 8–30 days ago. The longer users stay, the more they spend.
Segment by install recency. New payers and long-term payers behave differently. Users who installed 8–30 days ago typically show higher ARPPU than Day 1 buyers — they've had time to develop spending habits. If Day 1 ARPPU is disproportionately high, you may be converting impulse buyers who don't return.
Compare ARPPU across acquisition channels. Different channels produce different payer quality. A channel with high paying conversion but low ARPPU is bringing in users who buy once cheaply. A channel with lower conversion but higher ARPPU brings in users who spend more per transaction. Neither is automatically better — it depends on your LTV target.
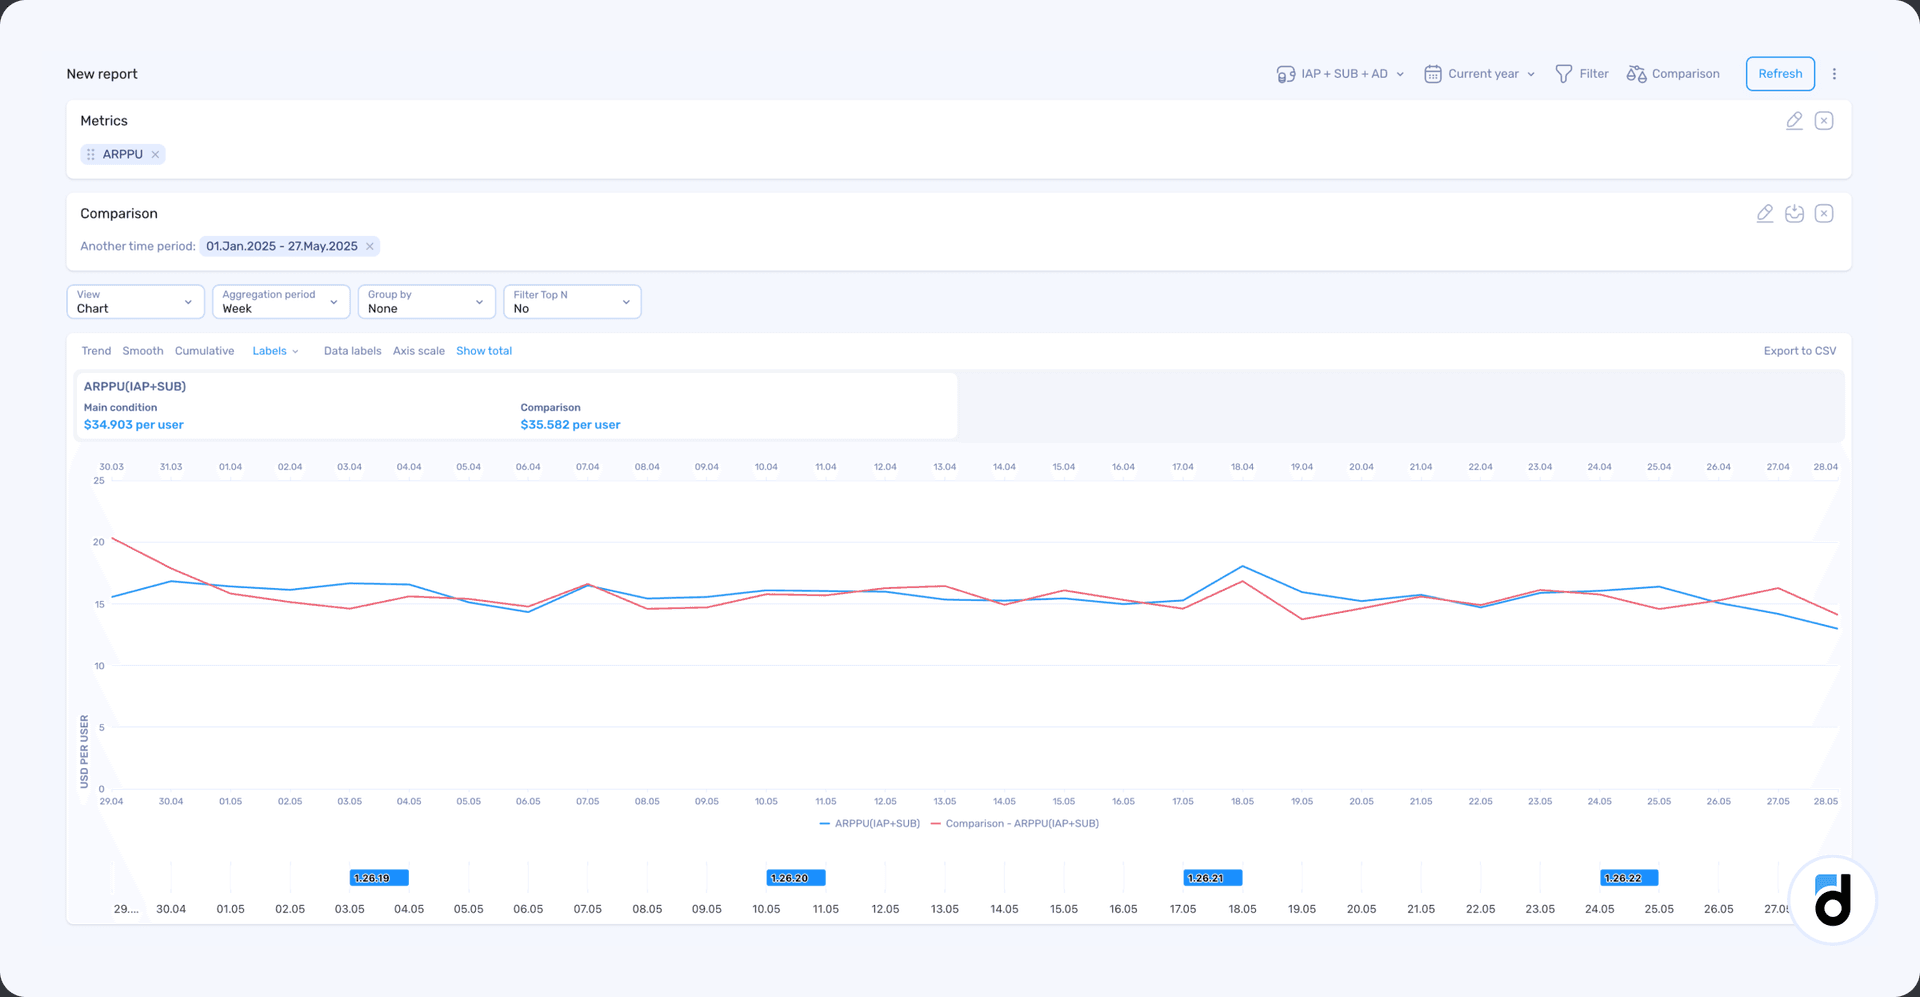
Screenshot: devtodev ARPPU report with period comparison — current period $34.90/user vs previous $35.58/user. A small but consistent decline worth investigating before it compounds.
Use ARPPU alongside ARPU. If ARPU is low but ARPPU is healthy, the problem is paying conversion, not how much payers spend. If ARPPU is declining while paying conversion holds, you're acquiring payers but they're spending less. Each diagnosis requires a different fix.
Learn more about ARPU and ARPPU — what's the difference →
Takeaways
- ARPPU = Total Revenue / Paying Users. It measures spending depth among users who converted, not the full active audience.
- ARPPU is always higher than ARPU. The gap reflects paying share — the smaller the paying base, the bigger the gap.
- ARPPU rises when price points, bundle design, or repeat purchase rates improve.
- Watch for declining ARPPU among long-term users — it often signals monetization pressure or payer burnout.
- Segment ARPPU by install recency and acquisition channel before drawing conclusions from the aggregate.
- Use ARPPU alongside ARPU: low ARPU + healthy ARPPU = conversion problem. Declining ARPPU + stable conversion = spend depth problem.
See your ARPPU by segment, channel, and install date — alongside paying conversion and ARPU. Explore devtodev →